 Esen K. Tütüncü
 Ramon Oliva
 Mel Slater
- 1Event Lab, Department of Clinical Psychology and Psychobiology, University of Barcelona, Barcelona, Spain
- 2Institute of Neurosciences of the University of Barcelona, University of Barcelona, Barcelona, Spain
Introduction: Virtual reality (VR) is typically considered a single-user experience. However, since the early 1990s, systems have been developed and studied that allow multiple people to simultaneously inhabit the same virtual space, with each person represented by a virtual body that responds to their movements in real time through head and body tracking. Corresponding to this technical capability the concepts of copresence (the sensation of being with others) and social presence (the psychological correlates of being and interacting with others) have been studied. One important contributor to the outcome of a virtual meeting may be the prior relationship between the individuals. Just as in real-world meetings, the dynamics of social interactions may differ depending on whether the participants are friends or strangers.
Methods: In this paper, we report on a study with 50 participants, each in one of 16 groups of 3–4 people and a moderator, where eight of the groups consisted of friends and the other groups consisted of strangers. Each participant had a virtual body that resembled themselves. They engaged in a moderator-led discussion lasting approximately 17 min. We collected data through questionnaires measuring presence and copresence, and carried out sentiment analysis of participant post-experience essays, analysis of speaking time and turn-taking, and social network analysis.
Results: We found that groups of friends reported higher copresence, showed more positive sentiment, and engaged more frequently in behaviors such as dyadic turn-taking than the groups of strangers.
Discussion: When designing and deploying immersive social encounters, prior relationships between participants should be considered where possible since these can significantly alter the dynamics of social interaction.
1 Introduction
Virtual reality (VR) is often regarded as a solitary experience, where a person uses a head-mounted display (HMD) to enter a virtual environment, becoming temporarily separated from social interaction with other people in the same physical space. However, from the very early days of VR, it was envisaged as providing a place where people could interact together in real time, sharing the same virtual space, with each person represented by a virtual body (or avatar). A system was implemented in the late 1980s, “reality built for two” (Blanchard et al., 1990), and the notion of “social presence” in VR was introduced (Heeter, 1992): “… if other people are in the virtual world, that is more evidence that the world exists. If they ignore you, you begin to question your own existence.” The representation of each person by an avatar is, therefore, an essential requirement—there must be some representation of others present (even if it is only through voice); otherwise, interaction would be impossible, although typically in VR, people are represented by virtual bodies that move based on tracking the participants’ actual movements. In this paper, we report on an experiment where participants had a virtual body that resembled themselves, and we study differences in responses to groups of friends meeting in a shared VR compared with groups of strangers.
In their review of the interaction between people in shared virtual spaces, Biocca and Harms (2002) invoked Erving Goffman’s remark that “copresence involved two moments: (1) when individuals sense that they can perceive others, and (2) when others can perceive them” (Goffman, 2008). In the review by Biocca and Harms (2002), copresence is described as a technological prerequisite for social presence, where “light reflecting inks, pixels, or marble moves from being a thing—matter—to being social, a representation of another, especially in cases such as robots, avatars, or agents, when technological representation is perceived as sentient.” In other words, something has to represent a person’s location and actions in the virtual space. However, “social presence” goes beyond only copresence; it involves not only the sense of being with another but also the psychological processes this entails—such as intuitively accessing the psychological state of the other, applying theory of mind, forming notions of their intentions—just as in normal everyday interactions with people (Biocca et al., 2003; Oh et al., 2018). Copresence may be considered the technological base, with social presence as the psychosocial superstructure. For example, avatar representations are a basic requirement for copresence, and it has also been found that they can lead to improved trust, presence, and task performance (Pan and Steed, 2017; Collingwoode-Williams et al., 2021). Copresence provides the technical foundation for the illusion of being in the same space as others, which also forms part of place illusion and the general concept of presence (Slater, 2009; Slater et al., 2022), whereas social presence highlights the psychological relationships between participants interacting in the same virtual space (Nowak, 2001).
Social presence can be considered the degree to which individuals feel the presence of others and experience the quality of interpersonal relationships during various forms of interaction (Short, 1976; Biocca and Harms, 2002). The concept of social presence is quite broad and was originally associated with computer-mediated communication prior to being adopted to describe interactions between people in VR. Social presence is a crucial element for making online interactions feel more genuine, engaging, and meaningful. Its importance and impact on communication were noted as early as 1984: Kiesler et al. (1984) argued that computer-mediated communications could increase participation, objectivity, and efficiency of groups and organizations. Social presence in VR involves a complex interplay of various factors, such as realistic avatars, synchronous communication, and shared activities and tasks.
The early example of a shared VR (Blanchard et al., 1990) was very expensive and not possible for more than two people at a time. As hardware and networking capabilities advanced, new systems like DIVE were developed, enabling large-scale multi-user interactions. Although avatars remained relatively simple (Carlsson and Hagsand, 1993; Frécon and Stenius, 1998), these systems could be used across various platforms, including CAVE-like environments, HMDs, and desktops (Steed et al., 2001). This led to new research into how technological factors may influence social presence. For example, the so-called “red–green–blue” studies had three remotely located strangers meet together in a virtual room, where each could see a simple, low-polygon virtual body avatar of the other two. One was colored red, one green, and one blue, but they were otherwise identical. Around the walls of the virtual room were small posters, each showing a fragment of a well-known saying or proverb. The task of the group was to work together in order to discover this saying—easier done through collaboration—since each person could stand by a different wall and call out what they could see. In these studies (Tromp et al., 1998; Steed et al., 1999; Slater et al., 2000), one participant joined the meeting through a head-mounted display and the other two through a desktop interface. After carrying out the task in VR, the participants then physically met in a similar-sized small room and repeated the task. The findings included that leadership in the virtual session was conferred by computational advantage. The participant with the HMD typically emerged as the leader in the VR session but typically not the leader in the real session. The session tended to evoke strong social reactions, such as some participants having feelings of being excluded and even paranoid thoughts when they saw the two others talking together. The avatars were very simple, made of cuboid blocks, with just black squares for eyes, but some participants felt that they were being “stared at” when others looked at them. Despite the simplicity of the avatars, participants had a strong attachment to them, considering it “rude” to intersect with the body of another, and obeyed social norms such as apologizing when they accidentally collided. When people met in person, there was often a sense of surprise or even shock upon realizing that the real person looked nothing like their avatar. Even these very simple avatars evoked strong social and psychological responses. Moreover, an avatar with greater photorealism did not help because its movements did not match expectations—if it looked real, it should behave in a realistic manner. This requirement for the alignment of visual fidelity and behavior was later also found to apply to eye gaze (Garau et al., 2003).
Accurately representing eye movements was found to be an important factor in enhancing social presence. Steptoe et al. (2008), Steptoe et al. (2009), and Steptoe et al. (2010) found that an accurate representation of gaze was associated with appropriate attention and flow of the conversation, enhanced mutual awareness, and superior task performance compared to video meetings. Gaze was either based on eye tracking, simulated through a model, or static, and tracked gaze was rated as superior. In general, accurately mapping eye gaze movements onto avatars in an immersive setting (a CAVE) turned it into a general social resource and improved the detection of lying. Plopski et al. (2022) provided a survey of the importance of gaze direction and eye tracking in shared virtual environments.
We have mentioned the necessity for consistency between visual fidelity and behavior above. However, how important is visual realism in itself? Zibrek and McDonnell (2019) found that greater avatar realism led to greater presence as “being there” and also greater social presence, compared to lesser realism. McVeigh–Schultz et al. (2018) highlighted how the design of avatars and virtual environments can significantly impact the quality of social interactions. They argued that more realistic and expressive avatars lead to more engaging and meaningful interactions. In another study, Waltemate et al. (2018) demonstrated that full-body avatars that accurately follow the participants’ movements can enhance the sense of presence and social connection in VR. In contrast to this, Herrera et al. (2020) found that participants embodied just with a floating head and hands experienced greater social presence, self-presence, and interpersonal attraction than those embodied with a full-bodied avatar with mapped hands. Participants in the floating-hand condition reported greater interpersonal attraction, self-presence, and social presence than those in the inferred-arm condition. The level of behavioral realism in the avatars influenced participants’ nonverbal behavior, with those in the static avatar condition showing significantly fewer head and hand rotations compared to participants in the other conditions. However, it is important to note that the differences observed in this study were characterized by low effect sizes, suggesting that replication of this result is needed. This consideration is crucial when evaluating the impact of avatar design on user experience in virtual environments as the subtle variations in embodiment may not have robust effects across different settings or populations.
Oh et al. (2018) explored various determinants of social presence in remote interactions, pointing out that a combination of high-quality photorealistic representation and consistent behavioral realism significantly contributes to the sense of connection. The proximity between virtual participants emerged as another influential factor, emphasizing that closer virtual distances enhance social presence (Li et al., 2021). Social identity theory posits that individuals categorize themselves and others into social groups, forming in-group and out-group classifications which influence intergroup behavior (Tajfel, 1979). When applied in VR, prior acquaintance gives the participant a feeling of shared identity, promoting a sense of belonging and cooperation within the virtual space and ease of communication with the feeling of familiarity.
We explore this in the current experiment, which features participants using look-alike self-avatars, engaging in full upper-body gestures, and seated closely together within the VR. The purpose of this study was to investigate the role of prior acquaintance in shaping the dynamics of social interactions within VR. The research aimed to determine how pre-existing social bonds influence the perception and quality of VR interactions, along with the behavior of the individuals involved, compared to encounters between strangers. We consider issues such as presence and copresence, assessing participants’ responses to the discussion using questionnaires. We then consider a rich set of behavioral measures that provide insights into different aspects of social presence—specifically, how closely the interactions resembled those expected in real-life encounters and how they differed between groups in which participants already knew one another versus those composed of strangers. Additionally, we considered whether groups with prior connections would have more positive interaction outcomes, as shown by higher levels of sentiment about their discussions. This fits into previous work that has compared how strangers and friends differ in their interaction behavior within shared VR (Spante et al., 2003; Steed et al., 2003; Karaosmanoglu et al., 2023), an issue that we take up in the Discussion section.
2 Materials and methods
2.1 Experimental design
In this between-group experimental design, participants were assigned to one of two conditions based on their pre-existing relationships. Those in the friends condition interacted with prior acquaintances and were recruited in groups with established social connections, such as classmates or close friends. The strangers condition consisted of participants who had no prior acquaintance with one another. They were individually recruited and randomly grouped.
2.2 Characteristics of the sample
The study included 50 participants: 26 interacted with strangers, and 24 interacted with friends. There were 16 groups, all of which included three participants, except for two groups that included four participants. Eight of the groups consisted of friends, and the other eight consisted of strangers. In addition to the recruited participants, a moderator (the experimenter) attended all sessions.
Gender distribution was as follows: 33 female participants (16 strangers and 17 friends), 16 male participants (10 strangers and 6 friends), and 1 non-binary participant (1 friend). The mean (SD) age was 24.9 (6.84) for strangers, 25.4 (5.87) for friends, and 25.1 (6.33) overall. In terms of occupation, four participants were part-time employed, nine were full-time employed, one was unemployed, one was self-employed, and 34 were students.
2.3 Ethics
The experiment was approved by the Comisió de Bioética de la Universitat de Barcelona, and procedures were carried out in conformance with the approved procedures. Participants provided written and informed consent and were informed that they could leave the experiment at any time without providing reasons or losing benefits. They were paid 10 euros as compensation for participating in the experiment.
2.4 Procedures
The experiment took place at the University of Barcelona, Mundet Campus. It consisted of one session. On arrival, participants were placed in separate booths, ensuring that participants in the strangers condition did not see each other before the experiment. Information on the experiment was provided verbally to each participant by the experimenter and also explained in the preamble part of a Qualtrics questionnaire (www.qualtrics.com). After reading the information sheet, participants were informed about their right to withdraw from the experiment at any time without providing reasons. They signed a consent form before continuing.
2.5 Scenario
Each trial consisted of a moderator who chaired a meeting of three or four experimental participants. The virtual environment portrayed a meeting room with a round table and a chair for each participant and the moderator (Figure 1). Once the experimental session started, the moderator led a discussion on each of the following topics of interest:
• Has social media caused more negative or positive effects on health?
• Does personal appearance affect how people respond to us?
• Are techniques such as mindfulness, yoga, and meditation really beneficial, or are people being deluded?
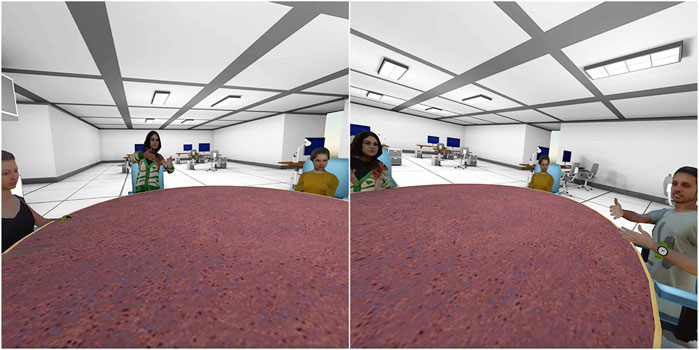
Figure 1. Scenario showing successive moments in time of a discussion with four participants, where each has a body that looks like themselves. These images have been brightened for the purposes of a clearer display.
After posing the question, the moderator did not intervene in the flow of the conversation unless he or she was asked directly by one of the participants to do so. The discussions were neither recorded nor transcribed as our primary focus was on their dynamics rather than their content. The mean ± SD duration of the discussions is 16.8 ± 5.82 min.
2.6 Materials
For this experiment, the Pico Neo 2 standalone HMD was used. The headset’s display resolution is 2048 × 2160 per eye, the field of view is 101°, and the refresh rate is 75 Hz. The controllers of the headset were used for interaction. Each has 6 DoF optical positioning and linear resonant actuators. Skullcandy Riff Wireless Headphones, featuring stereo sound and active noise cancellation, were used for audio. This setup was identical for all participants and the moderator.
The software program used to enable the shared virtual meeting was VR United (Oliva et al., 2023), a shared virtual environment application developed using the QuickVR library (Oliva et al., 2022), built on the Unity engine. We used a pipeline to generate a lifelike 3D avatar of an individual only from a frontal RGB image (Beacco et al., 2023). This process involves using deep learning techniques to extract pose, shape, and semantic details from the input image. Using this approach, each avatar was generated within approximately 30 min.
2.7 Response variables
The study included five types of response variables: ordinal scores from questionnaire responses on a Likert scale from 1 to 7, essays written by participants and their corresponding sentiment analysis scores, continuous variables, proportions (continuous variables restricted to the range 0–1), and counts (integers such as 0, 1, and 2). Descriptive analyses for ordinal variables used medians and interquartile ranges, while means, standard errors, and bar charts were used for continuous variables, proportions, and counts.
2.7.1 Questionnaires
Participants completed the following questionnaires: a pre-VR questionnaire collected demographic and background information. After the VR discussion a presence questionnaire adapted from Slater and Steed (2000) was administered, which has been used in multiple previous studies, along with a social questionnaire assessing perceptions of the discussion experience. The social questionnaire was designed to evaluate participants’ engagement, comfort, and perceptions of the virtual interaction, and it consisted of six Likert-scale questions, each rated from 1 (strongly disagree) to 7 (strongly agree). The full questionnaires are shown in Table 1.
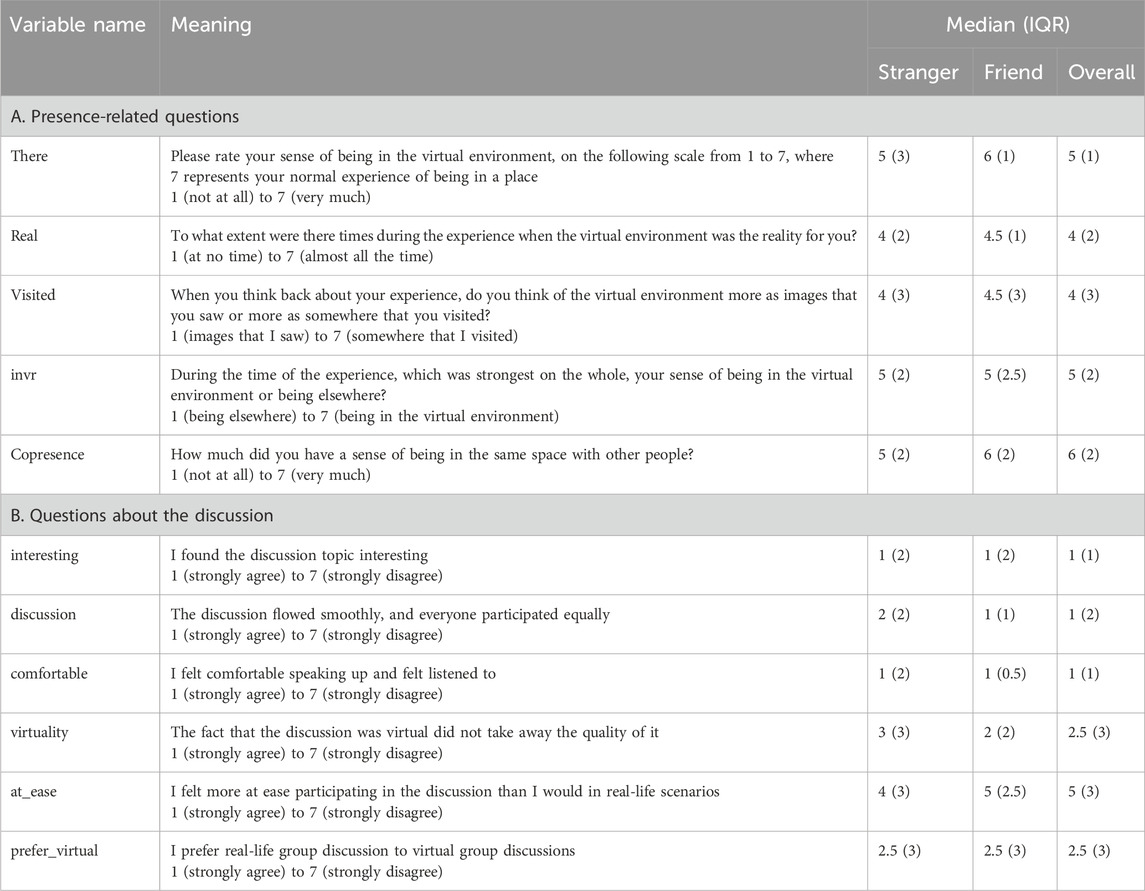
Table 1. Median and interquartile ranges of the response variables by condition and overall.
After completing these questionnaires, the participants were asked to write an essay reflecting on their experience. The prompt instructed them to write between 150 and 500 words about their personal experience, the quality of the technology, and how much they would like to use this type of system in the future. They were also encouraged to compare the experience to a traditional face-to-face conversation.
2.7.2 Sentiment analysis of the essays
We used the Hugging Face system with the BERT model to analyze the essays (Rothman, 2021). This model is intended for direct use as a sentiment analysis model for product reviews in multiple languages. This estimates sentiment with a score (“star”) between 1 (lowest) and 5 (highest) sentiment. The essays were written in English, Spanish, Italian, and Turkish. For this purpose, they were all translated into English.
In this model, “high sentiment” scores indicate more positive emotions or attitudes (e.g., happy, satisfied, hopeful, and enthusiastic), whereas low scores point to more negative emotions or attitudes (e.g., sad, frustrated, angry, and disappointed). Hence, higher sentiment scores are more likely when the comments written by participants contain language reflecting positive emotions or a constructive outlook. A lower sentiment score is more likely to reflect more negative statements or criticism.
2.7.3 Speaking times and turn-taking
For each group, the start and end times of each speaker were recorded, including the moderator. From this, a number of statistics were computed that provide a characterization of what happened in each group (in this structural sense) and whether there were any important differences between the two groups in this regard. We consider each set of statistics in turn.
Table 2 shows the response variables based on talking time during the VR discussions. In addition, from the turn-taking, we can compute new variables referred to as dyads and circles. Suppose there are three participants A, B, and C and the speaking sequence in the discussion follows the pattern ABABAB…—these constitute dyads. Similarly, a sequence like ABCABCABC… constitutes circles. We can compute the number in each case and compare them between the two groups.
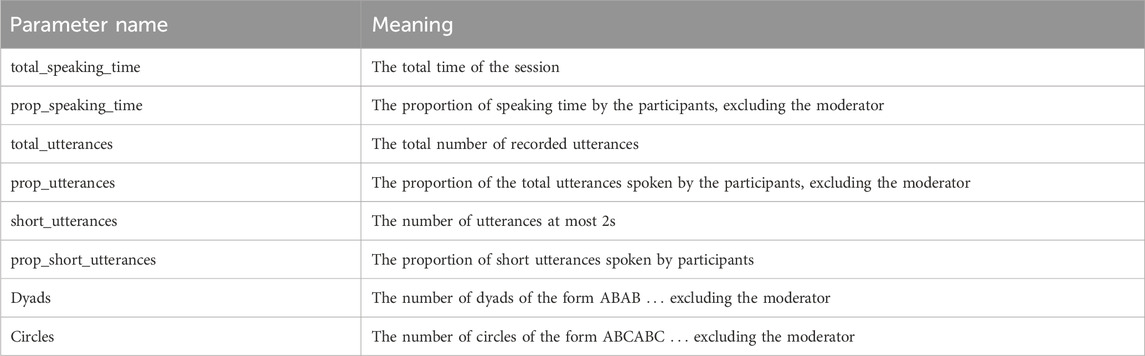
Table 2. Speaking time measures.
2.7.4 Social network analysis
Social network analysis (Wasserman and Faust, 1994) is a method for analysis of the structure of social relationships—in this case, conversational structures. It is a tool for examining the interactions within a group, including conversational dynamics. It treats a conversation as a directed graph, where nodes represent participants and edges represent speaking turns.
More specifically, each participant is represented as a node. A directed edge is defined from participant A to participant B if A speaks, followed by B. The frequency of such turn-taking is reflected in the weights of the edges. A higher frequency of turns between two participants is represented by a higher weight on the directed edge connecting them, i.e., when the same transitions between speakers occur multiple times, the corresponding edge would be assigned a weight equal to the number of such transitions. This weighting reflects the frequency of turn-passing between participants.
Social networks were constructed using the “igraph” package in R (https://igraph.org/r/pdf/1.2.6/igraph.pdf) (Csárdi et al., 2025). The variables constructed by the social network analysis are shown in Table 3.
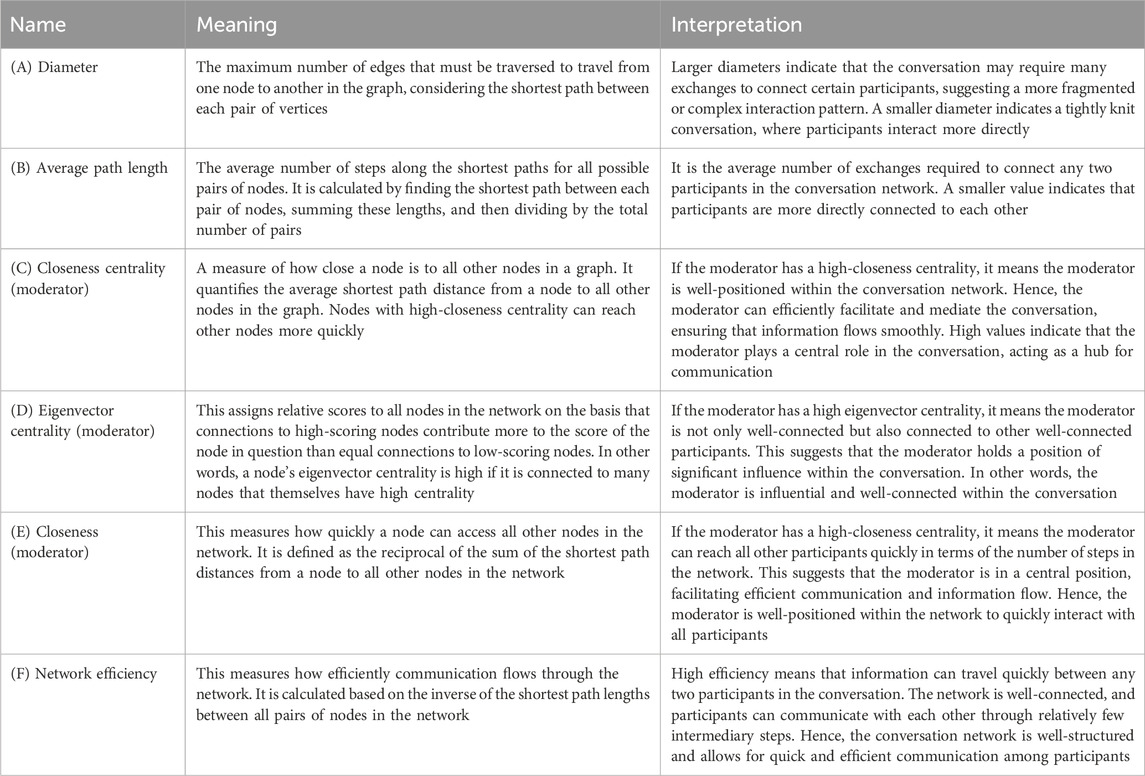
Table 3. Measures derived from the directed graphs produced by social network analysis.
2.8 Statistical methods
2.8.1 Overall method
Each response variable is first examined descriptively (with summary statistics and graphs) and then analyzed formally in order to determine whether apparent findings from the descriptive analysis can be generalized to the population from which the sample was drawn.
The formal analysis uses Bayesian methods throughout. This involves defining a model for the response variable in relation to the experimental condition and other explanatory variables and selecting a prior distribution for each model parameter. The prior distributions are chosen to be weakly informative (Lemoine, 2019) with wide support—with high variance so that the data will dominate the posterior distributions.
We used the Stan probabilistic programming language (Stan Development Team, 2019; Carpenter et al., 2017). This estimates the posterior distributions through Monte Carlo methods. The computation was conducted with four independent simulations (chains) and 8,000 iterations. The four chains converged and mixed appropriately. Stan was run within RStudio (https://posit.co/download/rstudio-desktop/), and the RStan (https://mc-stan.org) implementation was used to compute the posterior distributions of the parameters.
We now consider the model for each type of response variable.
2.8.2 Ordinal scores (questionnaires and sentiment stars) for analysis of results over the individuals
The purpose is to model how each response variable might be influenced by the condition (strangers and friends), including other characteristics such as age and sex. Additionally, it is vital to consider the group structure, in case different groups have different effects. The term “linear predictor” refers to the component of the model that shows the linear combination of independent (the condition) and explanatory variables that influence the response. The linear predictors are identical to those in equivalent models underlying classical statistical approaches, such as analysis of variance.
The linear predictor for each questionnaire (ordinal) response variable is of the following form Equation 1:
More formally, let
Since the response variables are ordinal, we use ordered logistic regression, as shown in Equation 4:
Here,
We are primarily interested in
The prior distributions of
2.8.3 Continuous variables for analysis of results over the groups
These response variables are at the group level, so the covariates age and sex do not apply. This is the same for the response variables considered in the following sections. The continuous variables are modeled either with a normal or a Student’s t-distribution. The latter was used when the data indicated a wider spread or with more outliers present in the data since the Student’s t-distribution can adapt to that. The linear predictor is shown in Equations 5, 6:
If
In the case of the Student’s t-distribution,
which has degrees of freedom
A Student’s t-distribution was used because it is like the normal (symmetrical about the median) but smaller degrees of freedom result in greater spread of the distribution (independently of the scale parameter). However, for degrees of freedom of approximately 30 or more, the Student’s t-distribution is indistinguishable from the normal distribution. It has the advantage that it allows for outliers through adaptation via the degrees of freedom.
The prior distributions are
2.8.4 Proportions for analysis of results over the groups
These are modeled with a Beta distribution. A Beta distribution variable is restricted to the range [0,1], and it has two parameters
The linear predictor is same as shown in Equation 1, but the mean proportion, denoted as θ, is related to the linear predictor, as shown in Equation 8:
This is the inverse logit function and constrains
Therefore, the mean of the distribution in Equation 9 is
2.8.5 Count variables for analysis of results over the groups
A count variable is typically modeled with the Poisson distribution, and the standard log-linear model is
where
and the relationship between the mean and the condition is given in Equation 10.
2.8.6 Comment
The above is quite different from the common way of presenting statistical results, for example, typically in the form “t = 3.2 and P < 0.05.” In this study, we explicitly set out the models and assumptions. The Bayesian approach also has the distinct advantage that all response variables can be treated simultaneously in one model so that an arbitrary number of probability inferences can be drawn. If we had used classical statistics, then each additional test would have reduced the validity of the significance levels (this is the problem of “multiple comparisons,” usually addressed using ad hoc methods such as Bonferroni corrections). Moreover, instead of testing null hypotheses, the models result in posterior distributions for the parameters of interest (
3 Results
3.1 Questionnaire responses
The results for presence and discussion-related questions are summarized in Table 1. It can be observed that there was a high degree of presence (there) and copresence, both possibly greater for the friends condition. The other presence variables are neutral (scores at the mid-points of the scale). Overall, people found the discussion interesting, smooth, and comfortable, the virtual setting did not diminish the quality, but they preferred real-life discussions.
Figure 2A shows the box plots for the presence variables, highlighting the greater values for there and copresence (Table 1) in the case of friends. Figure 2B shows the box plots for the responses to the discussion itself. Note that these scales are reversed, where lower values indicate greater agreement with the question statement. Some scores indicate a strong preference for the experience (interesting, discussion, and comfortable). However, for virtuality variable, the entire interquartile range (IQR) for the friends group is lower than the median of the strangers group, indicating that participants in the friends condition did not feel that the VR negatively affected the quality of the discussion. However, those in the strangers group may have felt more at ease.
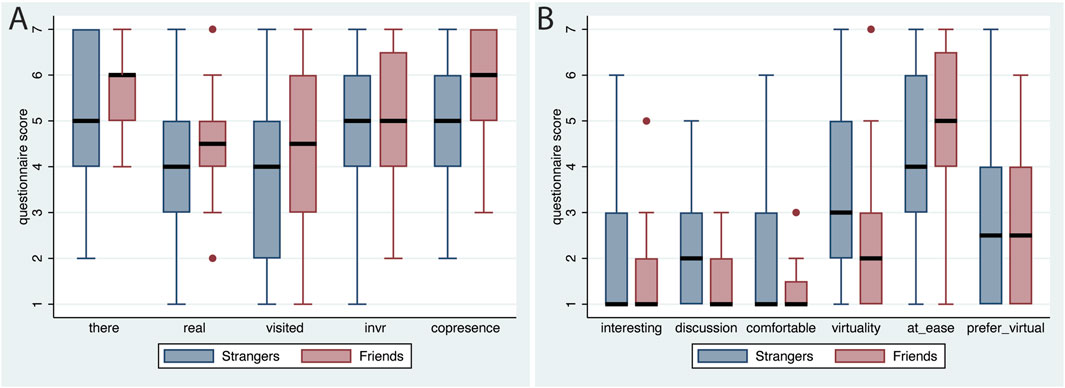
Figure 2. Box plots for the questionnaire variables. (A) Questions related to presence and (B) questions about the experience of the discussion. The thick horizontal lines represent the medians, and the boxes represent the interquartile ranges (IQRs). The whiskers range from max (min value, lower quartile − 1.5×IQR) to min (max value, upper quartiles +1.5×IQR).
3.2 Sentiment analysis of the essays
The mean ±SD of words in essays was 152 ± 51.4 for the strangers group and 178 ± 76.7 for the friends group. The overall mean for both groups combined was 165 ± 64.8 (see Table 4). From the distribution of sentiment scores by condition, it is clear that the overwhelming sentiment was high for both groups (83% overall had scores of at least 4, Table 5). However, 73% of those in the strangers group scored at least 4 compared with 84% of those in the friends group. Moreover, 27% of the strangers group had scores of 3 or less compared with only 4% of the friends group. A preliminary conclusion would be that although the sentiment is highly positive, there is more positive sentiment for those in the friends group and more negative sentiment amongst those in the strangers group. However, this does not take into account the group structure of the sample.
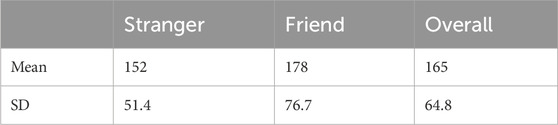
Table 4. Mean and SD of the number of words in the essays by condition.
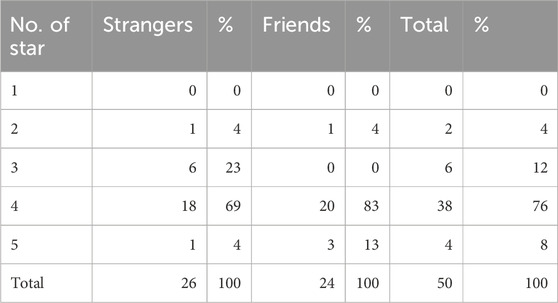
Table 5. Sentiment analysis results by condition.
Table 6 shows summaries of the posterior distributions of the presence and responses to the discussion variables and the sentiment scores (stars). Note that the 95% credible intervals are much narrower than the prior intervals (which are −20 to 20 for all
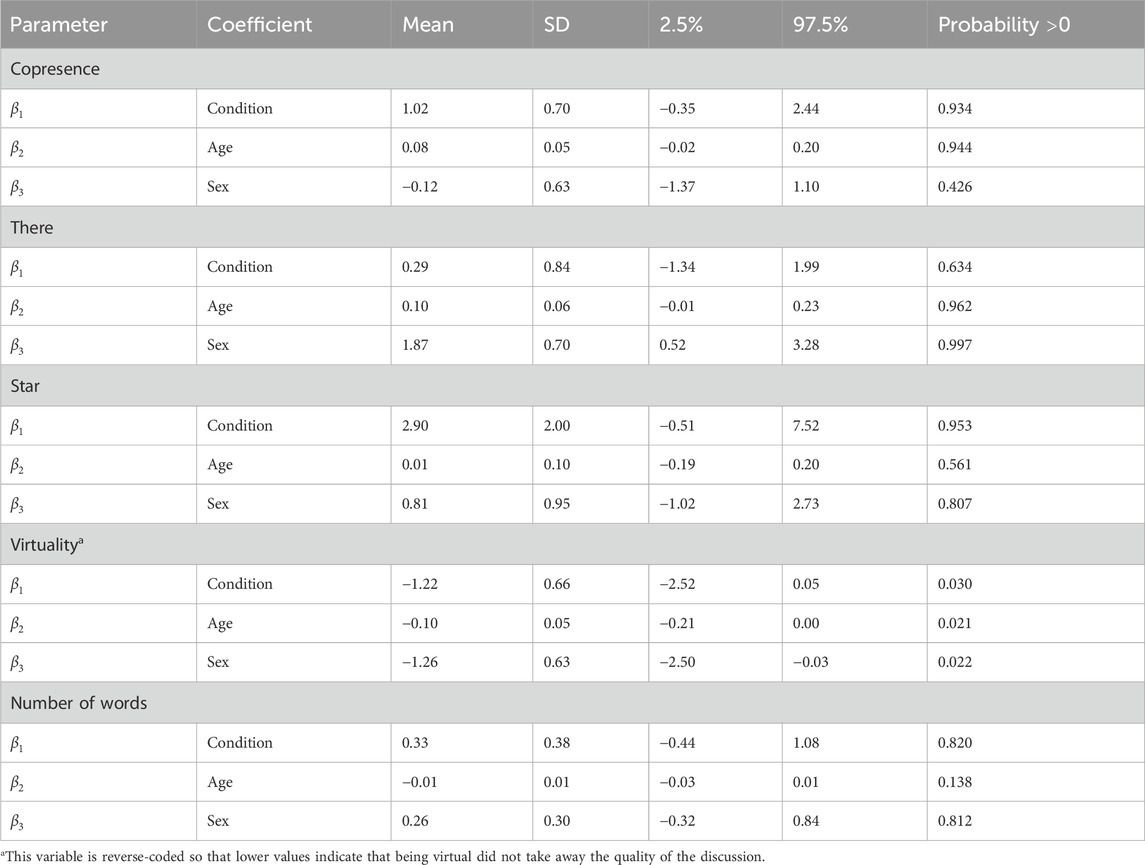
Table 6. Summary of the posterior distributions of the parameters, showing the means, standard deviations, 95% credible intervals, and the probability of the parameter being positive. All variables were analyzed using the model in Equations 1–4, except for the number of words, which was standardized to have mean 0 and variance 1 and used the normal distribution model presented in Equation 7.
From Table 6, we can infer the following:
copresence: there is a high probability (probability = 0.934) that the friends condition has a positive influence on copresence. Moreover, greater age is associated with more copresence, but sex has no influence.
there: shows little evidence of an effect of condition (probability = 0.634), but the illusion of being there was likely greater for female participants (probability = 0.997), and greater age is associated with greater illusions of presence.
sentiment (stars): there is a high probability that the friends condition results in higher sentiment (probability = 0.953), and possibly there is an influence of being a female participant (probability = 0.807).
virtuality: there is a high probability that the friends condition resulted in lower scores on virtuality (probability = 1–0.030 = 0.970), meaning that the quality of the conversation was high despite being virtual.
number of words: there is some evidence that the friends group wrote longer essays than the strangers group (probability = 0.820) and that women wrote more (probability = 0.812).
3.3 Speaking data and turn-taking
3.3.1 Speaking times
In this study, we considered the total speaking time, the speaking time of the moderator, and the speaking time of the participants (these last two provide the same information since they sum to the total speaking time). Figures 3A,B show the total speaking times and the proportion of time participants spoke, excluding the moderator, both of which were greater in the friends than in the strangers groups.
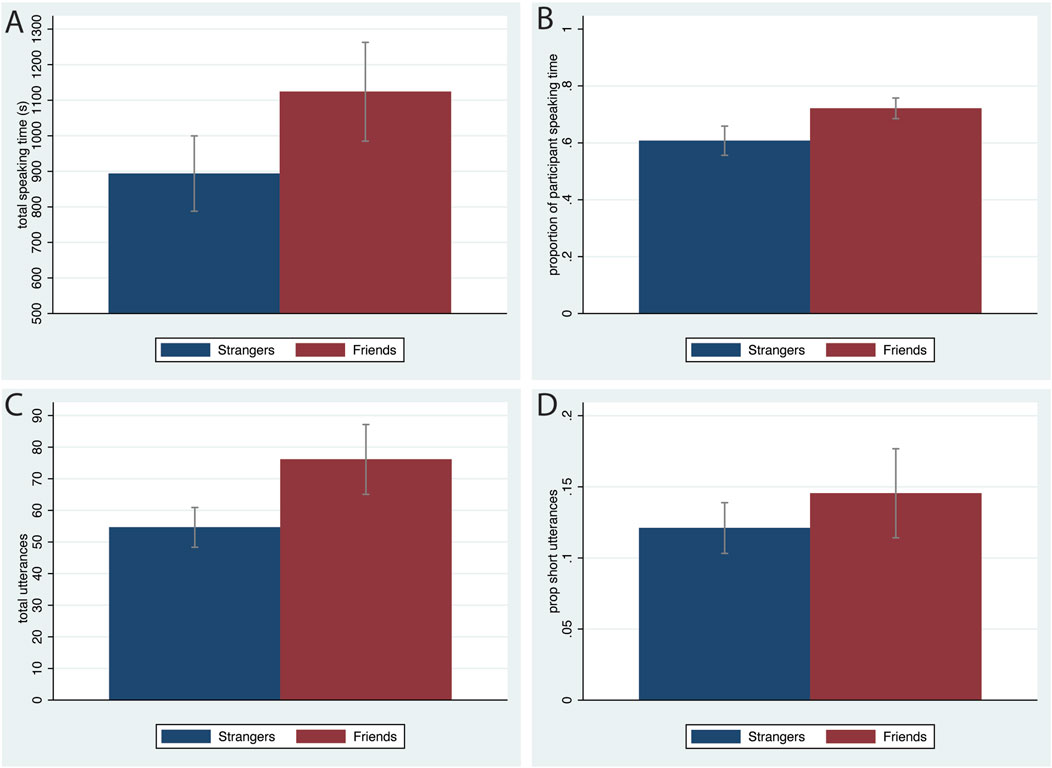
Figure 3. Bar charts for statistics of speaking, showing the means and standard errors by condition. (A) Total speaking time of participants (s). (B) Proportion of time that participants spoke. (C) Total number of utterances. (D) Proportion of short utterances (<2s).
3.3.2 Number of utterances
Figures 3C,D show the number of utterances and the proportion of short utterances. In the friends group, the overall number of utterances was higher, and the proportion of short utterances was also higher in the friends group.
3.3.3 Turn-taking—dyads and circles
Figure 4 shows the comparison between the strangers and friends groups for the dyads and circular structures. In both cases, the number of dyadic and circular conversations was higher for the friends group than for the strangers group.
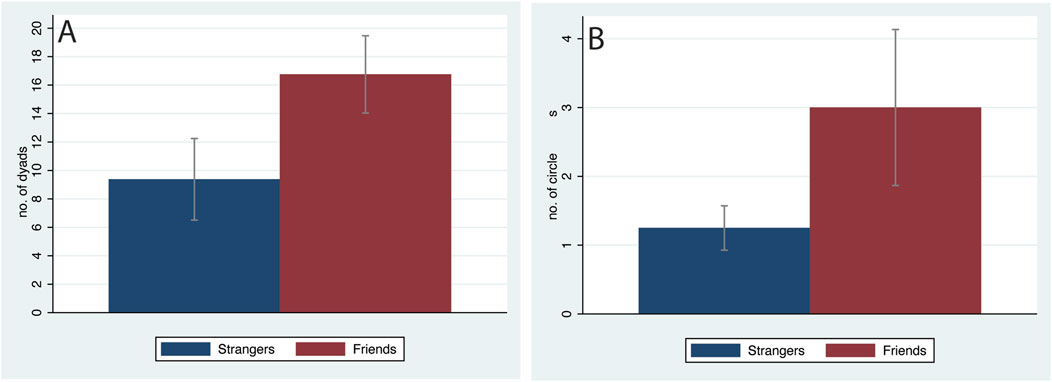
Figure 4. Box plots showing the means and standard errors of turn-taking among the participants; (A) dyads and (B) circles.
3.3.4 Social network analysis
Two examples of the 16 social networks computed in this study are presented in Figure 5. These illustrate the networks displayed using the Kamada–Kawai layout (Kamada and Kawai, 1989), where nodes that interact more frequently appear closer together and interactions are shown with the arrows. Figure 5A shows that the moderator interacts more with participants 1 and 2, whereas Figure 5B shows more interactions with participant 3, who then interacts with participants 1 and 2. We now consider six measures that can be derived from the social network graphs, as shown in Table 3.
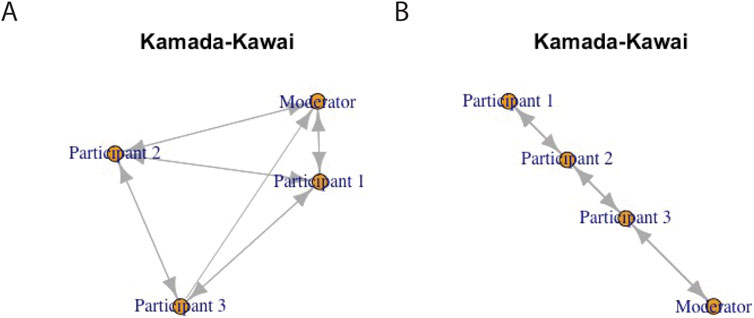
Figure 5. Examples of social network graphs using the Kamada–Kawai method of plotting. (A) The moderator interacts more with participants 1 and 2, who, in turn, interact with participant 3. (B) The moderator interacts with participant 3, resulting in exchanges between the three participants.
Figure 6 shows the bar charts for the measures indicated in Table 3. The diameter (A) indicates that participants in the friends group had more tightly knit conversations. A smaller average path length (B) indicates that participants were more directly connected to each other. The moderator played a more central role in the conversations among the friends groups (C). However, the eigenvalue (D) indicates that among the friends groups, the moderator had less influence. For (E) and (F), there appears to be no difference between the two groups.
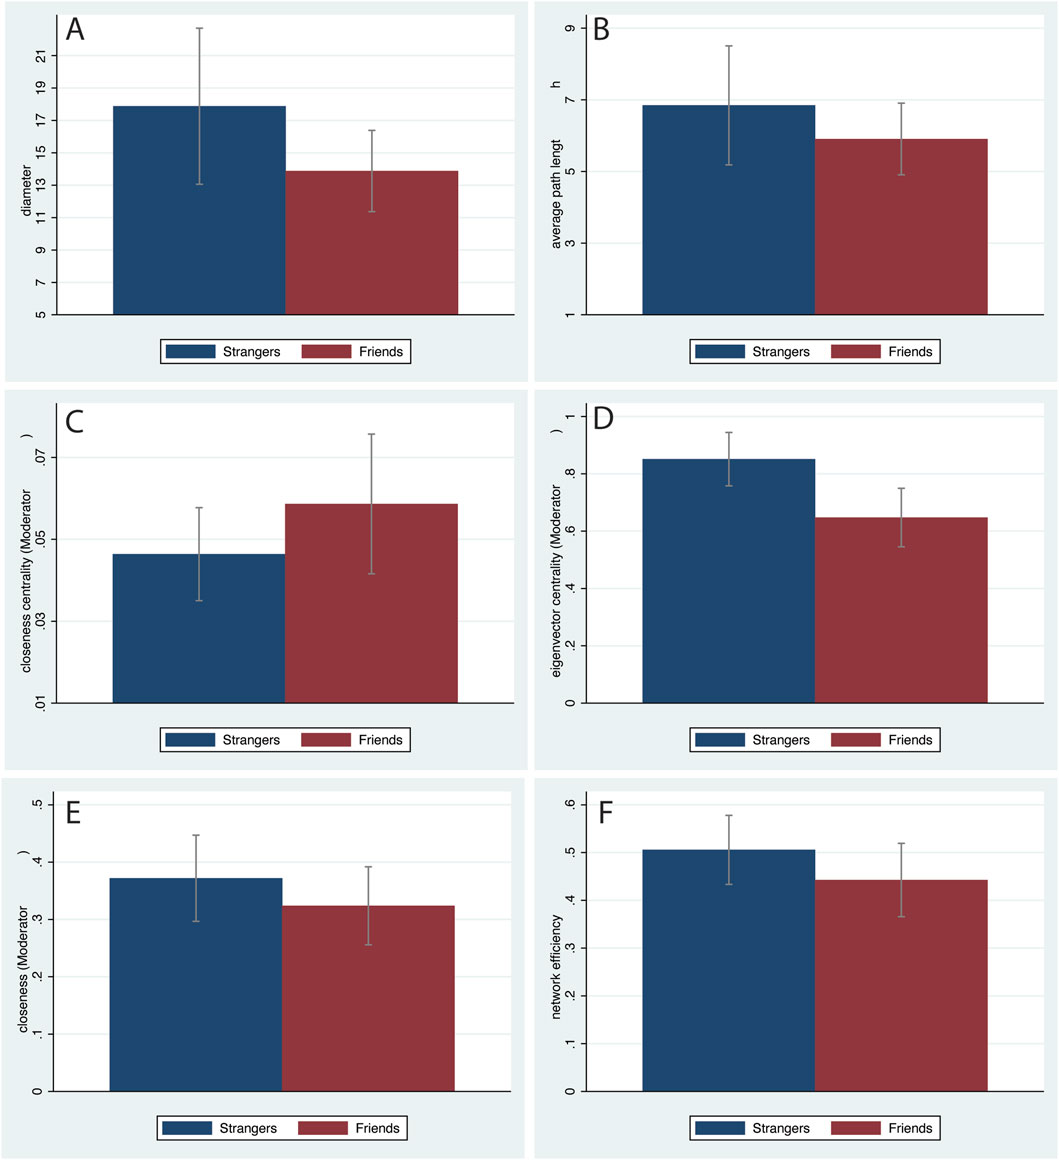
Figure 6. Bar charts for the directed graph-based measures. (A) Diameter, (B) average path length, (C) closeness centrality (moderator), (D) eigenvector centrality (moderator), (E) closeness, and (F) network efficiency.
Table 7 shows the summaries of the posterior distributions of the speaking and social network variables. Since the sample size is small in this case (n = 16 groups), we only consider results with probabilities of at least 0.9.
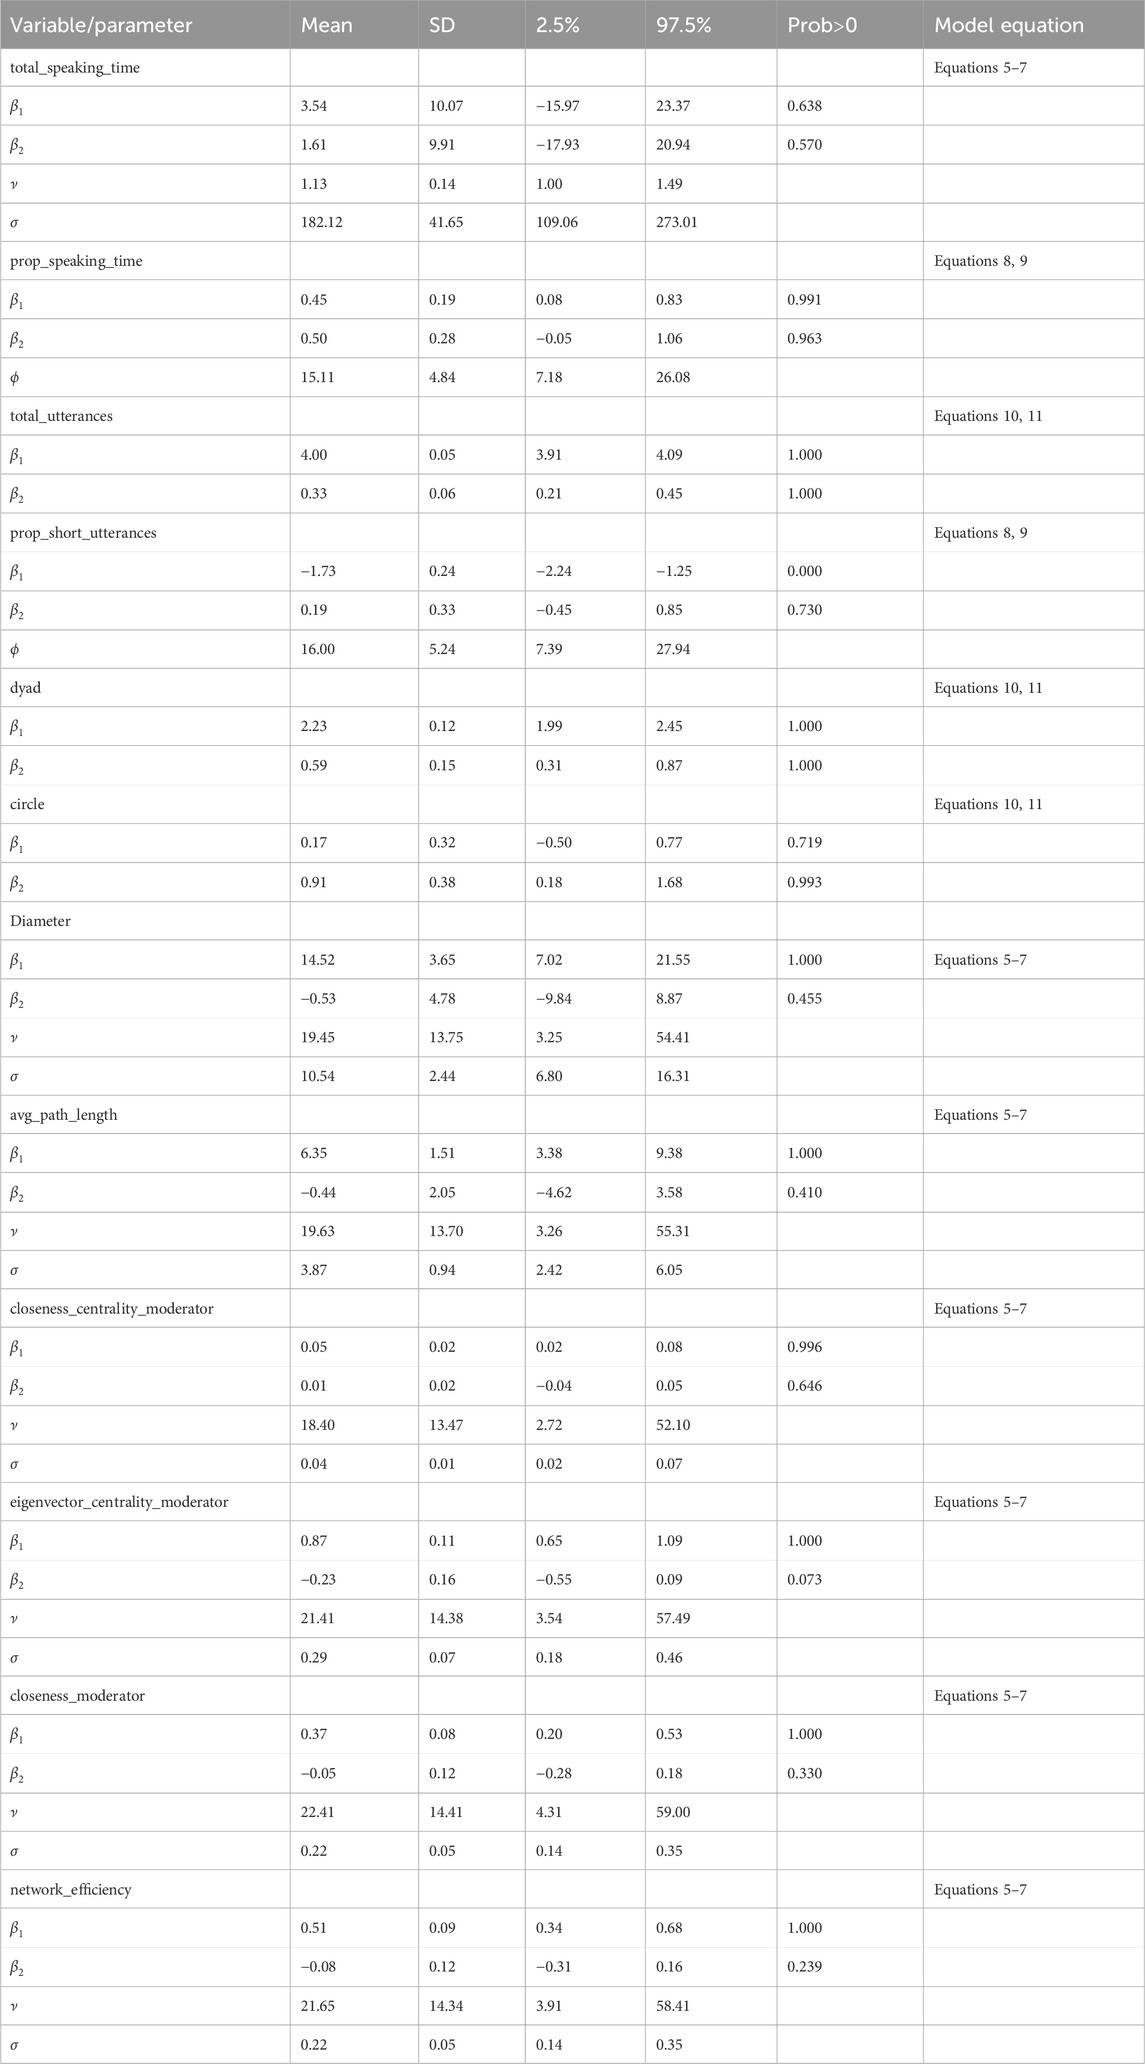
Table 7. Summary of posterior distributions of the parameters showing their mean, standard deviation, 95% credible interval, and the posterior probability that the parameter is positive. The meaning of the variables is given in Table 3, and the statistical model for each variable is shown by the equation numbers in the last column, and all Equations 5–7 used the Student’s t-distribution.
We can observe the following:
prop_speaking_time occupied by the participants has a probability of 0.963 of being positive, indicating that this was greater in the friends condition than in the strangers condition, supporting Figure 3B.
total_utterances was greater in the friends condition (probability = 1.000), indicating that friends talk more often than strangers, supporting Figure 4A.
dyads (probability = 1.000) and circles (probability = 0.993) both indicate that they are greater in friends condition than in the strangers condition.
eigenvector_centrality moderator has probability = 1–0.073 = 0.927 of being negative, indicating that this is less for the friends condition than for the strangers condition. In other words, this suggests that the moderator did not hold an influential position within the conversation in the friends condition compared to the strangers condition.
4 Discussion
In this study, small groups met in VR to discuss various topics introduced by a moderator. The groups consisted either of friends or strangers, where each person was represented by a look-alike avatar. Across a wide range of variables, we have found salient differences between the strangers and friends groups. As measured using questionnaires, copresence is greater for the friends group than for the strangers group (Table 6). Moreover, the quality of the discussion was not diminished by it taking place in VR for participants in the friends condition compared to those in the strangers condition (virtuality) (Table 6). The presence variables (there, real, visited, and invr) do not seem different between strangers and friends. This is not surprising as we have argued elsewhere that the sense of ‘being there’ is reliant on sensorimotor contingencies for perception, consistent with those for perception in reality (Slater, 2009; Küçüktütüncü, 2025). In other words, how we use our body to perceive in VR—turning the head, bending down to look, and moving closer to something to hear it better—corresponds to how we do so in reality, based on real-time head tracking. These are the same for both the strangers and friends groups, so we would not expect any difference.
There is a high probability that copresence is greater for friends than for strangers (>0.9), but the difference in scores is not very great (Table 2; Figure 2A). Since we argued in the Introduction section that copresence is the technical base for social presence (requiring presence and an avatar representation), these are also the same for the friends and strangers groups. Hence, although copresence is statistically greater for the friends group, it is also high for the strangers group, suggesting that the particular question used (Table 2) is not precise enough to differentiate between copresence and social presence. For each of the two groups, the technology portrayed representations of people who spoke and moved more or less naturally. In the case of friends, there was not only this, but also the recognition of the other people—their appearance, voices, and manners of moving. This provided, for each person in the friends group, additional cues to being with others in a social interaction that was more likely to reflect a physical meeting. The friends group would have expectations about how their friends would behave, whereas the strangers group would not have these prior expectations. A further clue to this is the greater extent to which the friends did not find the discussion diminished due to it taking place in VR. We can speculate that each participant had an internal model based on prior experience of how their friends would look, speak, and move, and although the VR might be a lower-quality representation of this, it was enhanced by their internal mental models. People perceived what they expected to perceive in relation to the behaviors of their friends based on cues from the sensory data provided by the VR.
Additionally, based on the sentiment analysis, the friends group had a greater frequency of high sentiment scores and a much lower frequency of small sentiment scores than the strangers group. They even tended to write longer essays describing their experience. Although sentiment was quite high overall (Table 4), the friends group enjoyed the session more. This again makes sense precisely because they were speaking with friends. As has also been shown in prior research, participants carried over their experiences and ways of interacting from real life into the VR (Moustafa and Steed, 2018).
Those in the friends group spoke a greater proportion of the time, said more words, tended to speak in structured ways with dyads and circles, and the moderator had less of an influential position among the friends group. This further indicates a greater degree of social presence, with those in the friends group acting as friends and the strangers group acting more like strangers (less likely to speak, relying more on the moderator).
The study of how strangers and friends interact in shared VR has a long history. Steed et al. (2003) studied five pairs of people who met together for more than 3 hours in networked CAVEs. Each group consisted either of pairs of friends or strangers. They had to carry out a number of tasks together, such as solving a Rubik’s cube. The main difference between the two groups was that strangers felt a lower awareness of their partner’s intentions than those in the friends group. Moreover, in written commentaries, friends reported more on the task, whereas strangers reported more about their partners. Karaosmanoglu et al. (2023) also conducted a small study with 14 participants, with four groups of two people in a strangers group and three groups in a friends group, represented by genderless cartoon avatars. The participants had to play a game together that encouraged cooperation. As a result, those in the strangers groups tended to show an increasing level of social closeness after the end of the game (something not considered in our case). Both groups scored high on social presence. Both groups reported high levels of enjoyment, and there were no differences between the performances of the friends and strangers groups. It seems that the critical factor in the results of this study was the enjoyment of the game, which overrode whether or not the pairs were friends or strangers. Moreover, unlike in our study, the avatars were impersonal rather than actually representing the people involved.
Rivu et al. (2021) highlighted the importance of the avatar representations. Their experiment had 20 pairs of friends and 20 pairs of strangers and took place in the social virtual environment Rec Room (https://recroom.com), accessed through HMDs. Participants were represented either by their own gender or the opposite gender. Those in the friends condition tended to maintain a greater distance from their partners when they were represented by opposite-gender avatars compared to when their avatars displayed their own gender, and this effect was not consciously realized by most of them. However, this did not occur for those in the strangers condition. This provides further evidence for the supposition that, in our case, representing participants with avatars resembling themselves may have played a crucial role in the outcome—although this was not something we explicitly set out to explore, and from our data, we cannot draw any conclusions about that.
Wang et al. (2024) investigated turn-taking behaviors in VR, specifically focusing on predicting the timing and identity of speakers in open-ended group activities. They generated a large dataset of VR interactions to model turn-taking behaviors with high accuracy using gradient boosting classifiers. Our turn-taking analysis showed that people in the friends condition had a higher chance of having dyadic interactions, reflecting a back-and-forth type of conversation that is typical of familiar situations. This observation, together with circular flows of conversation, suggests a responsive and dynamic interaction, akin to natural conversations in physical settings. We can interpret the prevalence of short utterances in the friends condition as indicators of active listening, agreement, and short exchanges that characterize ease and informal conversations. This contrasts with the strangers condition, where the number of short utterances was lower, suggesting that the conversation may have been more measured and less spontaneous.
Social network analysis provided further insights into the conversational dynamics within the two conditions. Various measures were computed to evaluate the structure and quality of interactions. In the friends condition, results showed a smaller network diameter, indicating that conversations required fewer exchanges to connect all participants and suggesting tightly knit conversation and more direct communication. Additionally, the average path length was shorter in the friends condition, suggesting that participants were more directly connected and could interact more efficiently than those in the other condition.
The analysis showed that the moderator had higher closeness centrality in the strangers condition, indicating a central role in facilitating interactions among participants. In contrast, in the friends condition, the moderator’s role was less central as participants naturally engaged with each other more directly. The eigenvector centrality of the moderator was lower in the friends condition, indicating that the moderator’s influence was less pronounced, aligning with the observation that familiar groups are more self-sufficient in managing their interactions (Wasserman and Faust, 1994). Finally, the network efficiency was higher in the friends condition, indicating a smoother communication that required fewer intermediary steps, showing the ease with which familiar participants could engage in discussions.
5 Conclusion
This paper explores and highlights the role of prior acquaintance in the social VR context. The findings of this research indicate that people with pre-existing relations experience a higher level of social presence in VR than strangers, measured over several indicators. This result underscores the importance of familiarity when it comes to fostering immersive and meaningful experiences in VR.
The results of the study have various implications regarding the design of shared virtual environments. In order to overcome the lack of familiarity and expectations among groups of strangers, the meetings might (if appropriate) be more formally structured, with a moderator playing a critical role. It is possible that starting a meeting with ‘ice-breaking’ activities may help (but this is, of course, not proven by our findings). Generally, taking into account the influence of prior acquaintance would allow the designers and developers to find ways of increasing comfort among strangers. Our study is a precursor to using shared VR in a conflict resolution setting, and we will examine whether it might be useful to engage protagonists in ‘getting to know you’ activities, such as cooperative games, before the actual process of conflict resolution begins.
Data availability statement
Publicly available datasets were analyzed in this study. These data can be found at: https://www.kaggle.com/datasets/melslater/small-groups and https://www.kaggle.com/code/melslater/small-groups-code.
Ethics statement
The studies involving humans were approved by Comisió de Bioética de la Universitat de Barcelona. The studies were conducted in accordance with the local legislation and institutional requirements. The participants provided their written informed consent to participate in this study.
Author contributions
EKT: data curation, investigation, software, and writing – review and editing. RO: investigation, software, visualization, and writing – review and editing. MS: conceptualization, data curation, formal analysis, funding acquisition, investigation, methodology, project administration, resources, supervision, validation, writing – original draft, and writing – review and editing.
Funding
The author(s) declare that financial support was received for the research and/or publication of this article. This work was funded by the European Union Horizon 2020 research and innovation programme under grant agreement no. 101017884—GuestXR project. EKT has also received support by a grant from Facebook.
Acknowledgments
The authors thank the company Pico for providing the head-mounted displays. Neither Facebook nor Pico participated in the study in any way. The authors thank Karolina Ziembowicz of the University of Warsaw for helpful comments in the early stages of this research.
Conflict of interest
The authors declare that the research was conducted in the absence of any commercial or financial relationships that could be construed as a potential conflict of interest.
The author(s) declared that they were an editorial board member of Frontiers, at the time of submission. This had no impact on the peer review process and the final decision.
Generative AI statement
The authors declare that no Generative AI was used in the creation of this manuscript.
Publisher’s note
All claims expressed in this article are solely those of the authors and do not necessarily represent those of their affiliated organizations, or those of the publisher, the editors and the reviewers. Any product that may be evaluated in this article, or claim that may be made by its manufacturer, is not guaranteed or endorsed by the publisher.
References
Beacco, A., Gallego, J., and Slater, M. (2023). 3D objects reconstruction from frontal images: an example with guitars. Vis. Comput. 39, 5421–5436. doi:10.1007/s00371-022-02669-x
Biocca, F., and Harms, C. (2002). Defining and measuring social presence: contribution to the networked minds theory and measure. in Proceedings of PRESENCE 2002, 7–36.
Biocca, F., Harms, C., and Burgoon, J. K. (2003). Toward a more robust theory and measure of social presence: review and suggested criteria. Presence Teleoperators Virtual Environ. 12, 456–480. doi:10.1162/105474603322761270
Blanchard, C., Burgess, S., Harvill, Y., Lanier, J., Lasko, A., Oberman, M., et al. (1990). “Reality built for two: a virtual reality tool,” in Proceedings of the 1990 symposium on Interactive 3D graphics, 35–36. doi:10.1145/91385.91409
Carlsson, C., and Hagsand, O. (1993). “DIVE A multi-user virtual reality system,” in Proceedings of IEEE Virtual Reality Annual International Symposium, Seattle, WA, 18-22 September 1993, 394–400. doi:10.1109/VRAIS.1993.380753
Carpenter, B., Gelman, A., Hoffman, M. D., Lee, D., Goodrich, B., Betancourt, M., et al. (2017). Stan: a probabilistic programming language. J. Stat. Softw. 76, 1. doi:10.18637/jss.v076.i01
Collingwoode-Williams, T., O'shea, Z., Gillies, M., and Pan, X. (2021). The impact of self-representation and consistency in collaborative virtual environments. Front. Virtual Real. 2, 648601. doi:10.3389/frvir.2021.648601
Csárdi, G., Nepusz, T., Traag, V., Horvát, S., Zanini, F., Noom, D., et al. (2025). igraph: network analysis and visualization in R. R package version 2.1.4. Available online at: https://CRAN.R-project.org/package=igraph.
Frécon, E., and Stenius, M. (1998). DIVE: a scaleable network architecture for distributed virtual environments. Distrib. Syst. Eng. 5, 91. doi:10.1088/0967-1846/5/3/002
Garau, M., Slater, M., Vinayagamoorthy, V., Brogni, A., Steed, A., and Sasse, A. M. (2003). The impact of avatar realism and eye gaze control on perceived quality of communication in a shared immersive virtual environment. in Proceedings of SIGCHI, 529–536. doi:10.1145/642611.642703
Heeter, C. (1992). Being there: the subjective experience of presence. Presence Teleoperators Virtual Environ. 1, 262–271. doi:10.1162/pres.1992.1.2.262
Herrera, F., Oh, S. Y., and Bailenson, J. N. (2020). Effect of behavioral realism on social interactions inside collaborative virtual environments. Presence 27, 163–182. doi:10.1162/pres_a_00324
Kamada, T., and Kawai, S. (1989). An algorithm for drawing general undirected graphs. Inf. Process. Lett. 31, 7–15. doi:10.1016/0020-0190(89)90102-6
Karaosmanoglu, S., Schmolzi, T., and Steinicke, F. (2023). “Playing with friends or strangers? The effects of familiarity between players in an asymmetric multiplayer virtual reality game,” in Companion Proceedings of the Annual Symposium on Computer-Human Interaction in Play, 06 October 2023, 76–82. doi:10.1145/3573382.3616079
Kiesler, S., Siegel, J., and Mcguire, T. W. (1984). Social psychological aspects of computer-mediated communication. Am. Psychol. 39, 1123–1134. doi:10.1037/0003-066X.39.10.1123
Kruschke, J. K. (2011). Introduction to special section on bayesian data analysis. Perspect. Psychol. Sci. 6, 272–273. doi:10.1177/1745691611406926
Küçüktütüncü, E., Macia-Varela, F., Llobera, J., and Slater, M. (2025). The role of sensorimotor contingencies in virtual reality: a reinforecement learning paradigm. IEE Trans. Comput. Graph. 2025, 47241. doi:10.1109/TVCG.2025.3547241
Lemoine, N. P. (2019). Moving beyond noninformative priors: why and how to choose weakly informative priors in Bayesian analyses. Oikos 128, 912–928. doi:10.1111/oik.05985
Li, J., Vinayagamoorthy, V., Williamson, J., Shamma, D. A., and Cesar, P. (2021). Social vr: a new medium for remote communication and collaboration. in Extended Abstracts of the 2021 CHI Conference on Human Factors in Computing Systems, 1–6. doi:10.1145/3411763.3441346
Mcveigh-Schultz, J., Márquez Segura, E., Merrill, N., and Isbister, K. (2018). “What's it mean to “be social” in vr? mapping the social vr design ecology,” in Proceedings of the 2018 ACM conference companion publication on designing interactive systems, 289–294. doi:10.1145/3197391.3205451
Moustafa, F., and Steed, A. (2018). “A longitudinal study of small group interaction in social virtual reality,” in Proceedings of the 24th ACM symposium on virtual reality software and technology, 1–10. doi:10.1145/3281505.3281527
Nowak, K. (2001). Defining and differentiating copresence, social presence and presence as transportation. in Presence 2001 Conference, 686–710.
Oh, C. S., Bailenson, J. N., and Welch, G. F. (2018). A systematic review of social presence: definition, antecedents, and implications. Front. Robot. AI 5, 114. doi:10.3389/frobt.2018.00114
Oliva, R., Beacco, A., Gallego, J., Abellan, R. G., Slater, M., and Potel, M. (2023). The making of a newspaper interview in virtual reality: realistic avatars, philosophy, and sushi. IEEE Comput. Graph Appl. 43, 117–125. doi:10.1109/MCG.2023.3315761
Oliva, R., Beacco, A., Navarro, X., and Slater, M. (2022). QuickVR: a standard library for virtual embodiment in unity. Front. Virtual Real. 3, 937191. doi:10.3389/frvir.2022.937191
Pan, Y., and Steed, A. (2017). The impact of self-avatars on trust and collaboration in shared virtual environments. PLoS One 12, e0189078. doi:10.1371/journal.pone.0189078
Plopski, A., Hirzle, T., Norouzi, N., Qian, L., Bruder, G., and Langlotz, T. (2022). The eye in extended reality: a survey on gaze interaction and eye tracking in head-worn extended reality. ACM Comput. Surv. (CSUR) 55, 1–39. doi:10.1145/3491207
Rivu, R., Zhou, Y., Welsch, R., Mäkelä, V., and Alt, F. (2021). “When friends become strangers: understanding the influence of avatar gender on interpersonal distance in virtual reality,” in IFIP conference on human-computer interaction, 27 August 2021 (Springer), 234–250.
Rothman, D. (2021). Transformers for natural language processing: build innovative deep neural network architectures for NLP with Python, PyTorch, TensorFlow, BERT, RoBERTa, and more. Birmingham, England: Packt Publishing Ltd.
Slater, M. (2009). Place Illusion and Plausibility can lead to realistic behaviour in immersive virtual environments. Philos. Trans. R. Soc. Lond 364, 3549–3557. doi:10.1098/rstb.2009.0138
Slater, M., Banakou, D., Beacco, A., Gallego, J., Macia-Varela, F., and Oliva, R. (2022). A separate reality: an update on place illusion and plausibility in virtual reality. Front. Virtual Real. 3, 914392. doi:10.3389/frvir.2022.914392
Slater, M., Sadagic, A., Usoh, M., and Schroeder, R. (2000). Small-group behavior in a virtual and real environment: a comparative study. Presence Teleoperators and Virtual Environ. 9, 37–51. doi:10.1162/105474600566600
Slater, M., and Steed, A. (2000). A virtual presence counter. Presence Teleoperators Virtual Environ. 9, 413–434. doi:10.1162/105474600566925
Spante, M., Heldal, I., Steed, A., Axelsson, A., and Schroeder, R. (2003). Strangers and friends in networked immersive environments: virtual spaces for future living. in Proceeding Home Oriented Inf. Telematics (HOIT).
Stan Development Team (2019). Stan Model Language Users Guide Reference Manual 2.25. Available online at: https://mc-stan.org.
Steed, A., Mortensen, J., Frecon, E., and Frohlicj, B. (2001). “Spelunking: experiences using the DIVE system on CAVE-like platforms,” in Immersive Projection Technology and Virtual Environments (Springer), 153–164. doi:10.1007/978-3-7091-6221-7_16
Steed, A., Slater, M., Sadagic, A., Bullock, A., and Tromp, J. (1999). “Leadership and collaboration in shared virtual environments,” in Virtual Reality, Proceedings, Houston, TX, 13-17 March 1999 (IEEE), 112–115.
Steed, A., Spante, M., Heldal, I., Axelsson, A.-S., and Schroeder, R. (2003). “Strangers and friends in caves: an exploratory study of collaboration in networked IPT systems for extended periods of time,” in Proceedings of the 2003 symposium on Interactive 3D graphics, 27 April 2003, 51–54. doi:10.1145/641480.64149
Steptoe, W., Oyekoya, O., Murgia, A., Wolff, R., Rae, J., Guimaraes, E., et al. (2009). “Eye tracking for avatar eye gaze control during object-focused multiparty interaction in immersive collaborative virtual environments,” in 2009 IEEE virtual reality conference, Lafayette, LA, 14-18 March 2009, 83–90. doi:10.1109/VR.2009.4811003
Steptoe, W., Steed, A., Rovira, A., and Rae, J. (2010). “Lie tracking: social presence, truth and deception in avatar-mediated telecommunication,” in Proceedings of the SIGCHI Conference on Human Factors in Computing Systems, 10 April 2010, 1039–1048. doi:10.1145/1753326.1753481
Steptoe, W., Wolff, R., Murgia, A., Guimaraes, E., Rae, J., Sharkey, P., et al. (2008). “Eye-tracking for avatar eye-gaze and interactional analysis in immersive collaborative virtual environments,” in Proceedings of the 2008 ACM conference on Computer supported cooperative work, 08 November 2008, 197–200. doi:10.1145/1460563.1460593
Tajfel, H. (1979). Individuals and groups in social psychology. Br. J. Soc. Clin. Psychol. 18, 183–190. doi:10.1111/j.2044-8260.1979.tb00324.x
Tromp, J., Bullock, A., Steed, A., Sadagic, A., Slater, M., and Frecon, E. (1998). Small group behaviour experiments in the Coven project. IEEE Comput. Graph. Appl. 18, 53–63. doi:10.1109/38.734980
Waltemate, T., Gall, D., Roth, D., Botsch, M., and Latoschik, M. E. (2018). The impact of avatar personalization and immersion on virtual body ownership, presence, and emotional response. IEEE Trans. Vis. Comput. Graph 24, 1643–1652. doi:10.1109/TVCG.2018.2794629
Wang, P., Han, E., Queiroz, A., Deveaux, C., and Bailenson, J. N. (2024). Predicting and understanding turn-taking behavior in open-ended group activities in virtual reality. Preprint arXiv:2407.02896. doi:10.48550/arXiv.2407.02896
Wasserman, S., and Faust, K. (1994). Social network analysis: methods and applications. Cambridge University Press.
Keywords: copresence, social presence, virtual reality, metaverse, friends, strangers
Citation: Tütüncü EK, Oliva R and Slater M (2025) Strangers and friends meet in virtual reality: the influence of prior acquaintance in social VR scenarios. Front. Virtual Real. 6:1569708. doi: 10.3389/frvir.2025.1569708
Received: 01 February 2025; Accepted: 16 April 2025;
Published: 30 May 2025.
Edited by:
Ekaterina Prasolova-Førland, Norwegian University of Science and Technology, NorwayReviewed by:
Marco Fyfe Pietro Gillies, Goldsmiths University of London, United KingdomRichard Skarbez, La Trobe University, Australia
Copyright © 2025 Tütüncü, Oliva and Slater. This is an open-access article distributed under the terms of the Creative Commons Attribution License (CC BY). The use, distribution or reproduction in other forums is permitted, provided the original author(s) and the copyright owner(s) are credited and that the original publication in this journal is cited, in accordance with accepted academic practice. No use, distribution or reproduction is permitted which does not comply with these terms.
*Correspondence: Mel Slater, bWVsc2xhdGVyQHViLmVkdQ==