 Ying Yang1*
 Tim Dwyer1Zachari Swiecki1
 Benjamin Lee2
 Michael Wybrow1
 Maxime Cordeil3Teresa Wulandari4
 Bruce H. Thomas5Mark Billinghurst5
- 1Monash University, Melbourne, Australia
- 2University of Stuttgart, Stuttgart, Germany
- 3The University of Queensland, Brisbane, Australia
- 4The University of Melbourne, Melbourne, Australia
- 5University of South Australia, Adelaide, Australia
Immersive environments enable people to share a workspace in a more spatial and embodied manner than traditional desktop collaboration platforms. However, it remains unclear whether such differences support collaborators in sharing information to build mutual understanding during sensemaking. To investigate this, we conducted a user study with groups of four participants—each given exclusive starting information—using mind maps as a medium for information sharing and collaborative sensemaking. Participants used both the VR and desktop systems we developed to complete sensemaking tasks. Our results reveal that the primary focuses of mind-mapping activities differed between VR and desktop: participants in VR engaged more in problem solving, whereas on desktop they concentrated more on mind map organisation. We synthesise our results from post hoc analysis, observations and subjective feedback, and attribute the discrepancies to the fundamental distinctions between the affordances of traditional desktop tools and embodied presence and interactions in VR. We therefore suggest additional features that facilitate mind map authoring and organisation such as automatic mechanisms be considered essential in future immersive mind-mapping systems.
1 Introduction
During collaboration, people often use tools like whiteboards to externalise their cognitive processes by creating mind maps for sensemaking (Bystrova and Larionova, 2015). Mind maps are graphical representations that use nodes and links to depict the relationships between knowledge elements (Faste and Lin, 2012; Tolman, 1948). In this way, mind maps enhance human perception and working memory (Stoyanov and Kommers, 2006; Sarker et al., 2008), and facilitate communication and information synthesis with others to achieve shared understanding (Faste, 1997; Mahyar and Tory, 2014).
Digital mind-mapping tools such as Miro1, together with video conferencing, offer a replacement for whiteboards that can work in online collaborative contexts. However, these desktop-based platforms lack the physical presence and spatial embodiment of face-to-face activities, which have been shown to benefit data understanding and improve group awareness (Andrews et al., 2010; Jacob et al., 2008; Wagner Filho et al., 2019). Virtual Reality (VR) technology can afford spatial presence and embodied interactions that are more reminiscent of in-person experiences than desktop interfaces (Witmer and Singer, 1998), and participants have been found to be more active in VR than with 2D desktop collaboration tools (Yang et al., 2022). Such an immersive environment of VR has been suggested to offer “a space to focus” during sensemaking (Lisle et al., 2023), and can offer a more natural and engaging space for collaboration (Raja et al., 2004).
Despite the potential, it remains unknown if immersive environments and embodied presence can provide benefits for mind mapping to facilitate shared understanding. Little research has been performed on mind-mapping tools in VR. Two studies (Kuták et al., 2019; Miyasugi et al., 2017) have been conducted on mind map construction for brainstorming with pairs of users, but their studies mainly focused on functionality and usability evaluation. “Post-post It” is a mind map system demonstrating novel gesture-based interaction (Lee et al., 2021), but it is only for single-users.
In this paper, we address the research question will spatial presence and embodied mind map visualisations and interactions in VR facilitate knowledge sharing in collaborative sensemaking compared to a traditional 2D desktop interface? We conducted a study with groups of four participants using mind maps to integrate distributed information, develop working strategies, support their discussions and help them make sensemaking decisions for crime puzzles (Stanford and Stanford, 1969; Wozniak et al., 2016).
We developed equivalent mind map systems for both desktop and VR environments, ensuring their functionality was as similar as possible (see Figure 1).2 The basic functionality of the system was designed to encourage embodied sensemaking. Participants drag keywords and phrases from the text of provided clues on their clipboards to create notes in the environment. They can then link these notes as mind maps to externalise their reasoning process. We use a Rapid Iterative Testing and Evaluation (RITE) methodology (Medlock et al., 2005) involving four iterations with two groups of four participants at each iteration (32 participants in total).
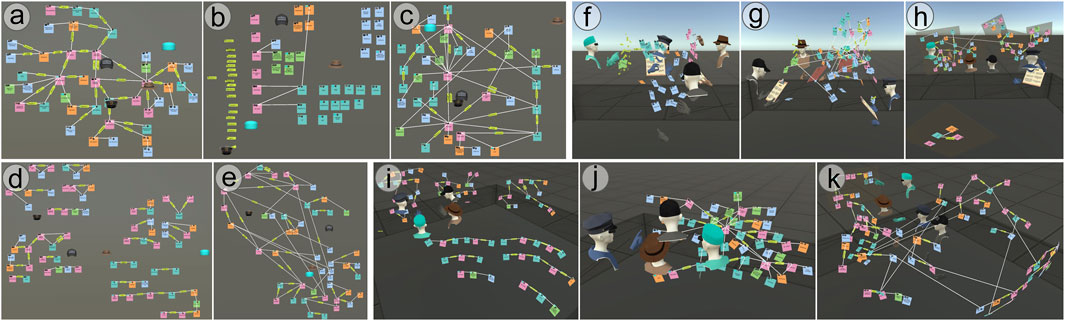
Figure 1. Setup of the desktop (a–e) and VR (f–k) conditions. Participants had 2D “hat” avatars on desktop and 3D embodied avatars in VR. Name tags were visible in the study (hidden here for anonymity). Communication was supported on desktop by video conferencing (omitted in the figure) and with headset mic/audio in VR. Individual images show mind maps created by study participants to solve crime puzzles. A variety of behaviours were observed across groups. For example, one group (G4) created all notes first and then sorted them by type before linking them to create the mind map, in both desktop (b,c) and VR (f,g). G3 initially created separate mind maps in VR (i) and also started with separate mind maps in the desktop condition but later merged them into one (e), while G2 created one mind map from the start in both conditions (a,j). G5 participants used 2D panels for different egocentric mind maps (h), and G8 participants used a 2D panel to keep “important” information (k).
Analysis was both quantitative and qualitative across a range of measures as described in Section 5 and Section 6. We developed a set of metrics to assess the produced mind maps, measure the collaborative activities, and analyse the conversation and action data.
Our results show that, participants took advantage of easy concurrent navigation to view and discuss mind maps together in VR, but put more effort into organising mind maps and grouping related information on desktop. Moreover, participants fully used the immersive space and produced 3D mind maps in VR. The different nature of 2D and 3D space leads to more mind map arrangement to avoid overlaps on desktop than VR (where overlap can easily be resolved by changing the view angle). Also, VR was preferred over desktop, and as expected, VR received higher engagement and social presence ratings than desktop. However, participants tended to recreate duplicated mind map elements in VR rather than merging and arranging mind maps as they did on desktop. Subsequently, they produced less complete and more redundant mind maps in VR than desktop, which were also considered less readable, leading to more verbal information exchange and debates. We therefore argue that, while VR environments offer certain benefits over desktop, to better support knowledge sharing additional features that facilitate mind map organisation such as automatic arrangement mechanisms should be employed in future immersive mind mapping systems.
This work provides several contributions:
2 Related work
2.1 Mind-mapping in collaboration
Desktop-based digital mind-mapping tools reproduce traditional mind maps drawn on paper or whiteboards and can display users’ editing in real-time, allowing the thinking process to be distributed among collaborators (Ang et al., 2010). VizCept (Chung et al., 2010) demonstrated that a shared mind-mapping diagram enhances the finding of entity relationships during collaborative text data analysis. Balakrishnan et al. (2008) showed that editable shared network diagrams better supported collaboration and provoked more discussion than view-only and no-diagram conditions. Goyal et al. (2014) found that the analysts with mind maps for information sharing in collaboration performed better and remembered more information than those without. KTGraph (Zhao et al., 2017) demonstrated that a knowledge map-based analytic system with handoff annotations and interaction playback facilitated group awareness in an asynchronous collaborative scenario.
VR techniques allow the construction of mind maps in immersive environments. VERITAS (Sims and Karnik, 2021) proved the learnability of VR and that novice users were able to effectively build mind maps in the 3D space. Lee et al. (2021) demonstrated a VR system that used smartphone input for writing on post-it notes, which are then connected with hand-drawn links to construct mind maps. A few systems allow the collaborative construction of mind maps in immersive spaces. Miyasugi et al. (2017) presented a multi-user VR mind-mapping tool that used voice recognition and hand gestures for mind map editing. They compared this system to desktop-based mind-mapping software for an editing task with two pairs of participants. They found the desktop system got a better rating on usability, while the VR system had higher scores on memorability and preference. Kuták et al. (2019) created a similar VR mind-mapping system but with controllers as input, a 2D canvas and an additional voting function. They conducted a usability testing with 16 pairs of participants. Tong et al. (2023) developed an asymmetric collaborative mind map system and conducted two user studies. Their findings showed that PC users perceived less mental demand in the PC-VR asymmetric setting than in the PC-PC symmetric setting.
While there is abundant evidence to confirm that conventional desktop mind map tools facilitate collaboration among users, the value of immersive mind maps for knowledge sharing and collaborative thinking remains underexplored. We conduct studies to fill this gap by comparing a VR mind mapping system against a desktop system to investigate this value.
2.2 Spatial sensemaking with mind maps
Spatial sensemaking is where space is used to arrange visual cues and can benefit from large- or multi-display environments as these provide more “space to think” (Andrews et al., 2010). Mind maps can be used to externalise mental models of information structures in a way that supports visual spatial sensemaking. Various spatial organisation strategies of mind maps were identified, such as clusters, lists and timelines on a vertical large display (Andrews and North, 2012). Fisher et al. (2012) conducted a study that asked participants to collaborate asynchronously to construct knowledge maps for web search results and found that spatial layouts played an important role in achieving common ground without direct communication. Waldner et al. (2021) developed an observation mind map that provided users with flexible spatial arrangements and allowed them to link the nodes in mind maps to the source documents, which effectively reduced information fragments.
Studies of immersive visualisation systems have found that participants mainly used the space around them to organise information (Batch et al., 2019; Satriadi et al., 2020; Lee et al., 2020; Lisle et al., 2021). For image grouping tasks, Luo et al. (2022) found that the arrangement of physical surroundings and furniture impacted the placement of images in and Yang et al. (2022) found that the spatial organisations of images in an empty space in VR depended on the collaboration styles of participants. We still lack an understanding of whether such observations apply to knowledge sharing and collaborative sensemaking with immersive mind maps, and whether the behaviours are different from those observed on conventional desktop-based mind-mapping tools.
2.3 Embodied visualisation, interaction and presence
Theories of embodied cognition state that cognitive processes can be offloaded onto objects and interactions with those objects in the physical environment (Clark, 2008), with various visual analytics researchers suggesting that such externalisation of cognition can reduce mental load in sensemaking scenarios, e.g., Andrews and North (2012). Immersive environments provide benefits of natural presence of digital artefacts to embodiment for visual analytics and sensemaking (Chandler et al., 2015; Marriott et al., 2018), applying embodiment on data artifacts and manipulation (Dourish, 2001; Falconer et al., 2014). For example, ImAxes (Cordeil et al., 2016) enabled direct assembling and disassembling of embodied 3D axes in VR to visualise multivariate data, Tilt Map (Yang et al., 2020) proposed a visualisation design on embodied transitions between 2D and 3D data maps, and Wagner Filho et al. (2019) supported embodied navigations to explore an immersive space-time cube. They demonstrated that embodied visualisation and interaction provide benefits to understanding data and reducing cognitive load.
Embodied presence provides benefits to social awareness in collaborative workspaces (Jacob et al., 2008). In physically co-located collaborations, users are naturally aware of others’ activities. However, the standard practice of remote collaboration, often relying on face-only video calls, falls short of maintaining group awareness (Gutwin et al., 2004). To overcome this, research provided visual cues by virtual representations of remote collaborators’ arms on big displays (Tang et al., 2007) or tabletops (Tuddenham and Robinson, 2009), or 3D whole-body telepresence of collaborators on 2D digital whiteboards (Zillner et al., 2014; Higuchi et al., 2015). In immersive environments, co-presence is often enhanced by embodied avatars (Piumsomboon et al., 2018; Ens et al., 2019). Yang et al. (2022) conducted a user study comparing VR with embodied avatars and desktop with Zoom calls for sensemaking on image emotion grouping, and found that participants in VR had more conversations and more equal contributions to virtual object interactions. An AR system Room2Room (Pejsa et al., 2016) projected remote collaborators’ life-sized telepresence onto the physical space, demonstrating that it provided a stronger social presence than traditional video conferencing.
The embodiment of visualisation, interaction and presence was shown to be effective in supporting sensemaking and social awareness in collaboration. However, the impact of embodied mind-mapping process on sensemaking and knowledge sharing, whether beneficial or detrimental remains to be investigated, which is explored in our research.
3 System design
We based the design of our system on criteria for desktop mind-mapping tools outlined by Faste and Lin (2012), including:
C1. Speed and Efficiency: the speed of editing input should match the stream of the user’s thinking process.
C2. Appearance and Mechanics: the mind map appearance should be consistent and clear, and the system should provide freedom to create and manipulate the nodes and links of mind maps.
C3. Distributed Collaboration: the system should support synchronised mind map editing and live communication.
We adopted the RITE methodology (Medlock et al., 2005) to iteratively develop and evaluate our system. The aim of RITE is to identify and fix usability issues in an iterative manner, typical of user-oriented design research that iteratively reframes problems to make the “right thing” (Zimmerman et al., 2007; Fallman, 2003). RITE is used in software engineering practice and, as with user-centred design more generally, is becoming increasingly used in HCI research. For example, RITE has been used to design and evaluate a multi-touch interactive tabletop visualisation (Block et al., 2012) and a collaborative IDE (Guzzi et al., 2015).
Figure 2 maps the four iterations that we conducted. In each iteration, features were introduced to the system to test specific design ideas and, in the later iterations, to address usability concerns that were exposed by earlier iterations. For each iteration, we recruited two groups of four participants. The features introduced at each iteration are labelled in Figure 2 with specified subsections. The details of the study design are reported in Section 4. We briefly summarise the most significant design decisions stemming from the overall study as follows, with further explanation of how they led to significant system features in subsequent sections:
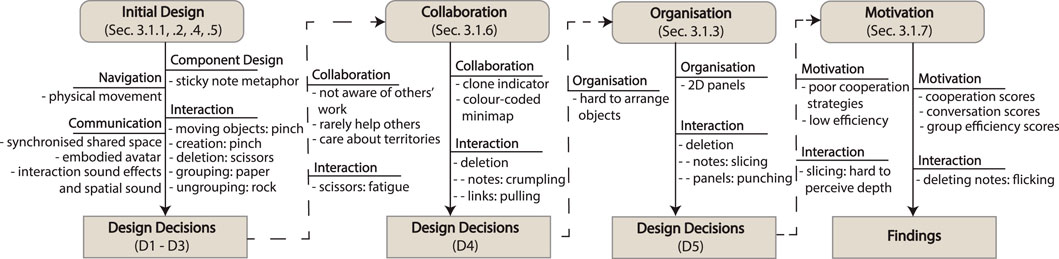
Figure 2. The iteration flow chart summarises the design decisions in each iteration for VR (the desktop system was changed accordingly with details in each section). The dashed lines indicate design decisions that were addressed in a subsequent iteration.
D1. (Collaboration) Reveal common work among participants: participants tended to build mind maps separately and lacked awareness of others’ work if they did not communicate verbally, resulting in replicating others’ work, which “crowded the workspace”.
D2. (Collaboration) Make participants feel “connected” as a team: sometimes participants did not help others—the ones who finished first just browsed and waited.
D3. (Collaboration) Give an overview of the shared space to support an easy perception of working area ownership: some participants cared about territories (Toney and Thomas, 2006). They physically turned around and checked available space to build their own mind maps to avoid mixing with others’ work in VR.
D4. (Organisation) Support easy placement and arrangement: some participants in VR did not arrange the notes as significantly as on desktop (see Figures 1b,c), so they ended up with a “messy spiderweb-like” mind map (see Figures 1f,g).
D5. (Motivation) Stimulate participants to collaborate efficiently and actively toward group objectives: some participants did not plan well before performing the tasks. They either deleted and reconstructed the whole network or tended to create the links one-at-a-time to form a mind map. Also, some participants became less active in collaboration and group discussions after finishing their own clues.
3.1 The VR system
We applied the above design criteria and designed the VR systems. We iteratively refined our design based on the above design decisions. The details are discussed in the following sections.
3.1.1 Mind map component
We used square virtual objects to denote the nodes of mind maps—an interface metaphor for sticky notes (C2), coloured by type, see Figure 3b. Notes can be freely placed in the space (see Figure 3 (left)). Each note has a pin, and links are “wired” to this pin (see Figure 3b). A link label is a rectangular marker containing a textual arrow to indicate direction, which can be modified by flipping the sides of the label (see Figure 4f). Multiple labels may be attached to a single link.
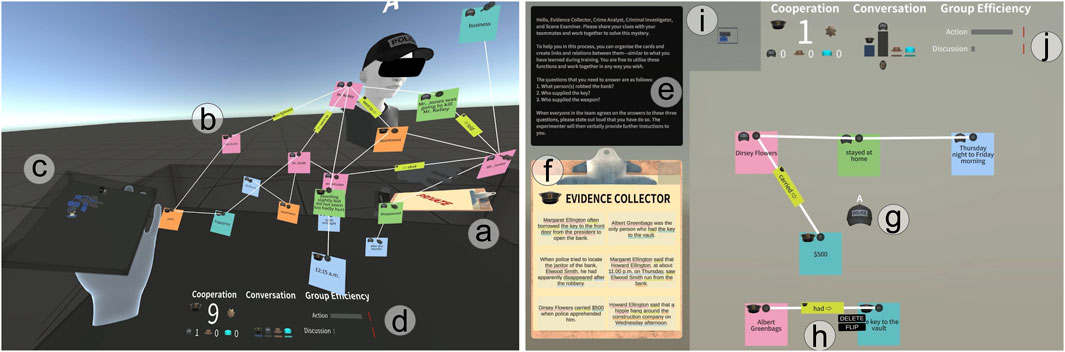
Figure 3. The VR (left) and desktop (right) mind-mapping system interfaces. The full view of the VR scene and the desktop canvas is not shown to save space. The Zoom windows that were used in the study for the desktop are omitted. (a) In VR, collaborator A’s clipboard hides the clues in other persons’ views. (b) Notes, links and link labels of the mind map. (c) The 3D minimap on the palm, where notes and links are coloured the same as the avatar (added in second iteration). (d) Gamification dashboard at waist height attached to the body (added in the fourth iteration). Users were represented by their role hats in the gamification dashboard. (e) Instruction board on desktop. (f) Clipboard with clues. (g) The “hat” avatar of collaborator A. (h) Buttons of a selected label. (i) Minimap with a coloured square (matching avatar colour) showing the current field of view relevant to the entire canvas (added in second iteration). (j) Gamification dashboard (added in fourth iteration).
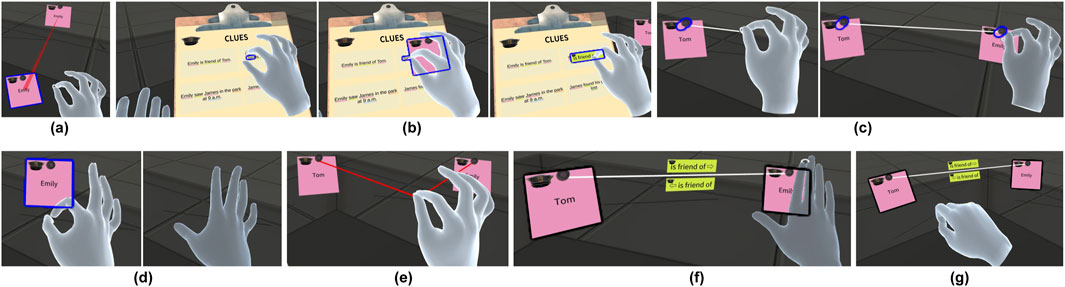
Figure 4. Gestures trialled in our VR system: (a) “Pinch” gesture to grab and (b) create notes and (c) draw links. (d) “Flick” gesture to delete notes and (e) “Pull” gesture to delete links. (f) “Paper” gesture to group multiple notes, and (g) waving “Rock” gesture to ungroup notes. (a) also shows the “clone indicator” pointing from the grabbed notes to a duplicate.
3.1.2 Interaction
Hand gestures in VR enable natural interactions similar to those in the physical world, and have been shown to enhance presence and provide users a more realistic, satisfying and enjoyable experience compared to controllers (Voigt-Antons et al., 2020; Yeh et al., 2022; Laine and Suk, 2024). Following Piumsomboon et al. (2013), Huang et al. (2017) and Lee et al. (2021), we designed VR interactions for creation and manipulation using hand gestures (C1). A “pinch” gesture is used to grab notes and labels, create notes and labels from a clipboard (shown when the palm is up and flattened), and draw links between notes (see Figures 4a–c). We adopted a “flicking” gesture to delete notes and labels, and a “pulling” gesture to delete links (see Figures 4d,e). A “paper” gesture (open palm) is used to group notes, and a “rock” gesture (closed fist) is for ungrouping (see Figures 4f,g). We provide both visual (outline) and auditory feedback for the interactions.
3.1.3 Organisation
Organisation techniques such as 2D layers (Lee et al., 2021; Tahmid et al., 2022) can facilitate spatial arrangements. We therefore added 2D panels that allow placing and moving multiple notes to serve D4. The 2D panels can be “grabbed” out from the clipboard (see Figure 5a). The “pinch” gesture is used to move the 2D panel and resize the panel (see Figure 5b). A “punching” gesture is used to delete the panel (see Figure 5c). The 2D panel automatically “attracts” notes within its “snap” zone to attach to it, and it automatically resizes itself accordingly to fit all the attached notes.
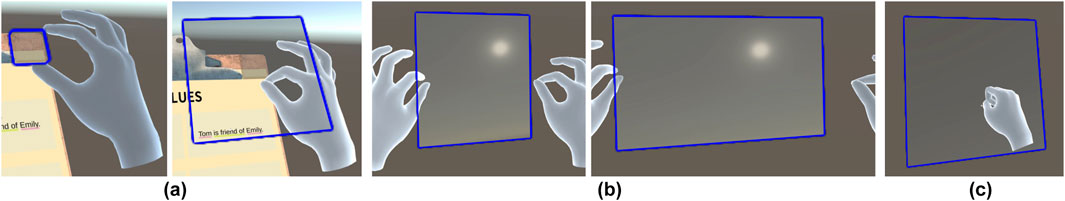
Figure 5. Panel creation and manipulation (third Iteration). (a) “Grab” a panel from the VR clipboard, (b) “pinch” with two hands to resize a panel, and (c) “punch” a panel to delete the panel.
3.1.4 Navigation
The extent of the VR room was indicated by a boundary through which users could not move. To support a seamless mind-mapping process (C1), we allowed users to walk around the working space without using virtual locomotion techniques that normally require additional operations.
3.1.5 Communication
Users have 3D avatars in VR (see Figure 3) with name tags overhead. Avatar style and colour indicate the user’s character. Users’ voices and interaction sound effects are transmitted to others and broadcast from their avatar (C3). When users are talking, their avatar’s lips move accordingly. We applied 3D spatial sound on speech and sound effect volumes.
3.1.6 Collaboration
Clone Indicator: To address D1, we added a “clone indicator” to reveal identical notes across mind maps to users (see Figure 4a). These red tapes appear and link to all duplicates when a note is grabbed. This visual link feature also fulfilled D2.
Minimap: We designed a 1:10 scale minimap of the workspace with the virtual objects (notes, links, labels, and avatars) in the space. These virtual objects are coloured to match their creator’s avatar colour, making creators more noticeable to provide an overview of working territories (D3). The minimap is shown on top of the palm (see Figure 3c) and appears when the palm is facing up. The orientation of the minimap always matches the user’s rotation in the VR environment.
3.1.7 Motivation
Gamification can be used to provide real-time feedback to motivate users and enhance performance (Jung et al., 2010; Hamari et al., 2014), using gamified elements like goals, points, badges and leaderboards (Hamari et al., 2014; Seaborn and Fels, 2015). The feedback can be on individual level (Shepherd et al., 1995) and group level (Jung et al., 2010). We designed a dashboard, positioned in front of users at waist height, attached to their avatar body (see Figure 3d), displaying key metrics that we designed to improve users’ awareness of their engagement and efficiency (D5). Whenever a user’s score changed, game sound effects were played to notify everyone.
On the individual level, we quantified two cooperation actions to encourage users to collaborate: 1) linking two notes created by different users and 2) attaching a label to a link created by others. A leaderboard (see Figures 3d,j “Cooperation”) visualised users’ scores and awarded a cooperation badge to the leading user. Scores were increased per cooperation behaviour. To incentivise discussion contributions, we calculated speaking durations of individual users and used a vertical bar chart leaderboard to visualise it (see Figures 3d,j “Conversation”), where the leading user was given a conversation badge. Both cooperation and conversation badges were also shown as embodied badges stuck to users’ virtual hands and bodies.
On the group level, the actions and discussions were measured by efficiency (the ratio of the group’s produced output and spent input (Del Gatto et al., 2011)). For the action efficiency score, we calculated the ratio of the number of created links and the duration used to create these links, showing the speed of mind map construction. The discussion efficiency score was calculated by the duration of the group discussion and the current duration of the task. A horizontal bar chart was used to visualise these two scores (see Figures 3d,j “Group Efficiency”). We used the highest scores from previous groups as the goals, presented as red lines at the end of the bars.
3.2 The desktop interface
While the functionalities of the desktop version of the mind map system are the same as the VR system, we designed the desktop interface to be as equivalent as possible to the VR version, as described below.
The appearance of the notes on desktop is the same as they in VR. The notes can be placed on a 2D canvas (see Figure 3 (right)), with standard mouse zoom and pan interactions for navigation. The clone indicator appears and functions the same as in VR. The minimap is displayed in the upper-left corner (see Figure 3i), and the gamification dashboard is displayed at the top of the screen (see Figure 3j).
Interactions on desktop use the mouse: left-click notes to drag; left-click-drag text on clipboard creates a note, and left-click-drag pin-to-pin creates a link; shift-click groups/ungroups notes. A button on a selected note, link, label or panel allows deletion (see Figure 3h). Clicking the “FLIP” button of a label can change the direction of the link label. The panel can be resized on desktop by clicking and dragging a “SCALE” button.
Users have 2D avatars on desktop (see Figure 3g) labelled with their name. The voice was transmitted over Zoom calls. The sound effects were non-spatial.
3.3 Discussion of cross-environment comparability
As discussed above, the feature-set supported in each environment was completely equivalent, i.e., in each iteration of the study the two environments had the same capabilities for mind-map construction, communication, visibility of others’ actions, etc. However, the desktop and VR environments are fundamentally different in terms of things like the interaction affordances, field-of-view, and presence. Despite this, the designs of each implementation, follow best practice for each modality. For example, the desktop presentation and interaction affordances are strongly inspired by collaborative productivity tools like Miro, while the VR system uses embodied gestures and physical navigation that should be familiar to users of chat applications and multiplayer game environments in popular headsets such as Meta Quest. In short, we aim to compare the effectiveness of best-practice interaction design in supporting collaborative mind-mapping tasks, with the limitation that there are many intrinsic differences between the environments. As such, any measured differences in behaviour across the platforms could be the result of any or combinations of these multifaceted differences and we will need to rely on post hoc analysis and subjective feedback to infer explanations for the observed differences.
4 User study
We used a within-subjects design, with two tasks conducted in VR and desktop respectively, as separate conditions. Condition and task order were counterbalanced across groups. We recruited four participants for each group.
4.1 Tasks
Crime-solving puzzles have been used in previous research to investigate collaborative sensemaking (Balakrishnan et al., 2008; Chung et al., 2010; Fisher et al., 2012; Goyal et al., 2014; Mahyar and Tory, 2014; Wozniak et al., 2016). We used two crime puzzles as tasks: a murder mystery and a robbery mystery from Stanford and Stanford (1969) and Wozniak et al. (2016). Participants needed to answer five questions for the murder and three for the robbery; identifying the perpetrator, location, time, weapon, motivation, etc. Clues were distributed arbitrarily between participants, six per person, associated with one of four roles (evidence collector, criminal investigator, crime analyst and scene examiner). The roles were represented by the hat of their avatar. The roles were chosen to be contextually relevant to the context and easily distinguishable, however there were no functional differences between the roles. The clues were displayed on a personal clipboard visible only to the owner (see Figure 3a). To avoid text input (Balakrishnan et al., 2008; Goyal et al., 2014; Mahyar and Tory, 2014), terms have coloured underlines indicating type (person, object, time, location, status and relation), and could be dragged off the clipboard to create mind map nodes, Figure 3f.
4.2 Technical implementation and apparatus
Participants were separated into four rooms in both conditions, each at least a
4.3 Procedure
Experimenters began explaining to participants: 1) the tasks, 2) that clues were exclusive to their roles, and 3) that they needed all clues to solve the puzzles. The training scenario was a small mind map with six clues similar in type to tasks. It explained mind map elements and guided participants through mind map construction using the features of the systems. To ensure participants were sufficiently familiar with the interactions, the step-by-step guidance required them to complete each step before proceeding to the next, and ultimately construct a full mind map to finish the training. Then, participants were given time to review the clues of the puzzle and told they should plan how they would solve the puzzle and how to work together. When the participants were ready, the experimenter “brought” the participants to the “Task Room” where they could create mind maps.
After completing each condition, participants were collectively interviewed within the system so that they could refer to the features during the interview. The interview was semi-structured, asking participants for their experience and feedback (see Supplementary Material S1 for the question list). Finally, participants completed demographic questionnaires and answered rating questions about their experiences in each condition.
4.4 Measures
To answer the research question, we focused on the aspects of performance, behaviours and conversations. The analysis was both quantitative and qualitative. To investigate performance, we assessed mind map construction on certain measures (Section 5.1), and examined the task accuracy and completion time (Section 5.2). We considered collaborative activities (Section 5.3), participants’ actions (Section 5.4), working strategies (Section 6.1), and working territories and navigations (Section 6.2) to analyse participants’ behaviours. We discuss the analysis of participants’ conversations in Section 5.4. To collect the data for the analyses, we logged the timestamps and positions of participants and their actions, and of all objects in the virtual space, and recorded participants’ speech.
We also gathered participants’ subjective ratings (7-point Likert) on their experience of using the systems (Section 5.5). Questions were adapted from standard questionnaires of usability testing (Hart and Staveland, 1988; Harms and Biocca, 2004; Bailenson et al., 2003) and Social Presence (Harms and Biocca, 2004) and Distance (Bailenson et al., 2003) (see Supplementary Material S1 for the question list).
5 Quantitative analysis
In total, we recruited 32 participants (15 female and 17 male, aged 18–44, M = 28.82, SD = 3.66), remunerated with a $50 gift card. Our pre-questionnaire asked about their demographics and experience with VR/AR and crime puzzles. For VR/AR experience, 19% of participants reported no experience, 50% reported having 10 h or less, and 31% reported having more than 10 h of experience. For crime puzzles experience, 22% of participants rated themselves considerably experienced with crime puzzles, 6% reported no experience, and 72% reported in-between. The groups were balanced by gender and VR/AR experience and formed such that every participant knew at least one other participant in their group.
For the statistical analyses, we used the mixed-effects model (Bates et al., 2014; Kuznetsova et al., 2017) to test the effect of the conditions, with the target measure as the dependent variable, condition and iteration as fixed effects and group as a random effect.
5.1 Mind map analysis
To analyse participants’ performance on building mind maps, we identified four categories of links created by the participants:
We did not find any significant differences between the conditions for the above four types of links by the mixed-effects model (see Figure 6).
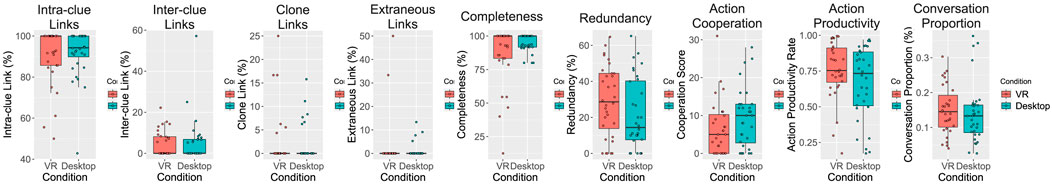
Figure 6. Boxplots of mind map analysis from left to right: intra-clue links, inter-clue links, clone links, extraneous links, completeness and redundancy, based on conditions; Boxplots of gamification measures from left to right: action cooperation scores, action productivity rate, and conversation proportion (same as conversation productivity here), based on conditions.
Completeness was calculated as the number of missing links/the number of ground truth links in a task (murder: Role1-15 (i.e., Role1 has 15 ground truth links), Role2-15, Role3-13, Role4-16; robbery: Role1-11, Role2-12, Role3-14, Role4-14). The mix-effects model shows that participants in VR produced significantly less complete mind maps than using desktop (p = 0.029, F = 5.014, df = 55, d = 0.08; VR: mean = 91%, SD = 12.66; desktop: mean = 96.61%, SD = 2.5), as shown in Figure 6.
Redundancy was defined as the total number of duplicated nodes/the total number of nodes created by participants. The mixed-effects model shows that the participants in VR created significantly more duplicated nodes than those using desktop (p = 0.049, F = 4.048, df = 55, d = 0.07; VR: mean = 29.34%, SD = 15.04; desktop: mean = 22.53%, SD = 16.69), as shown in Figure 6.
5.2 Task performance
The mean task accuracy for VR is 77.08% (SD = 32.04) and for desktop is 79.17% (SD = 26.35). The mean completion time for VR is 33.57 min (SD = 12.34) and for desktop is 30.73 min (SD = 8.16). Notably, all groups got 100% accuracy for the murder task, while the accuracy of robbery varied (VR: 33%–100%, mean = 54%, SD = 31.7; desktop: 33%–83%, mean = 58%, SD = 21.43).
5.3 Collaborative activity analysis
Regarding participants’ collaborative behaviours, we explored participant collaboration from actions and conversations using the same measures for gamification (see Section 3.1.7).
Action Cooperation is a count of the links between notes created by different participants and relation labels attached to links created by others. This is a measure of how closely participants worked together to build mind maps.
Action Productivity is determined by the number of created links/duration at the last link creation.
Conversation Proportion indicates the time proportion of conversation during the task (the duration of conversation/the duration of task session).
The mixed-effects model did not reveal any significant differences between conditions for these measures (see Figure 6).
5.4 Conversation and action analysis
Conversations were automatically transcribed using Microsoft Azure and manually corrected by three authors. Transcripts were coded using a grounded analysis approach (Glaser and Strauss, 1967), informed by Toulmin (2003) arguments classification scheme. The codes included passing information from clues (information), proposing problem-solving methods (strategy), asking questions (query), making conclusions (claim), providing evidence (ground), mind-map structural features (organisation), and engaging teammates (social). The data comprised 6181 lines, each representing a participant’s conversational turn. Two authors jointly coded a subset of 868 randomly selected lines, achieving agreement on the applied codes. This subset was then used to train machine-learning classifiers, implementing Naive Bayes models and regular expression-based features, to automatically code the remaining data. The classifiers were validated using Cohen’s kappa (
We created epistemic network analysis (ENA) models (Bowman et al., 2021; Marquart et al., 2019) to analyse the data. ENA creates co-occurrence networks that capture dependencies between concepts or actions in collaborative discourse, such as how teammates build upon each other’s ideas or behaviours, which are more appropriate for analysing collaboration compared to simply counting the occurrence across the dataset (Swiecki et al., 2020). In ENA networks, nodes represent codes, and edges represent the relative rate of co-occurrence between codes—thicker edges indicate more frequent co-occurrence. Nodes are positioned in ENA space based on their ENA points such that they align with the loadings obtained from a dimensional reduction on the original co-occurrence data—i.e., a pair of nodes placed on the extreme end of a dimension correspond to a co-occurrence variable strongly associated with that dimension.
Figure 7 (left) compares the mean co-occurrence networks for the two conditions derived from conversation data. Edges in blue are more frequent in VR, while in red are more frequent on desktop. On the right of the space, the most extreme connections are to information (with query, grounds and claim). On the left, the most extreme connections are to organisation (with query, claim and strategy). This layout suggests that we can interpret the X-axis as distinguishing between conversations more focused on exchanging information and debating about the problem on the right (VR in blue) versus conversations more focused on organising the mind map on the left (desktop in red). The results of the mixed-effects model show that the condition coefficient is significant: VR participants averaged 0.13 points (p = 0.0057, df = 51.95, SE = 0.05, d = 0.75) farther to the right of the space compared to desktop participants indicating that VR conversations were significantly more focused on exchanging and debating information about the problem.
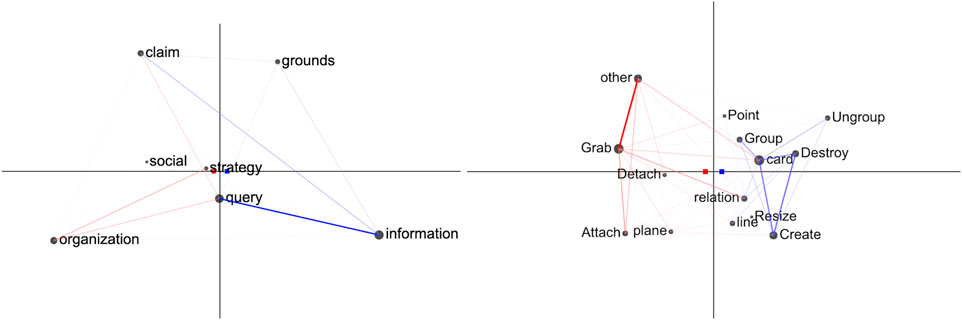
Figure 7. Mean network subtraction for conversation data (left) and action data (right). Desktop in red, VR in blue.
Figure 7 (right) shows the co-occurrence networks for the action data. On the right, the most extreme connections are among Create, Destroy, Group, and Card. On the left, the most extreme connections are among Grab, Attach, and Other (the action target did not belong to the actor). This layout suggests that the X-axis distinguished between activities more focused on building mind maps on the right (VR in blue) versus rearranging mind maps on the left (desktop in red). The condition coefficient of the mixed-effects is statistically significant: VR participants averaged 0.29 points (p = 1.43e-14, df = 53, SE = 0.03, d = 2.63) farther to the right compared to desktop participants, indicating that their activities were significantly more focused on building mind maps.
5.5 Subjective rating
Figure 8 depicts the statistically significant results between VR and desktop among the subjective ratings introduced in Section 4.4. In this figure, VR was worse than desktop for arrangement difficulty (p = 0.005, F = 8.577, df = 55, d = 0.13; VR: mean = 3.91, SD = 1.78; desktop: mean = 2.81, SD = 1.71), physical demand (p = 0.002, F = 10.923, df = 55, d = 0.17; VR: mean = 3.91, SD = 2.02; desktop: mean = 2.34, SD = 1.84), readability (p = 0.004, F = 9.013, df = 55, d = 0.14; VR: mean = 3, SD = 1.65; desktop: mean = 4.19, SD = 1.92) and social distance (p = 0.003, F = 9.765, df = 55, d = 0.15; VR: mean = 2.93, SD = 1.08; desktop: mean = 2.03, SD = 1.16), but was better for engagement (p = 0.046, F = 4.157, df = 55, d = 0.07; VR: mean = 6.03, SD = 1.43; desktop: mean = 5.31, SD = 1.55) and social presence (p = 0.039, F = 4.472, df = 55, d = 0.08; VR: mean = 5.04, SD = 0.8; desktop: mean = 4.58, SD = 1.34). In addition, 59% of participants preferred VR over desktop.
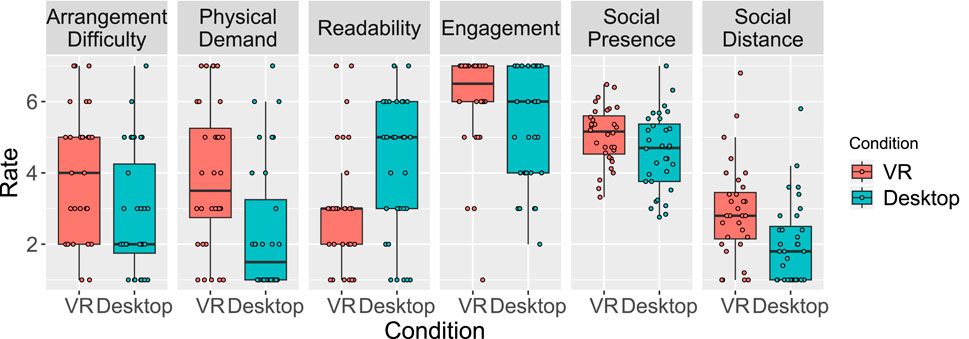
Figure 8. Boxplots of subjective ratings with significant differences between VR and desktop. For “Arrangement Difficulty”, “Physical Demand” and “Social Distance”, the higher rating means more negative feedback. This is reversed for other ratings.
6 Working strategies and territories
In this section, we discuss the qualitative findings from the log data in terms of working strategies and territories, which were commonly used to assess collaboration (Lee et al., 2020; Luo et al., 2022; Yang et al., 2022).
6.1 Working strategies
Two groups (G1, G7) worked independently, creating four sub-mind maps in both conditions, and linked some sub-mind maps after initial construction. Three groups (G4, G5, G6) continuously collaborated to build a single mind map. Specifically, G4 first created and sorted all notes by type, then collectively linked them to build a mind map in both VR and desktop (see Figures 1b,c,f,g). The remaining three groups (G2, G3, G8) employed mixed strategies, transitioning between independent and collaborative modes to find more efficient approaches. Notably, the shift in strategy from independent to collaborative during a task occurred only in the desktop condition, regardless of task order. This happened when participants chose to merge and combine mind maps involving significant mind map rearrangement, which rarely occurred in VR. Figure 9 summarises the working strategies for building mind maps of all the groups.
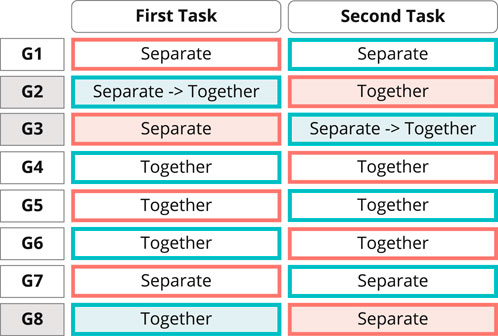
Figure 9. Summary of group working strategies based on task orders. The border of table cells is colour-coded to indicate the conditions of the tasks: VR-red, desktop-cyan. The groups that adopted mixed strategies are highlighted with a coloured background.
The introduction of “clone indicator” and gamification had impacts on working strategies. Participants were encouraged to collaborate on a single mind map (D1, D2)—more groups (G4, G5, G6, G8) naturally built mind maps as one—and to develop efficient working strategies (D5)—e.g., G8 participant proposed adjusting their working strategy to a more “efficient” way.
6.2 Working territories and navigation
Figures 10, 11 colours nodes, links and panels by their creator’s role colour, indicating the ownership and working territories. When building one mind map together or merging mind maps, participants’ working territories were naturally mixed in both conditions. When creating separate mind maps, the boundary of territories was clear. While the minimap uses colour-coding to indicate ownership, some participants deemed that they did not care about the territories (D3). However, one group used 2D panels to build boundaries of territories (D4, see Figure 11 G7).
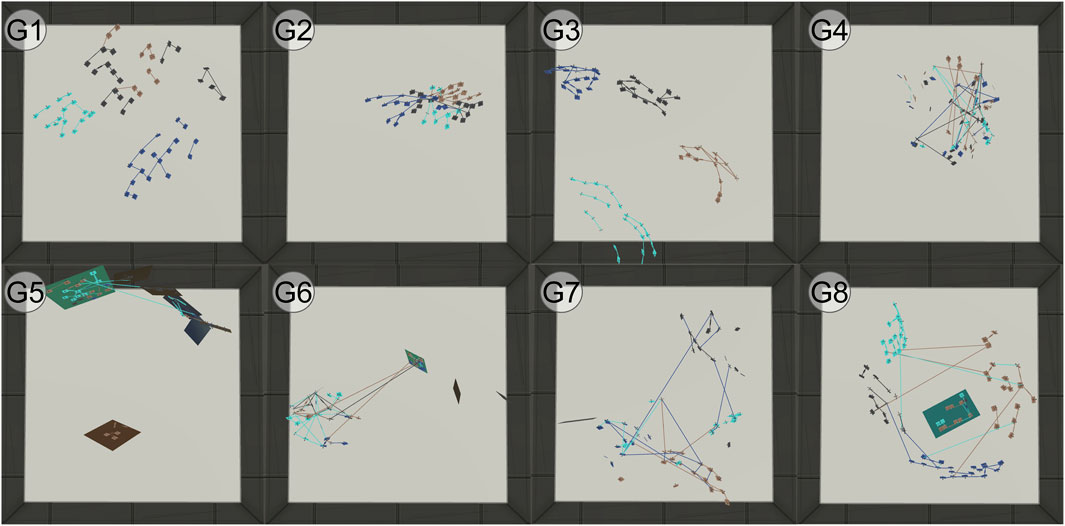
Figure 10. Top-down view of VR space for groups. Objects are coloured the same as participants’ roles to show ownership and territories. The floor colour is changed to a bright colour for better visualisation.
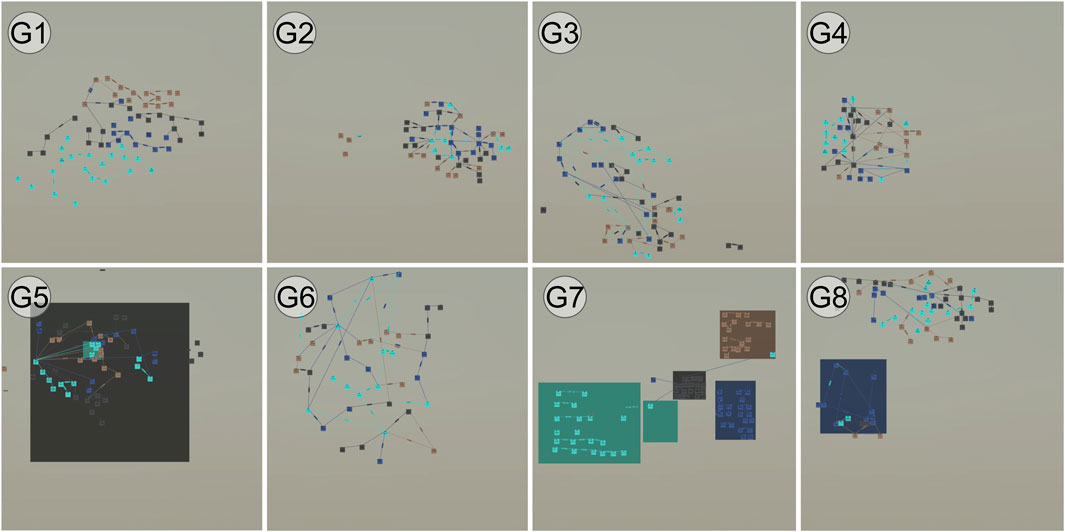
Figure 11. Canvas view of desktop system for groups. Objects are coloured the same as participants’ roles to show ownership and territories. The canvas colour is changed to a bright colour for better visualisation.
Figure 12 shows the cumulative movement of participants’ viewpoints over task period. In general the movement of desktop participants depends on their working strategies: G2, G4, and G5 ended up with a tight mind map so they moved a lot in the early stage of a task but kept still (no panning or zooming) in the later phase; G1, G3, G6 and G8 built more loose mind maps so they kept on navigating on the canvas; and G7 participants were sticking more to their own working territories. The pattern of VR participants’ movement shows that they were consistently moving regardless of the working territories. Also, it is interesting to see that the amount of movement tended to be equal among participants in a group in VR, while on desktop some participants moved much more (in G4, G5, G8) or much less (in G1, G7) than their collaborators.
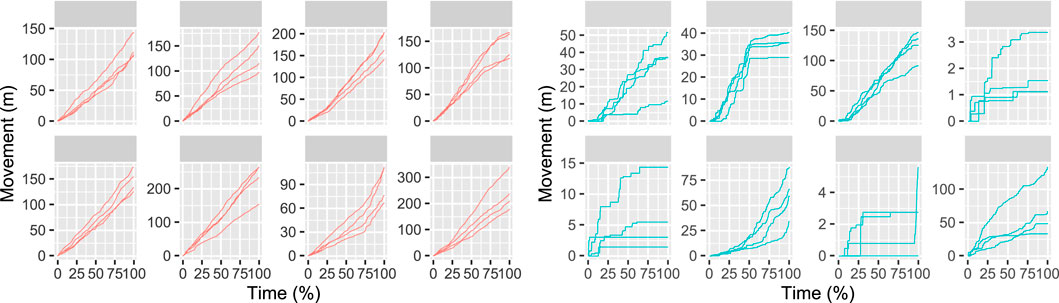
Figure 12. Line charts of participant viewpoint movement over time for groups in VR (left) and desktop (right). Each line represents a participant. The movement was calculated as a cumulative growth over time.
7 Discussion
In this section we consider the quantitative and qualitative results together to discuss and highlight the important findings, and then make design suggestions for future research and development of immersive mind map systems.
7.1 System design
About the overall system design, participants commented, “the mental map is easy to understand” and “it is useful to visualise a sequential story”. For example, after initially trying to solve the puzzle just by reading clues, G5 participants found out they could not do it without mind maps. Participants appreciated the colour coding of the notes, since “it allowed me to distinguish different types of nodes” (C2). Participants also noted “it was easy to communicate via the systems” and “it was clear to see who was involved” (C3). Overall, they commented “it was an interesting experience” and “it was fun to solve the problems and find the answers by interacting with each other”. They also commented that the system was “very enjoyable” and “useful in collaborative settings”, and can be “fostered for co-learning and collaborative activities”.
For the design of hand gestures, we adopted user-centred approaches from Piumsomboon et al. (2013), Huang et al. (2017), and Lee et al. (2021) to ensure intuitiveness for participants. Depending on the individual, participants took 15–30 min to learn the gestures and complete the training. During training and experimentation, we found that most gestures for creating and manipulating notes and links were easy for participants to learn and use, except for the deletion gestures, which resulted in several refinements. For example, some participants reported fatigue from performing the “scissor cutting” gesture (trialled in the baseline system study). This could be due to that the required finger movement seems unnatural and rarely used, so the fingers are not used to moving in this way. Some participants experienced difficulty with the “slicing” gesture (trialled in the third iteration), which required swiping a finger across objects to blade-slice them. We observed that participants often failed to maintain contact with the object during slicing. This gesture relied on depth perception, requiring extra attention to perform successfully. Regarding the final gestures after the iterative refinement, there was no negative feedback (C1), and participants commented “it was fun to perform these gestures”.
7.2 Sensemaking ability
The two tasks were different in nature. The murder task contained distracting clues (“red-herrings”), while the robbery task contained both distracting and non-factual clues that had to be resolved by identifying conflicts with other clues. Therefore, it seems participants needed a complete mind map to determine the faulty information. While only one group (G5) got 100% accuracy for robbery, who did not report having significant experience with crime puzzles, one explanation of their success could be that they had a clear organisation for the mind map. They used multiple 2D panels for different related information to build egocentric sub-mind maps—the only group that did so. Although it is natural to cluster documents, images or entities based on their meaning as discussed in previous work (Wenskovitch and North, 2020; Luo et al., 2022; Lisle et al., 2021), we were surprised that only one group used such organisation for collaborative mind-mapping in VR. We suspect the reason could be that when there were links between entities, organising and grouping information based on semantic meaning might be neglected in collaboration settings.
7.3 Mind-mapping in VR versus desktop
Here we discuss our findings on the differences between VR and desktop, integrating the measures analysis, subjective feedback and observations.
As presented in Section 5.4, participants in VR focused more on exchanging and debating puzzle-related information, whereas on desktop they spent more time discussing the organisation of the mind maps and rearranging or merging them (Section 6.1). This suggests that, participants concentrated more on problem solving in VR while in the desktop condition they paid closer attention to the mind maps themselves. As a result, participants produced less complete and more redundant mind maps in VR than on desktop (Section 5.1).
Several factors may explain why participant focused on different aspects during the collaborative mind-mapping activities in VR and on desktop, as discussed below.
Firstly, in VR it was easier to navigate and walk together in the space with embodied avatar presence. We observed that, participants in VR often pointed to subsections of the mind map and guided others to go there. One participant also commented, “I can see the avatars so we can follow each other”. In contrast, although participants with desktop still can use pointing to guide others for navigation, they need more verbal communication and efforts to do so. This also confirmed by data showing more equal amounts of movement within groups in VR than desktop, as presented in Section 6.2. Subsequently, participants on desktop tended to bring related portions of mind maps together and produce more compact mind maps to reduce navigation for easy discussion (their viewpoint movement was reduced in the later stage of a task as presented in Section 6.2). As a result, participants on desktop devote more time to mind map arrangement and merging.
On the other hand, as presented in Section 5.5, participants rated it more difficult to arrange mind maps in VR than on desktop. They commented that “manipulating the network takes some trial”. We also observed that they tried to avoid mind map rearrangement in VR. Interestingly, this is different to the findings from a study on sensemaking with image emotions (Yang et al., 2022), which showed that participants interacted with and repositioned images significantly more in VR than on desktop, even for trivial adjustments. We suspect that, while the links offered no actual resistance, their embodied representations appeared stiff and “heavy”, inhibiting the moving of the nodes to which they were attached. Consequently, participants rarely rearranged mind maps in VR, instead moving their bodies to trace and share information, leading their conversation to focus more on the tasks. This also explains the frequent behaviour we observed of participants destroying and recreating nodes and links over arranging them in VR (resulting in more mind map construction and more redundant and less complete mind maps).
Another perspective considers 3D versus 2D space for knowledge sharing and sensemaking through mind mapping. Participants noted that they preferred mind maps in VR over desktop (Section 5.5) as there were “fewer” overlaps between nodes and links in 3D space, whereas on desktop they needed to spend more time arranging the mind maps to reduce overlaps. As participants commented, in VR “the available three dimensions make arranging and scanning complex information very easy”, while on desktop the mind maps “could easily get messy and incomprehensible”. However, at the end VR received lower readability ratings than desktop (Section 5.5). In other words, 3D space mitigates occlusion as it intrinsically provides one extra dimension, but from certain angles, the view of a node and link may be blocked. Subsequently, it was difficult for participants to read all the nodes of immersive 3D mind maps from a single angle. Participants needed to share different perspectives to reach a consensus answer, leading to more information exchange and debate in VR.
Taken together, while the embodied avatar presence and immersive 3D space in VR offered easier concurrent navigation during collaboration, embodied object presence inhibited the interaction with objects. Consequently, participants preferred body movement in VR but moving objects instead on desktop. Also, 3D space in VR provided an additional dimension that “naturally removed” the overlaps of mind maps commonly occurring on 2D desktop interfaces, “saving” participants from arranging and merging mind maps in VR. As a result, participants with desktop spent more time arranging mind maps and discussing mind map organisation, while in VR they produced more duplicated, less complete and less readable mind maps, leading to greater engagement in verbal information sharing and debates.
7.4 Design implication
The biggest challenge of mind mapping for collaborative sensemaking in immersive environments is to effectively synthesise information among collaborators to build mutual understanding. To overcome the difficulty of mind map arrangement and reduce the physical demand of navigating through mind maps, which dramatically impacts the quality of mind maps and the effectiveness of knowledge sharing, we recommend that additional features such as automatic mechanisms should be adopted in future immersive mind map systems to facilitate mind map authoring and organisation. For example, (1) it would be valuable to have a feature that automatically brings up a relevant portion of the mind map to users when they mention related information during discussion (similar purpose to our clone indicator, but intelligently bringing more related mind map context into view), reducing the need for physical movement to view mind maps; (2) automatic layout adjustment features, such as removing the overlaps between nodes, are as important in VR as on desktop, but have additional subtlety, such as needing to be aware of users’ viewpoints, for example, to be able to dynamically detect node occlusions when users walk around and adjusting to make them readable from different angles; (3) features such as automatic sorting, grouping and merging of mind maps should also be considered, to save users’ effort in building and organising mind maps and help them produce high-quality mind maps. These features must be carefully designed to prevent user confusion when changes are applied to the mind maps.
7.5 Limitations and future work
Hand gestures provide embodied interactions, but current hardware has limited capability. Hand gestures need to be performed such that headset cameras can capture joint positions and finger movements. In addition, the hand-tracking capability of the headsets used was not completely stable. These limitations required attention and effort from participants to avoid unintended actions.
Our findings of the features added during iterations were mainly based on qualitative observations. These findings give suggestions and inform directions for future research on different aspects of collaborative mind-mapping systems. In the future, we plan to focus on collaborative awareness and gamification aspects separately, which have demonstrated benefits for sensemaking.
In addition, another future direction is to explore mechanisms to facilitate mind map authoring and organisation as discussed in Section 7.4.
8 Conclusion
In this paper, we presented a user study comparing collaborative mind mapping in VR and desktop, to investigate whether immersive environments support knowledge sharing and mutual understanding for sensemaking. We described the equivalent VR and desktop systems that we developed over four iterations using the RITE methodology to support the study.
The user study results showed that embodiment in VR offered both benefits and drawbacks in information sharing and integration. Embodied presence in VR enhanced social awareness for easy concurrent navigation through mind maps during collaboration, the absence of such presence on desktop made it harder to follow others and led participants to arrange and merge mind maps more to place related information closely. However, embodied interaction and mind-map element representation in VR caused difficulties in spatial arrangement, leading participants to duplicate items to avoid rearranging mind maps. While participants reported mind-mapping in VR was more physically demanding, they still preferred such immersive embodied environments and reported higher levels of engagement. The 3D space in VR provided an extra dimension, “saving” participants from arranging mind maps to remove overlaps between nodes and links, which was considered a burden on desktop. However, subsequently, participants produced 3D VR mind maps that were less complete and more redundant than 2D desktop mind maps, which also received lower readability ratings, leading to more frequent verbal information exchanges and debates on problems in VR.
As the first to explore spatial and embodied presence for knowledge sharing through mind maps, our results demonstrated that immersive mind mapping is beneficial for collaborative sensemaking. To address the drawbacks, we recommended automatic mind map authoring and organisation design be considered as a must-have mechanism in future immersive mind-mapping systems to better support knowledge sharing during collaborative sensemaking.
Data availability statement
The raw data supporting the conclusions of this article will be made available by the authors, without undue reservation.
Ethics statement
The studies involving humans were approved by Monash University Human Research Ethics Committee (MUHREC). The studies were conducted in accordance with the local legislation and institutional requirements. The participants provided their written informed consent to participate in this study.
Author contributions
YY: Conceptualization, Data curation, Formal Analysis, Investigation, Software, Validation, Visualization, Writing – original draft, Writing – review and editing. TD: Conceptualization, Funding acquisition, Methodology, Supervision, Writing – review and editing. ZS: Data curation, Formal Analysis, Visualization, Writing – review and editing. BL: Software, Visualization, Writing – review and editing. MW: Supervision, Writing – review and editing. MC: Writing – review and editing. TW: Data curation, Writing – review and editing. BT: Funding acquisition, Supervision, Writing – review and editing. MB: Funding acquisition, Supervision, Writing – review and editing.
Funding
The author(s) declare that financial support was received for the research and/or publication of this article. This research was supported under the Australian Research Council’s Discovery Projects funding scheme (DP180100755).
Acknowledgements
We would like to thank all of our user study participants for their time and feedback. We would also like to thank the reviewers for their valuable comments.
Conflict of interest
The authors declare that the research was conducted in the absence of any commercial or financial relationships that could be construed as a potential conflict of interest.
Generative AI statement
The author(s) declare that Generative AI was used in the creation of this manuscript. ChatGPT was used to check the grammar of the authors’ own text.
Any alternative text (alt text) provided alongside figures in this article has been generated by Frontiers with the support of artificial intelligence and reasonable efforts have been made to ensure accuracy, including review by the authors wherever possible. If you identify any issues, please contact us.
Publisher’s note
All claims expressed in this article are solely those of the authors and do not necessarily represent those of their affiliated organizations, or those of the publisher, the editors and the reviewers. Any product that may be evaluated in this article, or claim that may be made by its manufacturer, is not guaranteed or endorsed by the publisher.
Supplementary material
The Supplementary Material for this article can be found online at: https://www.frontiersin.org/articles/10.3389/frvir.2025.1570383/full#supplementary-material
Footnotes
2An early, work-in-progress presentation of our system and study was presented in a poster (Yang et al., 2024), see an anonymised version in the Supplementary Material S1.
References
Andrews, C., and North, C. (2012). “Analyst’s workspace: an embodied sensemaking environment for large, high-resolution displays,” in 2012 IEEE Conference on Visual Analytics Science and Technology (VAST) (IEEE), 123–131.
Andrews, C., Endert, A., and North, C. (2010). “Space to think: large high-resolution displays for sensemaking,” in Proceedings of the SIGCHI Conference on Human Factors in Computing Systems, 55–64. doi:10.1145/1753326.1753336
Ang, S., Rzadca, K., and Datta, A. (2010). “SharedMind: a tool for collaborative mind-mapping,” in 2010 IEEE International Conference on Multimedia and Expo (IEEE), 1154–1155.
Bailenson, J. N., Blascovich, J., Beall, A. C., and Loomis, J. M. (2003). Interpersonal distance in immersive virtual environments. Personality Soc. Psychol. Bull. 29, 819–833. doi:10.1177/0146167203029007002
Balakrishnan, A. D., Fussell, S. R., and Kiesler, S. (2008). “Do visualizations improve synchronous remote collaboration?,” in Proceedings of the SIGCHI Conference on Human Factors in Computing Systems, 1227–1236. doi:10.1145/1357054.1357246
Batch, A., Cunningham, A., Cordeil, M., Elmqvist, N., Dwyer, T., Thomas, B. H., et al. (2019). There is no spoon: evaluating performance, space use, and presence with expert domain users in immersive analytics. IEEE Trans. Vis. Comput. Graph. 26, 536–546. doi:10.1109/tvcg.2019.2934803
Bates, D., Mächler, M., Bolker, B., and Walker, S. (2014). Fitting linear mixed-effects models using lme4. arXiv preprint arXiv:1406.5823.
Block, F., Horn, M. S., Phillips, B. C., Diamond, J., Evans, E. M., and Shen, C. (2012). The DeepTree exhibit: visualizing the tree of life to facilitate informal learning. IEEE Trans. Vis. Comput. Graph. 18, 2789–2798. doi:10.1109/tvcg.2012.272
Bowman, D., Swiecki, Z., Cai, Z., Wang, Y., Eagan, B., Linderoth, J., et al. (2021). “The mathematical foundations of epistemic network analysis,” in Advances in quantitative ethnography. Editors A. R. Ruis, and S. B. Lee (Cham: Springer International Publishing), 91–105.
Bystrova, T., and Larionova, V. (2015). Use of virtual mind mapping to effectively organise the project activities of students at the university. Procedia-Social Behav. Sci. 214, 465–472. doi:10.1016/j.sbspro.2015.11.724
Chandler, T., Cordeil, M., Czauderna, T., Dwyer, T., Glowacki, J., Goncu, C., et al. (2015). “Immersive analytics,” in 2015 Big Data Visual Analytics (BDVA), Hobart, TAS, USA (IEEE), 1–8.
Chung, H., Yang, S., Massjouni, N., Andrews, C., Kanna, R., and North, C. (2010). “VizCept: supporting synchronous collaboration for constructing visualizations in intelligence analysis,” in 2010 IEEE Symposium on Visual Analytics Science and Technology (IEEE), 107–114.
Cohen, J. (1960). A coefficient of agreement for nominal scales. Educational and Psychological Measurement, 20 (1), 37–46. doi:10.1177/001316446002000104
Cordeil, M., Dwyer, T., Klein, K., Laha, B., Marriott, K., and Thomas, B. H. (2016). Immersive collaborative analysis of network connectivity: CAVE-style or head-mounted display? IEEE Trans. Vis. Comput. Graph. 23, 441–450. doi:10.1109/tvcg.2016.2599107
Del Gatto, M., Di Liberto, A., and Petraglia, C. (2011). Measuring productivity. J. Econ. Surv. 25, 952–1008. doi:10.1111/j.1467-6419.2009.00620.x
Eagan, B. R., Rogers, B., Serlin, R., Ruis, A. R., Arastoopour, G., and Shaffer, D. W. (2017). “Can we rely on reliability? Testing the assumptions of inter-rater reliability,” in Making a difference: prioritizing equity and access in CSCL: 12th international conference on computer-supported collaborative learning. Editors B. K. Smith, M. Borge, E. Mercier, and K. Y. Lim, 529–532.
Ens, B., Lanir, J., Tang, A., Bateman, S., Lee, G., Piumsomboon, T., et al. (2019). Revisiting collaboration through mixed reality: the evolution of groupware. Int. J. Human-Computer Stud. 131, 81–98. doi:10.1016/j.ijhcs.2019.05.011
Falconer, C. J., Slater, M., Rovira, A., King, J. A., Gilbert, P., Antley, A., et al. (2014). Embodying compassion: a virtual reality paradigm for overcoming excessive self-criticism. PloS one 9, e111933. doi:10.1371/journal.pone.0111933
Fallman, D. (2003). “Design-oriented human-computer interaction,” in Proceedings of the SIGCHI Conference on Human Factors in Computing Systems, 225–232. doi:10.1145/642611.642652
Faste, R. (1997). Mind mapping. Available online at: http://www.fastefoundation.org/publications/mind_mapping.pdf.
Faste, H., and Lin, H. (2012). “The untapped promise of digital mind maps,” in Proceedings of the SIGCHI Conference on Human Factors in Computing Systems, 1017–1026. doi:10.1145/2207676.2208548
Fisher, K., Counts, S., and Kittur, A. (2012). “Distributed sensemaking: improving sensemaking by leveraging the efforts of previous users,” in Proceedings of the SIGCHI Conference on Human Factors in Computing Systems, 247–256. doi:10.1145/2207676.2207711
Glaser, B. G., and Strauss, A. L. (1967). The discovery of grounded theory: strategies for qualitative research. Chicago: Aldine de Gruyter.
Goyal, N., Leshed, G., Cosley, D., and Fussell, S. R. (2014). “Effects of implicit sharing in collaborative analysis,” in Proceedings of the SIGCHI Conference on Human Factors in Computing Systems, 129–138. doi:10.1145/2556288.2557229
Gutwin, C., Penner, R., and Schneider, K. (2004). “Group awareness in distributed software development,” in Proceedings of the 2004 ACM Conference on Computer Supported Cooperative Work, 72–81. doi:10.1145/1031607.1031621
Guzzi, A., Bacchelli, A., Riche, Y., and Van Deursen, A. (2015). “Supporting developers’ coordination in the IDE,” in Proceedings of the 18th ACM Conference on Computer Supported Cooperative Work and Social Computing, 518–532. doi:10.1145/2675133.2675177
Hamari, J., Koivisto, J., and Sarsa, H. (2014). “Does gamification work? – a literature review of empirical studies on gamification,” in 2014 47th Hawaii International Conference on System Sciences (IEEE), 3025–3034.
Harms, C., and Biocca, F. (2004). “Internal consistency and reliability of the networked minds measure of social presence,” in Proceedings of the 7th Annual International Workshop: Presence, 1–7.
Hart, S. G., and Staveland, L. E. (1988). Development of NASA-TLX (task load index): results of empirical and theoretical research. Adv. Psychol. 52, 139–183. doi:10.1016/s0166-4115(08)62386-9
Higuchi, K., Chen, Y., Chou, P. A., Zhang, Z., and Liu, Z. (2015). “ImmerseBoard: immersive telepresence experience using a digital whiteboard,” in Proceedings of the 33rd Annual ACM Conference on Human Factors in Computing Systems, 2383–2392. doi:10.1145/2702123.2702160
Huang, Y.-J., Fujiwara, T., Lin, Y.-X., Lin, W.-C., and Ma, K.-L. (2017). “A gesture system for graph visualization in virtual reality environments,” in 2017 IEEE Pacific Visualization Symposium (PacificVis) (IEEE), 41–45.
Jacob, R. J., Girouard, A., Hirshfield, L. M., Horn, M. S., Shaer, O., Solovey, E. T., et al. (2008). “Reality-based interaction: a framework for Post-WIMP interfaces,” in Proceedings of the SIGCHI Conference on Human Factors in Computing Systems, 201–210. doi:10.1145/1357054.1357089
Jung, J., Schneider, C., and Valacich, J. (2010). Enhancing the motivational affordance of information systems: the effects of real-time performance feedback and goal setting in group collaboration environments. Manag. Sci. 56, 724–742. doi:10.1287/mnsc.1090.1129
Kuták, D., Doležal, M., Kerous, B., Eichler, Z., Vašek, J., and Liarokapis, F. (2019). An interactive and multimodal virtual mind map for future workplace. Front. ICT 6, 14. doi:10.3389/fict.2019.00014
Kuznetsova, A., Brockhoff, P. B., and Christensen, R. H. (2017). lmerTest package: tests in linear mixed effects models. J. Stat. Softw. 82, 1–26. doi:10.18637/jss.v082.i13
Laine, T. H., and Suk, H. J. (2024). Investigating user experience of an immersive virtual reality simulation based on a gesture-based user interface. Appl. Sci. 14 (11), 4935. doi:10.3390/app14114935
Lee, B., Hu, X., Cordeil, M., Prouzeau, A., Jenny, B., and Dwyer, T. (2020). Shared surfaces and spaces: collaborative data visualisation in a Co-located immersive environment. IEEE Trans. Vis. Comput. Graph. 27, 1171–1181. doi:10.1109/tvcg.2020.3030450
Lee, J. H., Ma, D., Cho, H., and Bae, S.-H. (2021). “Post-Post-it: a spatial ideation system in VR for overcoming limitations of physical Post-it notes,” in Extended Abstracts of the 2021 CHI Conference on Human Factors in Computing Systems, 1–7. doi:10.1145/3411763.3451786
Lisle, L., Davidson, K., Gitre, E. J., North, C., and Bowman, D. A. (2021). “Sensemaking strategies with immersive space to think,” in 2021 IEEE Virtual Reality and 3D User Interfaces (VR) (IEEE), 529–537.
Lisle, L., Davidson, K., Gitre, E. J., North, C., and Bowman, D. A. (2023). Different realities: a comparison of augmented and virtual reality for the sensemaking process. Front. Virtual Real. 4, 1177855. doi:10.3389/frvir.2023.1177855
Luo, W., Lehmann, A., Widengren, H., and Dachselt, R. (2022). “Where should we put it? Layout and placement strategies of documents in augmented reality for collaborative sensemaking,” in CHI Conference on Human Factors in Computing Systems, 1–16. doi:10.1145/3491102.3501946
Mahyar, N., and Tory, M. (2014). Supporting communication and coordination in collaborative sensemaking. IEEE Trans. Vis. Comput. Graph. 20, 1633–1642. doi:10.1109/tvcg.2014.2346573
[Dataset] Marquart, C. L., Swiecki, Z., Collier, W., Eagan, B. R., Woodward, R., and Shaffer, D. W. (2019). rENA: epistemic network analysis. R package.
Marriott, K., Schreiber, F., Dwyer, T., Klein, K., Riche, N. H., Itoh, T., et al. (2018). Immersive analytics. Springer.
Medlock, M. C., Wixon, D., McGee, M., and Welsh, D. (2005). “The rapid iterative test and evaluation method: better products in less time,” in Cost-justifying usability (Elsevier), 489–517.
Miyasugi, M., Akaike, H., Nakayama, Y., and Kakuda, H. (2017). “Implementation and evaluation of multi-user mind map authoring system using virtual reality and hand gestures,” in 2017 IEEE 6th Global Conference on Consumer Electronics (GCCE) (IEEE), 1–5.
Pejsa, T., Kantor, J., Benko, H., Ofek, E., and Wilson, A. (2016). “Room2Room: enabling life-size telepresence in a projected augmented reality environment,” in Proceedings of the 19th ACM Conference on Computer-Supported Cooperative Work and Social Computing, 1716–1725. doi:10.1145/2818048.2819965
Piumsomboon, T., Clark, A., Billinghurst, M., and Cockburn, A. (2013). “User-defined gestures for augmented reality,” in IFIP Conference on Human-Computer Interaction (Springer), 282–299.
Piumsomboon, T., Lee, G. A., Hart, J. D., Ens, B., Lindeman, R. W., Thomas, B. H., et al. (2018). “Mini-me: an adaptive avatar for mixed reality remote collaboration,” in Proceedings of the 2018 CHI Conference on Human Factors in Computing Systems, 1–13. doi:10.1145/3173574.3173620
Raja, D., Bowman, D., Lucas, J., and North, C. (2004). Exploring the benefits of immersion in abstract information visualization. Proceedings Immersive Projection Technology Workshop 61–69.
Sarker, B. K., Wallace, P., and Gill, W. (2008). Some observations on mind map and ontology building tools for knowledge management. Ubiquity 2008, 1–9. doi:10.1145/1366313.1353570
Satriadi, K. A., Ens, B., Cordeil, M., Czauderna, T., and Jenny, B. (2020). Maps around me: 3D multiview layouts in immersive spaces. Proc. ACM Human-Computer Interact. 4, 1–20. doi:10.1145/3427329
Seaborn, K., and Fels, D. I. (2015). Gamification in theory and action: a survey. Int. J. Human-Computer Stud. 74, 14–31. doi:10.1016/j.ijhcs.2014.09.006
Shepherd, M. M., Briggs, R. O., Reinig, B. A., Yen, J., and Nunamaker Jr, J. F. (1995). Invoking social comparison to improve electronic brainstorming: beyond anonymity. J. Manag. Inf. Syst. 12, 155–170. doi:10.1080/07421222.1995.11518095
Sims, R., and Karnik, A. (2021). “VERITAS: mind-mapping in virtual reality,” in 2021 7th International Conference of the Immersive Learning Research Network (iLRN) (IEEE), 1–8.
Stoyanov, S., and Kommers, P. (2006). WWW-intensive concept mapping for metacognition in solving ill-structured problems. Int. J. Contin. Eng. Educ. Life-Long. 16, 297–316. doi:10.1504/IJCEELL.2006.009205
Swiecki, Z., Ruis, A. R., Farrell, C., and Shaffer, D. W. (2020). Assessing individual contributions to collaborative problem solving: a network analysis approach. Comput. Hum. Behav. 104, 105876. doi:10.1016/j.chb.2019.01.009
Tahmid, I. A., Lisle, L., Davidson, K., North, C., and Bowman, D. A. (2022). “Evaluating the benefits of explicit and semi-automated clusters for immersive sensemaking,” in 2022 IEEE International Symposium on Mixed and Augmented Reality (ISMAR) (IEEE), 479–488.
Tang, A., Neustaedter, C., and Greenberg, S. (2007). “VideoArms: embodiments for mixed presence groupware,” in People and computers XX — engage. Editors N. Bryan-Kinns, A. Blanford, P. Curzon, and L. Nigay (London: Springer London), 85–102. doi:10.1007/978-1-84628-664-3_8
Tolman, E. C. (1948). Cognitive maps in rats and men. Psychol. Rev. 55, 189–208. doi:10.1037/h0061626
Toney, A., and Thomas, B. (2006). “Considering reach in tangible and table top design,” in First IEEE International Workshop on Horizontal Interactive Human-Computer Systems (TABLETOP’06), 57–58. doi:10.1109/TABLETOP.2006.9
Tong, W., Xia, M., Wong, K. K., Bowman, D. A., Pong, T.-C., Qu, H., et al. (2023). “Towards an understanding of distributed asymmetric collaborative visualization on problem-solving,” in 2023 IEEE Conference Virtual Reality and 3D User Interfaces (VR) (IEEE), 387–397.
Tuddenham, P., and Robinson, P. (2009). “Territorial coordination and workspace awareness in remote tabletop collaboration,” in Proceedings of the SIGCHI Conference on Human Factors in Computing Systems, 2139–2148. doi:10.1145/1518701.1519026
Voigt-Antons, J.-N., Kojic, T., Ali, D., and Möller, S. (2020). “Influence of hand tracking as a way of interaction in virtual reality on user experience,” in 2020 Twelfth International Conference on Quality of Multimedia Experience (QoMEX). (Athlone, Ireland: IEEE), 1–4. doi:10.1109/QoMEX48832.2020.9123085
Wagner Filho, J. A., Stuerzlinger, W., and Nedel, L. (2019). Evaluating an immersive space-time cube geovisualization for intuitive trajectory data exploration. IEEE Trans. Vis. Comput. Graph. 26, 514–524. doi:10.1109/tvcg.2019.2934415
Waldner, M., Geymayer, T., Schmalstieg, D., and Sedlmair, M. (2021). Linking unstructured evidence to structured observations. Inf. Vis. 20, 47–65. doi:10.1177/1473871620986249
Wenskovitch, J., and North, C. (2020). An examination of grouping and spatial organization tasks for high-dimensional data exploration. IEEE Trans. Vis. Comput. Graph. 27, 1742–1752. doi:10.1109/tvcg.2020.3028890
Witmer, B. G., and Singer, M. J. (1998). Measuring presence in virtual environments: a presence questionnaire. Presence 7, 225–240. doi:10.1162/105474698565686
Wozniak, P., Goyal, N., Kucharski, P., Lischke, L., Mayer, S., and Fjeld, M. (2016). “RAMPARTS: supporting sensemaking with spatially-aware mobile interactions,” in Proceedings of the 2016 CHI Conference on Human Factors in Computing Systems, 2447–2460. doi:10.1145/2858036.2858491
Yang, Y., Dwyer, T., Marriott, K., Jenny, B., and Goodwin, S. (2020). Tilt map: interactive transitions between choropleth map, prism map and bar chart in immersive environments. IEEE Trans. Vis. Comput. Graph. 27, 4507–4519. doi:10.1109/tvcg.2020.3004137
Yang, Y., Dwyer, T., Wybrow, M., Lee, B., Cordeil, M., Billinghurst, M., et al. (2022). Towards immersive collaborative sensemaking. Proc. ACM Human-Computer Interact. 6, 722–746. doi:10.1145/3567741
Yang, Y., Dwyer, T., Swiecki, Z., Lee, B., Wybrow, M., Cordeil, M., et al. (2024). “Putting our minds together: iterative exploration for collaborative mind mapping,” in Augmented Humans International Conference, 255–258. doi:10.1145/3652920.3653043
Yeh, S.-C., Wu, E. H.-K., Lee, Y.-R., Vaitheeshwari, R., and Chang, C.-W. (2022). User experience of virtual-reality interactive interfaces: a comparison between hand gesture recognition and joystick control for XRSPACE MANOVA. Appl. Sci. 12 (23), 12230. doi:10.3390/app122312230
Zhao, J., Glueck, M., Isenberg, P., Chevalier, F., and Khan, A. (2017). Supporting handoff in asynchronous collaborative sensemaking using knowledge-transfer graphs. IEEE Trans. Vis. Comput. Graph. 24, 340–350. doi:10.1109/tvcg.2017.2745279
Zillner, J., Rhemann, C., Izadi, S., and Haller, M. (2014). “3D-Board: a whole-body remote collaborative whiteboard,” in Proceedings of the 27th annual ACM symposium on User interface software and technology, 471–479. doi:10.1145/2642918.2647393
Keywords: virtual reality, collaborative sensemaking, embodiment, hand gesture, user studies
Citation: Yang Y, Dwyer T, Swiecki Z, Lee B, Wybrow M, Cordeil M, Wulandari T, Thomas BH and Billinghurst M (2025) Desktop versus VR for collaborative sensemaking. Front. Virtual Real. 6:1570383. doi: 10.3389/frvir.2025.1570383
Received: 03 February 2025; Accepted: 06 October 2025;
Published: 11 November 2025.
Edited by:
Xubo Yang, Shanghai Jiao Tong University, ChinaCopyright © 2025 Yang, Dwyer, Swiecki, Lee, Wybrow, Cordeil, Wulandari, Thomas and Billinghurst. This is an open-access article distributed under the terms of the Creative Commons Attribution License (CC BY). The use, distribution or reproduction in other forums is permitted, provided the original author(s) and the copyright owner(s) are credited and that the original publication in this journal is cited, in accordance with accepted academic practice. No use, distribution or reproduction is permitted which does not comply with these terms.
*Correspondence: Ying Yang, eWluZy55YW5nQG1vbmFzaC5lZHU=