 Jean Felipe Patikowski Cheiran
 Denise Ruschel Bandeira
 Marcelo Soares Pimenta
- 1Federal University of Pampa, Alegrete, Brazil
- 2Institute of Informatics, Federal University of Rio Grande do Sul, Porto Alegre, Brazil
- 3Institute of Psychology, Federal University of Rio Grande do Sul, Porto Alegre, Brazil
Researchers and practitioners frequently employ questionnaires to evaluate the User Experience (UX) mainly due to their cost-effectiveness, systematic nature, and ease of application. However, the use of questionnaires may be constrained by the availability of standardized instruments and the psychometric quality of the questionnaires. This paper presents the index of User Experience in immersive Virtual Reality (iUXVR), a questionnaire designed to measure key aspects of User Experience in immersive Virtual Reality (VR) environments based on the Components of User Experience framework. The questionnaire comprises seven-point Likert-like statements divided into five components: usability, sense of presence, aesthetics, VR sickness, and emotions. The development of the iUXVR was based on a content analysis of existing questionnaires, followed by an expert review and a pilot study. The iUXVR was applied in an experiment that collected 126 thoroughly answered questionnaires. The PLS-SEM analysis identified items with low factor loadings and low explained variance that have been removed from the questionnaire. The questionnaire presented good indicator loadings and adequate reliability estimates even though the items from aesthetics and emotions components are substantially correlated. The structural model suggests that VR sickness does not play an important role in the overall UX, even though it affects users’ emotions. On the other hand, the aesthetic experience, which is often neglected in UX models for VR environments, is essential in this context due to its strong relationship with emotions and UX. Furthermore, the sense of presence has less influence on the UX than usability, aesthetics, and emotions. Finally, the validity-supporting evidence is sufficient for exploratory research, substantiating consistent key aspects of the User Experience in immersive VR.
1 Introduction
Virtual Reality (VR) technologies and principles have advanced significantly in the last five decades (Vince, 1995), recently experiencing a renaissance as immersive VR technology has become cheaper and better. Affordable headset-based VR devices have accelerated this revival in both industrial and academic fields, mainly because they provide a high degree of immersion through a wide field of view, high resolution, and advanced tracking technology (Kim et al., 2020). Since VR aims to convince one that they are somewhere else, it encompasses different components of experience, such as the illusion of presence (including both psychological and physiological states) to modify human perception and VR sickness as a collection of symptoms and effects related to physical discomfort (Jerald, 2016). These particular aspects of VR, along with common elements of the experience, are part of a broader concept: the User Experience (UX).
The UX is usually defined as the “user’s perceptions and responses that result from the use and/or anticipated use of a system, product or service” (ISO, 2019). However, the concept of UX varies depending on the theoretical background of experts. The definitions collected by Law et al. (2009) include the UX as (1) all aspects of the users’ interaction with the company and its services and products, or (2) the consequence of the user’s inner state, the system’s features, and the interaction context, or (3) the entire set of affects involving aesthetics, meaning, and emotions that arise from the interaction, or even (4) the value derived from the expectation or interaction with something in a particular context. Furthermore, the approaches for measuring may also consider the experience over time (Karapanos et al., 2009) and different granularity levels (Roto, 2007). Even though experts are skeptical about the measurement of the UX (Law et al., 2014), assessing the UX of a product refers to an extensive collection of methods, skills, and tools to evaluate how a person feels and perceives this product before, during, and after interacting with it.
Researchers and practitioners use different methods to properly evaluate the user experience, e.g., physiological measures (Bian et al., 2016), questionnaires, interviews, and observation (Barbosa et al., 2021). While the devices for measuring many physiological signals can be expensive and the interview/observation techniques demand experimenter training, questionnaires are cheap and require almost no special skills. Moreover, the assessment of the psychometric qualities of questionnaires allows gathering theoretical and empirical evidence to reinforce validity (the support for the interpretation of questionnaire scores for proposed uses) and reliability (the consistency of scores across replications of an evaluation procedure) (AERA, 2014). These questionnaires designed for repeated use and containing well-defined interpretation rules are called standardized questionnaires (Sauro and Lewis, 2016).
Standardized questionnaires and scales are widely used to assess the experience in virtual environments (Chang et al., 2020; Grassini and Laumann, 2020; Kim et al., 2020). However, VR researchers often must choose between employing multiple questionnaires targeting particular components (e.g., usability, presence, or VR sickness) or relying on a single general-purpose UX questionnaire. The issues with the first strategy include the potential noise due to the cognitive load required to respond to many questionnaires with distinct structures and the ad hoc technique of combining the scores from different instruments to depict the comprehensive UX. On the other hand, the latter approach usually lacks information about crucial VR components since these general questionnaires are designed to assess only the common aspects of interactive software. The few questionnaires crafted for assessing the holistic UX in VR and their weaknesses are detailed in Section 2.
This paper describes the development of the index of User Experience in immersive Virtual Reality (iUXVR), a questionnaire for assessing the key components of User Experience in immersive Virtual Reality environments based on the Components of User Experience (CUE) framework (Mahlke, 2008). It also presents relevant validity-supporting evidence and reliability estimates for the questionnaire, as well as the analysis of the hypothesized model derived from the CUE.
This research was approved by the Research Ethics Board of the Federal University of Rio Grande do Sul (CAAE 53245721.1.0000.5347) and followed all regulations for studies involving people.
2 Related work
The early standardized questionnaires for Human-Computer Interaction (HCI) evaluation were developed in the ‘70s and ‘80s and focused on user satisfaction and technology acceptance (LaLomia and Sidowski, 1990). Since then, researchers have tried to develop new instruments with a better psychometric quality covering a wide range of interaction aspects in different contexts.
Many review studies on user experience evaluation mapped the main standardized questionnaires for general use (Vermeeren et al., 2010; Maia and Furtado, 2016; Rivero and Conte, 2017; Darin et al., 2019; Diaz-Oreiro et al., 2019; Nur et al., 2021) or standardized questionnaires for VR applications (Kim et al., 2020; Marques et al., 2024).
We call attention to popular standardized questionnaires focused on broader concepts of UX: AttrakDiff (Hassenzahl et al., 2003), HED/UT Scale (der Heijden and Sørensen, 2003), UEQ (Schrepp et al., 2014), and meCUE (Minge et al., 2016). All of them measure UX through multidimensional factors: hedonic and pragmatic dimensions with their sub-factors (UEQ and AttrakDiff), hedonic and utilitarian dimensions (HED/UT), and perceptions, emotions, and consequences with their sub-factors (meCUE). Despite their good psychometric quality, we could not find any evaluation of these questionnaires in Virtual Reality contexts to provide additional validity evidence and reliability estimations. Without such information, it is not possible to guarantee that they preserve their intended structure when used to assess users’ experiences in VR environments, or that they cover particular elements of VR experiences (VR sickness, presence, realism, and others), so researchers usually narrow their options to a smaller set of more specialized instruments.
Researchers can also count on domain-specific questionnaires to evaluate VR content. Instruments to assess the player experience are particularly popular when the VR stimulus is indeed a game. For example, the PENS satisfaction questionnaire (Ryan et al., 2006) focuses on gaming as a self-regulating experience to fulfill some needs. Another common option is the GEQIJ of Poels et al. (2007) that focuses on core components that build the psychological state while gaming: competence, immersion, flow, tension, challenge, negative affect, and positive affect. Finally, the PXI (Abeele et al., 2020) is based on the Means-End theory and covers ten components related to the functional and psychosocial consequences of gaming. Since these instruments are grounded on theories for the gaming context, they are not adequate for any VR experience because some components or items would be irrelevant. For instance, the immersive experiences of a VR theater, a visualization tool for VR analytics, and a rehabilitation VR application do not aim for entertainment and, therefore, would not value the dimensions of challenge, tension, or narrative. Again, although these instruments present good psychometric proprieties, they usually do not cover the VR sickness symptoms and simultaneously include dimensions beyond the core components of immersive VR experiences.
There is no consensus about the components that should be included in the UX assessment for Virtual Reality environments since it depends on the theoretical assumptions about the UX itself. The available UX models for VR have some components in common (presence and flow), but the connections between the elements are entirely different.
The model proposed by Shin et al. (2013) is based on the Expectation-Confirmation Theory and the Technology Acceptance Model to evaluate 3D virtual learning environments. The questionnaire proposed by the authors is based on other standardized questionnaires and includes seven components of UX divided into four groups: experiential factors (immersion and presence), cognitive factors (perceived usefulness, perceived ease of use, and confirmation), affective factor (satisfaction), and facilitating factor (intention of use). While most of these concepts are straightforward, it is worth mentioning that the immersion component covers the notion of flow in this study, and the confirmation component represents the extent to which the user’s expectations are met or exceeded during the interaction. Although all components present good psychometric quality and contribute to UX evaluation, we notice that VR sickness is not present. It is understandable because the structural model does not intend to verify the effect of this component, and the VR stimulus in the study is a non-immersive 3D learning system accessed through a 3D TV. The aesthetic experience is not evaluated, either. Furthermore, the perceived usefulness is frequently assessed in a serious context where the application is a means to an end (in this case, the 3D learning environment is a way of studying or a bridge between content and learning) and seems less critical for general VR software.
The model of Cheng et al. (2014) is designed to examine the UX in VR markets using the flow theory and other surrounding UX-related components. The ten components of the questionnaire are divided into four stages: media content variables (interactivity, involvement, and vividness), antecedents of the flow state (skill, challenge, and focused attention), flow state (flow and telepresence), and consequences of flow (positive affect and loyalty). As the more unusual components, we point out the interactivity that is similar to software responsiveness, the involvement that includes items related to pleasure and interest, and the vividness related to the consistency and realism of the sensory experience. Again, we observe that VR sickness is neglected in the questionnaire because it is hypothesized that it is an antecedent of flow even if participants played a VR game in a six-axis simulator during the studies. Usability and aesthetics are also under-represented in the questionnaire. The questionnaire presents good psychometric properties, although the metrics for discriminant validity are unusual (Hair et al., 2021; Russo and Stol, 2021). The response pattern is different for some items, which may confuse respondents: most items use a 7-point Likert-like response range, but some items are based on a semantic differential space (unhappy/happy, melancholic/contented, etc.). Finally, the questionnaire includes two items related to flow that rely on a massive block of text explaining the complex concept of flow. Since the last sentence of the instructions for the flow items is “Flow has been described as an intrinsically enjoyable experience,” it could also contribute to the objective evaluation of enjoyment instead of flow.
It is worth noting that the previous studies (Cheng et al., 2014; Shin et al., 2013) do not intend to develop standardized questionnaires for measuring the UX in VR environments, but they effectively did that as part of the process of estimating structural model parameters to test hypotheses.
On the contrary, the main objective of Tcha-Tokey et al. (2016), Tcha-Tokey et al. (2018) is to build a questionnaire to assess the holistic UX, combining previous theories and models. The extensive set of components of the questionnaire comprises presence, immersion, engagement, flow, skill, emotion, technology adoption, judgment, and experience consequence. The usability component was removed from the questionnaire because of reliability estimation issues. It is relevant to notice that some component names are somewhat misleading, such as the experience consequence that involves only VR sickness symptoms and judgment that comprises attractiveness, pragmatic quality, and hedonic quality. Nonetheless, the questionnaire for assessing the User Experience in Immersive Virtual Environment is comprehensive and presents reasonable psychometric properties. Even the removed usability component is compensated by items related to pragmatic qualities from the judgment component. However, there are some urgent considerations that must be taken into account before using this questionnaire: there are different response patterns that may cause confusion (most items use a 10-point Likert-like response range, but some items are based on a semantic differential space), there is considerable overlapping among the items (for example, “Q31. I felt I was experiencing an exciting moment” regarding flow, “Q39. It was so exciting that I could stay in the virtual environment for hours” regarding emotions, and “59B. I found that this virtual environment was: lame … exciting” regarding judgment), and there are two competing questionnaire versions with distinct items and different psychometric properties (Tcha-Tokey et al. 2016; Tcha-Tokey et al. 2018). More critically, there is no evidence of convergent and discriminant validity in either version of the questionnaire, the significance of each item to UX is unclear (e.g., based on items loading), and the unbalanced number of items in each sub-scale makes it even more challenging to identify proper scoring. Finally, this study stands out for using a head-mounted display (HMD) as an immersive VR device, even though the only stimulus is an educational VR game.
3 Questionnaire proposal
The creation of the index of User Experience in immersive Virtual Reality was based on the following steps that are further detailed.
1. Identification of key components of VR experiences
2. Creation of the item pool and evaluation by experts
3. Pilot experiment
4. Main experiment
The iUXVR draws on the Components of User Experience framework proposed by Mahlke (2008) and the structure of the meCUE questionnaire (Minge et al., 2016). The structural model of the iUXVR incorporates five components (usability, aesthetics, sense of presence, VR sickness, and emotions), expanding and specializing the original three CUE components (instrumental qualities, non-instrumental qualities, and emotional reactions) (Mahlke, 2008).
Usability frequently emerges as a key focus in VR research, and it is related to how users interact with a product to achieve goals in the context of use (ISO, 2018). Considering the common qualities described by usability experts (ISO, 2018; Nielsen, 1993; Preece et al., 2015), the iUXVR structural model includes items from three usability factors: learnability (the effort for new users to master the product), efficiency (the performance and the amount of resources used in relation to the outcome), and efficacy (the accuracy, the completeness, and the error-free experience while users try to achieve goals).
The Aesthetics component reflects a complex phenomenon that involves aesthetic appreciation and stimulus. The visual aesthetics and stimulation factors in this research are related respectively to the classical aesthetics (the classic notions of aesthetic design) and the expressive aesthetics (the richness that is a reflection of the designers’ creativity and originality) described by Lavie and Tractinsky (2004). While visual aesthetics is clearly part of classical aesthetics, the stimulation is considered part of expressive aesthetics based on substantial correlations between expressive aesthetics and similar constructs, such as engagement (Hartmann et al., 2008) and arousal (Porat and Tractinsky, 2012).
Furthermore, the emotions are “the conscious experience of affect, complete with attribution of its cause and identification of its object” (Norman, 2004) that can be mapped into a small set of basic feelings (Izard, 1977; Izard, 2007). Unlike the dimensional perspective involving positive and negative emotions (Minge et al., 2016), we propose that the basic feelings approach might help VR software developers tune score procedures according to the intended experience. For instance, the emotion of ‘fear’ is expected in a horror VR game experience and thus positively contributes to the UX.
The Sense of Presence represents the subjective experience of being in one place while physically situated in another (Witmer and Singer, 1998). Considering the theoretical framework proposed by Slater (2009), there are two main factors for the presence component regarding the subjective experience: the illusion of place (“the strong illusion of being in a place in spite of the sure knowledge that you are not there”) and the illusion of plausibility (“the overall credibility of the scenario being depicted in comparison with expectations”).
Finally, the VR Sickness component defines a collection of unpleasant virtual reality-induced symptoms and effects, including stomach awareness, headache, and dizziness (Cobb et al., 1999). This phenomenon is extensively investigated by the VR scientific community (Chang et al., 2020; Davis et al., 2014; Martirosov and Kopecek, 2017) even if the causes of VR sickness remain debatable.
Based on these components, we proposed a two-level measurement model (Becker et al., 2012) as shown in Figure 1. The lower level components (usability, presence, aesthetics, VR sickness, and emotions) are reflective constructs, i.e., the items of the questionnaire regarding that factor reflect the variation of a psychological latent variable and share the same theme (Coltman et al., 2008). The
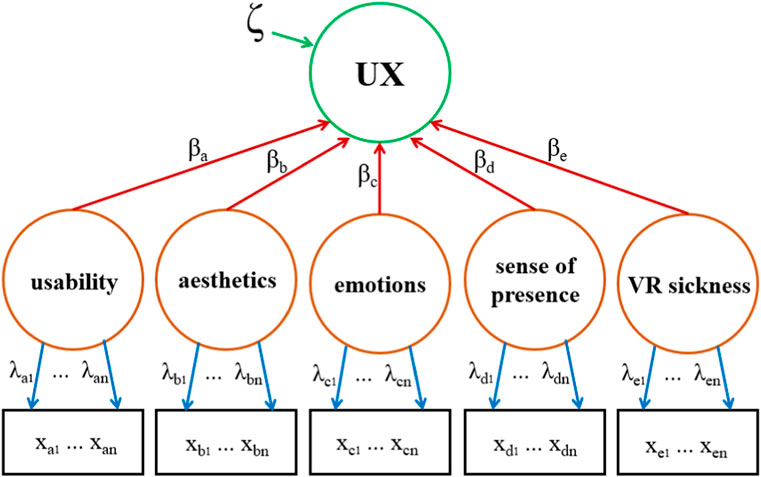
Figure 1. Measurement model of the iUXVR.
3.1 Building the questionnaire
One researcher conducted a content analysis (Moraes, 1999) by reviewing 47 questionnaires and scales related to User Experience, usability, presence, aesthetics, emotions, VR sickness, and other relevant components.
The questionnaires considered for the analysis were collected from review studies on usability (Sauro, 2015; Assila et al., 2016), presence (Grassini and Laumann, 2020; Souza et al., 2022), VR sickness (Martirosov and Kopecek, 2017; Chang et al., 2020), aesthetics (Lima and Wangenheim, 2022), and the overall UX (referenced in Section 2). The instruments with the highest number of citations on Google Scholar and Scopus were selected for this step. Moreover, this analysis did not include questionnaires and scales developed for domain-specific applications, e.g., instruments for assessing game experience.
Additionally, the content analysis included instruments identified in a mapping study on questionnaires and scales used to assess the UX in immersive VR environments. Notably, the instruments proposed by Shin et al. (2013), Cheng et al. (2014), and Tcha-Tokey et al. (2016) were included. In this case, no exclusion criteria based on citation count were applied. The analysis broke down the instruments into 693 information units. While most of these units correspond to a single item from the questionnaires, some were split into two or more units. This was particularly true for items derived from questionnaires based on the semantic differential theory (each pole of the semantic space represents one distinct unit). Furthermore, these units were also grouped into 155 categories. The theme of each category emerged according to its content, leading to the creation of an initial set of 148 items divided into questionnaire factors. Each item comprises a statement in Brazilian Portuguese and a 7-point Likert-like response range that is fully labeled and numbered (Figure 2).
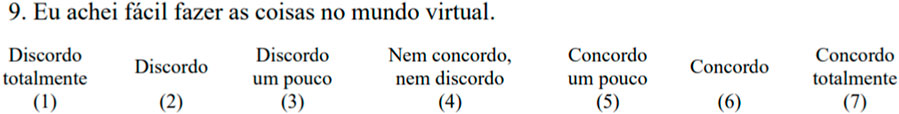
Figure 2. Example of an item from the iUXVR.
3.2 Experts evaluation
Four experts and experienced researchers in User Experience and Virtual Reality evaluated the 148 items from the previous step. Each item was scored by two experts regarding its relevance to the UX assessment and text quality (ambiguity, vagueness, unnecessary text complexity, and use of regionalisms are some of the elements considered by the experts). The experts also recommended changing the factor of some items, new wording, and new items.
Notably, the fine-tuning of wording and structure reduces the use of technical terminology and allow people with different educational background. Also, the evaluation of item relevance and quality increases the representativeness of the chosen items.
3.3 Pilot study
The initial version of the iUXVR was applied in a pilot study using the same setup as the main experimental sessions described in Section 3.4. Seven participants answered the out-VR questionnaire after using VR applications and were debriefed on the instructions and items. We used printed versions of the questionnaire with different designs during the pilot study to identify the more adequate structure.
Participants were recruited through convenience sampling, including individual invitations to research group members and acquaintances. This strategy guarantees more control over the diversity of participant experiences (age, educational background, and experience with immersive VR) and does not undermine the research’s validity in a pilot study phase.
The participants varied in age (from 23 to 57 years old), education (from complete high school to a PhD. degree), and experience with immersive VR (from no experience at all to frequent use).
Besides the Consent Form, a Screening Form was presented at the beginning of each experimental session, aiming to keep sensitive people from participating, according to the equipment manual. This was the only exclusion criteria for participants. The same procedures were used in the main experiment.
In addition to observing participants as they responded to the iUXVR, each pilot experimental session was followed by an unstructured interview focusing on the structure and wording of the items, as well as the overall layout of the questionnaire.
The observations were documented through the researcher’s notes, which provided insights mainly regarding the layout used in the first version of the iUXVR. The initial grid structure of the questionnaire led to frequent mistakes, as respondents often marked their answers on the wrong row. To mitigate this problem, a more expanded layout with clearly separated items and response ranges was created despite the increased number of pages required for the printed questionnaire.
The analysis of the interviews improved the clarity and comprehensibility of the items for participants with different backgrounds. For example, the improved version of the iUXVR used bold text for the words no and not, and replaced the words stylish and upset with elegant and frustrated to be more easily understood in Portuguese. Also, one item was rewritten entirely based on participants’ feedback: “I feel like I’ve just returned from a trip after my experience in the virtual world ended” was replaced with “I feel like the virtual world is a place where I have actually been.”
3.4 Main experiment
Sixty-three people (41 self-identified as male, 21 as female, and one did not disclose their gender), aged between 18 and 56 (M = 21.53, SD = 5.64, Mdn = 20), agreed to participate in the study after being recruited through social networks, e-mail lists, flyers posted on bulletin boards, and word-of-mouth invitations. Concerning the participants’ formal education, most participants are pursuing an undergraduate degree (n = 41, or 65%), have a high school diploma (n = 15, or 23%), or hold an undergraduate degree (n = 5, or 8%).
All participants engage with digital technologies (smartphones, computers, smart TVs, and others) daily and are also familiar with the term ‘Virtual Reality’. Fifty-three participants (84%) are aware of immersive Virtual Reality technologies. Twenty-six participants (41%) have experience with immersive VR devices (e.g., a VR headset or an amusement park’s VR simulator): nineteen reported using immersive VR only once, three people reported using immersive VR sometimes in a year, two reported monthly use of immersive VR, and two reported using immersive VR weekly.
The experiments occurred in the Federal University of Rio Grande do Sul and Federal University of Pampa facilities in air-conditioned rooms with an available space of (minimum) 10 × 10 ft. Participants used a Meta Quest 2 HMD with a washable silicone cover and no earphones (the speakers of the HMD are good enough in a quiet room). In order to keep some haptic feedback, the participants used the Quest 2 VR Controllers for interaction instead of the built-in hand tracking.
Participants used three VR applications: Oculus First Contact1, Painting VR2, and Beat Saber3. These applications are fully compatible with Meta VR Controllers and rated ‘comfortable’ on the Shop Meta Quest, reducing the intense VR sickness risk. Oculus First Contact is a tutorial for participants to familiarize themselves with VR hardware and interaction styles, so we did not collect any UX measures after its usage. Painting VR is a virtual studio where participants are instructed to paint a landscape or character on the canvas, representing the goal-mode (Hassenzahl, 2003) because users have a specific long-term goal within a peaceful environment. Finally, Beat Saber is a rhythm game that focuses on the action-mode (Hassenzahl, 2003), as it is a fast-paced, reactive game that demands intensive interaction with much smaller goals (hitting the boxes in time with the rhythm).
Additionally, we selected applications with relatively intuitive or straightforward control schemes that could be learned within a short use session. Since complex patterns of interaction or many menu layers are hard to master, some questionnaire items related to the easiness of learning, efficiency, and efficacy could be unrepresentative in a short scenario. Moreover, the language profile of participants demanded VR applications with instructions and content in Portuguese.
Participants engaged with each VR application for about 15 min before completing the questionnaires. Besides the Portuguese version of the iUXVR questionnaire, three additional instruments translated into Portuguese were used for data collection: the System Usability Scale (SUS) (Brooke, 1986; Martins et al., 2015), the Presence Questionnaire (PQ) (Silva et al., 2016; Witmer et al., 2005), and the Simulation Sickness Questionnaire (SSQ) (de Carvalho et al., 2011; Kennedy et al., 1993). It is worth mentioning that only the iUXVR and one other random questionnaire were answered following the experience with each application to minimize participants’ fatigue from extended experimental sessions. The VR software and questionnaire sequence were randomized as presented in Figure 3 using a Latin square design approach Zaiontz (2018).
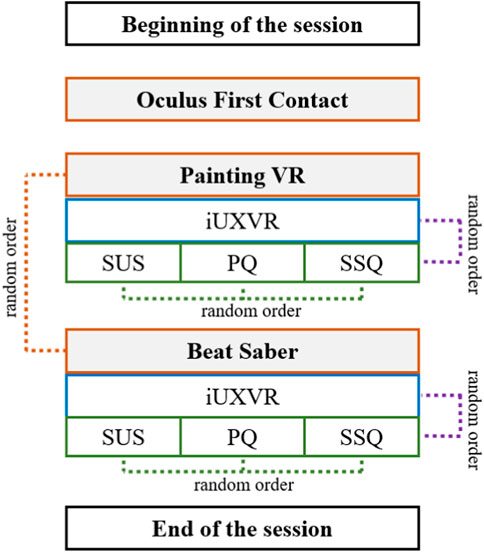
Figure 3. Structure of the experimental sessions.
Notably, we collected data from 126 iUXVR questionnaires since each participant completed it twice. Even though some outliers had been detected, the observations were retained as they may reflect valid variations in user experience and contribute to the ecological validity of the study. In addition to preserving representative data, removing observations in a modestly sized sample could compromise the overall stability of the estimators (e.g., item loadings, path coefficients, etc.).
4 Evaluation of psychometric properties
In this research, we focus on three sources of information regarding validity (AERA, 2014): evidence based on test content (the analysis of relationships between the component we intended to measure and the content of the questionnaire, including the theme, wording, and structure), evidence based on the internal structure (the degree of relationship among test items, components, and scores), and evidence based on the relation with other variables (the comparisons with external variables like other instruments that measure the same component).
4.1 Evidence based on the test content
The careful analysis of the content (Section 3.1), the evaluation process with experts (Section 3.2), and the feedback from the pilot study (Section 3.3) expand the body of evidence regarding the test content (AERA, 2014).
Regarding the analysis of the experts, they recommended adding 22 new items to the initial collection. From the resulting 170 items, 48 were selected for the initial version of the questionnaire based on their relevance and quality: items marked as superfluous or poor quality by one or more expert were removed.
Except for items about VR sickness, those sharing a common factor are deliberately placed non-consecutively to mitigate bias (Podsakoff et al., 2003). The VR sickness items are clustered at the beginning of the questionnaire due to the transient nature of the symptoms (Stanney and Kennedy, 1998). The exact number of items for each component is: usability (16 items), aesthetics (10 items), presence (10 items), VR sickness (6 items), and emotions (6 items). The English version of the questionnaire is presented in Table 1.
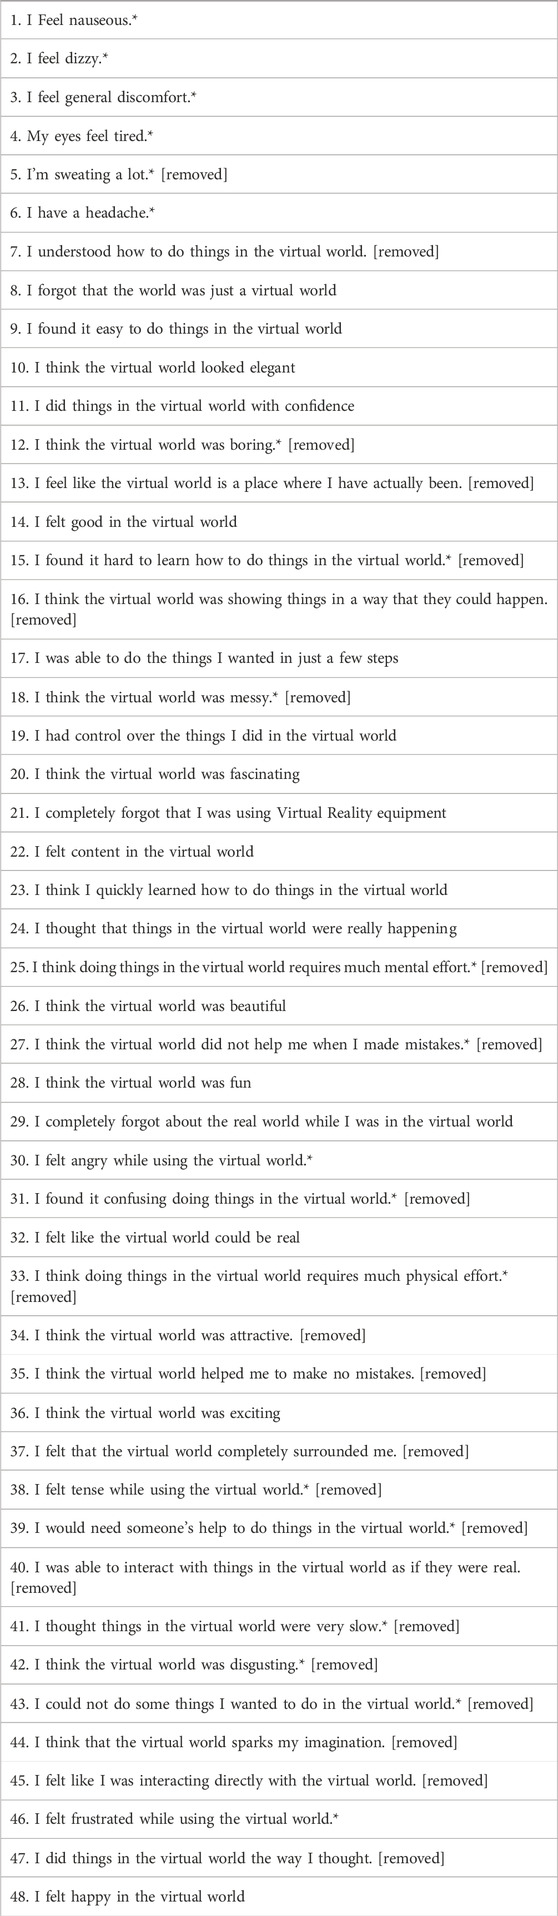
Table 1. Items from the initial version of the index of User Experience in immersive Virtual Reality (items marked with * have their scores reversed, as they contribute negatively to the experience, and items removed due to low factor loadings or minimal contribution to reliability estimates are also indicated).
4.2 Evidence based on the internal structure
Evidence related to the internal structure of the questionnaire comprises reliability coefficients and analyses based on Partial Least Square Structural Equation Modeling (PLS-SEM) since the last is a reliable approach for reduced sample sizes compared to Exploratory Factor Analysis (EFA) and Confirmatory Factor Analysis (CFA) (Hair et al., 2021).
Even though the overall complexity of a structural model has little influence on the minimum sample size requirements for PLS-SEM (Hair et al., 2021), we calculated the minimum sample size for our model using the G*Power software (v. 3.1.9.7) instead of relying on conventional rules of thumb (e.g.,
Next, we estimated the model shown in Figure 1 using a repeated indicator approach (Becker et al., 2012) and included an additional single item indicator to measure the overall experience: Rate your experience in the virtual world from 0 (zero) to 10 (ten), where 0 is a terrible experience and 10 is an amazing experience. All the estimations were done using the R programming language (version 4.3.3) and the SEMinR package (version 2.3.3). Moreover, confidence intervals were calculated through bootstrap with 1,000 sub-samples.
The analysis of the factor loadings provides significant insights into the structure of the questionnaire. Although the recommended loading for an indicator is above 0.708 (explaining 50% of the indicator’s variance), loading values of 0.40 are still acceptable in exploratory research (Hair et al., 2021). After estimating the model using PLS-SEM, we removed all items with low indicator loadings
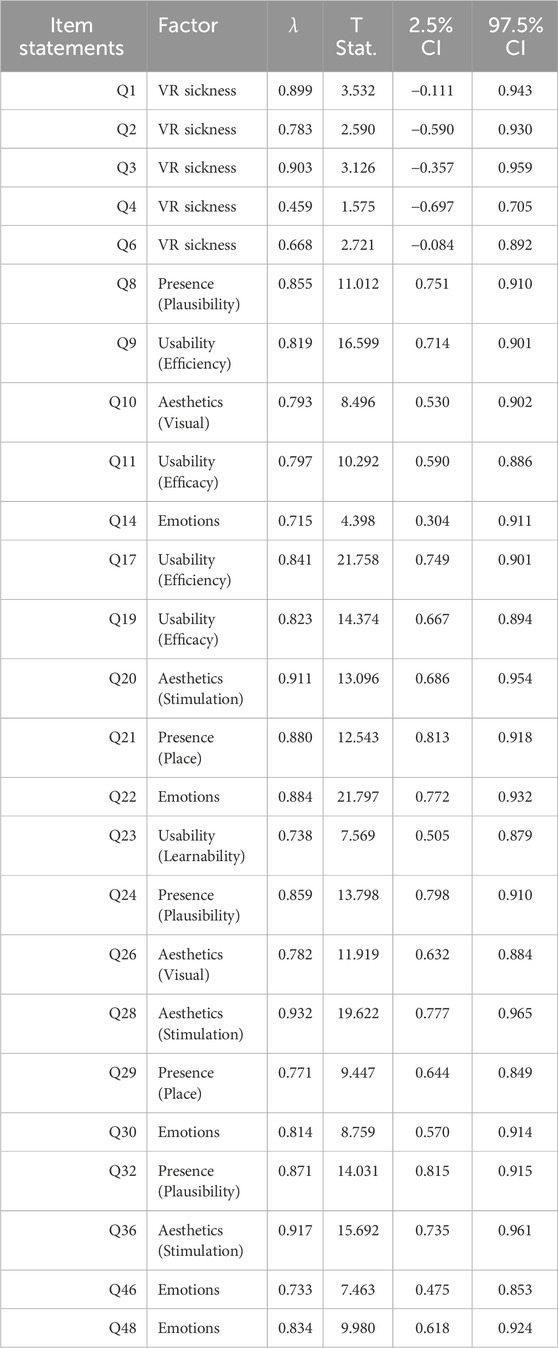
Table 2. Indicator loadings of the five-factor solution (25 items).
The reliability coefficients Cronbach’s alpha and Dijkstra and Henseler’s rho are used to estimate the internal consistency of factors (Russo and Stol, 2021), representing the extent to which indicators of a single construct are associated. While the coefficient alpha is a tau-equivalent estimator derived from the inter-correlation of the items, the coefficient rho is a congeneric reliability measure that is more precise when the assumptions for alpha are not met (Hair et al., 2021). Both estimators range from 0 (no association between the items at all) to 1 (perfect items homogeneity and no measurement error). Even though threshold values for reliability coefficients are not a consensus, values between 0.60 and 0.95 are acceptable in exploratory research (Hair et al., 2021) since lower coefficients represent a lack of association among items or significant measurement error, and higher coefficients indicate excessive redundancy or undesirable response patterns.
Additionally, the Average Extracted Variance (AVE) is another metric that focuses on the indicators’ loadings to evaluate the strength of the relation among items of a single construct and to which extent they are interchangeable (Russo and Stol, 2021). The threshold of AVE
Table 3 shows the reliability coefficients and the AVE for the UX factors after dropping items that contributed less to the questionnaire stability (indicator loading <.708 with an increase in reliability estimates after deletion). These reliability estimates accumulate evidence of the convergent validity category for reflective constructs (Cheng et al., 2014).
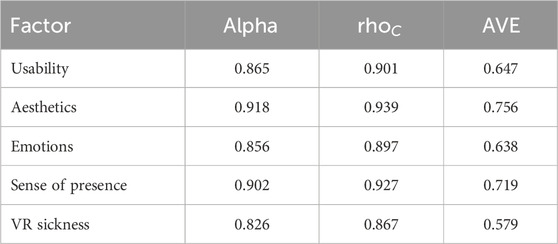
Table 3. Reliability estimates for the five-factor solution (25 items).
Concerning the evidence related to discriminant validity, the Heterotrait-Monotrait ratio of correlations (HTMT) is frequently used to assess whether different constructs are measuring different concepts (Russo and Stol, 2021). The HTMT represents “the mean value of the indicator correlations across constructs […] relative to the (geometric) mean of the average correlations for the indicators measuring the same construct” (Hair et al., 2021). The conservative threshold to HTMT is a value below 0.9 as acceptable for similar factors (Hair et al., 2021). Table 4 present the HTMT values for this research sample.
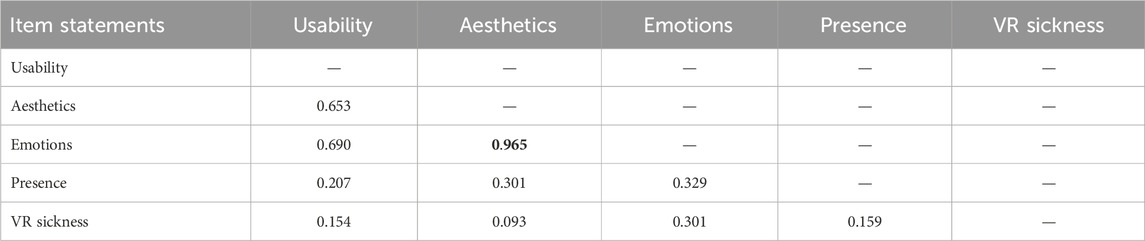
Table 4. HTMT for the five-factor solution (25 items).
4.3 Evidence based on relations to other variables
Evidence concerning the relations with other variables comes from the Pearson product-moment correlation coefficient
The correlation between the usability component (learnability, efficiency, and efficacy) and the SUS scores are considered strong in our sample (
Similarly, the correlation between the VR sickness component and the SSQ scores is close to the threshold for being considered strong (
It was not possible to find a significant correlation between the presence component (illusion of place and illusion of plausibility) and the PQ scores (
5 Evaluation of the structural model
After reducing the number of items to 25, the hypothesized structural model was assessed regarding collinearity issues, relevance and significance of the path coefficients, and model explanation power.
The original structural model starts with components related to usability (learnability, efficiency, and efficacy), aesthetics (visual aesthetics and stimulation), sense of presence (illusion of place and illusion of plausibility), and VR sickness. Emotions partially mediate these components to build the User Experience high-order component. It is worth mentioning that it extends the general structure of the CUE framework (Mahlke, 2008) by adding two aspects crucial to immersive VR experiences: presence and VR sickness. Again, we used the R programming language (version 4.3.3) and the SEMinR package (version 2.3.3) to estimate all the elements in our model. Furthermore, the confidence intervals were calculated through bootstrap with 1,000 sub-samples.
Collinearity happens when two or more factors are highly correlated. Since the estimation of the path coefficients in PLS-SEM structural models is based on regressions of factors on their corresponding predictors (Hair et al., 2021), the path coefficients might be biased if high levels of collinearity are involved in the estimation. It is possible to consider that variance inflation factors (VIF) higher than 5 lead to substancial collinearity (Hair et al., 2021).
Considering the antecedents of the component emotions in the structural model, all VIF values are below the critical value (usability = 1.583, sense of presence = 1.097, aesthetics = 1.637, VR sickness = 1.020). Furthermore, the antecedent of the UX component presented VIF values below the threshold (usability = 1.279, sense of presence = 1.133, aesthetics = 4.901, VR sickness = 1.279) but one (emotions = 5.544).
The relevance of a path coefficient usually ranges from −1 (strong negative relationships) to +1 (strong positive relationships), and it represents the influence of one factor on another (Hair et al., 2021). For example, a path coefficient of 0.5 indicates that when the predictor factor (the arrow’s origin) increases by one standard deviation unit, the influenced factor (the arrow’s destination) will increase by 0.5 standard deviation units. There are no rules of thumb for relevance measures since they depend on the research context. Also, the significance of a path coefficient are estimated by bootstrapping. It indicates that some effect is significantly different from zero and can be assumed to exist in the population (Hair et al., 2021).
Finally, the explanatory power is expressed by the coefficient of determination
Figure 4 presents the hypothesized model’s path coefficients and explanatory power.
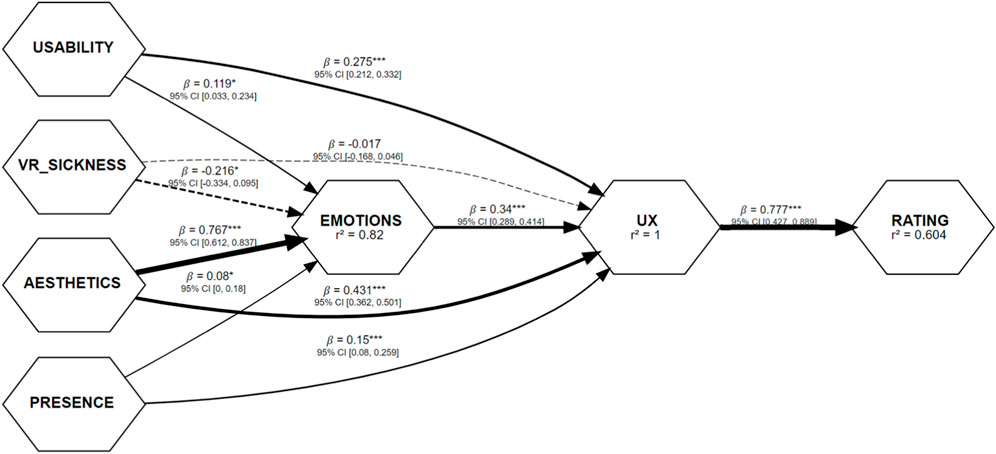
Figure 4. Structural model of the iUXVR (* represents p-value <0.05, ** represents p-value
6 Discussion
The first thing to notice is the tendency for smaller factors (learnability, efficiency, efficacy, illusion of place, illusion of plausibility, visual aesthetics, and stimulation) to be collapsed into their major components (usability, presence, and aesthetics). The analysis of HTMT ratios of the smaller factors shows a strong correlation between some of them (Hair et al., 2021; Russo and Stol, 2021): the limit value of 0.9 is surpassed for the pair learnability-efficiency, efficiency-efficacy, illusion of place-plausibility, and visual aesthetics-stimulation. Also, the solution with nine separate factors presented low-reliability estimates and item loadings, indicating that it was not a stable solution. These effects were expected and suggest that the smaller factors should be assessed together in the context of immersive Virtual Reality. This is the practice for the models of other authors (Cheng et al., 2014; Shin et al., 2013; Tcha-Tokey et al., 2016; Tcha-Tokey et al., 2018).
Furthermore, the aesthetics factor also presented a high HTMT ratio concerning the emotions factor (HTMT = 0.965). This effect was unsurprising because the emotions and the aesthetic experience are deeply intertwined, but the factors were kept separate to preserve the original CUE model structure. The low VIF value between the emotions and the antecedent aesthetics in the structural model (VIF = 1.637) and the significant relationship from aesthetics to emotions
The investigation of the dropped items also provides valuable insights. For example, the item “I’m sweating too much” presented a very low factor loading, likely due to ambiguity regarding its cause–was sweating induced by the silicone cover of the HMD, physical exertion while playing, or an actual symptom of VR sickness? The two items related to effort (“I think doing things in the virtual world requires much mental effort”, and “I think doing things in the virtual world requires much physical effort”) also showed very low factor loadings, suggesting that mental and physical effort may not be strongly associated with the overall usability in the context of immersive VR.
On the other hand, the item “Q4. My eyes feel tired” was retained in the questionnaire despite the relatively low factor loading
All factors presented appropriate indexes concerning the reliability coefficients and the Average Extracted Variance.
The strong correlations to other questionnaires (SUS and SSQ) reveal that the items are similar to established measures in representativeness and precision. Once the comparison of presence component scores of the iUXVR with PQ scores failed to achieve statistical significance, it is not reliable to draw any conclusions. Assuming the items related to the sense of presence in the iUXVR are adequate, the apparent factorial instability identified in different versions (Witmer et al., 2005) and different languages (Silva et al., 2016; Vasconcelos-Raposo et al., 2021) of the Presence Questionnaire probably contributes to the lack of correlation. Another possible reason for the low correlation is that the theoretical assumptions for the sense of presence component are incompatible: the iUXVR considers two factors (illusion of place and illusion of plausibility), and the PQ involves up to six factors (involvement, audio fidelity, haptic/visual fidelity, adaptation/immersion, consistency, and interface quality) (Witmer et al., 2005).
It is possible to notice some collinearity between emotions and UX (VIF = 5.544), but it is expected since emotions mediate the effects of previous variables. Also, emotions play a critical role on the UX through the “WOW effect” that is frequently experienced by immersive VR first users, which is the majority of our sample. Further investigation shall confirm whether this level of collinearity is critical or not.
The structural model reveals that the aesthetics factor has a major influence on the UX directly
The strong effect of aesthetics on emotions
One major difference between the iUXVR and UXIVE models is the magnitude of the path from presence to emotions. Although both models report significant paths between the factors, the UXIVE model (Tcha-Tokey et al., 2018) estimates a much higher effect (0.791) than the iUXVR model
The relationship between emotions and UX is also significant in our model
The path coefficient from VR sickness to the UX is non-significant, so VR-induced symptoms could affect the user’s emotions, but they do not directly impact the impressions that build the core UX. On the one hand, the significant indirect effect through emotions suggests that the VR sickness score could be interpreted separately from the other UX dimensions, as it may represent a non-core component. On the other hand, even an indirect effect can still make a meaningful contribution to the overall UX score, particularly when it plays an important role in predicting the mediating construct. Both scoring approaches should be further explored in future research.
Finally, the explanatory power of predictors of emotions (usability, VR sickness, aesthetics, and sense of presence) is strong
The descriptive statistics in Table 5 indicate that the two VR applications performed similarly on all assessed components.
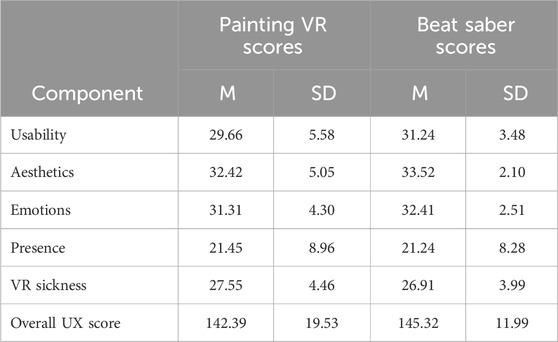
Table 5. Descriptive statistics of scores for the VR applications (n = 63).
7 Conclusion
In recent times, VR technology has become more affordable and better. This availability, combined with an increasing number of VR applications and a growing interest in User Experience, has led researchers to develop many questionnaires to assess the VR experience in a comprehensive approach.
This paper reports the assessment of the psychometric properties of the index of User Experience in immersive Virtual Reality and the evaluation of its structural model. Evidence regarding the questionnaire content includes a rationale behind the UX components, the development of the items based on the content analysis of existing questionnaires, the evaluation of the items by experts, and the questionnaire tuning process in a pilot study. Evidence concerning the internal structure indicates good reliability coefficients for its factors. Finally, evidence based on the relation with other variables supports the coherence of usability and VR sickness components scores, as they positively correlate to other standardized questionnaires that measure the same constructs.
The PLS-SEM approach was suitable for the number of observations and successfully allowed the measurement model parameters and the structural model paths to be calculated. The model suggests significant implications for assessing the UX in immersive VR, such as the need to include the aesthetic component in standardized questionnaires and the possibility of removing the VR sickness component due to its low contribution in evaluating the UX directly.
Our questionnaire has some significant advantages over previous studies. While the questionnaires proposed by Tcha-Tokey et al. (2016), Tcha-Tokey et al. (2018) have 68 to 84 items, the reduced collection of items in the iUXVR (25 items) speeds up the evaluation process and reduces errors caused by fatigue. Additionally, using the same structure for all items (a fully labeled 7-point Likert-like scale) eliminates any effects caused by mixing different response formats, as seen in other questionnaires (Cheng et al., 2014; Tcha-Tokey et al., 2016; Tcha-Tokey et al., 2018). Items from the VR sickness component were also placed at the beginning of the iUXVR questionnaire to assess passing symptoms as early as possible, while similar items were placed at the end of the UXIVE questionnaire (Tcha-Tokey et al., 2016).
The proposed model of UX in VR (Figure 5) may be extended more efficiently compared to the structures presented in previous studies since it comprises a strict set of components that are meaningful for most immersive VR applications. The iUXVR is composed solely of key UX components that are frequently evaluated by VR researchers and developers, avoiding domain-specific dimensions–e.g., challenge and skill (Cheng et al., 2014) – and overlapping concepts–e.g., engagement and flow (Tcha-Tokey et al., 2016; 2018). Some of these critical components are missing in other questionnaires: VR sickness and aesthetics are not assessed by Cheng et al. (2014) and Shin et al. (2013), and usability is assessed through objective measures by Tcha-Tokey et al. (2016) because the usability factor did not achieve good psychometric quality in the questionnaire. Finally, items related to the aesthetic experience belong to a well-defined component in the iUXVR, whereas items with similar roles are grouped within a broader ‘judgment’ factor for Tcha-Tokey et al. (2016).
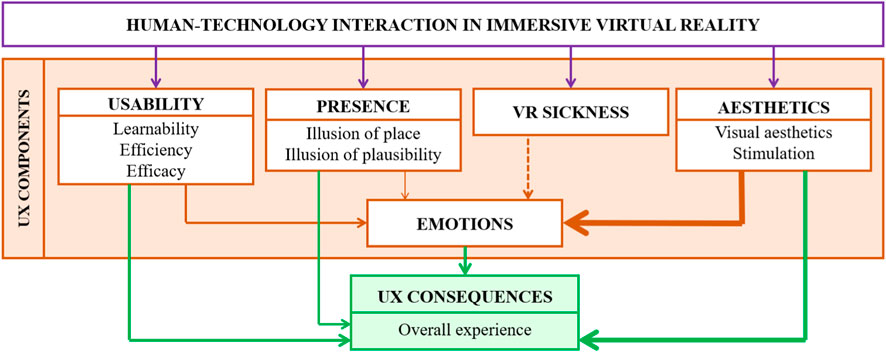
Figure 5. Model of the key components for the index of User Experience in immersive Virtual Reality (solid arrows represent significant paths with direct effect, dashed arrows represent significant paths with inverse effect, and thicker arrows represent stronger relationships).
The final version of the questionnaire is presented in Table 6.
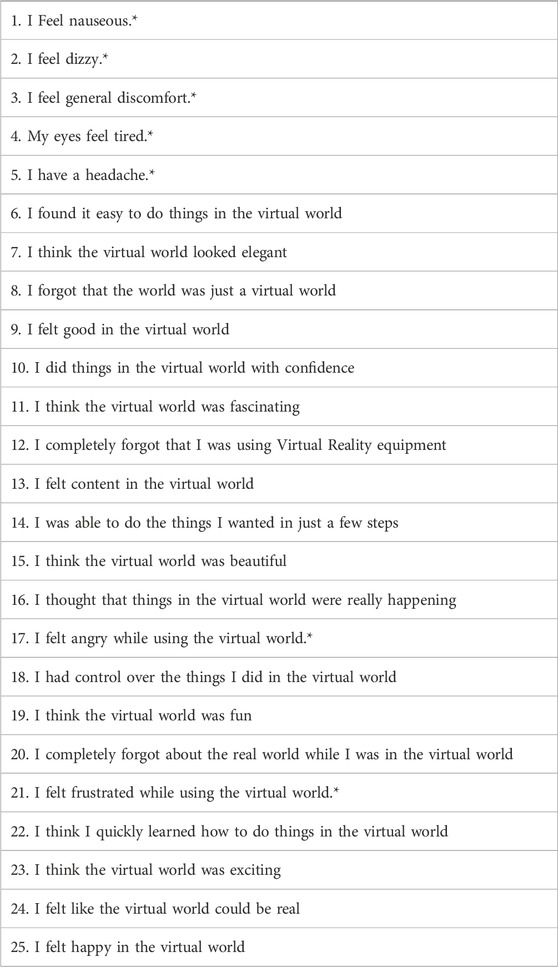
Table 6. Items of the final version of the index of User Experience in immersive Virtual Reality (items marked with * should have their scores reversed since they contribute negatively to the experience).
Regarding the experimental setup, we focused on stimuli from immersive VR equipment, while Shin et al. (2013) used 3D televisions to present lectures recorded with stereoscopic cameras. Considering that HMDs were significantly more expensive at the time of Shin’s research, the choice of 3D TVs is understandable. However, the lower level of immersion provided by such equipment (Suh and Prophet, 2018) could affect the model’s validity for immersive technology.
Unlike other studies (Cheng et al., 2014; Tcha-Tokey et al., 2016), we used more than one application with different usage modes (Hassenzahl, 2003): action mode (Beat Saber) and goal mode (Painting VR). Moreover, we avoided custom VR software (Tcha-Tokey et al., 2016) and educational applications (Shin et al., 2013; Tcha-Tokey et al., 2016) by opting for commercial software focused solely on leisure.
As expected, there are some threats to the validity of this study. First, the relatively small sample could lead to wider confidence intervals for the parameter estimates, introduce instability in the model’s parameters, and increase the bias for overfitting. However, the number of observations exceeded the estimated minimum sample size, mitigating the more severe consequences at present.
In addition, while using a single device (Meta Quest 2) and two software applications (Beat Saber and Painting VR) may limit the generalizability of the results to other platforms or applications, this design choice enhances control over potential external variables. By focusing on a single device and software environment, we ensured consistent conditions across all experiments, thereby reducing variability in how the experiments were conducted. Additionally, the research project was limited by the availability of different VR equipment, and the participants’ language further restricted the range of VR software that could be used, as only applications with content in Portuguese were suitable. Exploring new VR software in a long-term research project could help address the practical constraints of this study, particularly those related to participants’ language profiles and the availability of different VR devices. Future work also includes the use of the iUXVR for other VR applications (education, training, data visualization, etc.).
The recruitment strategy may also introduce some potential bias, but it included individuals both from within and outside the university community to ensure a diverse range of participants. This approach facilitated efficient data collection with limited resources, allowed compliance with the Brazilian National Ethics Board regarding compensation and rewards, and used multiple recruitment channels to minimize sample homogeneity. The “WOW effect” discussed in Section 6 is a real phenomenon in Brazil regarding emerging technologies. Even though this effect can inflate component scores (leading to artificial correlations among constructs) or jeopardize the temporal stability of the experiment replication, the sample of our study reflects the diversity of global contexts and provides an opportunity for collaboration that produces significant insights. Furthermore, the sample in our study is representative of potential early adopters and consumers of immersive VR in Brazil. Future studies could expand recruitment to enhance the generalizability of the findings.
The evaluation of measurement invariance (Henseler et al., 2016) is also a topic of interest once a questionnaire for assessing UX should provide equally valid and reliable scores for VR software of distinct domains but requires a larger sample size.
Data availability statement
The original contributions presented in the study are included in the article/Supplementary Material, further inquiries can be directed to the corresponding author.
Ethics statement
The studies involving humans were approved by Research Ethics Board of the Federal University of Rio Grande do Sul - Brazil (CAAE 53245721.1.0000.5347). The studies were conducted in accordance with the local legislation and institutional requirements. The participants provided their written informed consent to participate in this study.
Author contributions
JC: Conceptualization, Formal Analysis, Investigation, Methodology, Writing – original draft, Writing – review and editing. DB: Conceptualization, Methodology, Supervision, Writing – review and editing. MP: Conceptualization, Methodology, Supervision, Writing – review and editing.
Funding
The author(s) declare that financial support was received for the research and/or publication of this article. This study was financed in part by the Coordenação de Aperfeiçoamento de Pessoal de Nível Superior - Brasil (CAPES) - Finance Code 001.
Conflict of interest
The authors declare that the research was conducted in the absence of any commercial or financial relationships that could be construed as a potential conflict of interest.
Generative AI statement
The author(s) declare that Generative AI was used in the creation of this manuscript. Generative AI was used exclusively for text revision and English revision.
Publisher’s note
All claims expressed in this article are solely those of the authors and do not necessarily represent those of their affiliated organizations, or those of the publisher, the editors and the reviewers. Any product that may be evaluated in this article, or claim that may be made by its manufacturer, is not guaranteed or endorsed by the publisher.
Supplementary material
The Supplementary Material for this article can be found online at: https://www.frontiersin.org/articles/10.3389/frvir.2025.1585614/full#supplementary-material
Supplementary Data sheet 1 | Data from the Simulator Sickness Questionnaire.
Supplementary Data sheet 2 | Data from the System Usability Scale.
Supplementary Data sheet 3 | Data from the Presence Questionnaire.
Supplementary Data sheet 4 | Data from the index of User Experience in immersive Virtual Reality.
Footnotes
1https://www.oculus.com/experiences/quest/2188021891257542
2https://www.oculus.com/experiences/quest/3106117596158066
3https://www.oculus.com/experiences/quest/2448060205267927
References
Abeele, V. V., Spiel, K., Nacke, L., Johnson, D., and Gerling, K. (2020). Development and validation of the player experience inventory: a scale to measure player experiences at the level of functional and psychosocial consequences. Int. J. Hum. Comput. Stud. 135, 102370. doi:10.1016/j.ijhcs.2019.102370
AERA (2014). APA; NCME standards for educational and psychological testing. Washington, DC: EUA: American Educational Research Association.
Assila, A., Oliveira, K. M. D., and Ezzedine, H. (2016). Standardized usability questionnaires: features and quality focus. J. Comput. Sci. Inf. Technol. 6, 15–31.
Barbosa, S. D. J., Silva, B. S. d., Silveira, M. S., Gasparini, I., Darin, T., and Barbosa, G. D. J. (2021). Interação Humano-Computador e Experiência do Usuário (autopublicação)
Becker, J.-M., Klein, K., and Wetzels, M. (2012). Hierarchical latent variable models in pls-sem: guidelines for using reflective-formative type models. Long. Range Plan. 45, 359–394. doi:10.1016/j.lrp.2012.10.001
Bian, Y., Yang, C., Gao, F., Li, H., Zhou, S., Li, H., et al. (2016). A framework for physiological indicators of flow in VR games: construction and preliminary evaluation. Personal Ubiquitous Comput. 20, 821–832. doi:10.1007/s00779-016-0953-5
Brooke, J. (1986). “SUS - a quick and dirty usability scale,” in Usability evaluation in industry. Editors P. W. Jordan, B. Thomas, B. A. Weerdmeester, and A. L. McClelland 1st edn. (London, UK: Taylor & Francis), 189–194. doi:10.1201/9781498710411-35
Chang, E., Kim, H. T., and Yoo, B. (2020). Virtual reality sickness: a review of causes and measurements. Int. J. Human-Computer Interact. 36, 1658–1682. doi:10.1080/10447318.2020.1778351
Cheng, L. K., Chieng, M. H., and Chieng, W. H. (2014). Measuring virtual experience in a three-dimensional virtual reality interactive simulator environment: a structural equation modeling approach. Virtual Real. 18, 173–188. doi:10.1007/s10055-014-0244-2
Cobb, S. V., Nichols, S., Ramsey, A., and Wilson, J. R. (1999). Virtual reality-induced symptoms and effects (VRISE). Presence Teleoperators Virtual Environ. 8, 169–186. doi:10.1162/105474699566152
Coltman, T., Devinney, T. M., Midgley, D. F., and Venaik, S. (2008). Formative versus reflective measurement models: two applications of formative measurement. J. Bus. Res. 61, 1250–1262. doi:10.1016/j.jbusres.2008.01.013
Darin, T., Coelho, B., and Borges, B. (2019). “Which instrument should I use? Supporting decision-making about the evaluation of user experience,” in Design, user experience, and usability. Practice and case studies (Cham, Switzerland: Springer International Publishing), 49–67.
Davis, S., Nesbitt, K., and Nalivaiko, E. (2014). “A systematic review of cybersickness,” in Proceedings of the conference on interactive entertainment (New York, NY, USA: Association for Computing Machinery), 1–9. doi:10.1145/2677758.2677780
de Carvalho, M. R., da Costa, R. T., and Nardi, A. E. (2011). Simulator Sickness Questionnaire: tradução e adaptação transcultural. J. Bras. Psiquiatr. 60, 0–5. doi:10.1590/S0047-20852011000400003
der Heijden, H. V., and Sørensen, L. S. (2003). “Measuring attitudes towards mobile information services: an emprical validation of the HED/UT scale,” in Proceedings of the 11th European Conference on information systems, ECIS (naples, Italy: acpil), 765–777.
Diaz-Oreiro, I., Lopez, G., Quesada, L., and Guerrero, L. (2019). “Standardized questionnaires for user experience evaluation: a systematic literature review,” in Proceedings of the international Conference on ubiquitous Computing and ambient intelligence (MDPI), 1–12. doi:10.3390/proceedings2019031014
Grassini, S., and Laumann, K. (2020). Questionnaire measures and physiological correlates of presence: a systematic review. Front. Psychol. 11, 349. doi:10.3389/fpsyg.2020.00349
Hair, J. F., Hult, G. T. M., Ringle, C. M., Sarstedt, M., Danks, N. P., and Ray, S. (2021). Partial least squares structural equation modeling (PLS-SEM) using R: a workbook. Cham, Switzerland: Springer. doi:10.1007/978-3-030-80519-7_4
Hartmann, J., Sutcliffe, A., and Angeli, A. D. (2008). Towards a theory of user judgment of aesthetics and user interface quality. ACM Trans. Comput.-Hum. Interact. 15, 1–30. doi:10.1145/1460355.1460357
Hassenzahl, M. (2003). “The thing and i: understanding the relationship between user and product,” in Funology: from usability to enjoyment. Editors M. A. Blythe, K. Overbeeke, A. F. Monk, and P. C. Wright (Dordrecht, Netherlands: Springer Netherlands), 31–42.
Hassenzahl, M., Burmester, M., and Koller, F. (2003). “AttrakDiff: Ein Fragebogen zur Messung wahrgenommener hedonischer und pragmatischer Qualität,” in Mensch & computer 2003: interaktion in bewegung. Editors G. Szwillus, and J. Ziegler (Wiesbaden: Vieweg Teubner Verlag), 187–196. doi:10.1007/978-3-322-80058-9_19
Henseler, J., Ringle, C. M., and Sarstedt, M. (2016). Testing measurement invariance of composites using partial least squares. Int. Mark. Rev. 33, 405–431. doi:10.1108/IMR-09-2014-0304
ISO (2018). ISO 9241-11:2018 - ergonomics of human-system interaction - part 11: usability: Definitions and concepts. Geneva, Switzerland: ISO.
ISO (2019). 9241-210:2019 - ergonomics of human-system interaction - Part 210: human-centred design for interactive systems. Geneva, Switzerland: ISO.
Izard, C. E. (1977). Theories of emotion and emotion-behavior relationships. Boston, MA: Springer US, 19–42. doi:10.1007/978-1-4899-2209-0_2
Izard, C. E. (2007). Basic emotions, natural kinds, emotion schemas, and a new paradigm. Perspect. Psychol. Sci. 2, 260–280. doi:10.1111/j.1745-6916.2007.00044.x
Jerald, J. (2016). The VR book: human-centered Design for virtual reality williston, VT, USA: ACM books. Williston, VT: Association for Computing Machinery and Morgan & Claypool.
Karapanos, E., Zimmerman, J., Forlizzi, J., and Martens, J.-b. (2009). “User experience over time: an initial framework,” in Proceedings of the SIGCHI conference on human factors in computing systems (New York, NY, USA: Association for Computing Machinery), 729–738. doi:10.1145/1518701.1518814
Kennedy, R. S., Lane, N. E., Kevin, S., and Lilienthal, M. G. (1993). Simulator sickness questionnaire: an enhanced method for quantifying simulator sickness. Int. J. Aviat. Psychol. 3, 203–220. doi:10.1207/s15327108ijap0303_3
Kim, Y. M., Rhiu, I., and Yun, M. H. (2020). A systematic review of a virtual reality system from the perspective of user experience. Int. J. Human-Computer Interact. 36, 893–910. doi:10.1080/10447318.2019.1699746
LaLomia, M. J., and Sidowski, J. B. (1990). Measurements of computer satisfaction, literacy, and aptitudes: a review. Int. J. Human–Computer Interact. 2, 231–253. doi:10.1080/10447319009525982
Lavie, T., and Tractinsky, N. (2004). Assessing dimensions of perceived visual aesthetics of web sites. Int. J. Hum. Comput. Stud. 60, 269–298. doi:10.1016/j.ijhcs.2003.09.002
Law, E. L.-C., Roto, V., Hassenzahl, M., Vermeeren, A. P., and Kort, J. (2009). “Understanding, scoping and defining user experience: a survey approach,” in SIGCHI conference on human factors in computing systems (New York, NY, USA: Association for Computing Machinery), 719–728. doi:10.1145/1518701.1518813
Law, E. L. C., Van Schaik, P., and Roto, V. (2014). Attitudes towards user experience (UX) measurement. Int. J. Hum. Comput. Stud. 72, 526–541. doi:10.1016/j.ijhcs.2013.09.006
Lima, A. L. d. S., and Wangenheim, C. G. v. (2022). Assessing the visual esthetics of user interfaces: a ten-year systematic mapping. Int. J. Human-Computer Interact. 38, 144–164. doi:10.1080/10447318.2021.1926118
Mahlke, S. (2008). User Experience of Interaction with Technical Systems. Doktor der ingenieurwissenschaften, Technische Universität Berlin, Fakultät V - Verkehrs-und Maschinensysteme. Alemanha. doi:10.14279/depositonce-1793
Maia, C. L. B., and Furtado, E. S. (2016). “A systematic review about user experience evaluation,” in Design, user experience, and usability: design thinking and methods. Editor A. Marcus (Cham, Switzerland: Springer International Publishing), 445–455. doi:10.1007/978-3-319-40409-7_42
Marques, L., Barcellos, M. P., Gadelha, B., and Conte, T. (2024). Characterizing ux assessment in the context of immersive experiences: a systematic mapping study. Int. J. Human–Computer Interact. 0, 1552–1568. doi:10.1080/10447318.2024.2351711
Martins, A. I., Rosa, A. F., Queirós, A., Silva, A., and Rocha, N. P. (2015). European Portuguese validation of the system usability scale (SUS). Procedia - Procedia Comput. Sci. 67, 293–300. doi:10.1016/j.procs.2015.09.273
Martirosov, S., and Kopecek, P. (2017). “Cyber sickness in virtual reality - literature review,” in Proceedings of the DAAAM international symposium. Editor B. Katalinic (Vienna, Austria: DAAAM International), 718–726. doi:10.2507/28th.daaam.proceedings.101
Minge, M., Thüring, M., Wagner, I., and Kuhr, C. V. (2016). “The meCUE questionnaire: a modular tool for measuring user experience,” in Advances in ergonomics modeling, usability and special populations. Editors M. Soares, C. Falcão, and T. Z. Ahram (Cham, Switzerland: Springer International Publishing), 115–128. doi:10.1007/978-3-319-41685-4_11
Moraes, R., Monteiro, R., and Vencovsky, R. (1999). Conservação genética de populações de Cryptocarya moschata Nees (Lauraceae) na Mata Atlântica do estado de São Paulo. Rev. Educ. 22, 237–248. doi:10.1590/s0100-84041999000500004
Norman, D. A. (2004). Emotional design: why we love (or hate) everyday things. New York, NY, USA: Basic Books.
Nur, A. I., Santoso, H. B., and Putra, P. O. H. (2021). “The method and metric of user experience evaluation: a systematic literature review,” in Proceedings of the international conference on software and computer applications (New York, NY: EUA: ACM), 307–317. doi:10.1145/3457784.3457832
Podsakoff, P. M., MacKenzie, S. B., Lee, J. Y., and Podsakoff, N. P. (2003). Common method biases in behavioral research: a critical review of the literature and recommended remedies. J. Appl. Psychol. 88, 879–903. doi:10.1037/0021-9010.88.5.879
Poels, K., de Kort, Y., and Ijsselsteijn, W. (2007). D3.3: game Experience Questionnaire: development of a self-report measure to assess the psychological impact of digital games. Eindhoven, Netherlands: Technische Universiteit Eindhoven.
Porat, T., and Tractinsky, N. (2012). It’s a pleasure buying here: the effects of web-store design on consumers’ emotions and attitudes. Human-Computer Interact. 27, 235–276. doi:10.1080/07370024.2011.646927
Preece, J., Rogers, Y., and Sharp, H. (2015). Interaction design: beyond human-computer interaction. 4 edn. Hoboken, NJ: Wiley.
Reynolds, C. R., Altmann, R. A., and Allen, D. N. (2021). Mastering modern psychological testing: theory and methods. 2 edn. Cham, Switzerland: Springer. doi:10.1007/978-3-030-59455-8
Rivero, L., and Conte, T. (2017). “A systematic mapping study on research contributions on UX evaluation technologies,” in Proceedings of the Brazilian symposium on human factors in computing systems (New York, NY, USA: ACM), 1–10. doi:10.1145/3160504.3160512
Roto, V. (2007). “User experience from product creation perspective,” in COST294-MAUSE affiliated workshop. Editors E. Law, A. Vermeeren, M. Hassenzahl, and M. Blythe (Lancaster, UK: COST294-MAUSE), 1–4.
Russo, D., and Stol, K. J. (2021). PLS-SEM for software engineering research: an introduction and survey. ACM Comput. Surv. 54, 1–38. doi:10.1145/3447580
Ryan, R. M., Rigby, C. S., and Przybylski, A. (2006). The motivational pull of video games: a self-determination theory approach. Motivation Emot. 30, 344–360. doi:10.1007/s11031-006-9051-8
Sauro, J. (2015). Supr-q: a comprehensive measure of the quality of the website user experience. J. User Exp. 10, 15–31.
Sauro, J., and Lewis, J. (2016). Quantifying the user experience: practical statistics for user research. Massachusetts, USA: Morgan Kaufmann.
Schrepp, M., Hinderks, A., and Thomaschewski, J. (2014). “Applying the user experience questionnaire (UEQ) in different evaluation scenarios,” in Design, user experience, and usability. Theories, methods, and tools for designing the user experience (Cham: Springer International Publishing), 383–392. doi:10.1007/978-3-319-07668-3_37
Shin, D. H., Biocca, F., and Choo, H. (2013). Exploring the user experience of three-dimensional virtual learning environments. Behav. Inf. Technol. 32, 203–214. doi:10.1080/0144929X.2011.606334
Silva, G. R., Donat, J. C., Rigoli, M. M., de Oliveira, F. R., and Kristensen, C. H. (2016). A questionnaire for measuring presence in virtual environments: factor analysis of the presence questionnaire and adaptation into Brazilian Portuguese. Virtual Real. 20, 237–242. doi:10.1007/s10055-016-0295-7
Slater, M. (2009). Place illusion and plausibility can lead to realistic behaviour in immersive virtual environments. Philosophical Trans. R. Soc. B - Biol. Sci. 364, 3549–3557. doi:10.1098/rstb.2009.0138
Souza, V., Maciel, A., Nedel, L., and Kopper, R. (2022). Measuring presence in virtual environments: a survey. ACM Comput. Surv. 54, 1–37. doi:10.1145/3466817
Stanney, K. M., and Kennedy, R. S. (1998). Aftereffects from virtual environment exposure: how long do they last? Proc. Hum. Factors Ergonomics Soc. Annu. Meet. 42, 1476–1480. doi:10.1177/154193129804202103
Suh, A., and Prophet, J. (2018). The state of immersive technology research: a literature analysis. Comput. Hum. Behav. 86, 77–90. doi:10.1016/j.chb.2018.04.019
Tcha-Tokey, K., Christmann, O., Loup-Escande, E., and Richir, S. (2016). Proposition and validation of a questionnaire to measure the user experience in immersive virtual environments. Int. J. Virtual Real. 16, 33–48. doi:10.20870/ijvr.2016.16.1.2880
Tcha-Tokey, K., Loup-Escande, E., Christmann, O., Canac, G., Farin, F., and Richir, S. (2018). Towards a model of user experience in immersive virtual environments. Adv. Human-Computer Interact. 2018, 1–10. doi:10.1155/2018/7827286
Vasconcelos-Raposo, J., Melo, M., Barbosa, L., Teixeira, C., Cabral, L., and Bessa, M. (2021). Assessing presence in virtual environments: adaptation of the psychometric properties of the Presence Questionnaire to the Portuguese populations. Behav. Inf. Technol. 40, 1417–1427. doi:10.1080/0144929X.2020.1754911
Vermeeren, A., Law, E., Roto, V., Obrist, M., Hoonhout, J., and Väänänen-Vainio-Mattila, K. (2010). “User experience evaluation methods: current state and development needs,” in Proceedings of the nordic conference on human-computer interaction (New York, NY, USA: ACM), 521–530.
Witmer, B. G., Jerome, C. J., and Singer, M. J. (2005). The factor structure of the presence questionnaire. Presence Teleoperators Virtual Environ. 14, 298–312. doi:10.1162/105474605323384654
Witmer, B. G., and Singer, M. J. (1998). Measuring presence in virtual environments: a presence questionnaire. Presence Teleoperators Virtual Environ. 7, 225–240. doi:10.1162/105474698565686
Zaiontz, C. (2018). Latin squares design. Available online at: http://www.real-statistics.com/design-of-experiments/latin-squares-design.
Keywords: user experience, virtual reality, model, immersive environments, structured equation modeling, standardized questionnaire
Citation: Cheiran JFP, Bandeira DR and Pimenta MS (2025) Measuring the key components of the user experience in immersive virtual reality environments. Front. Virtual Real. 6:1585614. doi: 10.3389/frvir.2025.1585614
Received: 28 February 2025; Accepted: 21 May 2025;
Published: 04 June 2025.
Edited by:
Xiaogang Jin, Zhejiang University, ChinaReviewed by:
Cássio Leonardo Rodrigues, Universidade Federal de Goiás, BrazilVedad Hulusic, Bournemouth University, United Kingdom
Copyright © 2025 Cheiran, Bandeira and Pimenta. This is an open-access article distributed under the terms of the Creative Commons Attribution License (CC BY). The use, distribution or reproduction in other forums is permitted, provided the original author(s) and the copyright owner(s) are credited and that the original publication in this journal is cited, in accordance with accepted academic practice. No use, distribution or reproduction is permitted which does not comply with these terms.
*Correspondence: Jean Felipe Patikowski Cheiran, amVhbmNoZWlyYW5AdW5pcGFtcGEuZWR1LmJy, amZwY2hlaXJhbkBpbmYudWZyZ3MuYnI=