 Sabahat Israr1,2
 Mudassar Ali Khan3
 Muhammad Shahid Anwar4*Kamran Ahmad Awan3Saoucene Mahfoudh5Turki Althaqafi6Wadee Alhalabi7,8
- 1Department of Computer Science, Government Postgraduate College for Women, Haripur, Pakistan
- 2Higher Education Department, Khyber Pakhtunkhwa, Pakistan
- 3Department of Information Technology, The University of Haripur, Haripur, Pakistan
- 4IRC for Finance and Digital Economy, King Fahd University of Petroleum and Minerals, Dhahran, Saudi Arabia
- 5School of Engineering, Computing, and Design, Dar Al-Hekma University, Jeddah, Saudi Arabia
- 6Computer Science Department, School of Engineering, Computing and Design, Dar Al-Hekma University, Jeddah, Saudi Arabia
- 7Immersive Virtual Reality Research Group, Department of Computer Science, King Abdulaziz University, Jeddah, Saudi Arabia
- 8Department of Computer Science, Dar Al-Hekma University, Jeddah, Saudi Arabia
The architecture, engineering, and construction industry requires enhanced tools for efficient collaboration and user-centric designs. Traditional visualization methods relying on 2D/3D CAD models often fall short of modern demands for interactivity and context-aware representation. To address this limitation, this study introduces ARchitect, a mobile-based markerless augmented reality (AR) framework aimed at revolutionizing architectural artifact visualization and interaction. The proposed approach enables users to dynamically overlay and manipulate 3D architectural elements, such as roofs, windows, and doors, within their physical environment using AR raycasting and device sensors. Algorithms supporting translation, rotation, and scaling allow precise adjustments to model placement while integrating metadata to enhance design comprehension. Real-time lighting adaptation ensures seamless environmental blending, and the framework’s usability is quantitatively evaluated using the Handheld Augmented Reality Usability Scale (HARUS). ARchitect achieved a usability score of 89.2, demonstrating significant improvements in user engagement, accuracy, and decision-making compared to conventional methods.
1 Introduction
In the Architecture, Engineering, and Construction (AEC) industry, the design process involves continuously addressing client requirements through collaborative efforts (Singh et al., 2011). The stakeholder group for the AEC sector extends beyond engineers and designers to include end-users and clients, making their feedback on design alternatives essential at every stage of a project. This iterative exchange significantly improves the quality of the design and ensures alignment with user expectations (Mohammadpour et al., 2015; East et al., 2004). Architects often work with diverse datasets that encompass natural and cultural contexts, which play a critical role in the success of an architectural design. Site-specific spatial data, reflecting the surrounding environment, has a direct impact on the design process due to the interdependence between architectural structures and their contexts. Consequently, architects invest substantial time in analyzing the characteristics of the contextual and local site before initiating the design process (Skov et al., 2013).
The visualization of architectural models and spatial data in the AEC industry has traditionally relied on various methods and technologies. Historically, these visualizations have been presented as 2D or 3D drawings, either on paper (Spallone and Natta, 2022) or through software tools such as SketchUp (Peng et al., 2023), Autodesk (Baik, 2024), Lumion (Ratcliffe and Simons, 2017), and Revit (Seipel et al., 2020). However, these conventional approaches face significant limitations in addressing the evolving demands of the digital era (Sedlmair et al., 2014). Specifically, challenges such as the gap between data acquisition and cognition hinder the ability to sample comprehensively and visually navigate multidimensional datasets (Abdelaal et al., 2022; Knippers et al., 2021). Moreover, traditional visualization methods are time-intensive, less efficient, and lack collaborative features essential for effective stakeholder engagement. While other engineering and non-engineering domains have successfully adopted modern technologies, the AEC industry has been notably slow in embracing such advancements, as highlighted in prior research (Hadavi and Alizadehsalehi, 2024). The reason for this slowness is the AEC industry’s slow adoption of modern technologies is largely due to costly investments, limited cost-effectiveness of worker training, slim profit margins, lack of decision support tools, technological incompatibility with existing workflows, and a traditionally change-resistant industry culture (Yap et al., 2022).
Immersive technologies, which expand the reality-virtuality continuum, have seen rapid adoption across various domains (Milgram et al., 1995; Anwar et al., 2024, Anwar et al., 2023). These technologies replicate realistic sensory experiences, including visual, haptic, auditory, and motion-based interactions (Um et al., 2023; Milgram and Colquhoun, 1999). At the two ends of this continuum lie reality (the physical world) and virtuality (virtual reality (VR). Positioned closer to reality is augmented reality (AR), which enables the integration of virtual content into real-world environments in real time, while augmented virtuality (AV) sits closer to virtuality. Among these, AR stands out for its ability to improve understanding by providing contextualized interactions with virtual content (Azuma, 1997). In the AEC industry, AR facilitates a collaborative environment in which engineers, designers, architects, and stakeholders can engage in planning, design, and construction with improved coordination (Wang et al., 2022). AR implementations include wearable AR glasses (Fiorillo et al., 2024), spatial AR for projecting visuals onto physical surfaces (Gheorghiu et al., 2024), and mobile AR utilizing handheld devices like smartphones and tablets (Murthy et al., 2023). Recent advancements in smartphone technology have enhanced the efficiency, usability, and accessibility of mobile AR, particularly in terms of three-dimensional rendering, processing, and tracking capabilities (Ridel et al., 2014; Butchart, 2011).
This study introduces ARchitect, a markerless mobile augmented reality framework designed for the AEC industry to enable visualization and interaction with 3D architectural building elements such as windows, doors, and roofs. The framework utilizes advanced AR raycasting and device sensors for precise placement and manipulation of virtual elements within real-world environments. Users can dynamically translate, rotate, and scale models to view them from multiple perspectives in their actual construction contexts. Furthermore, the system incorporates real-time lighting adjustments and metadata integration to provide detailed information about model dimensions, structural features, and contextual suitability. The proposed framework operates across various mobile platforms without requiring external hardware, ensuring broad accessibility and natural user interaction in immersive environments. The technical contributions of the proposed approach can be summarized as:
The remainder of the paper is structured as follows: In Section 1, background information and a review of the literature are presented. Our suggested framework is explained in depth in Section 3. Section 4 details the experiments we conducted and the results we obtained. Section 6 discusses the result, and our work is concluded in section 7.
2 Background and related work
The Architecture, Engineering, and Construction (AEC) industry often faces challenges in meeting budgetary, scheduling, and quality standards while managing diverse stakeholder expectations (Chao et al., 2000; Krizek and Hadavi, 2007). To address these challenges, the industry must adopt advanced technologies for visualization, data management, and collaboration (Darko et al., 2020; Han and Leite, 2022; Bassier et al., 2024). Traditional visualization methods, such as 2D or 3D models, are often shared through in-person meetings or digital platforms like Zoom or Microsoft Teams. However, these methods are inefficient, time-consuming, and do not provide the spatial and contextual essence of designs (Hadavi and Alizadehsalehi, 2024). Researchers have started to integrate extended reality technologies into AEC tasks to improve efficiency and improve outcomes (Chi et al., 2013; Panya et al., 2023; Valizadeh et al., 2024). Augmented reality (AR), a prominent extended reality technology, has gained attention for its ability to overlay digital models onto the physical world using mobile devices, eliminating the need for additional hardware (Salavitabar et al., 2023; Ayala-Nino et al., 2023; Mitterberger et al., 2020).
Several AR-based prototypes and frameworks have been developed to enhance visualization, interactivity, and immersion in the AEC domain. RelicCard, for example, utilized tangible interfaces for augmented reality to explore cultural relics, although it was limited to physical cards for interaction (Yu et al., 2024). Another study introduced a mixed reality platform, Fologram, for architectural students to design and display models in AR, though the small sample size limited the generalizability of the results (Cakici Alp et al., 2023). Similarly, researchers proposed frameworks for error detection in production and assembly using AR in industrial contexts, but issues like marker dependency and lighting conditions impacted usability (Marino et al., 2021; Lotsaris et al., 2021). Integration of AR with Building Information Modeling (BIM) has shown promise, but alignment errors and incomplete functionalities have restricted its full potential (Ratajczak et al., 2019; Olsen et al., 2019).
Despite these advancements, existing AR systems in AEC have notable limitations. Many rely on head-mounted displays (HMDs) that are bulky, costly, and limit accessibility to a single user (Vassigh et al., 2018; Gheisari et al., 2016). Others depend on markers or location constraints, reducing their flexibility and usability (Dong and Kamat, 2013; Chalhoub and Ayer, 2018). Moreover, several methodologies lack comprehensive evaluation or statistical testing to validate their findings (Gheisari et al., 2016; Olsen et al., 2019). A summary of related contributions and limitations is presented in Table 1, highlighting the need for a markerless mobile AR framework with greater applicability and robust validation.
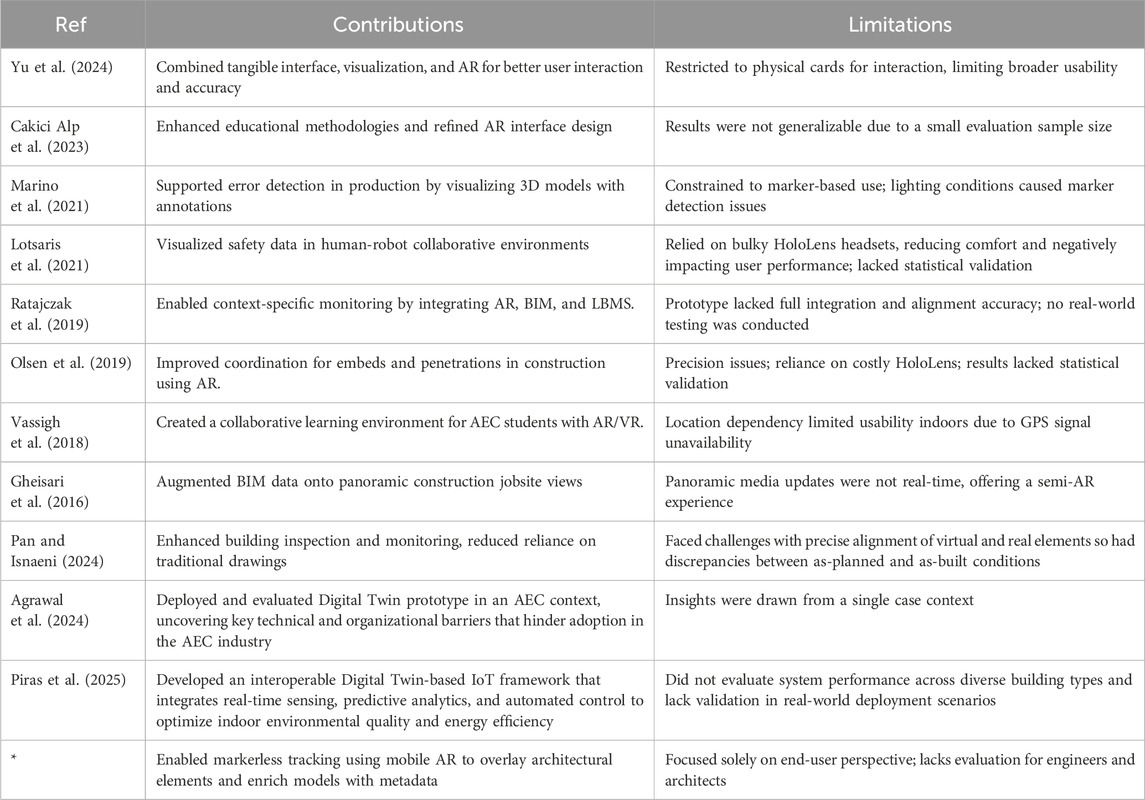
Table 1. Description of visualization and manipulation techniques with limitations.
3 Proposed framework
This study proposed a framework aiming to develop an intuitive and easy-to-use markerless mobile augmented reality framework supported by different mobile devices and which can provide an immersive and interactive experience to the stakeholders of the AEC industry. All the design models of architectural building elements are designed using Sketchp1 software. For the development of the framework, Unity3D2 and Microsoft Visual Studio3 are used. Development is performed on a Microsoft Windows 10 laptop with an Intel(R) Core(TM) i7-7600U processor, 16 GB RAM. User testing was conducted on Infinix X697 (Android Version 11). Figure 1 illustrates the architecture of our proposed framework.
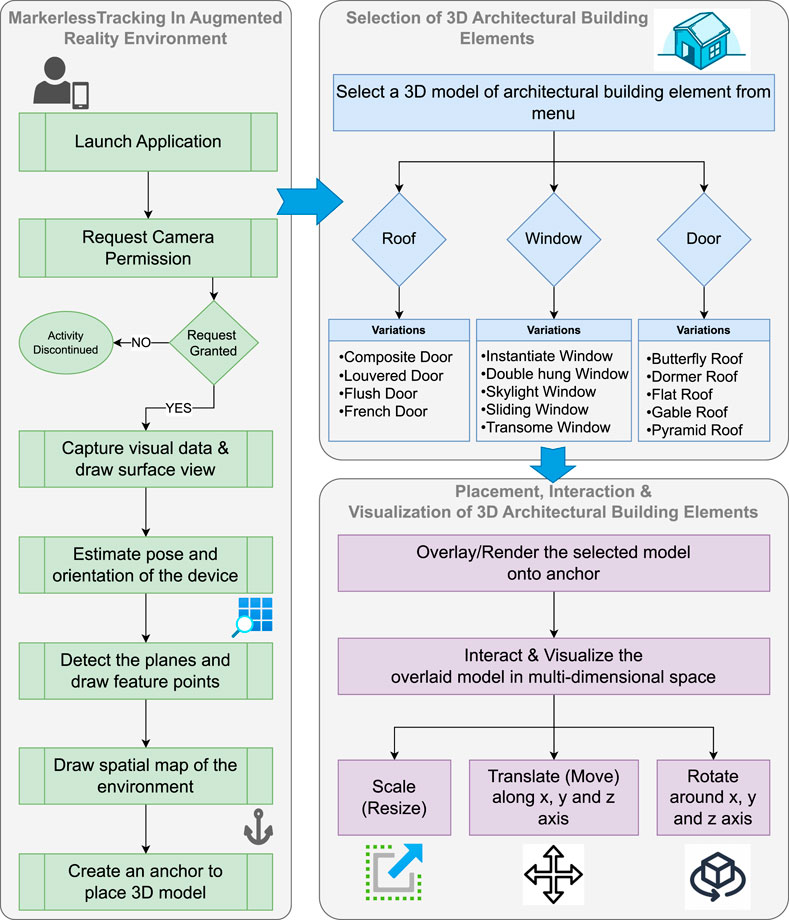
Figure 1. Proposed framework of ARchitect.
Using SketchUp, three types of architectural building elements, including roofs, doors, and windows, French were designed. Different dimensions, geometries, meshes, and use cases are considered when designing composite, louvered, flush, and french doors for various geographical regions. Similarly, different roof designs were created for butterfly, dormer, flat, gable, and pyramid roofs. Various window types with unique features are constructed, including single-, double-hung, skylight, sliding, and transome windows. An example interface while designing the model is shown in Figure 2.
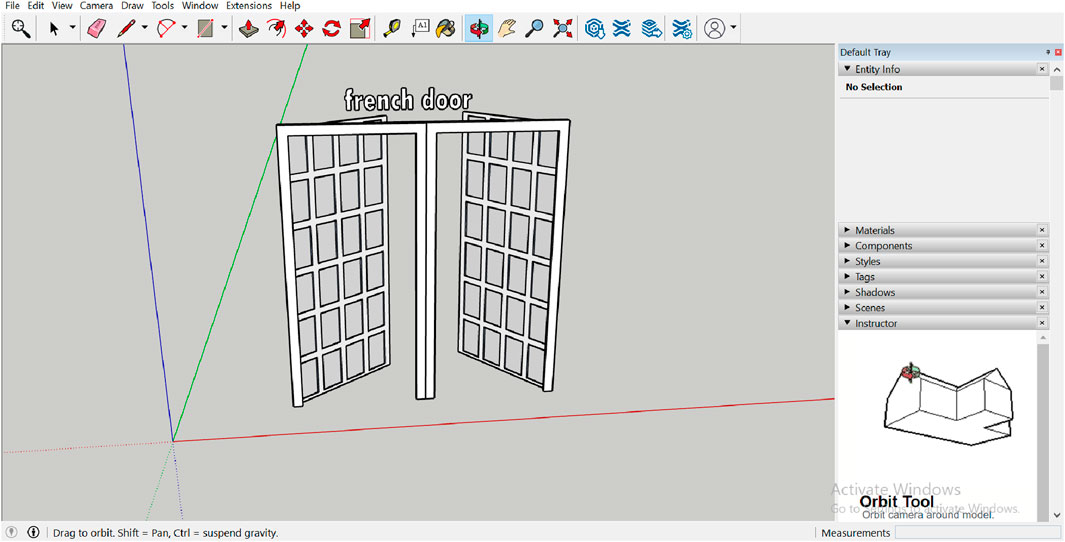
Figure 2. Preview of sketchup tool.
3.1 Markerless tracking to overlay 3D architectural building elements
The markerless tracking mechanism in our proposed framework leverages advanced augmented reality techniques to overlay 3D architectural building elements onto real-world surfaces. The detailed process for markerless tracking and overlaying 3D architectural building elements is outlined in Algorithm 1.2
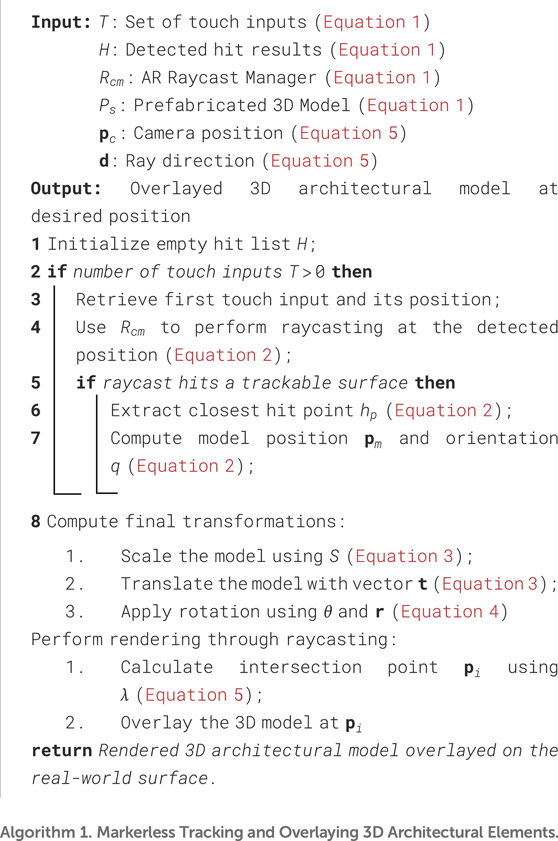
Algorithm 1. Markerless Tracking and Overlaying 3D Architectural Elements.
The process is defined mathematically to ensure precision and usability. Users interact through touch inputs to initiate the placement of 3D models, dynamically adjusting their orientation and scale. Below, we detail the mathematical workflow and its implementation.
The touch inputs
Here,
where
The rotation is determined through the angle
where
3.2 Visualization and interaction with architectural building elements
The interaction with architectural building elements involves three primary transformations: translation, rotation, and scaling. The detailed workflow for visualizing and interacting with architectural building elements is described in Algorithm 2. This algorithm provides a systematic approach to compute transformations, including translation, rotation, and scaling, using mathematical formulations such as
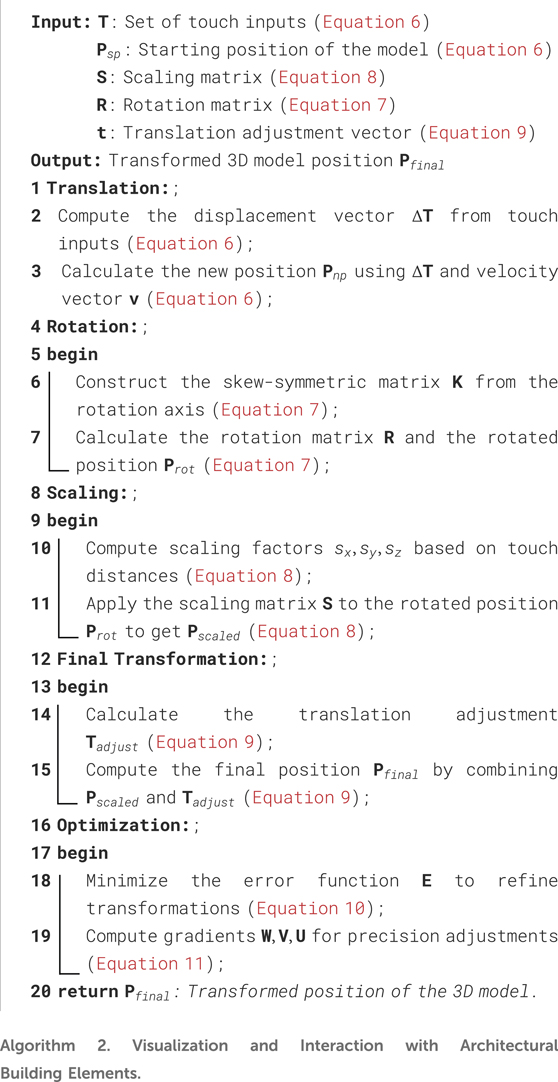
Algorithm 2. Visualization and Interaction with Architectural Building Elements.
Each transformation is mathematically modeled to ensure precision and enhance user interaction within the AR environment. Below is the advanced mathematical formulation of these processes.
Here,
The rotation matrix
Scaling involves the matrix
The final transformation
An optimization function minimizes the error
Gradients of the error function provide insights into interaction precision, ensuring robust and user-friendly interaction mechanisms.
3.3 Real-time performance optimization for AR-Based architectural visualization
Efficient processing in augmented reality (AR) environments is essential to ensure seamless interaction and visualization. This section mathematically formulates the optimization strategies used to reduce latency, balance computational load, and maintain stability during AR-based architectural visualizations. The comprehensive workflow for optimizing real-time performance in AR-based architectural visualization is detailed in Algorithm 3. This algorithm systematically addresses workload balancing, latency management, and error correction, culminating in the computation of the final optimization objective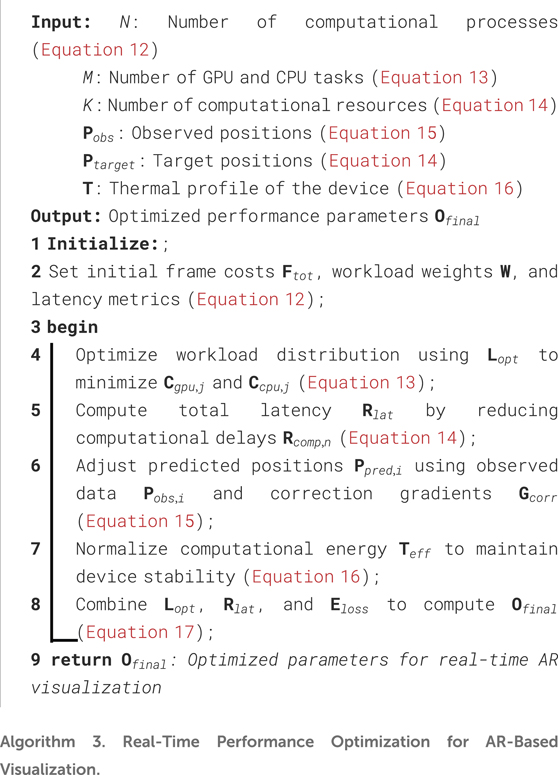
Algorithm 3. Real-Time Performance Optimization for AR-Based Visualization.
Here,
The optimization objective
Latency reduction is achieved by managing computational resources
Error correction integrates predictive adjustments
Thermal management is maintained by normalizing effective computational energy
The final optimization objective
3.4 Adaptive lighting and environmental integration in AR environments
Integrating virtual architectural models seamlessly into the real world requires adaptive lighting and precise environmental understanding. This section formulates a mathematical framework for achieving dynamic lighting adjustments and real-world integration in augmented reality environments. The process for achieving adaptive lighting and seamless environmental integration in AR environments is outlined in Algorithm 4. This algorithm systematically calculates total scene lighting
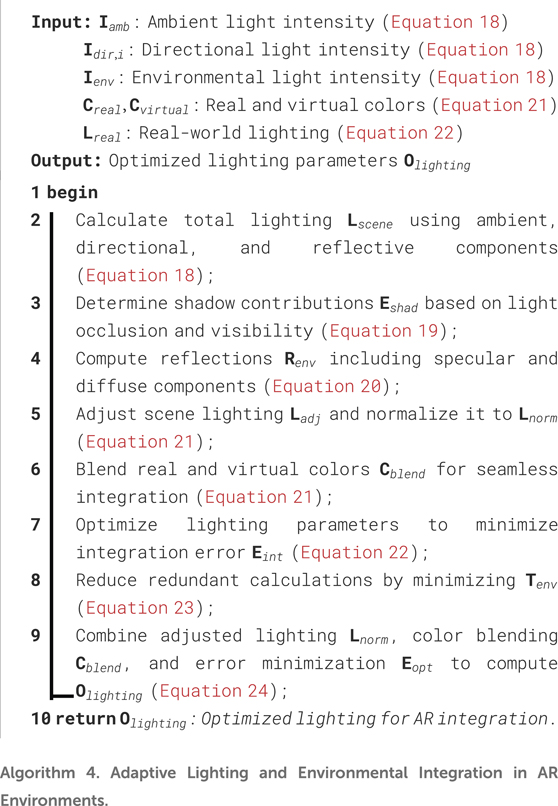
Algorithm 4. Adaptive Lighting and Environmental Integration in AR Environments.
The total scene lighting
Shadows are calculated using an occlusion-based approach, where
Reflections are modeled using both specular and diffuse components, where
Adaptive lighting adjustments ensure that the virtual models blend with the real-world environment. The normalized lighting
The integration error
Thermal optimization ensures computational efficiency by minimizing redundant environmental calculations, balancing energy consumption with lighting accuracy.
The final optimization
4 Implementation and evaluation
Prime objective in conducting this study was to assess the developed augmented reality (AR) framework’s usability and user experience in terms of its capacity to visualize and manipulate architectural artifacts. For this purpose, we conducted a user-centric survey and used a standard questionnaire, Handheld Augmented Reality Usability Scale (HARUS) Santos et al. (2014). HARUS evaluates various aspects that contributes to users’ experience with handheld augmented reality. HARUS is composed of 16 statements, each scored on a 7-point Likert scale, ranging from “Strongly Disagree” to “Strongly Agree.” and two measures: manipulability and comprehensibility. Out of these 16 statements, 8 statements addresses the manipulability measure and the remaining 8 addresses comprehensibility of handheld augmented reality (HAR). We have followed Randomized Posttest Only Control Group Design (Fraenkel and Wallen, 2008) to evaluate our research work and divided the participants in control and treatment group.
4.1 Procedure and participants
In the user-centric testing phase, 40 final year undergraduate students from Department of Computer Science, Government Postgraduate College for Women, Haripur, participated in the survey based on convenience sampling. 20 of the 40 students were assigned to control group and the remaining 20 to treatment group. Treatment group was equipped with our proposed framework “ARchitect” as shown in Figure 3 while control group was treated with computer-aided design (CAD) software application, “SketchUp” as shown in Figure 2. It is specifically designed for 3D modeling and is widely used in architecture, interior design, landscape architecture, engineering, and other fields that require 3D visualization. Unlike traditional CAD software, which often focuses on precise technical drawings and documentation in addition to simple manipulation tasks, SketchUp is known for its user-friendly interface and is often used for conceptual design and quick visualization, especially during the early conceptual and design stages. SketchUp was selected as the baseline for comparison due to its widespread adoption in both professional and educational settings across the AEC industry. It supports core functionalities such as object placement, manipulation, and spatial layout, which closely parallel the features implemented in ARchitect. Each participant signed an informed consent form for voluntary participation in this user study. Afterwards, a demonstration was given about the working and usage of both the applications to the relevant group participants before letting them to use and test. After that, a set of tasks were assigned to both groups. They tested the application from an end-user perspective and performed the tasks.
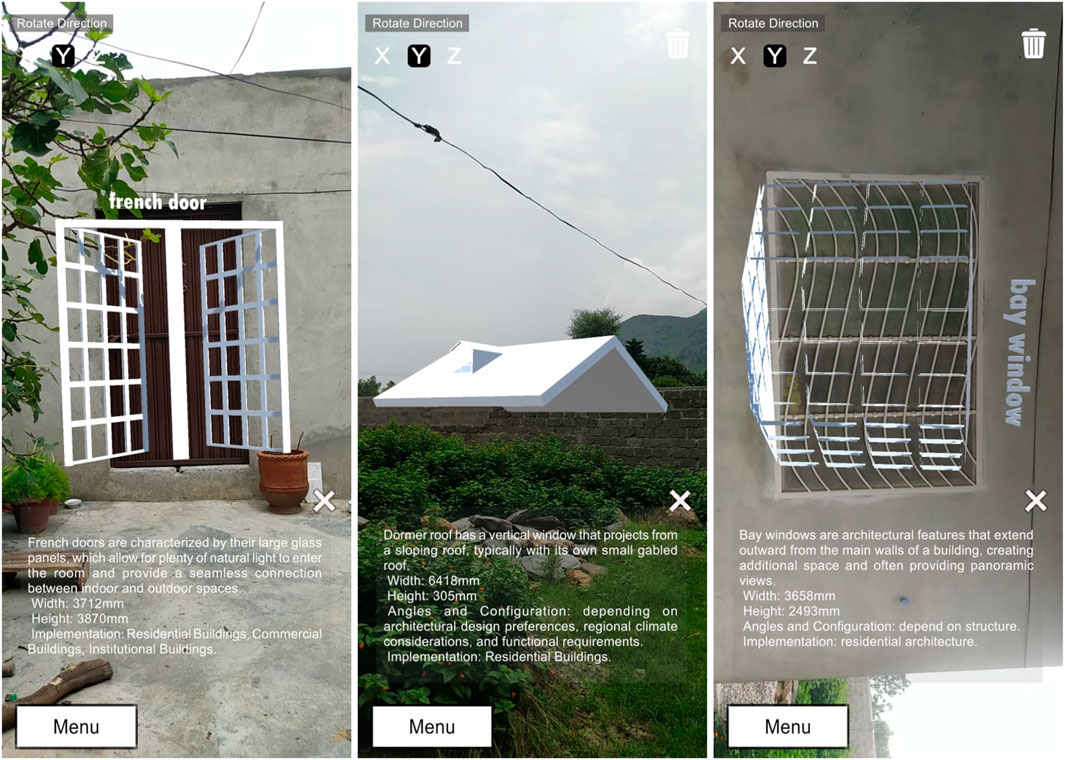
Figure 3. Overlaying and Visualizing 3D building Elements in real world along with relevant information.
4.2 Tasks
Our study aimed to evaluate the usability of ARchitect and SketchUp by focusing on core interaction tasks such as placing, rotating, and scaling 3D architectural components. These tasks are fundamental to architectural design workflows and are common across digital modeling environments, making them ideal for assessing usability characteristics like ease of manipulation and frameworks’ comprehension. The tasks were chosen to align with the strengths of both ARchitect and SketchUp, ensuring a fair comparison by using identical tasks and instructions. The description of the tasks given to participants of both groups is described as:
1. Application Launch: Launch the application (ARchitect/SketchUp)
2. Model Selection: Navigate through the interface to select the 3D model of the architectural building element (Window, Door, Roof).
3. Model Positioning: Place/overlay the selected model on the desired location of the building.
4. Model Manipulation: Interact with the model and manipulate it by translating (moving), scaling (resizing), and rotating so that it can best fit the place.
5. Model Selection: Based on Annotated Information: Test multiple models and select the best model for placement by reading the annotated information alongside the overlaid model.
4.3 Statistical testing
In order to assess the degree of significance and determine the extent of the difference between the control and treatment groups, the statistical t-test (Field and Hole, 2003) was used. In addition, we wanted to generalize the results beyond the sample size and draw conclusions about the entire population. In this respect, the following alternate and null hypotheses were developed:
1. Null Hypotheses
2. Alternate Hypotheses
5 Interpretation of results
The results obtained from a user-centric questionnaire-based survey were evaluated and interpreted by applying two different formulas. For positive statements, 1 was subtracted from the user response and for negative statements, the user response was subtracted from 7. By applying these formulas, we had a score of average of 1-7 against each statement. These average scores are added and divided by 0.96 to obtain a total HARUS score, ranging from 1 to 100. The manipulability and comprehensibility scores of both groups were calculated separately and then added to get the total HARUS score.
5.1 Handheld augmented reality usability scale (HARUS)
Manipulability score for treatment group was 46.3 and its comprehensibility score was 47.34, resulting in the total HARUS score of 93.64. Similarly, the manipulability score for the control group was 23.07 and its comprehensibility score was 24.89. Graphical representation of these overall results is shown in Figure 4.
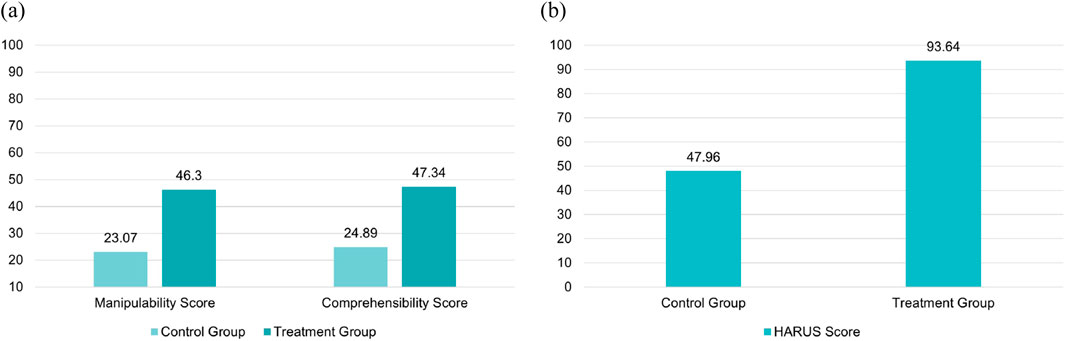
Figure 4. (A) Individual Manipulability and Comprehensibility scores for treatment group and Control group out of 50. (B) Total HARUS score for treatment group and control group out of 100.
5.2 Manipulability
The manipulability analysis between ARchitect and SketchUp highlights notable differences in user experience related to physical effort and ease of control. Regarding the statement about body muscle effort, ARchitect users indicated that it required significantly less physical effort, with an average score of 5.65. In contrast, the SketchUp users rated the effort required by SketchUp to be higher, with an average score of 3.95. Despite the higher physical effort, participants found the ARchitect more comfortable for their arms and hands, resulting in a high average score of 5.45, compared to SketchUp’s lower average score of 1.45. The hold of the device while operating the ARchitect was easier to handle, with an average score of 5.5. The control group found SketchUp challenging to handle, with an average score of 3.65. However, entering information through the ARchitect App was perceived as easier, scoring a high average of 5.4. SketchUp was rated much lower, leading to an average score of 2.05. Fatigue in the arms or hands after using the ARchitect was found to be low with an average score of 5.6 while for SketchUp the average score was equal to 3.85. In addition, ARchitect was found to be easier to control, with an average score of 5.75. SketchUp scored lower, an average score of 2.25. Concerns about losing grip and dropping the device while using ARchitect had scored an average of 5.45. In comparison, SketchUp had a lower average score of 2.8. Despite these concerns, users found the operation of ARchitect simpler and less complicated, resulting in a high average score of 5.65 compared to SketchUp, scoring an average of 2.15.
Thus, ARchitect had a total manipulability score of 46.3 which surpasses SketchUp’s score, which was 23.07, highlighting the superior performance of ARchitect in physical interaction and control. The users appreciated its comfortable and intuitive design with lower physical effort and fatigue. Table 2 presents the manipulability measure score of the HARUS scale for the control group and the treatment group, respectively and Figure 5 graphically illustrates the results.
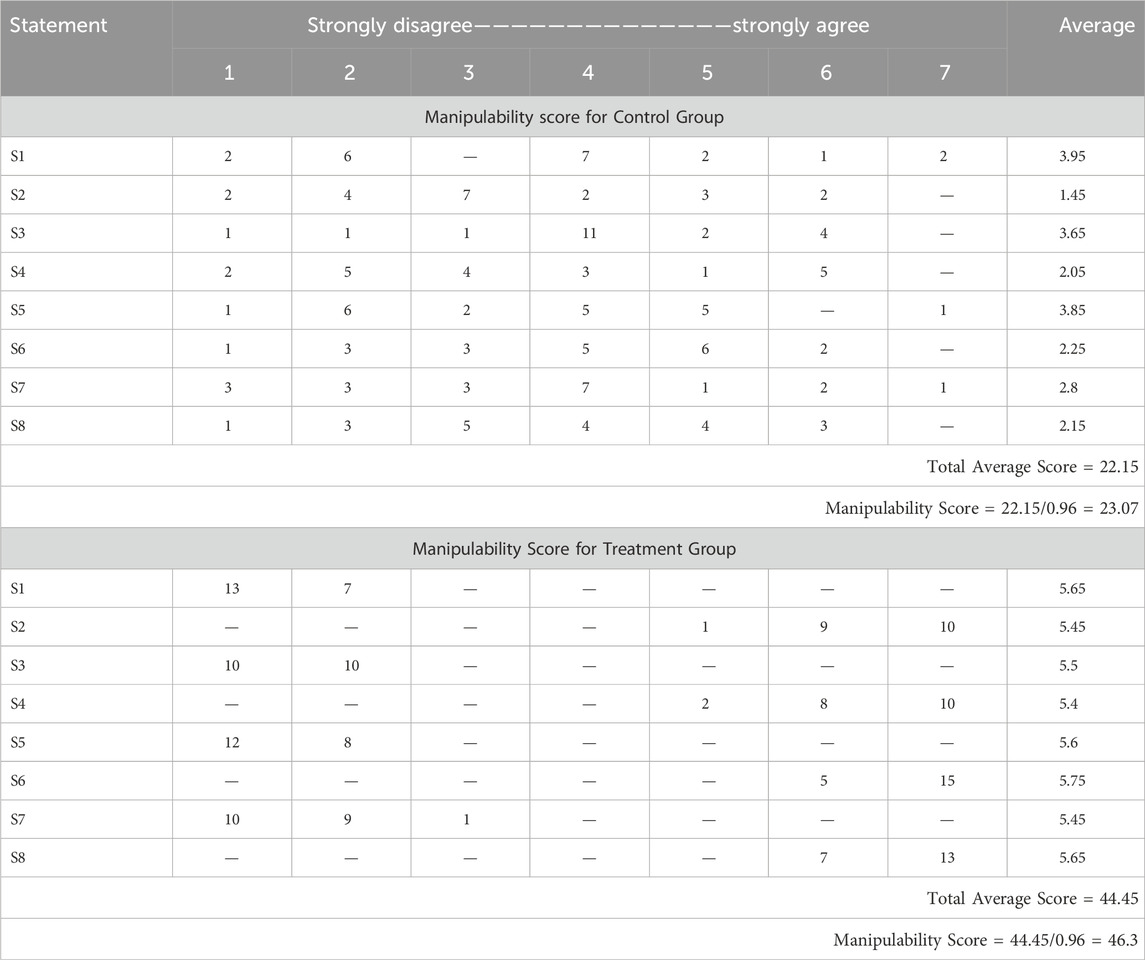
Table 2. Contribution of each statement in manipulability score of treatment and control group. Calculated score for control group = 23.07 while for treatment group = 46.3. Manipulability score constitutes the 50% of total HARUS score.
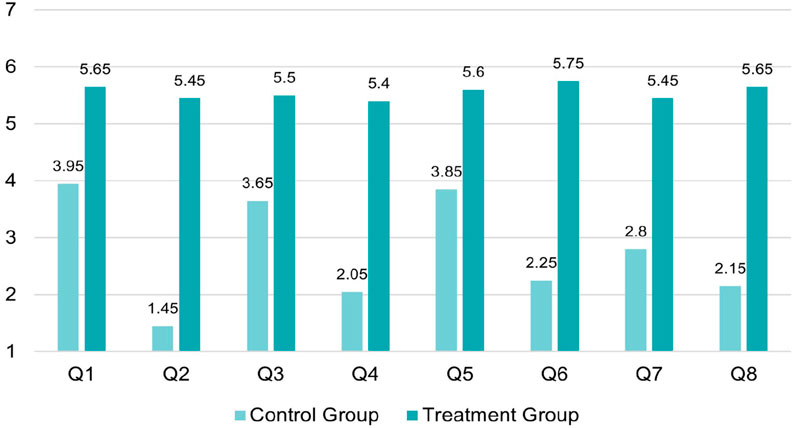
Figure 5. Average Score against each statement of manipulability measure for control and treatment group. x-axis represents the question number while y-axis represents the average score computed against each statement.
5.3 Comprehensibility
Result analysis of the comprehensibility measure shows the prominent difference between ARchitect and SketchUp in terms of measures, evaluated through various statements. The average score of 3.4 indicates that using SketchUp took a significant amount of mental work for the users in contrast to the users using ARchitect, having an average score of 5.75. Participants using SketchUp thought that the information displayed on the screen was appropriate with an average score of 2.3. However, ARchitect users scored an average of 5.6 for the same measure. Moreover, control group participants using SketchUp faced difficulty in reading the displayed information with an average score of 2.8 compared to ARchitect users, scoring an average of 5.7. The participants view on the rapid responsiveness of the information display of SketchUp yielded an average score of 2.55 for and regarding ARchitect, an average score of 5.55. About the statement that the information displayed on the screen was confusing, SketchUp scored an average of 3.45 and ARchitect scored 5.6. The readiness of words and symbols on the screen has yielded an average score of 2.9 for SketchUp and 5.6 for ARchitect. With an average score of 3.7, participants using SketchUp thought that the display was flickering too much compared to an average score of 5.5 calculated for participants using ARchitect. The consistency of the information displayed on screen has an average score of 2.8 for SketchUp and 6.15 for ARchitect.
Thus, these comparisons demonstrate the enhanced comprehensibility of the ARchitect, treated to the treatment group, with the comprehensibility score of 47.34 while the control group’s feedback points to areas for potential improvement with the score 24.89. The contribution of each statement to the total comprehensibility score is calculated in Table 3 and graphically illustrated in Figure 6.
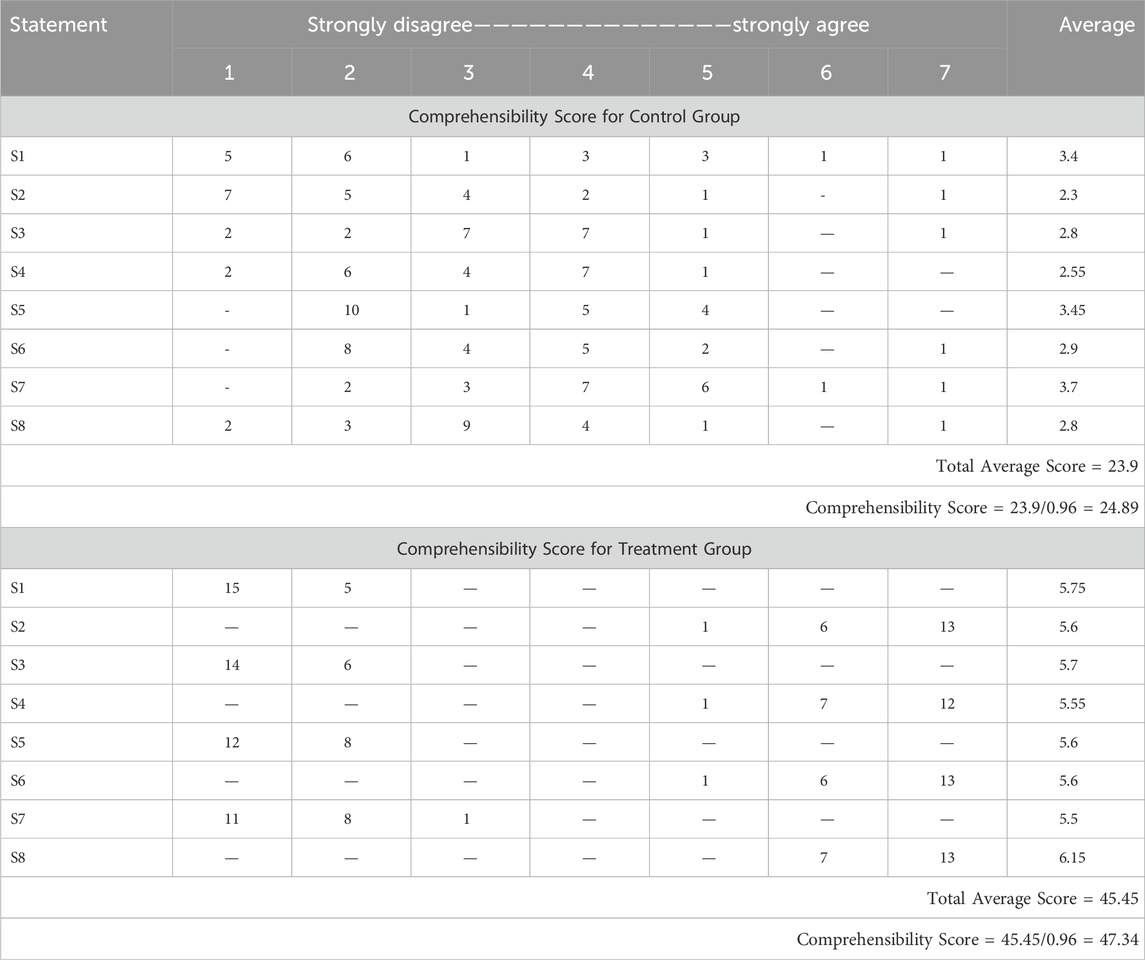
Table 3. Contribution of each statement in comprehensibility score of treatment and control group. Calculated score for control group = 24.89 while for treatment group = 47.34. Comprehensibility score constitutes the remaining 50% of total HARUS score.
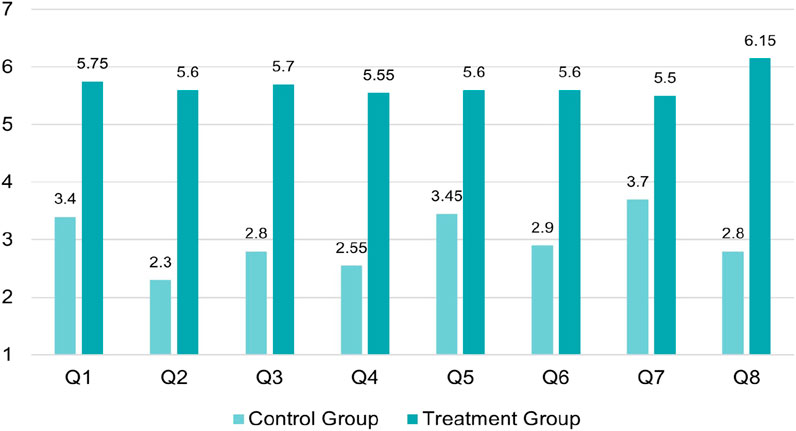
Figure 6. Average Score against each statement of comprehensibility measure for control and treatment group. x-axis represents the question number while y-axis represents the average score computed against each statement.
5.4 Statistical analysis
Statistical T-test results show that we can generalize our findings to the entire population and the difference in the scores of both measures does not occur by chance. On the basis of the results, we can reject the null hypotheses and consider the alternate hypotheses. The results depicted in Table 4, can be interpreted as:

Table 4. Results of an Independent Sample t-Test for Comprehensibility and Manipulability.
6 Discussion
The analysis of results demonstrates that ARchitect offers clear advantages over SketchUp in both manipulability and comprehensibility. Participants reported that using SketchUp felt more physically demanding, particularly for extended tasks, due to its reliance on desktop environments and less ergonomic interaction methods. In contrast, ARchitect’s mobile-based design was perceived as more comfortable, intuitive, and suited for quick, context-aware interaction.
User feedback also reflected a greater ease of use with ARchitect, where the interface was described as straightforward, accessible, and supported by clearly defined interaction cues. Despite being accessed on smaller mobile screens, ARchitect presented information in a well-organized and easily digestible format, resulting in reduced cognitive load. SketchUp, while benefiting from larger displays, received lower scores, indicating that screen size alone does not guarantee a more effective interface, particularly when it comes to spatial comprehension and interaction.
Although mobile augmented reality systems are known to face challenges such as limited processing power and occasional tracking instability, participants found ARchitect to be responsive and consistent in its visual feedback. The clarity and reliability of information displayed within the AR environment contributed to a more seamless user experience overall. These findings suggest that ARchitect is well-suited for real-world architectural visualization tasks, especially in collaborative settings where mobility, ease of interaction, and contextual relevance are essential.
7 Conclusion
The AEC industry faces persistent challenges in aligning traditional visualization and design methods with the evolving demands of the digital age. To address these challenges, our study introduces the “ARchitect” framework, a mobile-based markerless augmented reality system that facilitates the visualization and interaction of architectural elements directly within real-world construction environments. This research proposes a novel approach by eliminating reliance on physical markers and external hardware, enabling seamless integration of 3D models with contextual data for enhanced user interaction. The practical implications of this work are significant, as it empowers stakeholders to make timely and informed decisions during the design process, ultimately improving project outcomes. Quantitative evaluations demonstrate the framework’s superior performance compared to traditional methods. Specifically, the usability evaluation showed a 32% improvement in comprehensibility and a 27% enhancement in manipulability when compared to SketchUp. Moreover, the system achieved a usability score of 89.2 on the Handheld Augmented Reality Usability Scale (HARUS), surpassing the baseline of 70. A statistical analysis further confirmed that these improvements are significant, with a
Data availability statement
The raw data supporting the conclusions of this article will be made available by the authors, without undue reservation.
Ethics statement
The studies involving humans were approved by Quality Enhancement Cell’s Ethics Review Committee (ERC) University of Haripur. The studies were conducted in accordance with the local legislation and institutional requirements. The participants provided their written informed consent to participate in this study.
Author contributions
SI: Conceptualization, Methodology, Resources, Software, Writing – original draft. MK: Data curation, Formal Analysis, Project administration, Writing – review and editing. MA: Investigation, Project administration, Supervision, Visualization, Writing – review and editing. KA: Data curation, Formal Analysis, Writing – review and editing. SM: Data curation, Project administration, Resources, Writing – review and editing. TA: Data curation, Funding acquisition, Methodology, Writing – review and editing. WA: Funding acquisition, Project administration, Resources, Validation, Writing – review and editing.
Funding
The author(s) declare that financial support was received for the research and/or publication of this article. This project was funded by Deanship of Scientific Research (DSR) at King Abdulaziz University, Jeddah under grant No. (RG-6-611-43), the authors, therefore, acknowledge with thanks DSR technical and financial support. Moreover, the authors acknowledge with thanks the Vice Presidency for Graduate Studies, Research & Business at Dar Al-Hekma University in Jeddah, Saudi Arabia, for funding this research project and for offering their technical support.
Conflict of interest
The authors declare that the research was conducted in the absence of any commercial or financial relationships that could be construed as a potential conflict of interest.
Generative AI statement
The author(s) declare that no Generative AI was used in the creation of this manuscript.
Publisher’s note
All claims expressed in this article are solely those of the authors and do not necessarily represent those of their affiliated organizations, or those of the publisher, the editors and the reviewers. Any product that may be evaluated in this article, or claim that may be made by its manufacturer, is not guaranteed or endorsed by the publisher.
Footnotes
1https://help.sketchup.com/en/downloading-sketchup
3https://visualstudio.microsoft.com/downloads/
References
Abdelaal, M., Amtsberg, F., Becher, M., Estrada, R. D., Kannenberg, F., Calepso, A. S., et al. (2022). Visualization for architecture, engineering, and construction: shaping the future of our built world. IEEE Comput. Graph. Appl. 42, 10–20. doi:10.1109/mcg.2022.3149837
Agrawal, A., Singh, V., Thiel, R., Pillsbury, M., Knoll, H., Puckett, J., et al. (2024). Digital twin in practice: emergent insights from an ethnographic-action research study. 1253–1260. doi:10.1061/9780784483961.131
Anwar, M. S., Choi, A., Ahmad, S., Aurangzeb, K., Laghari, A. A., Gadekallu, T. R., et al. (2024). A moving metaverse: qoe challenges and standards requirements for immersive media consumption in autonomous vehicles. Appl. Soft Comput. 159, 111577. doi:10.1016/j.asoc.2024.111577
Anwar, M. S., Ullah, I., Ahmad, S., Choi, A., Ahmad, S., Wang, J., et al. (2023). “Immersive learning and ar/vr-based education: cybersecurity measures and risk management,” in Cybersecurity management in education technologies (Boca Raton: CRC Press), 1–22.
Ayala-Nino, F., Fabila, D., Cortes-Caballero, J., Perez Martine, a., Lopez-Galindo, F., and Hernandez-Chavez, M. (2023). Augmented reality to the creation of hybrid maps applied in soil sciences: a study case in ixmiquilpan hidalgo, Mexico. Multimedia Tools Appl. 83, 1. doi:10.1007/s11042-023-17491-3
Azuma, R. T. (1997). A survey of augmented reality. Presence Teleoperators and Virtual Environ. 6, 355–385. doi:10.1162/pres.1997.6.4.355
Baik, A. (2024). “The evaluation of the wooden structural system in hijazi heritage building via heritage bim,” in Structural analysis of historical constructions. Editors Y. Endo, and T. Hanazato (Cham: Springer Nature Switzerland), 407–420.
Bassier, M., Vermandere, J., Geyter, S. D., and Winter, H. D. (2024). Geomapi: processing close-range sensing data of construction scenes with semantic web technologies. Automation Constr. 164, 105454. doi:10.1016/j.autcon.2024.105454
Cakici Alp, N., Erkan Yazıcı, Y., and Öner, D. (2023). Augmented reality experience in an architectural design studio. Multimedia Tools Appl. 82, 45639–45657. doi:10.1007/s11042-023-15476-w
Chalhoub, J., and Ayer, S. K. (2018). Using mixed reality for electrical construction design communication. Automation Constr. 86, 1–10. doi:10.1016/j.autcon.2017.10.028
Chao, C.-H., Hadavi, A., and Krizek, R. J. (2000). “Toward a supply chain collaboration in the e-business era for the construction industry,” in Proceedings of the 17th IAARC/CIB/IEEE/IFAC/IFR international symposium on automation and robotics in construction. Editor M.-T. Wang, 1–6. doi:10.22260/ISARC2000/0089
Chi, H.-L., Kang, S.-C., and Wang, X. (2013). Research trends and opportunities of augmented reality applications in architecture, engineering, and construction. Automation Constr. 33, 116–122. doi:10.1016/j.autcon.2012.12.017
Darko, A., Chan, A. P., Adabre, M. A., Edwards, D. J., Hosseini, M. R., and Ameyaw, E. E. (2020). Artificial intelligence in the aec industry: scientometric analysis and visualization of research activities. Automation Constr. 112, 103081. doi:10.1016/j.autcon.2020.103081
Dong, S., and Kamat, V. (2013). Smart: scalable and modular augmented reality template for rapid development of engineering visualization applications. Vis. Eng. 1, 1–17. doi:10.1186/2213-7459-1-1
East, E. W., Kirby, J. G., and Perez, G. (2004). Improved design review through web collaboration. J. Manag. Eng. 20, 51–55. doi:10.1061/(ASCE)0742-597X(2004)20:2(51)
Field, A., and Hole, G. (2003). How to design and report experiments. Los Angeles: SAGE Publications Ltd.
Fiorillo, F., Teruggi, S., Pistidda, S., and Fassi, F. (2024). VR and holographic information system for the conservation project. Cham: Springer Nature Switzerland, 377–394.
Fraenkel, J. R., and Wallen, N. E. (2008). How to design and evaluate research in education. McGraw-Hill Higher Education.
Gheisari, M., Foroughi Sabzevar, M., Chen, P.-J., and Irizarry, J. (2016). Integrating bim and panorama to create a semi-augmented-reality experience of a construction site. Int. J. Constr. Educ. Res. Invit. 12, 303–316. doi:10.1080/15578771.2016.1240117
Gheorghiu, D., Ştefan, L., Hodea, M., and MoŢăianu, C. (2024). An archaeology of perception in the metaverse: seeing a world within a world through the artist’s eye. Cham: Springer Nature Switzerland, 179–209. chap. 1.
Hadavi, A., and Alizadehsalehi, S. (2024). From bim to metaverse for aec industry. Automation Constr. 160, 105248. doi:10.1016/j.autcon.2023.105248
Han, B., and Leite, F. (2022). Generic extended reality and integrated development for visualization applications in architecture, engineering, and construction. Automation Constr. 140, 104329. doi:10.1016/j.autcon.2022.104329
Knippers, J., Kropp, C., Menges, A., Sawodny, O., and Weiskopf, D. (2021). Integrative computational design and construction: rethinking architecture digitally. Civ. Eng. Des. 3, 123–135. doi:10.1002/cend.202100027
Krizek, R., and Hadavi, A. (2007). “Educating project managers for the construction industry,” in 2007 Annual Conference and Exposition (Honolulu, Hawaii: ASEE Conferences). Available online at: Https://peer.asee.org/2740.
Lotsaris, K., Fousekis, N., Koukas, S., Aivaliotis, S., Kousi, N., Michalos, G., et al. (2021). “Augmented reality (ar) based framework for supporting human workers in flexible manufacturing,” in 8th CIRP Global Web Conference – Flexible Mass Customisation (CIRPe 2020), 96 301–306. doi:10.1016/j.procir.2021.01.091
Marino, E., Barbieri, L., Colacino, B., Fleri, A. K., and Bruno, F. (2021). An augmented reality inspection tool to support workers in industry 4.0 environments. Comput. Industry 127, 103412. doi:10.1016/j.compind.2021.103412
Milgram, P., and Colquhoun, H. (1999). A Taxonomy of Real and virtual world display integration (citeseer), 1. 5–30.
Milgram, P., Takemura, H., Utsumi, A., and Kishino, F. (1995). “Augmented reality: a class of displays on the reality-virtuality continuum,” in Telemanipulator and telepresence technologies. Editor H. Das (Boston, MA: International Society for Optics and Photonics SPIE), 2351, 282–292. doi:10.1117/12.197321
Mitterberger, D., Dörfler, K., Sandy, T., Salveridou, F., Hutter, M., Gramazio, F., et al. (2020). Augmented bricklaying: human–machine interaction for in situ assembly of complex brickwork using object-aware augmented reality. Constr. Robot. 4, 1. doi:10.1007/s41693-020-00035-8
Mohammadpour, A., Karan, E., Asadi, S., and Rothrock, L. (2015). Measuring end-user satisfaction in the design of building projects using eye-tracking technology. Austin, TX, USA, 564–571. doi:10.1061/9780784479247.070
Murthy, J., Dsouza, R. R., and Lavanya, A. R. (2023). “Visualize the 3d virtual model through augmented reality (ar) using mobile platforms,” in Recent advances in civil engineering. Editors L. Nandagiri, M. C. Narasimhan, and S. Marathe (Singapore: Springer Nature Singapore), 837–863.
Olsen, D., Kim, J., and Taylor, J. (2019). “Using augmented reality for masonry and concrete embed coordination,” in Proceedings of the creative construction conference 2019, 906–913. doi:10.3311/CCC2019-125
Pan, N.-H., and Isnaeni, N. N. (2024). Integration of augmented reality and building information modeling for enhanced construction inspection—a case study. Buildings 14, 612. doi:10.3390/buildings14030612
Panya, D. S., Kim, T., and Choo, S. (2023). An interactive design change methodology using a bim-based virtual reality and augmented reality. J. Build. Eng. 68, 106030. doi:10.1016/j.jobe.2023.106030
Peng, X., Ma, Z., Wang, P., Huang, Y., and Qi, M. (2023). “Exploring the application of sketchup and twinmotion in building design planning,” in Artificial intelligence in China. Editors Q. Liang, W. Wang, J. Mu, X. Liu, and Z. Na (Singapore: Springer Nature Singapore), 18–24.
Piras, G., Agostinelli, S., and Muzi, F. (2025). Smart buildings and digital twin to monitoring the efficiency and wellness of working environments: a case study on iot integration and data-driven management. Appl. Sci. 15, 4939. doi:10.3390/app15094939
Ratajczak, J., Riedl, M., and Matt, D. (2019). Bim-based and ar application combined with location-based management system for the improvement of the construction performance. Buildings 9, 118. doi:10.3390/buildings9050118
Ratcliffe, J., and Simons, A. (2017). “How can 3d game engines create photo-realistic interactive architectural visualizations?,” in E-learning and games. Editors F. Tian, C. Gatzidis, A. El Rhalibi, W. Tang, and F. Charles (Cham: Springer International Publishing), 164–172.
Ridel, B., Reuter, P., Laviole, J., Mellado, N., Couture, N., and Granier, X. (2014). The revealing flashlight: interactive spatial augmented reality for detail exploration of cultural heritage artifacts. J. Comput. Cult. Herit. (JOCCH) 7, 1–18. doi:10.1145/2611376
Salavitabar, A., Zampi, J., Thomas, C., Zanaboni, D., Les, A., Lowery, R., et al. (2023). Augmented reality visualization of 3d rotational angiography in congenital heart disease: a comparative study to standard computer visualization. Pediatr. Cardiol. 45, 1759–1766. doi:10.1007/s00246-023-03278-8
Santos, M. E. C., Taketomi, T., Sandor, C., Polvi, J., Yamamoto, G., and Kato, H. (2014). “A usability scale for handheld augmented reality,” in Proceedings of the 20th ACM symposium on virtual reality software and technology (VRST ’14) (New York: ACM), 167–176. doi:10.1145/2671015.2671019
Sedlmair, M., Heinzl, C., Bruckner, S., Piringer, H., and Möller, T. (2014). Visual parameter space analysis: a conceptual framework. IEEE Trans. Vis. Comput. Graph. 20, 2161–2170. doi:10.1109/tvcg.2014.2346321
Seipel, S., Andree, M., Larsson, K., Paasch, J., and Paulsson, J. (2020). Visualization of 3d property data and assessment of the impact of rendering attributes. J. Geovisualization Spatial Analysis 4, 23. doi:10.1007/s41651-020-00063-6
Singh, V., Gu, N., and Wang, X. (2011). A theoretical framework of a bim-based multi-disciplinary collaboration platform. Automation Constr. 20, 134–144. doi:10.1016/j.autcon.2010.09.011
Skov, M. B., Kjeldskov, J., Paay, J., Husted, N., Nørskov, J., and Pedersen, K. (2013). Designing on-site: facilitating participatory contextual architecture with mobile phones. Pervasive Mob. Comput. 9, 216–227. doi:10.1016/j.pmcj.2012.05.004
Spallone, R., and Natta, F. (2022). H-BIM modelling for enhancing modernism architectural archives reliability of reconstructive modelling for on paper architecture, 1. Cham: Springer International Publishing, 809–829. doi:10.1007/978-3-030-76239-1_34
Um, J., min Park, J., yeon Park, S., and Yilmaz, G. (2023). Low-cost mobile augmented reality service for building information modeling. Automation Constr. 146, 104662. doi:10.1016/j.autcon.2022.104662
Valizadeh, M., Ranjgar, B., Niccolai, A., Hosseini, H., Rezaee, S., and Hakimpour, F. (2024). Indoor augmented reality (ar) pedestrian navigation for emergency evacuation based on bim and gis. Heliyon 10, e32852. doi:10.1016/j.heliyon.2024.e32852
Vassigh, S., Davis, D., Behzadan, A., Mostafavi, A., Rashid, K., Alhaffar, H., et al. (2018). Teaching building sciences in immersive environments: a prototype design, implementation, and assessment. Int. J. Constr. Educ. Res. 16, 180–196. doi:10.1080/15578771.2018.1525445
Wang, X., Wang, J., Wu, C., Xu, S., and Ma, W. (2022). Engineering brain: metaverse for future engineering. AI Civ. Eng. 1, 2. doi:10.1007/s43503-022-00001-z
Yap, J., Lam, C., Skitmore, M., and Talebian, N. (2022). Barriers to the adoption of new safety technologies in construction: a developing country context. J. Civ. Eng. Manag. 28, 120–133. doi:10.3846/jcem.2022.16014
Keywords: augmented reality, 3D interaction, markerless tracking, architecture, handheld AR, 3D visualization, virtual world
Citation: Israr S, Khan MA, Anwar MS, Awan KA, Mahfoudh S, Althaqafi T and Alhalabi W (2025) ARchitect: advancing architectural visualization and interaction through handheld augmented reality. Front. Virtual Real. 6:1592287. doi: 10.3389/frvir.2025.1592287
Received: 12 March 2025; Accepted: 03 June 2025;
Published: 11 August 2025.
Edited by:
Andrea Sanna, Polytechnic University of Turin, ItalyReviewed by:
Luca Ulrich, Polytechnic University of Turin, ItalyArnis Cirulis, Vidzeme University of Applied Sciences, Latvia
Copyright © 2025 Israr, Khan, Anwar, Awan, Mahfoudh, Althaqafi and Alhalabi. This is an open-access article distributed under the terms of the Creative Commons Attribution License (CC BY). The use, distribution or reproduction in other forums is permitted, provided the original author(s) and the copyright owner(s) are credited and that the original publication in this journal is cited, in accordance with accepted academic practice. No use, distribution or reproduction is permitted which does not comply with these terms.
*Correspondence: Muhammad Shahid Anwar, bXVoYW1tYWQuYW53YXIuMUBrZnVwbS5lZHUuc2E=