 Shinnosuke Hori
 Renke Liu1
 Hideyuki Sawada
- 1Department of Pure and Applied Physics, Graduate School of Advanced Science and Engineering, Waseda University, Tokyo, Japan
- 2Department of Applied Physics, Faculty of Science and Engineering, Waseda University, Tokyo, Japan
As virtual reality (VR) technology advances, the need for realistic pain presentation to enhance immersion grows. The thermal grill illusion (TGI), which elicits a burning sensation through the simultaneous application of warm and cold stimuli, has emerged as a promising technique. To apply TGI in VR for pain intensity control, clarifying the relationship between stimulus parameters and perceptual intensity is crucial. In this study, we constructed a TGI display using six thermoelectric devices and conducted two user experiments. The first experiment investigated the relationship between the cooling rate of cold stimuli and TGI-induced pain intensity. Results indicated that faster cooling rates intensified perceived pain. The second experiment implemented pain intensity control in a VR environment. As a result, six out of seven participants reported that the perceived intensity of pain changed in response to the changes in the VR stimuli. Our findings demonstrate that manipulating the cooling rate can effectively control pain intensity in VR, enhancing the realism and immersion of VR experiences.
1 Introduction
In recent years, VR technology has been rapidly expanding into various fields, including entertainment, education, and healthcare. With this widespread adoption of VR, research on haptic presentation technologies to enhance the reality and immersion of VR environments has been actively pursued. While much of this research has focused on tactile sensation (Benko et al., 2016; Schorr and Okamura, 2017; Strohmeier et al., 2020; Fu et al., 2025), force feedback (Lopes et al., 2015; 2018; Liu et al., 2024), and thermal sensations (Peiris et al., 2017; Ragozin et al., 2020; Hoffmann et al., 2023), pain presentation is also a crucial element for enhancing the reality and immersion in VR environments. Furthermore, Research on pain treatment using VR has been active in recent years (Huang et al., 2022; Groenveld et al., 2023); therefore, pain presentation in VR environments may contribute to advances in medicine.
Studies on pain presentation in VR have explored various methods, including electrical stimulation (Lopes et al., 2015; Lopes et al., 2017), thermal stimulation (Eckhoff et al., 2022), magnetic brain stimulation (Tanaka et al., 2024), and the generation of pseudo-pain through VR visuals alone (Weir et al., 2012; Eckhoff et al., 2020). In this study, we employ TGI as a pain presentation.
TGI is a phenomenon in which a burning sensation, akin to pain, is experienced by simultaneously presenting a warm stimulus (approximately 40°C) and a cold stimulus (approximately 20°C) to spatially adjacent locations on the skin (Leung et al., 2005; Defrin et al., 2008; Bach et al., 2011). The warm and cold stimuli required for TGI presentation are temperatures that are harmless to the human body, making it a safer and simpler pain presentation technique compared to other methods such as electrical stimulation. Additionally, because TGI presentation uses warm and cold stimuli, it has the advantage of enabling the presentation of not only pain but also warm and cold sensations through a TGI display. Furthermore, Gao et al. demonstrated that using TGI for pain presentation in a VR environment improves the sense of presence and body ownership in the VR environment (Gao et al., 2024). However, there are currently few studies integrating TGI into VR.
While TGI is a promising method for presenting pain in VR environments, its generation mechanism is still under investigation (Fardo et al., 2020; Mitchell et al., 2024), and the relationship between stimulus parameters and perceptual intensity is complex. This relationship is crucial when applying TGI as a pain presentation technology in VR. In particular, when using a TGI display for presenting pain and thermal sensation in VR applications where the situation changes from moment to moment, it is important to clarify the relationship between the temperature change rate of the thermal stimulus and the perceptual intensity of TGI.
In this study, we developed a TGI display and a VR application, and subsequently, we conducted two user experiments using these systems. In the first experiment, we investigated the relationship between the temperature change rate of the cold stimulus and perceptual intensity in TGI. As a result, we confirmed that the faster the cooling rate of the cold stimulus, the stronger the perceived pain. In the second experiment, we conducted a pain presentation in a VR environment utilizing temperature manipulation of cold stimuli. As a result, six out of seven participants reported changes in pain perception corresponding to the changes in the VR scene.
2 Related work
This chapter introduces previous studies that investigated the relationship between stimulus parameters and perception in TGI. A list of prior research is summarized in Table 1.
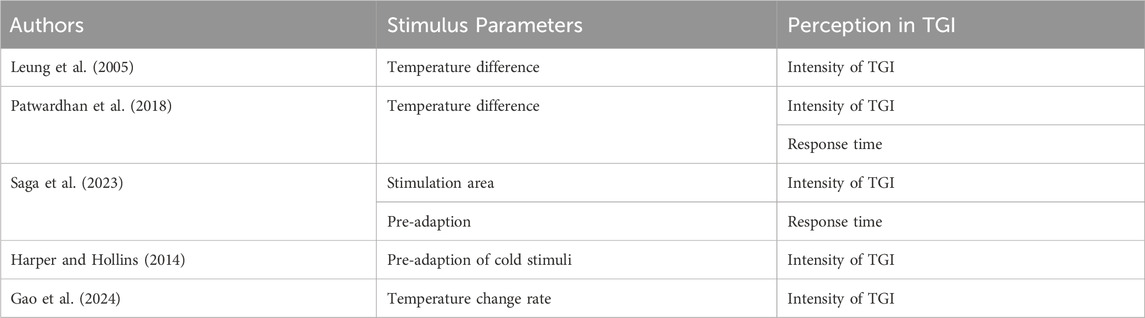
Table 1. Previous research on the relationship between TGI perception and stimulus parameters.
Leung et al. demonstrated that increasing the temperature difference between warm and cold stimuli intensifies pain (Leung et al., 2005). Subsequently, Patwardhan et al. showed that increasing the temperature difference between warm and cold stimuli not only intensifies pain but also shortens the response time to perceive pain (Patwardhan et al., 2018). Saga et al. using warm and cold stimuli arranged alternately in a grid pattern, showed that increasing the number of grids and the thermal stimulation area intensifies pain (Saga et al., 2023). They also showed that a larger temperature difference between pre-adaptation warm and cold stimuli shortens the response time to perceive pain. Harper and Hollins discovered that adapting to cold stimuli before TGI presentation reduces pain, suggesting that cold stimuli may be inducing pain in TGI (Harper and Hollins, 2014).
Gao et al. (2024) showed that increasing the temperature change rate of warm and cold stimuli intensifies pain. They also showed that even if the total temperature change rate of warm and cold stimuli is the same, increasing the temperature change rate of the cold stimulus reduces pain. This research provided important insights into the relationship between the temperature change rate of warm and cold stimuli and pain, but several unresolved issues remain. For example, the relationship between the cooling rate of the cold stimulus and pain when the temperature change rate of the warm stimulus is constant has not been clarified.
We hypothesized that varying the temperature change rate of cold stimuli would create differences in the perceived intensity of TGI, similar to the relationship between the temperature change rate of warm stimuli and TGI perception intensity demonstrated by a previous study (Gao et al., 2024). This study aimed to elucidate the relationship between the temperature change rate of cold stimuli and TGI perception intensity and to verify the effectiveness of pain presentation in a VR environment using cold stimulus temperature manipulation.
3 System implementation of TGI presentation
We constructed a TGI display utilizing six independently temperature-controlled Peltier elements. By independently controlling the temperature, we achieved continuous cold stimulus modulation, enabling pain presentation synchronized with VR visuals. Participants were presented with VR through a head-mounted display (HMD).
3.1 Design and construction of TGI display
Peltier elements were chosen for their precise temperature control and rapid thermal response, offering significant advantages over water-based or other thermal stimulation systems for generating the thermal grill illusion via dynamic temperature modulation. In the TGI display, two Peltier elements (50 mm × 20 mm × 3.5 mm) (TEC1-07908) were used for the hot stimuli, and four Peltier elements (20 mm × 20 mm × 3.6 mm) (FPH1-7104NC) were used for the cold stimuli. In the TGI display, Peltier elements are arranged as shown in Figures 1a,b, where two warm-stimulus Peltier elements flank four cold-stimulus Peltier elements to generate a thermal grill illusion by alternately arranging the warm and cold stimuli. The temperature of the Peltier elements was measured using thermistors. The thermistors were placed directly on the Peltier element’s surface and covered with insulating tape to secure them to the element surface and mitigate noise from external disturbances, such as contact with the user’s skin. As shown in Figure 1c, the Peltier elements were placed on a cooling fan and heat sink for heat dissipation, while thermal grease was applied between the Peltier elements and the heat sink to improve thermal conductivity. A frame for fixing the Peltier elements was fabricated by 3D printing and fixed onto the heat sink using adhesive.
Figure 1. Structure and setup of the proposing TGI display: (a) Arrangement of warm and cold stimuli and thermistors (b) Actual arrangement of Peltier elements (c) Appearance of the TGI display.
To enable pain presentation through temperature rate manipulation, each of the four cold-stimulus Peltier elements was independently controlled. Since the cooling of the cold stimuli must be performed within a range that does not cause skin damage, such as frostbite, the elements for cold stimulation need to be heated back to their original temperature after cooling to a temperature within the safe range. Therefore, applying identical temperature control to all cooling elements would result in periods when the cold stimulus elements are not actively cooling, making it difficult to control pain intensity using the manipulation of cooling rates.
3.2 System control method
To control the temperature of the Peltier elements and to facilitate the use of the TGI display within a VR environment, a Raspberry Pi 4 Model B was utilized as the control board in this study. Figure 2 shows the control system of the TGI display constructed in this study. The temperatures of the six Peltier elements used for the hot and cold stimuli were measured independently using six thermistors (103JT-025). The voltage change due to the resistance change of the thermistors was measured using a voltage divider circuit, and the voltage signal was amplified by a non-inverting amplifier circuit using an operational amplifier (NJU7034D). The resistance of the non-inverting amplifier circuit was appropriately selected, and the gain was adjusted to improve the resolution of the Analog-to-Digital (AD) converter (MCP3008-I/P) used for digital signal input to the Raspberry Pi. The temperature measurement circuit for the Peltier elements used in the experiment is shown in Figure 3.
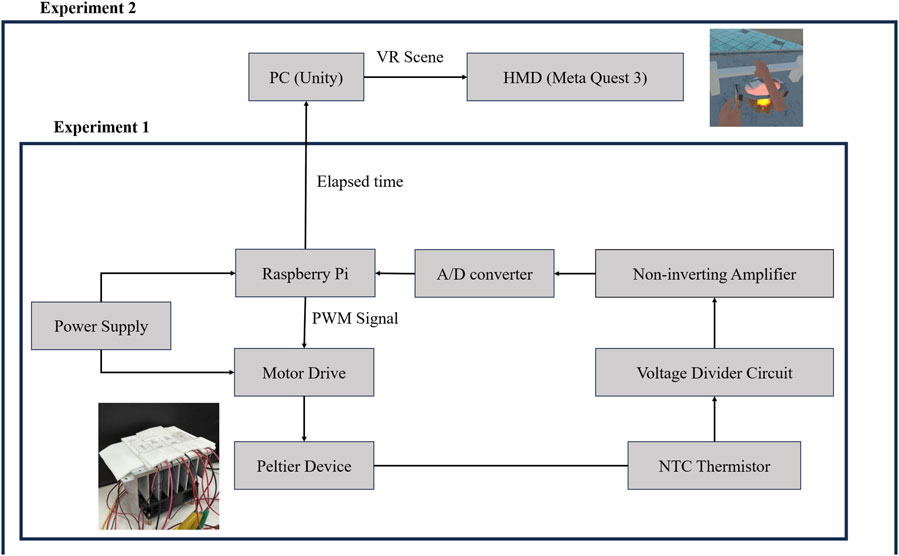
Figure 2. Proposed TGI presentation system.
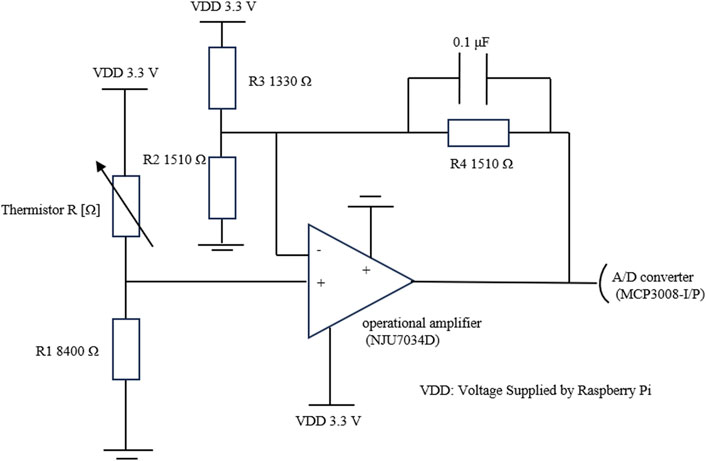
Figure 3. The temperature measurement circuit.
The current supplied to the Peltier elements was controlled by PWM using the Raspberry Pi. The duty cycle in PWM control was adjusted using Proportional-Integral-Derivative (PID) control. In the experiments, the target temperatures for the PID control were set as follows: the hot stimuli were maintained at a constant 41°C, while the cold stimuli were cyclically varied between 25°C and 20°C. The temperature of the warm stimuli was selected to be high enough to enhance the intensity of the thermal grill illusion while being low enough to prevent pain caused by the continuous warm stimuli. The temperature range of the cold stimuli was set within the parameters capable of eliciting the TGI.
To continuously present a cooling cold stimulus to the skin, a method adapted from Manasrah et al. was employed (Manasrah et al., 2017). This involved applying a phase difference to the temperature control of the four Peltier elements used for cold stimulation. Consequently, when one element finished cooling, another element began cooling (Figure 4). Continuously presenting a cooling cold stimulus to the skin allows for prolonged, uninterrupted implementation of TGI intensity control using cold stimulus temperature manipulation. This not only provides participants with more time to assess pain but also enhances the feasibility of interactive applications of the proposed pain intensity control within VR environments.
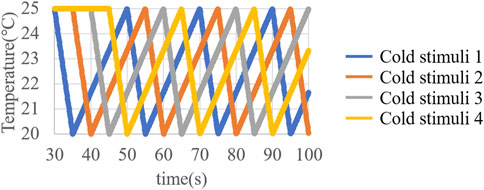
Figure 4. Target temperature of the cold stimulus in PID control.
The second experiment was conducted on a pain presentation in a VR environment utilizing temperature manipulation of cold stimuli. The VR application was developed using Unity and presented to users via a head-mounted display (Meta Quest 3). In the user experiment, participants were presented with visual and auditory pain stimuli of varying intensities within a VR environment (Figure 5), while simultaneously experiencing tactile pain stimuli via the TGI display in the real world. To synchronize the timing of VR-based pain presentation and TGI display-based pain presentation, a Raspberry Pi transmitted elapsed time information from the start of temperature control to Unity via socket communication. Unity then utilized this information to alter the VR visuals dynamically. Although this study employed predetermined temperature control to modulate the VR environment, we propose that transmitting event information generated within the VR application from Unity to the Raspberry Pi would enable the TGI display to be applied as an interactive pain presentation device within VR games.
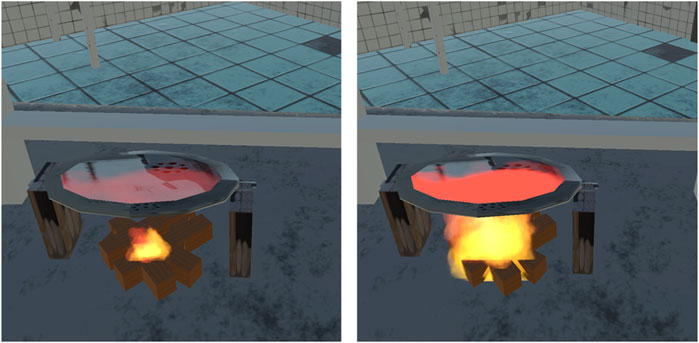
Figure 5. Changes in VR Pain Presentation (To replicate the burning sensation of TGI, a heated iron plate was simulated. The intensity of the perceived pain was represented by changes in flame scale, burning sound volume, and the color of the iron plate’s texture).
4 User experiment 1: the effect of cooling rate on perceived intensity of TGI
The first user experiment investigated the effect of the cooling rate of cold stimuli on the perceived intensity of the TGI. Eleven participants (8 male, and 3 female) aged between 21 and 27 years old participated in this experiment. The number of participants in our user experiments, including User Experiment 2, was determined based on prior studies concerning the application of the thermal grill illusion to human-machine interfaces (Patwardhan et al., 2018; Saga et al., 2023; Gao et al., 2024) and haptic presentation in VR environments (Peiris et al., 2017; Tanaka et al., 2024). According to self-report, participants had no physical impairments in their arms and possessed normal perception of thermal and pain sensations.
All user experiments in this study, including User Experiment 2, were approved by the ethical review board of our university (2024-615).
4.1 Experimental setup
In this experiment, the participant’s right medial forearm was placed on the TGI display to present the warm and cold stimuli. According to previous studies (Saga et al., 2023), the perceived intensity of the TGI can be influenced by the area of the thermal stimuli. To ensure a consistent contact area between the display and the forearm throughout the experiment per participant, the participants gripped a bar fixed in front of the display (Figure 6). During the presentation of the thermal stimuli, participants wore headphones with white noise and an eye mask to concentrate on the sensation in their right forearm.
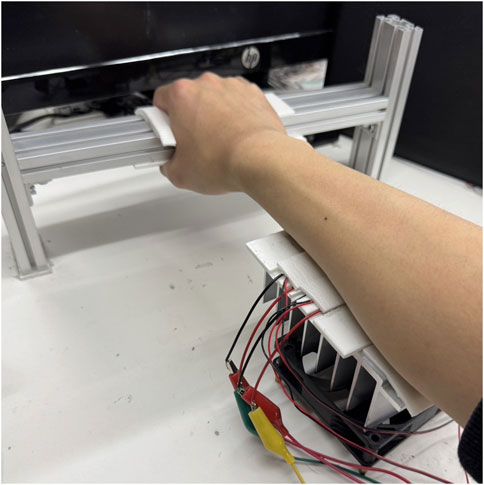
Figure 6. Method of applying the TGI display to participants.
To investigate the effect of cooling rate on pain intensity, five cooling time patterns (5.0 s, 7.5 s, 10.0 s, 12.5 s, and 15.0 s) (1.00°C/s, 0.67°C/s, 0.50°C/s, 0.40°C/s, and 0.33°C/s) were used for the cold stimuli, which were cooled from 25°C to 20°C. The temperature recording of the Peltier elements was started when the cold stimuli reached around 25°C and the hot stimuli reached around 40°C. For the first 30 s, the temperature was kept constant at 41°C for the hot stimuli and 25°C for the cold stimuli for stabilization. An example of the temperature change measured by the thermistors when the cooling time was 5 s is shown in Figure 7. The four Peltier elements used for the cold stimuli were cooled in the order shown in Figure 8. The four elements for cold stimulation were cooled sequentially, starting with the top-right element and proceeding in a clockwise order. Once an element finished cooling, it would gradually heat up, reaching 25°C at the point when the preceding element in the cooling sequence completed its cooling cycle, and then began cooling again.
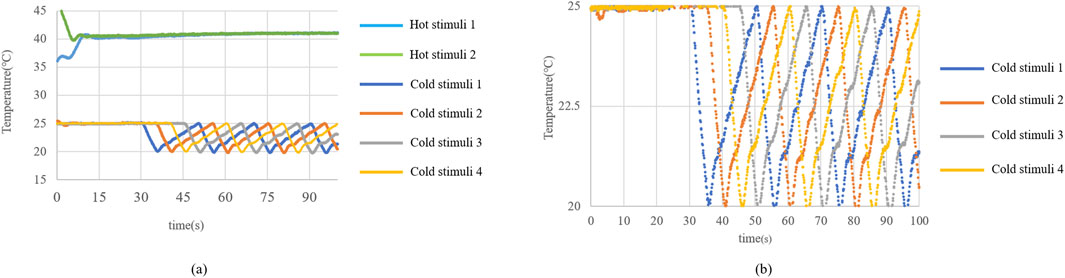
Figure 7. Actual temperature change (cooling time 5 s): (a) Warm and cold stimuli (b) Cold stimulus.
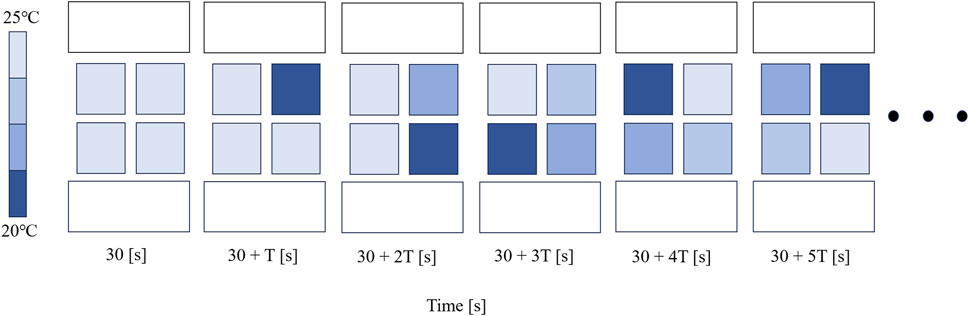
Figure 8. Cooling order of the cold stimulus (T = 5.0, 7.5, 10.0, 12.5, 15.0).
The source code necessary to reproduce the methodology of this study is publicly available at https://doi.org/10.5281/zenodo.15645245.
4.2 Experimental procedure
Participants were presented with a total of six thermal stimulus patterns: five patterns with different cooling times for the cold stimuli and one reference pattern with constant temperatures (41°C for hot stimuli and 25°C for cold stimuli). Pain intensity was assessed using a Visual Analogue Scale (VAS). The VAS is widely employed and recognized for its validity and reliability in pain assessment (Begum and Hossain, 2019). Participants rated their pain on an on-screen slider from 0 (“no pain”) on the left to 100 (“worst imaginable pain”) on the right.
First, the reference thermal stimulus was presented to the participant for 70 s. After the presentation, the participant rated the maximum pain intensity felt during the presentation using a VAS. Subsequently, the five patterns with different cooling times for the cold stimuli were presented in random order for each participant. For each of the five patterns, the reference thermal stimulus pattern was presented for the first 10 s after the participant placed their right forearm on the TGI display to re-establish the baseline pain intensity. Then, the temperature change of the cold stimuli was initiated and presented for 70 s. The 70-s duration was determined considering both the varying thermal sensitivities across different body regions (Stevens Kenneth K and Choo, 1998) and the minimum 60 s required for all four Peltier elements to complete their cooling cycles when the cooling time was at its maximum (15 s). The timing of 10 s after placing the arm on the TGI display was signaled by a light tap on the participant’s shoulder. Participants were instructed to compare the pain felt from the initial reference stimuli with the pain felt during the subsequent stimuli with changing cold temperatures and to rate the maximum pain intensity using the VAS. An approximately two-minute interval was provided between each of the six thermal stimuli presentations (including the reference) to allow for heat dissipation from the Peltier elements. During the approximately two-minute interval between the end of one stimulus presentation and the start of the next, participants removed their right forearm from the TGI display to rest and rated the pain intensity using the VAS. The experiment took approximately 30 min per participant. In all user experiments, including Experiment 2, we did not collect data that would allow us to report erythema, after-sensations, or relative cumulative exposure to ISO 13732 limits. However, participants’ conditions were continuously monitored throughout the experiments, and no hazardous reactions or adverse events, such as burns or frostbite, were observed during or after the experiments.
4.3 Results
Figure 9 shows the distribution of VAS scores for each stimulus pattern, visualized through box plots and superimposed scatter plots. To investigate whether there are significant differences in the VAS values for each thermal stimulus pattern, we conducted a Friedman test, and for post hoc analysis, performed paired Wilcoxon signed-rank tests with Holm correction. A Friedman test confirmed a significant difference among the five cooling time patterns (5 s, 7.5 s, 10 s, 12.5 s, and 15 s) (χ2 (4) = 20.055, p = 0.00049). Subsequent Wilcoxon signed-rank tests for pairwise comparisons among the five patterns revealed significant differences between: 5 s and 10 s (T = 3.50, Holm-adjusted p = 0.039, r = 0.849, 95% CI = [0.465, 0.994]); 5s and 12.5s (T = 4.00, p = 0.048, r = 0.816, 95% CI = [0.437, 0.994]); 5 s and 15 s (T = 1.00, Holm-adjusted p = 0.049, r = 0.819, 95%CI = [0.572, 0.994]); 7.5 s and 10 s (T = 0.00, Holm-adjusted p = 0.010, r = 0.994, 95% CI = [0.994, 0.994]); and 7.5 s and 15 s (T = 0.00, Holm-adjusted p = 0.010, r = 0.994, 95% CI = [0.994, 0.994]).
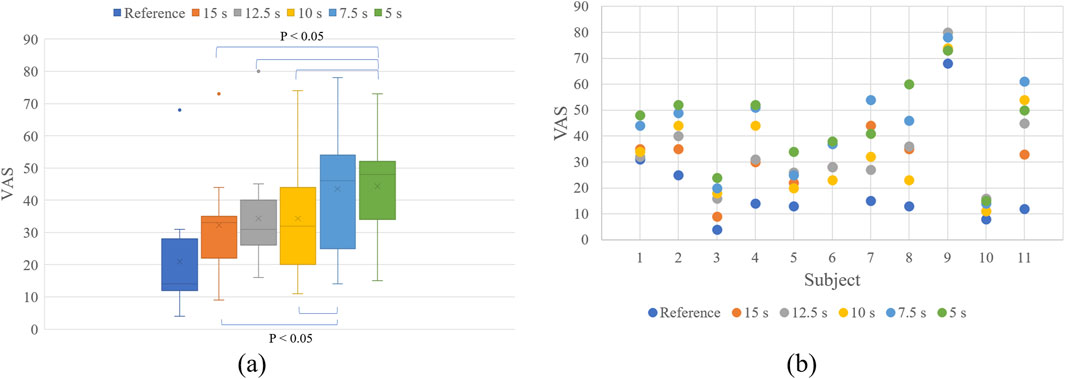
Figure 9. Experiment 1 Results: (a) Box plot (b) Scatter plot.
4.4 Discussion
The results of User Experiment 1 revealed a trend of increasing perceived pain during TGI stimulation with faster cooling rates of the cold stimuli. This finding contrasts with the previous study, which did not establish a clear relationship between the rate of temperature change of the cold stimulus and the perceived intensity of the TGI (Gao et al., 2024). While the previous study used cold stimuli with rates of temperature change ranging from 1°C/s to 5°C/s, our study employed a narrower range of 0.33°C/s to 1°C/s. Within this narrower range, we observed significant differences in pain perception. Notably, a significant difference in the intensity of perceived pain was detected between stimulation patterns that varied by as little as 0.17°C/s in cooling rate. We attribute this discrepancy to two potential factors. First, the methods of temperature control differed between our study and the previous work. We adopted the temperature control method described by Manasrah et al. (Manasrah et al., 2017), which ensured continuous cooling at the cold stimulation sites. This allowed us to present the TGI to participants with continuous cold stimulation for 70 s, enabling long-duration pain perception assessment. Second, the range of temperature change rates used in the studies varied. Our study focused on rates below 1°C/s. It is plausible that at rates above 1°C/s, variations in the cooling rate of the cold stimulus might not significantly influence pain intensity. Moreover, in our study, significant differences in pain were observed only between the two groups: one with cooling times of 5 s and 7.5 s, and the other with 10 s, 12.5 s, and 15 s. To gain a more comprehensive understanding of the relationship between the cooling rate of the cold stimulus and the perceived pain intensity, further experiments utilizing a wider range of temperature change rates are necessary.
5 User experiment 2: pain presentation in a VR application
User Experiment 1 indicated a trend of increased pain sensation during the TGI stimulation with faster cooling rates of the cold stimuli. In this experiment, we presented pain within a VR environment based on the TGI presentation method used in Experiment 1 and evaluated its effectiveness. Seven participants (5 male, and 2 female) aged between 20 and 25 years old participated in this experiment. Six of the seven participants also participated in Experiment 1. According to self-report, participants had no physical impairments in their arms and possessed normal perception of thermal and pain sensations.
5.1 Experimental setup
Similar to User Experiment 1, participants placed the medial side of their right forearm on the TGI display while gripping a bar. Participants also wore a head-mounted display (Meta Quest 3) and headphones to experience VR visuals and audio. Hand movements were tracked using the cameras built into the Meta Quest 3. The VR application was developed using Unity 2021.3.39f1. In the VR application, Participants were situated in a virtual abandoned hospital room, seated on a chair facing a hot plate heated by flames and a bar. The position of the TGI display and bar was carefully aligned with the virtual hot plate and bar for each participant. When the participant placed their forearm on the TGI display, a virtual model of their forearm, tracked in real-time, was placed on the virtual hot plate (Figure 10).
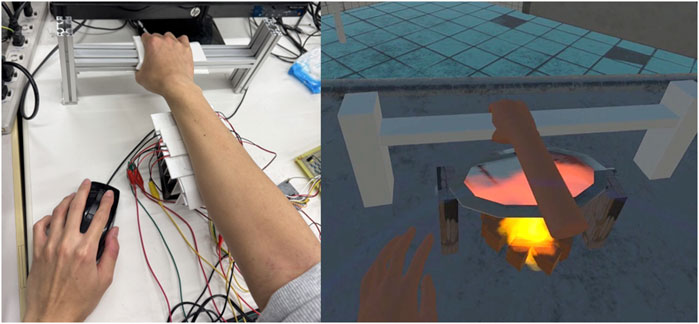
Figure 10. The way the participant’s hand movements are reproduced in the VR environment.
The TGI display was set to deliver a constant hot stimulus of 41°C and cold stimuli with varying cooling rates, as shown in Figure 11. Similar to Experiment 1, the cold stimulus fluctuated between 25°C and 20°C, but unlike Experiment 1, the cooling time was not constant. The cooling time for each Peltier element progressively decreased (15 s, 12.5 s, 10 s, 7.5 s, 5 s) and then progressively increased (7.5 s, 10 s, 12.5 s, 15 s) with the same cooling order as in Experiment 1. And the intensity of the virtual flames was increased as the cooling time decreased, and decreased as the cooling time increased (Figure 11).
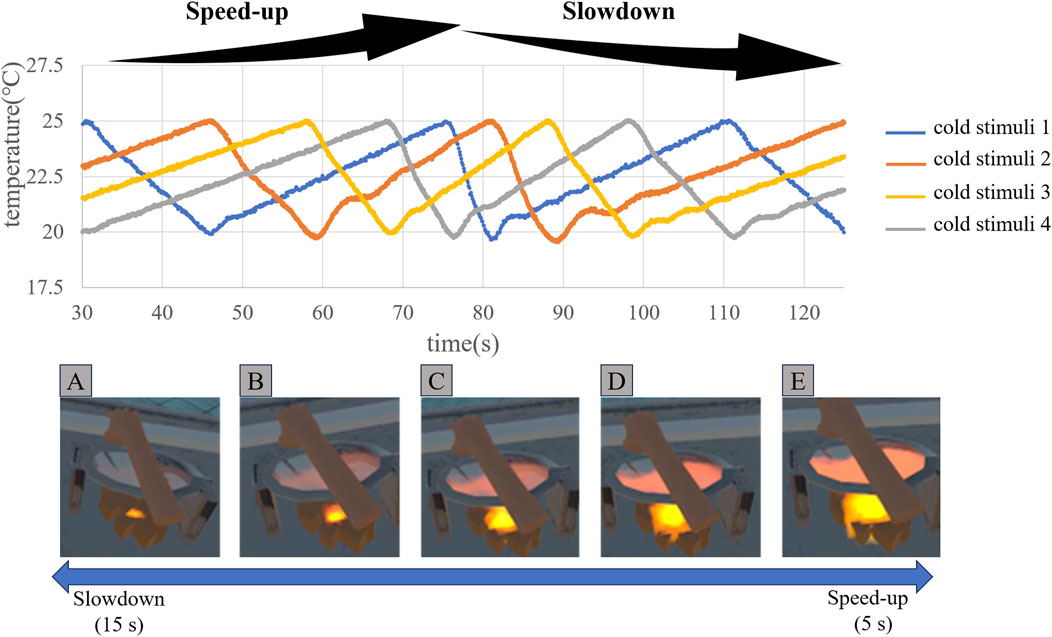
Figure 11. Temperature change of the cold stimulus and changes in the VR. The cooling rate of the cold stimulus increased between 30s and 80s of elapsed time and then decreased between 80 s and 125 s. Five patterns (A–E) of VR pain presentation were prepared, with cooling times corresponding to 15 s (A), 12.5 s (B), 10 s (C), 7.5 s (D), and 5 s (E). For example, at an elapsed time of 45 s, the cooling time of the cold stimulus switched from 15 s to 12.5 s, and the VR presentation switched from A to B.
5.2 Experimental procedure
Thirty seconds after the start of temperature recording, participants were asked to place their right forearm on the TGI display. Thermal stimuli were then presented for 95 s. During the thermal stimulation, participants used a mouse held in their left hand to indicate changes in pain sensation. They were instructed to right-click when they felt an increase in pain and left-click when they felt a decrease in pain. The timing of these clicks was recorded to track the perceived changes in pain intensity.
After the thermal stimulation, participants answered the following five questions about their VR experience to investigate the effectiveness and challenges of pain presentation within a VR environment: [1] What sensations did you experience during the experiment? [2] Did the perceived intensity change in response to the visual changes? [3] How was the reality and immersiveness of the VR experience? [4] What future developments do you expect? [5] Please provide any additional comments about the overall experiment.
The questionnaire was administered in Japanese on a PC, and participants input their responses directly. This experiment took approximately 15 min per person, including the time for setting up the VR environment and answering the questions. The experimental setup is shown in Figure 12.
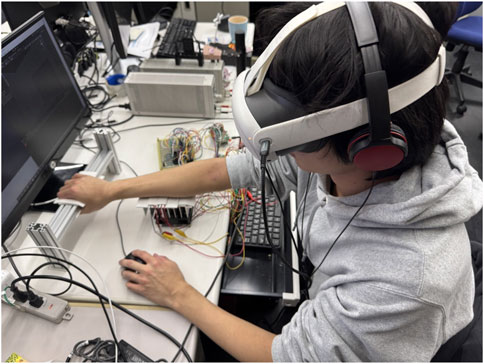
Figure 12. Participants during user experiment 2.
5.3 Results
Figure 13 shows the timing of the perceived pain increase and decrease reported by the seven participants.
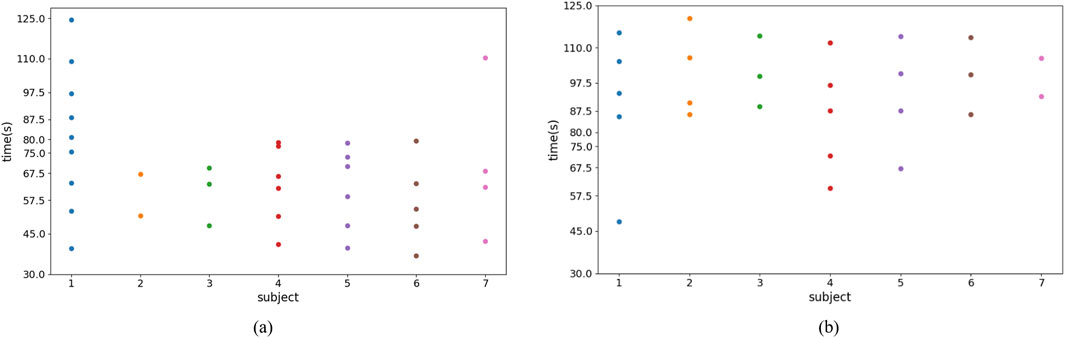
Figure 13. User Experiment 2 results (a) Pain increase timing (b) Pain decrease timing.
Participant responses to the five questions were as follows:
What sensations did you experience during the experiment? Six out of seven participants reported feeling sensations of pain or heat, such as “the same kind of pain as when you get burned” (Participant 3), “Hot!” (Participant 5), and “I felt like my arm was being burned” (Participant 7). Of the six who reported pain or heat, two also reported feeling warmth: “Warmth, heat, burning sensation” (Participant 1) and “Warmth, pain” (Participant 3). One participant reported only feeling warmth: “It felt like putting my hand on a heater. At first, the temperature continued to rise slowly, then gradually decreased” (Participant 2).
Did the perceived intensity change in response to the visual changes? Six out of seven participants reported that the perceived intensity changed in response to the visual changes, but four of them reported discrepancies between the visuals and perceived intensity or instances where the perceived intensity did not change. For example, “I felt that the intensity changed with the changes in the visuals, but there were times when there seemed to be a slight lag in timing between the visuals and the tactile sensation” (Participant 1), “When the visuals changed to be hotter, the perceived intensity also increased, but when it decreased, I did not feel much change” (Participant 5), and “It changed. When the fire was at its strongest, it did not feel as hot as the visual” (Participant 7).
How was the reality and immersiveness of the VR experience? Four out of seven participants reported that the VR experience was realistic and immersive: “The feeling of the hand and the room was realistic, and I felt more tortured than the previous time (Experiment 1)” (Participant 4), “It was real, especially the fact that I could actually see my hand increased the immersion, but I felt that if the position of the hot plate shifted from reality, the immersion would be greatly reduced” (Participant 5), and “The hot plate felt like it was being heated, and it felt very real” (Participant 6). On the other hand, three out of seven participants reported feeling a sense of discomfort during the VR experience: “I think the visuals and sound themselves were sufficient to understand the situation. Also, I felt that the changes in tactile sensation in response to changes in the visuals and sound were well synchronized. On the other hand, I thought there was a slight discrepancy in the fact that the thermal grill stimulation time was long compared to the short time it would take to remove my arm in that situation” (Participant 1) and “The sensation I was actually feeling was warm, but the visual representation was extremely hot, which created a discrepancy” (Participant 2).
What future developments do you expect? Two out of seven participants desired a wider range of heat and pain intensity: “I think it would be good to have even hotter/more painful sensory feedback” (Participant 1) and “Wider range of temperature change” (Participant 7). Other responses included: “Presentation of heat to other parts of the body besides the arm, and a wearable device that allows for free body movement” (Participant 6) and “It seems like it could be applied to games and movies to increase realism” (Participant 3).
Please provide any additional comments about the overall experiment. Some positive comments included: “I simply think I had an interesting experience. There was a time when I was a little too focused on evaluating the heat, so if that part could be improved, I might be able to experience even greater immersion” (Participant 1) and “It was really hot, and sometimes I felt like I was being tortured. I felt the heat changing in conjunction with the size of the flames” (Participant 6). On the other hand, one participant who participated in both Experiment 1 and Experiment 2 commented: “I feel like I had a better sense of pain when I was blindfolded with white noise without the VR” (Participant 2).
5.4 Discussion
The majority of participants perceived increases in pain intensity during the period from 30 s to 80 s, where the cooling rate of the cold stimuli progressively increased in conjunction with the intensification of VR visual stimuli. Conversely, they reported decreases in pain intensity from 80 s to 125 s, corresponding to a gradual decrease in the cooling rate and a weakening of the VR visual stimuli.
However, some participants reported increases in pain from 80 s to 125 s or decreases from 30 s to 80 s. Furthermore, some individuals perceived multiple fluctuations in pain intensity within the same cooling rate range. We speculate that these variations may be attributed to the temperature of the cooling Peltier elements. Previous research (Leung et al., 2005; Patwardhan et al., 2018) has demonstrated that the intensity of TGI-induced pain increases with a larger temperature difference between the warm and cold stimuli. In our experiment, the temperature of the warm stimuli remained constant, and the average temperature of the four Peltier elements used for cold stimulation changed by less than 1°C during the presentation of the thermal stimuli. However, it is possible that the temperature of the actively cooling Peltier elements exerted a stronger influence on pain perception than the warming elements. Therefore, participants might have perceived an increase in pain as the temperature of the cooling Peltier element approached 20°C near the end of its cooling cycle, compared to the initial temperature of around 25°C.
To mitigate this issue, we propose two potential solutions: reducing the temperature range of the cold stimuli and minimizing the time lag between the activation of consecutive cooling elements. By narrowing the temperature range (e.g., from 22°C to 20°C), the temperature difference between the start and end of a cooling cycle could be minimized, potentially reducing its influence on perceived intensity. Additionally, shortening the time lag and activating multiple Peltier elements simultaneously for cooling could help maintain a more consistent average temperature of the cooling elements.
The questionnaire results indicate that most participants were able to perceive pain corresponding to the VR scene. However, several participants reported sensations of warmth in addition to pain and heat. This could be attributed to the temperature of the cooling Peltier elements, which might not have induced TGI-related pain at the beginning of the cooling cycle when the temperature was around 25°C. Regarding the reality of the VR environment, some participants reported feeling the heat of the iron plate or experiencing a sensation of torture, while others reported a disconnect between the visual stimuli and their perceived thermal sensations. This suggests that individual differences in TGI perception may be substantial. Furthermore, participant who reported a disconnect between the visual and thermal stimuli also reported experiencing stronger pain in the absence of VR visuals. This suggests that the discrepancy between the visual stimuli and the perceived intensity of the TGI may have attenuated the perceived pain. This finding aligns with research investigating the influence of congruence between thermal sensations and VR visuals on perception (Günther et al., 2020).
6 Limitation
Our experimental results offer valuable insights into the relationship between the cooling rate of a cold stimulus and the perceived intensity of TGI, as well as the effectiveness of pain presentation in a VR environment using cold stimulus temperature manipulation. However, several challenges remain.
Firstly, there is a limitation on the cooling rate. Our current temperature control and heat dissipation systems allow for a maximum continuous cooling rate of 1°C/s. To fully elucidate the relationship between the cooling rate of cold stimuli and TGI perception intensity, experiments across a wider range of speeds are necessary. Achieving faster cooling rates would require temperature control circuits capable of handling higher currents and voltages, along with more robust heat dissipation systems, such as water-cooling.
Secondly, there is a challenge concerning the congruence between VR and TGI-induced pain. This study did not investigate the impact of VR-pain congruence on TGI perception. Conducting randomized controlled trials on VR congruence is indispensable for applying TGI, which exhibits individual differences in perceived intensity, to pain presentation in VR. Furthermore, by adding experiments that present thermal stimuli under conditions where TGI is not generated (e.g., warm stimulation only or cold stimulation only), it will be possible to more rigorously evaluate the influence of the cold stimulus’s cooling rate on perceived TGI intensity, as well as the effectiveness of pain presentation in a VR environment using cold stimulus temperature manipulation.
Finally, this study has three primary limitations regarding data collection. First, there’s a need for additional data to thoroughly evaluate the safety of the pain presentation system. While this research was conducted with the approval of our institutional ethics committee, user experiments did not collect data that would allow for reporting erythema, after-sensations, or relative cumulative exposure to ISO 13732 limits. To further enhance user safety, the collection of such data is recommended in future research. Second, data are needed to assess individual differences in TGI perception. Collecting information such as participants’ thermal sensitivity and skin type before the experiment would enable a more in-depth discussion of the causes behind individual variations in experimental results. To deepen the understanding of individual differences in TGI, we recommend collecting these data in future research. Third, data are required to investigate the correspondence between changes in the VR scene and perceived intensity. While this study evaluated changes in perceived intensity through mouse clicks and post-experiment questionnaires, collecting physiological data, such as heart rate variability, would allow for a more rigorous assessment.
7 Conclusion
In this study, we investigated the relationship between the cooling rate of the cold stimulus and the perceptual intensity of the TGI by independently controlling the temperature of six Peltier devices. The results showed a tendency for the pain during the TGI stimulation to be recognized as stronger as the cooling rate of the cold stimulus increased. Furthermore, we constructed a pain presentation system integrated into a VR environment. As a result, six out of seven subjects perceived pain corresponding to the VR scene.
Future research could explore pain presentation across a wider range of cooling rates and focus on developing wearable device systems for pain presentation.
Data availability statement
The raw data supporting the conclusions of this article will be made available by the authors, without undue reservation.
Ethics statement
The studies involving humans were approved by the Ethics Review Committee on Research with Human Subjects of Waseda University. The studies were conducted in accordance with the local legislation and institutional requirements. The participants provided their written informed consent to participate in this study.
Author contributions
SH: Formal Analysis, Visualization, Software, Writing – original draft, Conceptualization, Methodology, Investigation, Data curation. RL: Writing – review and editing, Methodology, Conceptualization. HI: Writing – review and editing, Software. HS: Writing – review and editing, Funding acquisition, Validation, Data curation, Supervision.
Funding
The author(s) declare that financial support was received for the research and/or publication of this article. This study was supported by the research funding of Waseda University, Japan.
Acknowledgments
We express our sincere gratitude to everyone who contributed to this study. We acknowledge the use of Google’s generative AI (Gemini 2.0 Flash) for language assistance during the preparation of the English manuscript.
Conflict of interest
The authors declare that the research was conducted in the absence of any commercial or financial relationships that could be construed as a potential conflict of interest.
Generative AI statement
The author(s) declare that Generative AI was used in the creation of this manuscript. We acknowledge the use of Google’s generative AI (Gemini 2.0 Flash) for language assistance during the preparation of the English manuscript.
Publisher’s note
All claims expressed in this article are solely those of the authors and do not necessarily represent those of their affiliated organizations, or those of the publisher, the editors and the reviewers. Any product that may be evaluated in this article, or claim that may be made by its manufacturer, is not guaranteed or endorsed by the publisher.
References
Bach, P., Becker, S., Kleinböhl, D., and Hölzl, R. (2011). The thermal grill illusion and what is painful about it. Neurosci. Lett. 505, 31–35. doi:10.1016/j.neulet.2011.09.061
Begum, M. R., and Hossain, M. A. (2019). Validity and reliability of visual analogue scale (vas) for pain measurement.
Benko, H., Holz, C., Sinclair, M., and Ofek, E. (2016). NormalTouch and TextureTouch: high-fidelity 3D haptic shape rendering on handheld virtual reality controllers., in Proceedings of the 29th annual symposium on user Interface software and technology, (New York, NY: Association for Computing Machinery), 717–728. doi:10.1145/2984511.2984526
Defrin, R., Benstein-Sheraizin, A., Bezalel, A., Mantzur, O., and Arendt-Nielsen, L. (2008). The spatial characteristics of the painful thermal grill illusion. PAIN 138, 577–586. doi:10.1016/j.pain.2008.02.012
Eckhoff, D., Cassinelli, A., Liu, T., and Sandor, C. (2020). “Psychophysical effects of experiencing burning hands in augmented reality,” in Virtual reality and augmented reality. Editors P. Bourdot, V. Interrante, R. Kopper, A.-H. Olivier, H. Saito, and G. Zachmann (Cham: Springer International Publishing), 83–95. doi:10.1007/978-3-030-62655-6_5
Eckhoff, D., Sandor, C., Cheing, G. L. Y., Schnupp, J., and Cassinelli, A. (2022). Thermal pain and detection threshold modulation in augmented reality. Front. Virtual Real 3. doi:10.3389/frvir.2022.952637
Fardo, F., Beck, B., Allen, M., and Finnerup, N. B. (2020). Beyond labeled lines: a population coding account of the thermal grill illusion. Neurosci. and Biobehav. Rev. 108, 472–479. doi:10.1016/j.neubiorev.2019.11.017
Fu, Y., Liu, J., Li, X., and Sun, X. (2025). A haptic feedback glove for virtual piano interaction. Virtual Real. and Intelligent Hardw. 7, 95–110. doi:10.1016/j.vrih.2024.07.001
Gao, H., Cai, S., Wu, Y., and Zhu, K. (2024). “ThermOuch: a wearable thermo-haptic device for inducing pain sensation in virtual reality through thermal grill illusion,” in SIGGRAPH asia 2024 conference papers (New York, NY, USA: Association for Computing Machinery), 1–12. doi:10.1145/3680528.3687620
Groenveld, T. D., Smits, M. L. M., Knoop, J., Kallewaard, J. W., Staal, J. B., de Vries, M., et al. (2023). Effect of a behavioral therapy-based virtual reality application on quality of life in chronic low back pain. Clin. J. Pain 39, 278–285. doi:10.1097/AJP.0000000000001110
Günther, S., Müller, F., Schön, D., Elmoghazy, O., Mühlhäuser, M., and Schmitz, M. (2020). “Therminator: understanding the interdependency of visual and on-body thermal feedback in virtual reality,” in Proceedings of the 2020 CHI conference on human factors in computing systems (New York, NY, USA: Association for Computing Machinery), 1–14. doi:10.1145/3313831.3376195
Harper, D. E., and Hollins, M. (2014). Coolness both underlies and protects against the painfulness of the thermal grill illusion. PAIN 155, 801–807. doi:10.1016/j.pain.2014.01.017
Hoffmann, P. P., Elsayed, H., Mühlhäuser, M., Wehbe, R. R., and Barrera Machuca, M. D. (2023). “ThermalPen: adding thermal haptic feedback to 3D sketching,” in Extended abstracts of the 2023 CHI conference on human factors in computing systems (New York, NY, USA: Association for Computing Machinery), 1–4. doi:10.1145/3544549.3583901
Huang, Q., Lin, J., Han, R., Peng, C., and Huang, A. (2022). Using virtual reality exposure therapy in pain management: a systematic review and meta-analysis of randomized controlled trials. Value Health 25, 288–301. doi:10.1016/j.jval.2021.04.1285
Leung, A. Y., Wallace, M. S., Schulteis, G., and Yaksh, T. L. (2005). Qualitative and quantitative characterization of the thermal grill. Pain 116, 26–32. doi:10.1016/j.pain.2005.03.026
Liu, S., He, J., Jiang, S., Zhang, Z., and Lv, M. (2024). MatStick: changing the material sensation of objects upon impact. Virtual Real. and Intelligent Hardw. 6, 486–501. doi:10.1016/j.vrih.2024.11.001
Lopes, P., Ion, A., and Baudisch, P. (2015). “Impacto: simulating physical impact by combining tactile stimulation with electrical muscle stimulation,” in Proceedings of the 28th annual ACM symposium on user interface software and technology (New York, NY, USA: Association for Computing Machinery), 11–19. doi:10.1145/2807442.2807443
Lopes, P., You, S., Cheng, L.-P., Marwecki, S., and Baudisch, P. (2017). “Providing haptics to walls and heavy objects in virtual reality by means of electrical muscle stimulation,” in Proceedings of the 2017 CHI conference on human factors in computing systems (New York, NY, USA: Association for Computing Machinery), 1471–1482. doi:10.1145/3025453.3025600
Lopes, P., You, S., Ion, A., and Baudisch, P. (2018). “Adding force feedback to mixed reality experiences and games using electrical muscle stimulation,” in Proceedings of the 2018 CHI conference on human factors in computing systems (New York, NY, USA: Association for Computing Machinery), 1–13. doi:10.1145/3173574.3174020
Manasrah, A., Crane, N., Guldiken, R., and Reed, K. B. (2017). Perceived cooling using asymmetrically-applied hot and cold stimuli. IEEE Trans. Haptics 10, 75–83. doi:10.1109/TOH.2016.2578334
Mitchell, A. G., Ehmsen, J. F., Christensen, D. E., Stuckert, A. V., Haggard, P., and Fardo, F. (2024). Disentangling the spinal mechanisms of illusory heat and burning sensations in the thermal grill illusion. PAIN 165, 2370–2378. doi:10.1097/j.pain.0000000000003352
Patwardhan, S., Kawazoe, A., Kerr, D., Nakatani, M., and Visell, Y. (2018). “Too hot, too fast! Using the thermal grill illusion to explore dynamic thermal perception,” in 2018 IEEE haptics symposium (HAPTICS), 145–150. doi:10.1109/HAPTICS.2018.8357167
Peiris, R. L., Peng, W., Chen, Z., Chan, L., and Minamizawa, K. (2017). “ThermoVR: exploring integrated thermal haptic feedback with head mounted displays,” in Proceedings of the 2017 CHI conference on human factors in computing systems (New York, NY, USA: Association for Computing Machinery), 5452–5456. doi:10.1145/3025453.3025824
Ragozin, K., Zheng, D., Chernyshov, G., and Hynds, D. (2020). “Sophroneo: fear not. A VR horror game with thermal feedback and physiological signal loop,” in Extended abstracts of the 2020 CHI conference on human factors in computing systems (New York, NY, USA: Association for Computing Machinery), 1–6. doi:10.1145/3334480.3381659
Saga, S., Kimoto, R., and Kaguchi, K. (2023). Spatiotemporal thermal control effects on thermal grill illusion. Sensors 23, 414. doi:10.3390/s23010414
Schorr, S. B., and Okamura, A. M. (2017). “Fingertip tactile devices for virtual object manipulation and exploration,” in Proceedings of the 2017 CHI conference on human factors in computing systems (New York, NY, USA: Association for Computing Machinery), 3115–3119. doi:10.1145/3025453.3025744
Stevens Kenneth K, C., and Choo, J. (1998). Temperature sensitivity of the body surface over the life span. Somatosens. and Mot. Res. 15, 13–28. doi:10.1080/08990229870925
Strohmeier, P., Güngör, S., Herres, L., Gudea, D., Fruchard, B., and Steimle, J. (2020). “bARefoot: generating virtual materials using motion coupled vibration in shoes,” in Proceedings of the 33rd annual ACM symposium on user interface software and technology (New York, NY, USA: Association for Computing Machinery), 579–593. doi:10.1145/3379337.3415828
Tanaka, Y., Serfaty, J., and Lopes, P. (2024). “Haptic source-effector: full-body haptics via non-invasive brain stimulation,” in Proceedings of the 2024 CHI conference on human factors in computing systems (New York, NY, USA: Association for Computing Machinery), 1–15. doi:10.1145/3613904.3642483
Keywords: thermal grill illusion, control of pain intensity, virtual reality, haptic display, cooling rate
Citation: Hori S, Liu R, Igarashi H and Sawada H (2025) Pain intensity control in virtual reality via modulated cooling rates in thermal grill illusion. Front. Virtual Real. 6:1617481. doi: 10.3389/frvir.2025.1617481
Received: 24 April 2025; Accepted: 20 June 2025;
Published: 01 July 2025.
Edited by:
Myunghwan Yun, Seoul National University, Republic of KoreaReviewed by:
Julia Forstenpointner, Universitätsklinikum Schleswig-Holstein, GermanyCollin Turbyne, Tilburg University, Netherlands
Copyright © 2025 Hori, Liu, Igarashi and Sawada. This is an open-access article distributed under the terms of the Creative Commons Attribution License (CC BY). The use, distribution or reproduction in other forums is permitted, provided the original author(s) and the copyright owner(s) are credited and that the original publication in this journal is cited, in accordance with accepted academic practice. No use, distribution or reproduction is permitted which does not comply with these terms.
*Correspondence: Shinnosuke Hori, bm9ldGhlckB0b2tpLndhc2VkYS5qcA==