 Le Xu1
 Weimin Zhai2*
- 1School of Art and Design, Zhejiang Sci-Tech University, Hangzhou, China
- 2School of Design and Innovation, Shenzhen Technology University, Shenzhen, China
In large shopping malls, shoppers often require assistance with wayfinding. Intelligent shopping guide terminals are increasingly being used for this purpose, and their interface usability plays a crucial role in influencing both wayfinding visual search performance and the overall shopping experience. This study investigates the effects of map visual presentations and landmark description locations in virtual environments on users’ wayfinding visual search performance and subjective evaluations using intelligent shopping guide terminals. A 2x3 between subject design was employed to examine how different virtual map types (2D and 3D) and landmark description locations (on, within, or below the map) affect task performance and subjective evaluations. A total of 60 participants were selected via purposive sampling and asked to complete five wayfinding tasks. Task completion times were recorded, and data were collected using the System Usability Scale (SUS), a 7-point Likert scale for subjective evaluation, and semi-structured interviews. The key findings are as follows: (1) Landmark descriptions on or below the map led to better wayfinding visual search performance than those within the map; (2) Users demonstrated superior wayfinding visual search performance with 3D maps compared to 2D maps; (3) When landmarks were placed on or below the map, 3D maps outperformed 2D maps in task performance, attractiveness, and information clarity. However, the reverse was true when landmarks were placed within the map, (4) Landmark descriptions within the map generated higher physical demand, with no significant difference between descriptions on or below the map. (5) Overall, subjective evaluations and SUS scores indicated a clear preference for landmark descriptions placed on or below the map. These findings contribute to improving wayfinding visual search performance in shopping malls and offer valuable insights for enhancing user interface design in intelligent shopping guide terminals, ultimately leading to better user experiences.
1 Introduction
In the study of human behavior and navigation, it is essential to consider two key factors: “movement” and “wayfinding” (Smelser and Baltes, 2001). Wayfinding specifically involves gathering information from environmental sources such as distance, survey knowledge, and route planning to determine the optimal path (Cheung, 2006). As physical and social environments become increasingly complex, wayfinders face greater challenges in acquiring spatial knowledge (Chan et al., 2024). Concurrently, advancements in navigation technologies have made external information sources crucial in providing environmental data. These sources include, but are not limited to, wayfinding signage (Chambers and Bowman, 2011), landmarks (Rechel et al., 2009), maps (He et al., 2014), kiosks (Devlin and Bernstein, 1997), and mobile wayfinding applications (Vandenberg et al., 2016). In unfamiliar and complex spatial environments, individuals increasingly rely on these external aids to obtain necessary navigation information (Iftikhar and Luximon, 2024). This growing reliance underscores the need for developing user-friendly wayfinding interfaces that align with users’ cognitive processes.
Typically, shopping malls are large, enclosed spaces that integrate retail, dining, and entertainment functions (Gilboa et al., 2020). However, as shopping malls expand, so do the spatial complexity and the distances consumers must traverse (Kim and Kim, 2020). The existing literature identifies four core areas of focus in shopping mall research: spatial wayfinding, environmental atmosphere, differences in consumer experiences across malls, and the impact of malls on consumer behavior (Krey et al., 2022). In large shopping malls, consumers often require assistance in locating their desired retail stores. If they encounter difficulties in wayfinding, negative emotions may arise, potentially leading to reduced spending (Chebat et al., 2005). Therefore, effectively guiding consumers and assisting them in navigation is a critical issue (Kutnicki, 2018). Traditionally, digital signage with wayfinding capabilities has provided directional assistance, reducing the time consumers spend searching for their target stores while enhancing the overall appeal of the mall (Meziani and Hussien, 2017). Recently, with the widespread adoption of public terminals in shopping malls, smart wayfinding terminals have become indispensable to the shopping experience. These terminals not only provide effective navigation but also significantly increase foot traffic in malls (Inman and Nikolova, 2017). Smart wayfinding terminals typically offer features such as store search, facility search, parking payment, and promotional activities (Li et al., 2021). Due to their ease of use, combined with touch-screen technology, these terminals are highly attractive to most consumers (Wang, 2014). As a result, consumer interactions with smart wayfinding terminals have become a crucial mode of information transmission, making it vital to enhance the usability of these devices (Nicholas et al., 2001; Pillai et al., 2020). In recent years, scholars have increasingly focused on the usability of smart wayfinding terminals (Soh and Smith-Jackson, 2004; Davids et al., 2014). Interface usability refers to the efficiency of interaction between users and systems, aiming to improve both system performance and user experience (Battleson et al., 2001). Usability is typically assessed by measuring the time taken to complete tasks (Chen et al., 2013), and good usability can significantly enhance users’ emotions and satisfaction (Akrimi and Khemakhem, 2014). Existing research indicates that improving the usability of smart wayfinding terminals and other public devices is essential for enhancing the overall user experience. However, research on the usability of wayfinding interfaces, particularly in terms of information presentation and ease of use, remains limited, especially concerning users’ cognitive characteristics (Lee et al., 2020).
This study seeks to address this gap by examining smart wayfinding terminal interface designs based on users’ cognitive characteristics and evaluating their wayfinding visual search performance and subjective assessments in a virtual environment. Through this research, we aim to deepen the understanding of wayfinding behavior in shopping malls and provide theoretical foundations and practical guidance for optimizing smart wayfinding terminal design, ultimately improving both the overall user experience and operational efficiency in shopping environments.
2 Related works
Previous research on wayfinding has explored various aspects, including visual guides, memory effects of landmarks, emergency behaviors, and architectural design elements, as outlined in Table 1. These studies have demonstrated that factors such as visual guidance, landmark memory (both visual and olfactory), and environmental design significantly influence wayfinding visual search performance across diverse contexts. For instance, Choi and Park (2024) aimed to enhance user experiences in virtual museums by improving path guidance, while Schwarz and Hamburger (2024) examined the role of visual and olfactory landmark memory in human wayfinding. Fu et al. (2024) underscored the importance of conspicuous and clear wayfinding information in increasing the usage of exit doors during emergency evacuations. Similarly, Pouyan et al. (2024) emphasized how architectural design elements can facilitate wayfinding for elderly users, and Iftikhar and Luximon (2024) studied user preferences for wayfinding information design in complex environments. While these studies recognize the significance of cognitive factors, they fall short of addressing the intricate interaction between cognitive load, virtual map presentations, and the location of landmark descriptions—particularly in the context of intelligent shopping guide terminals. Although cognitive load has been acknowledged as a critical factor, its relationship with the design of wayfinding systems in shopping malls, especially the effects of visual presentation types (2D vs. 3D) and landmark placement (on, within, or below the map), remains underexplored. This study aims to address this research gap by investigating the impact of virtual map visual presentations and landmark description locations on users’ cognitive load and wayfinding visual search performance. Specifically, it will focus on how different map types and landmark placements influence both intrinsic cognitive load, related to the complexity of the task, and extraneous cognitive load, which arises from interface design. This research will contribute to a deeper understanding of wayfinding in complex environments, offering insights into optimizing user experience in intelligent shopping guide terminals.
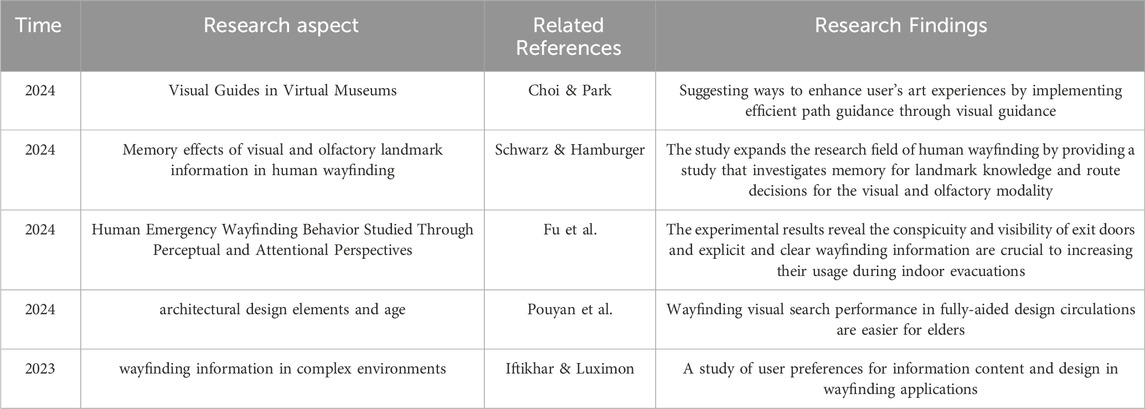
Table 1. Collation of research on wayfinding in different fields.
2.1 Virtual map visual presentation
In virtual environments, 2D top-down view maps and 3D bird’s eye view maps are two prevalent types of map visual presentations (Li and Giudice, 2013). Lu and Peponis (2014) found that 2D maps allowed users to identify maximally visible locations. Liao et al. (2017) insisted that 2D maps are more effective for spatial knowledge acquisition. In addition, they also found that users could have performed better when using 3D maps than when using 2D maps due to excessive map information. Kray et al. (2003) found that 2D maps allowed for faster identification of initial location and route finding, and enabled users to extract more spatial information in less time. However, users’ processing of spatial information in 2D maps requires a sizeable cognitive load to translate into self-centered physical spatial information (Goodman et al., 2005). Zanola et al. (2009) insisted that the cues provided by 3D maps enabled users’ ability to recognize space and landmarks compared to 2D maps. Many past studies have supported the advantages of 3D maps in wayfinding. For example, for unfamiliar environments, 3D maps can provide near-natural world vision (Kray et al., 2003), simplify user recognition of objects contained in the environment, and significantly improve user comprehension (Wickens, 2000). They also have a highly positive impact on user satisfaction (Kray et al., 2003). Nonetheless, Popelka and Doležalová (2015) found no significant differences in eye-movement metrics between 2D and 3D maps in a visual search task. Too many 3D landmark models on the screen confused map users and slowed their information processing (Delikostidis and Van Elzakker, 2009). Lei et al. (2016) found that 3D maps produced a clustered gaze with longer duration and smaller sweep magnitude, which meant that 3D maps users were less efficient at gathering detailed information. In summary, there is no unified conclusion on the performance of 2D and 3D visual presentation regarding user wayfinding. Moreover, different types of map visual presentations on user wayfinding visual search performance and subjective evaluations in intelligent shopping guide terminals used in shopping malls have not been sufficiently studied. Therefore, this study mainly focuses on the impact of different virtual map visual presentation types on user experience regarding intelligent shopping guide terminals.
2.2 Location of landmark description
Landmarks play a crucial role in the spatial task of wayfinding (Caduff and Timpf, 2006). In the wayfinding process, map labels refer to providing valuable geographic information by annotating geographic phenomena with textual descriptions (Casakin et al., 2000). Map labels not only help the user convey a large amount of semantic information during map reading (Roth et al., 2017), but also reduce the number of wayfinding errors (Deakin, 1996). However, while landmarks can help users process their learning environment, they also require the user’s cognitive resources (Cheng et al., 2022). Subject to users’ limited cognitive abilities, too much landmark information on mobile maps may lead to cognitive overload for users (Baddeley, 1992).
Landmark descriptions speed up the comprehension time when the user’s viewpoint is switched (Dong et al., 2020), giving the user more time to process the overall spatial information (Lee and Tversky, 2005). Vilaplana (2015) suggested improving the readability of map annotations with a conspicuousness-based approach to avoid annotation overlap. Yoeli (1972) emphasized that the placement of annotations is one of the primary elements of map annotation design. Slocum et al. (2022) argued that point feature labels should be horizontal, preferably above and to the right of the point. In addition, Harrie et al. (2022) also suggested that area labels should preferably be placed horizontally within the polygonal elements they represent. Later, Rylov and Reimer (2017) proposed a method for external labeling region features. It is well known that the user’s attention is strongly influenced by the overall layout of the user interface and the visual presentation of the location of target elements (Bojko, 2006). During wayfinding, the user gradually built up a mental representation of space by interacting with the geospatial aspect of the map (Millonig and Schechtner, 2007; Montello et al., 2004). Although there is evidence that different forms of landmark information affect users’ visual search performance in different ways (Ye et al., 2022), the location of landmark descriptions in intelligent shopping guide terminals in shopping malls has not been sufficiently studied regarding users’ wayfinding visual search performance and their subjective perceptions. Therefore, this study focused on the impact of different virtual map landmark descriptions on user experience of intelligent shopping guide terminals.
Previous research has shown that “virtual map visual presentations” and “locations of landmark descriptions” are critical factors influencing user experience (UX). However, limited studies have explored the interaction between these two factors. To bridge this gap, a conceptual model was developed, summarizing the relationship between prior research and users’ wayfinding visual search performance. A 2x3 between subject design (60 participants) was employed to examine how different virtual map types (2D and 3D) and landmark description locations (on, within, or below the map) affect task performance and subjective evaluations. Regarding the sample size of participants commonly adopted in previous related studies, refer to Table 2. This study, conducted through the user interface of an intelligent shopping guide terminal, aimed to answer the following key questions:
Q1: Does the location of landmark descriptions (within the map, on the map, or below the map) impact users’ wayfinding visual search performance?
Q2: Do different virtual map visual presentations (2D and 3D) affect users’ wayfinding visual search performance in the user interface of intelligent shopping guide terminals?
Q3: Which landmark description location is most attractive to users, and how does it influence their subjective evaluations?
Q4: Is there an interaction effect between virtual map visual presentations and landmark description locations?
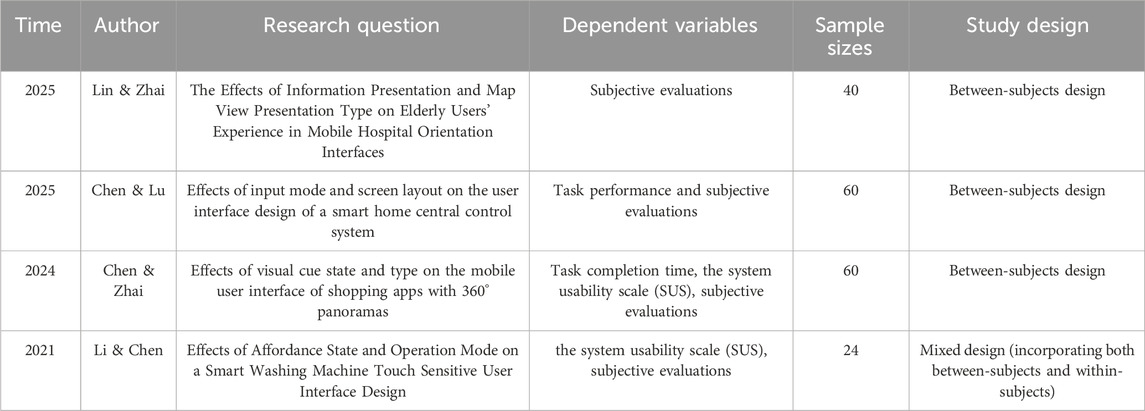
Table 2. Overview of recent studies on user interface design.
3 Methods and materials
This study employed a 2 × 3 between-subject design, where the two independent variables were “virtual map visual presentation” and “landmark description location.” The experimental design of this study aimed to explore in depth by recording the task completion time (i.e., objective data) of participants completing the different tasks and theiroverall psychological evaluations (i.e., subjective data) regarding the experimental manipulation, More specifically, the dependent variables of the experiment were participants’task completion time, the system usability scale (SUS) questionnaire, and subjective evaluations (including the degree of subjective preference, the degree of attractiveness, the degree of information clarity, and the degree of physical demand). Additionally, To gain deeper insights into participants’ subjective experiences, we conducted semi-structured interviews. During these interviews, participants were asked open-ended questions such as “How did you feel about the placement of landmark descriptions on the map?”, “What aspects of the map presentation affected your ease of use?”, and “Could you describe your overall experience with the different map types?”. Figure 1 shows the research framework of this study. The experiment simulated a virtual map of a large shopping mall, utilizing an intelligent shopping guide terminal commonly used in China to enhance participant engagement. The graphical design for the experiment was created using Adobe Illustrator, and Proto. io was subsequently employed to develop the app prototype. This prototype simulated a virtual shopping mall map integrated into the user interface of an intelligent shopping guide terminal, displayed on a 32-inch touchscreen with a resolution of 3,840 × 2,160 pixels, 69 ppi, and a 16:9 aspect ratio. The experimental design aimed to gather comprehensive data by recording participants’ objective wayfinding task completion times and their subjective psychological evaluations of the tasks and experimental setup.
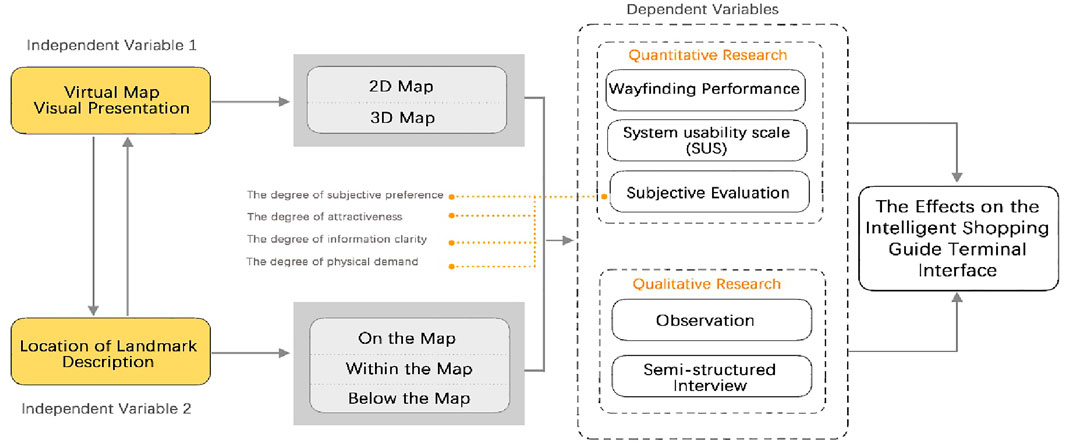
Figure 1. The research framework of this study.
3.1 Participants
A purposive sampling method was used to recruit 60 participants (32 males and 28 females) aged 18 to 39, all of whom had prior experience using intelligent shopping guide terminal interfaces. According to the experimental design, we divided them into 6 groups, each comprising 10 participants. The sample comprised 45 undergraduate students (75%), 10 master’s students (17%), and 5 Ph.D. students (8%). Of the participants, 48 (80%) were between the ages of 18 and 28, and 12 (20%) were between 29 and 39. This age group was selected to represent frequent users of intelligent shopping guide terminals in large shopping malls.
3.2 Experiment design and procedure
In the context of wayfinding, spatial ability is task-related, and information processing capacity is a critical metric for assessing performance (Allen, 1999). wayfinding visual search performance can be evaluated by measuring the time it takes users to complete a task (Chen et al., 2013). Before the experiment commenced, participants were informed that they would be required to perform five wayfinding tasks using the intelligent shopping guide terminal (see Figure 2). The task design involved participants standing in front of the touchscreen, closely replicating the typical operation scenario of consumers in a real shopping mall. During the experiment, participants could easily interact with the touchscreen display within their reach (see Figure 3). Figure 4 provides an illustration of the experimental operations. Participants first completed a consent form and a questionnaire to collect background information. They then proceeded to the experiment, performing the designated wayfinding tasks on the prototype’s user interface. Task completion times were recorded via screen recording software for further analysis. Upon completing the experiment, participants were asked to fill out a questionnaire that included five questions rated on a 7-point Likert scale to provide subjective evaluations of the task performance. Finally, a semi-structured interview was conducted to gather participants’ personal reflections on task difficulty and any additional opinions or suggestions.
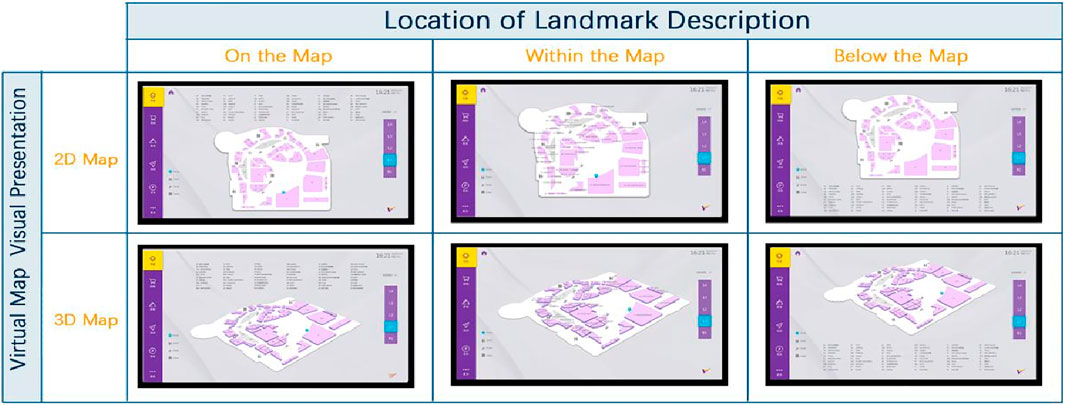
Figure 2. Six prototypes used in this experiment.
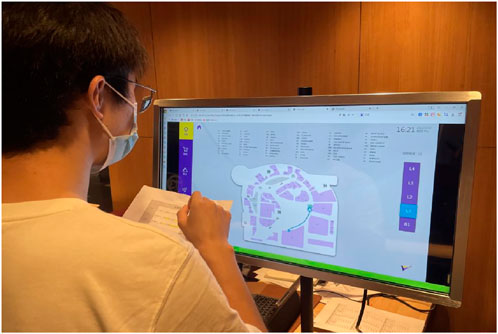
Figure 3. The experiment was conducted in a laboratory.
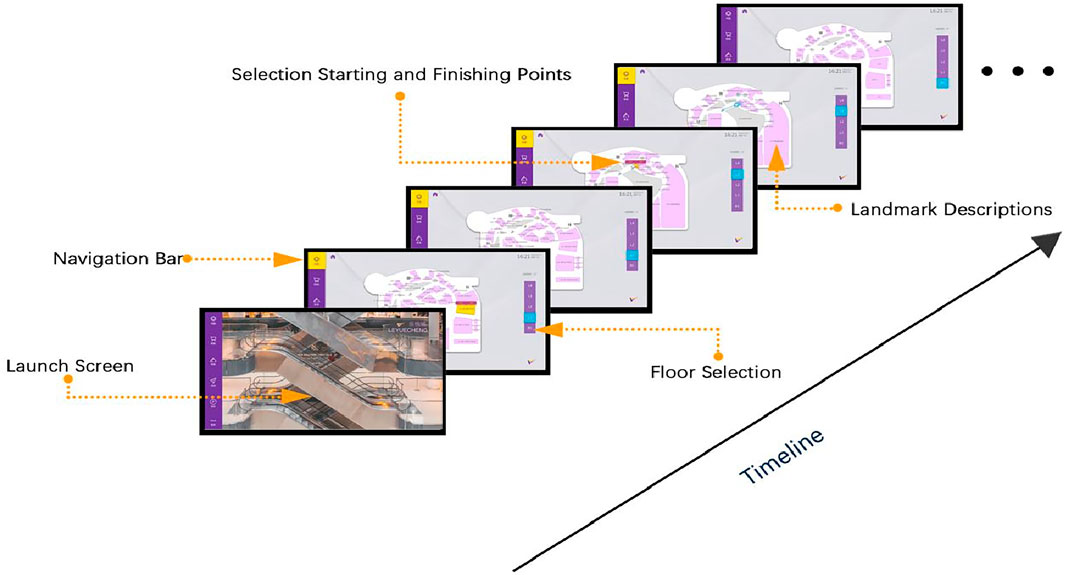
Figure 4. The timeline of instructions for wayfinding operations in intelligent shopping guide terminals.
The information displayed in the prototypes is mainly standard functions in intelligent shopping guide terminals of shopping malls, including wayfinding instructions, promotion activities, brand searching, and parking payment (see Table 3).
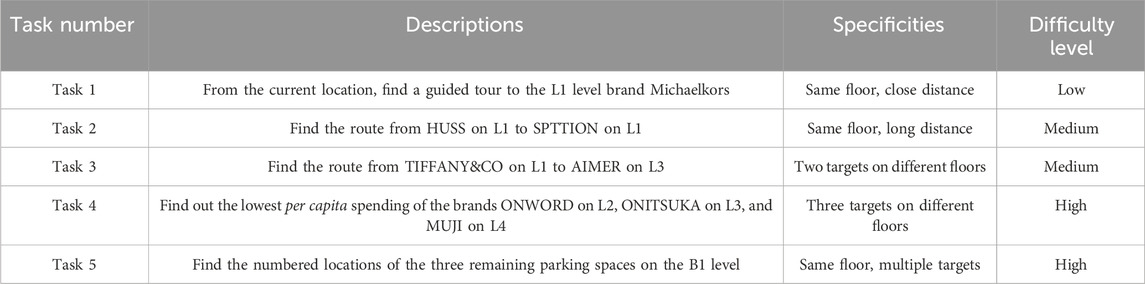
Table 3. Experimental task designs of this study.
4 Experimental results
4.1 Analysis of wayfinding task completion time
In this study, the collected data regarding the main effects of the virtual map visual presentation and the location of landmark description, and their interaction effects on participants’ wayfinding task completion time (i.e., in seconds), as well as subjective evaluations were analyzed using the SPSS software. The significant effect was further analyzed with the LSD post hoc comparison to help address the differences among the factor levels (see Table 4).
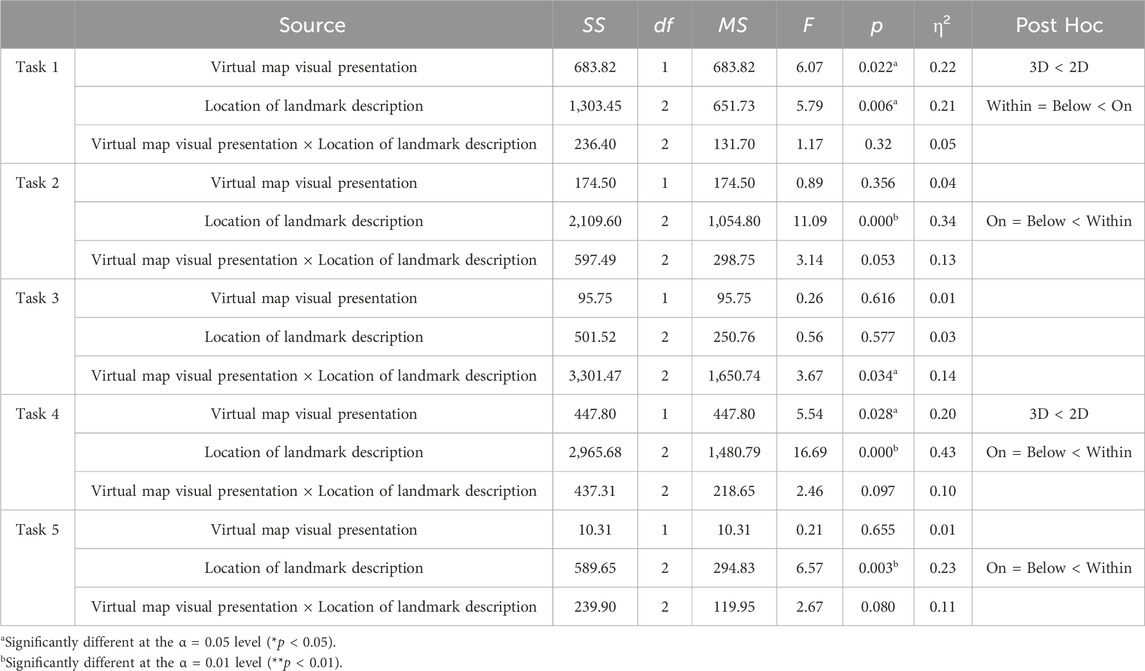
Table 4. The two-way analysis of variance (ANOVA) of each task regarding participants’ task completion time.
4.1.1 Task 1
The results of the between subject design for Task 1 completion time (Table 4) revealed a significant main effect of virtual map visual presentation (F(1, 54) = 6.07, p = 0.022, η2 = 0.22). Specifically, participants completed the task significantly faster using the 3D map (M = 16.80, SD = 10.21) compared to the 2D map (M = 22.97, SD = 12.37). Additionally, a significant main effect of the location of landmark description was observed (F(2, 54) = 5.79, p = 0.006, η2 = 0.21), with task completion times being significantly shorter when landmarks were located within (M = 15.81, SD = 8.55) and below the map (M = 18.09, SD = 8.22) compared to on the map (M = 25.76, SD = 14.96). No significant interaction effect was found between the two factors (F(2, 54) = 1.17, p = 0.320, η2 = 0.05).
4.1.2 Task 2
For Task 2, no significant main effect of virtual map visual presentation was found (F(1, 54) = 0.89, p = 0.356, η2 = 0.04). However, there was a significant main effect of the location of landmark description (F(2, 54) = 11.09, p = 0.000, η2 = 0.34). Post hoc tests revealed that task completion times for landmarks located on (M = 25.30, SD = 5.27) and below the map (M = 25.88, SD = 7.26) were significantly shorter than for landmarks within the map (M = 37.06, SD = 17.97). There was no significant interaction effect (F(2, 54) = 3.14, p = 0.053, η2 = 0.13).
4.1.3 Task 3
Task 3 results indicated no significant main effect of virtual map visual presentation (F(1, 54) = 0.26, p = 0.616, η2 = 0.01) or the location of landmark description (F(2, 54) = 0.56, p = 0.577, η2 = 0.03). However, a significant interaction effect between the two factors was found (F(2, 54) = 3.67, p = 0.034, η2 = 0.14). As shown in Figure 5, the 3D map (M = 44.82, SD = 10.92) was faster than the 2D map (M = 59.84, SD = 17.60) when landmarks were located on the map. Similarly, the 3D map (M = 49.28, SD = 14.98) also performed better than the 2D map (M = 57.63, SD = 19.22) when landmarks were below the map. Conversely, the 2D map (M = 39.15, SD = 12.00) outperformed the 3D map (M = 55.61, SD = 37.02) when landmarks were within the map.
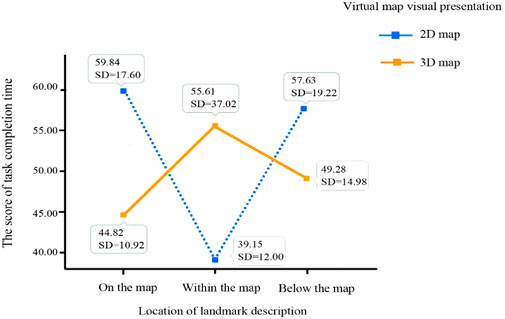
Figure 5. The interaction diagram of the “virtual map visual presentation” and the “location of landmark description” regarding the task 3 completion time.
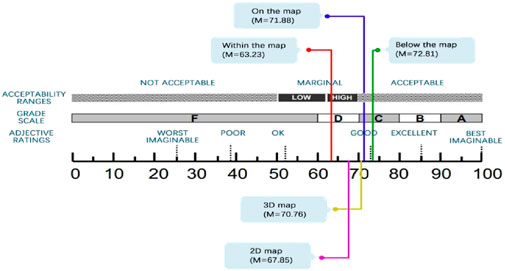
Figure 6. Distribution of the System Usability Scale (SUS) profiles for each group of experiments (adapted from Brooke, 1996) (Figure 6).
4.1.4 Task 4
The results for Task 4 completion time showed a significant main effect of virtual map visual presentation (F(1, 54) = 5.54, p = 0.028, η2 = 0.20), with participants using the 3D map (M = 13.29, SD = 8.07) completing the task faster than those using the 2D map (M = 18.28, SD = 13.95). A significant main effect of the location of landmark description was also found (F(2, 54) = 16.69, p = 0.000, η2 = 0.43), with shorter completion times for landmarks located on (M = 11.63, SD = 3.99) and below (M = 10.88, SD = 4.30) the map compared to within the map (M = 24.85, SD = 15.86). No significant interaction effect was observed (F(2, 54) = 2.46, p = 0.097, η2 = 0.10).
4.1.5 Task 5
For Task 5, no significant main effect of virtual map visual presentation was found (F(1, 54) = 0.21, p = 0.655, η2 = 0.01). However, a significant main effect of the location of landmark description was observed (F(2, 54) = 6.57, p = 0.003, η2 = 0.23). Post hoc tests showed that task completion times for landmarks located below (M = 9.21, SD = 2.79) and on (M = 10.83, SD = 4.04) the map were shorter than those within the map (M = 15.93, SD = 10.98). No significant interaction effect was found between the two factors (F(2, 54) = 2.67, p = 0.080, η2 = 0.11).
4.2 Analysis of the SUS
The results of the SUS analysis (Table 5) indicated no significant main effect of virtual map visual presentation (F(1, 54) = 0.70, p = 0.410, η2 = 0.03). However, a significant main effect of the location of landmark description was observed (F(2, 54) = 5.01, p = 0.011, η2 = 0.19). Post hoc analysis revealed that SUS scores for landmarks located on (M = 71.88, SD = 12.36) and below (M = 72.81, SD = 10.04) the map were significantly higher than for those within the map (M = 63.23, SD = 15.30). No significant interaction effect was found (F(2, 54) = 1.49, p = 0.237, η2 = 0.06).
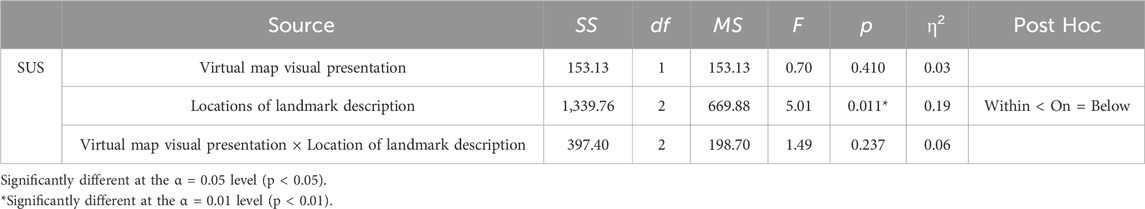
Table 5. The two-way analysis of variance (ANOVA) for the performance of the System Usability Scale (SUS).
4.3 Analysis of subjective evaluations
Subjective evaluations were collected using a 7-point Likert scale (1 = least agree, 7 = most agree) after participants completed their assigned tasks. The results from the between subject design for subjective evaluations are presented in Table 6.
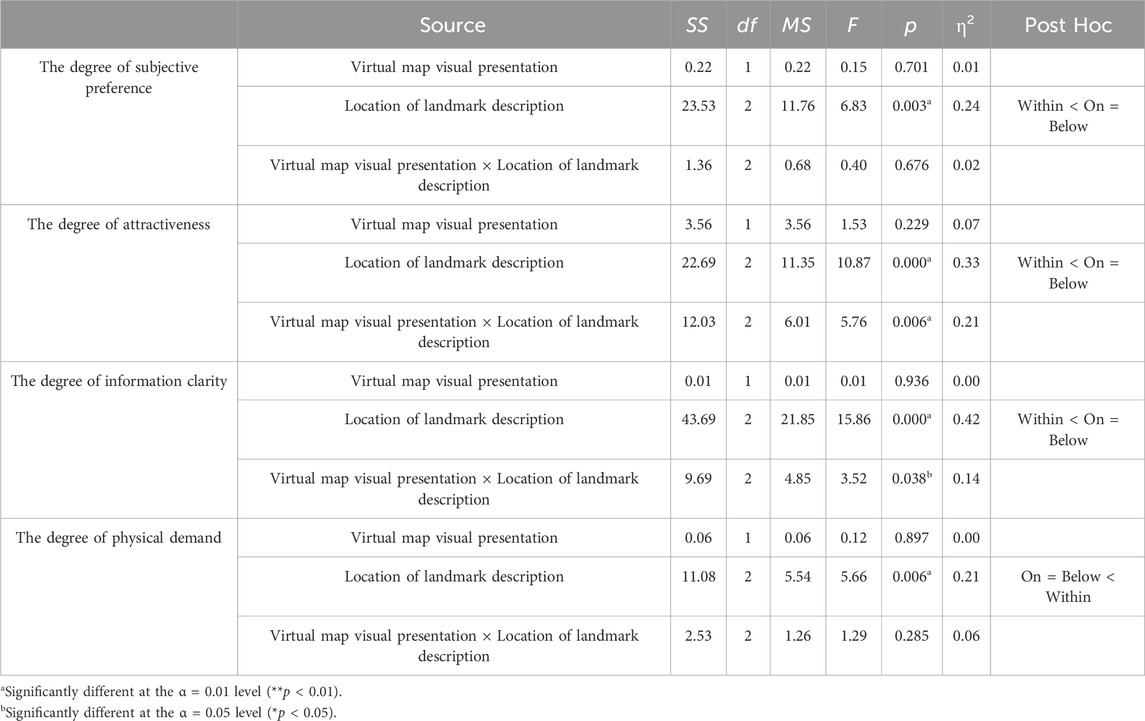
Table 6. The two-way analysis of variance (ANOVA) of participants’ subjective evaluations.
4.3.1 Analysis of the degree of subjective preference
The results for subjective preference showed no significant main effect of virtual map visual presentation (F(1, 54) = 0.15, p = 0.701, η2 = 0.01). However, a significant main effect of the location of landmark description was found (F(2, 54) = 6.83, p = 0.003, η2 = 0.24), with post hoc tests indicating that subjective preference was higher for landmarks located on (M = 5.42, SD = 1.02) and below (M = 4.96, SD = 0.95) the map than within the map (M = 4.04, SD = 1.68). No significant interaction effect was observed (F(2, 54) = 0.40, p = 0.676, η2 = 0.02).
4.3.2 Analysis of the degree of attractiveness
The results generated from the between subject design of the degree of attractiveness are shown in Table 6. They revealed no significant difference in the main effect of the virtual map visual presentation (F(1,54) = 1.53, p = 0.229 > 0.05; η2 = 0.07). However, there was a significant difference in the main effect of the location of the landmark description (F(2,54) = 10.87, p = 0.000 < 0.05; η2 = 0.33). The result of the Post-Hoc test showed that the degree of attractiveness for on the map (M = 5.38, SD = 1.17) was significantly higher than that of within the map (M = 4.04, SD = 1.63). Besides, the degree of attractiveness for below the map (M = 5.00, SD = 0.93) was also significantly higher than that of within the map (M = 4.04, SD = 1.63). Nonetheless, there was no significant difference in the degree of attractiveness between on the map and below the map. Besides, there existed a significant interaction effect between the virtual map visual presentation and the location of the landmark description (F(2,54) = 3.67, p = 0.034 < 0.05; η2 = 0.14). Figure 7 illustrates that the 3D map (M = 6.08, SD = 0.79) was more attractive than the 2D map (M = 4.67, SD = 1.03) when the location of the landmark description was on the map. Besides, the 3D map (M = 5.25, SD = 1.06) was also more attractive than the 2D map (M = 4.75, SD = 0.75) when the location of the landmark description was below the map. In contrast, the 2D map (M = 4.33, SD = 1.72) was more attractive than the 3D map (M = 3.75, SD = 1.54) when the location of the landmark description was within the map.
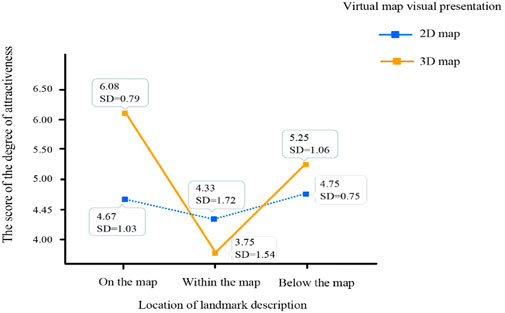
Figure 7. The interaction diagram of the “virtual map visual presentation” and the “location of landmark description” regarding the degree of attractiveness.
4.3.3 Analysis of the degree of information clarity
The results generated from the between subject design regarding the degree of information clarity are shown in Table 6. They revealed no significant difference in the main effect of the virtual map visual presentation (F(1,54) = 0.08, p = 0.777 > 0.05; η2 = 0.00). However, there was a significant difference in the main effect of the location of landmark description (F(2,54) = 14.63, p = 0.000 < 0.05; η2 = 0.40). The result of the Post-Hoc test showed that the degree of information clarity for on the map (M = 5.67, SD = 0.82) was significantly higher than that of within the map (M = 4.00, SD = 1.56). Moreover, the degree of information clarity for below the map (M = 5.20, SD = 1.14) was also significantly higher than that of within the map (M = 4.00, SD = 1.56). However, there was no significant difference in the degree of information clarity between on the map and below the map. Besides, there existed a significant interaction effect between the virtual map visual presentation and the location of landmark description (F(2,54) = 5.86, p = 0.006 < 0.05; η2 = 0.21). Figure 8 illustrates that the 3D map (M = 6.00, SD = 0.60) was clearer than the 2D map (M = 5.33, SD = 0.89) when the location of the landmark description was on the map. Besides, the 3D map (M = 5.42, SD = 1.00) was also clearer than the 2D map (M = 5.00, SD = 1.28) when the location of the landmark description was below the map. In contrast, the 2D map (M = 4.67, SD = 1.23) was clearer than the 3D map (M = 3.33, SD = 1.61) when the location of the landmark description was within the map.
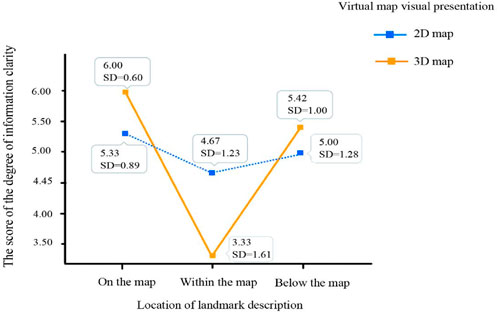
Figure 8. The interaction diagram of the “virtual map visual presentation” and the “location of landmark description” regarding the degree of information clarity.
4.3.4 Analysis of the degree of physical demand
The results generated from the between subject design of the degree of physical demand are shown in Table 6. They revealed no significant difference in the main effect of the virtual map visual presentation (F(1,54) = 0.12, p = 0.897 > 0.05; η2 = 0.00). However, there was a significant difference in the main effect of the location of the landmark description (F(2,54) = 5.66, p = 0.006 < 0.05; η2 = 0.21). The result of the Post-Hoc test showed that the degree of physical demand for on the map (M = 2.08, SD = 1.10) was significantly lower than that for within the map (M = 2.79, SD = 1.12). Besides, the degree of physical demand for below the map (M = 1.88, SD = 0.95) was also significantly lower than that for within the map (M = 2.79, SD = 1.61). However, there was no significant difference in the degree of physical demand between on the map and below the map. There existed no significant interaction effect between the virtual map visual presentation and the location of the landmark description (F(2,54) = 1.29, p = 0.285 > 0.05; η2 = 0.06).
5 Discussions
In this study, we investigated the impact of virtual map visual presentations and the placement of landmark descriptions on participants’ wayfinding visual search performance and subjective evaluations when interacting with the user interface of an intelligent shopping guide terminal. The experimental findings are thoroughly analyzed, and limitations are acknowledged.
5.1 Discussions of wayfinding visual search performance
The experimental results revealed that the visual presentation of the virtual map had a significant main effect in Task 1, with participants completing the task significantly faster using a 3D map compared to a 2D map. This could be attributed to participants being able to visually perceive the 3D map of the shopping mall more quickly than the 2D version, as landmarks in the 2D map were more visually dispersed. There is an inherent difference in visual perception between central and peripheral fields of vision, influenced by the physiological structure of the human retina (Lei et al., 2016). The visual acuity of the human system is highest in the central region and decreases towards the periphery (Albarrak et al., 2021). As a result, landmarks presented centrally in the 3D map were easier for participants to locate. Additionally, the perspective view in 3D maps facilitates matching the visual information from the map to the physical world (Oulasvirta et al., 2007). These findings support Q2, confirming that virtual map visual presentations can enhance user wayfinding visual search performance in intelligent shopping guide terminals.
In Tasks 2, 4, and 5, which involved visual searches and information comparisons, the location of landmark descriptions significantly impacted performance. Participants navigated faster when landmarks were described on or below the map rather than within the map. However, no significant difference was found between landmarks positioned on and below the map. One explanation could be that numerical labels were used to correlate map regions with corresponding landmark descriptions, simplifying the map’s visual complexity compared to descriptions within the map. Previous studies have demonstrated that increased visual complexity prolongs visual search time (Neider and Zelinsky, 2011). Though prior research indicated quicker response times at the top of the screen (Gong et al., 2012), no significant difference was observed in this study, likely due to the need for frequent eye focus shifts between the map and the external landmark descriptions. These shifts may have offset any advantage in visual attention (Lee and Tversky, 2005). Overall, the results confirm Q1, suggesting that the location of landmark descriptions can influence wayfinding visual search performance.
The study also identified a significant interaction between virtual map presentation and landmark description location in Task 3. Specifically, participants performed faster with the 3D map when landmarks were positioned on or below the map, while the 2D map outperformed the 3D map when landmarks were within the map. This could be due to the higher density of landmark descriptions in 3D maps, which could hinder visual search performance compared to the 2D map. These results align with previous research indicating that 3D maps cluster visual attention and reduce search efficiency (Lei et al., 2016). Reduced visual complexity and a narrower peripheral view in 3D maps, especially when landmarks are placed outside the map, further explain the faster performance with 3D maps. These findings support Q4, showing a significant interaction between virtual map visual presentation and landmark description location.
Additionally, it is worth noting that in our study, we found that the main effect of Virtual Map Visual Presentation was only significant in Task 1 and Task 4. That is, participants completed the tasks significantly faster when using the 3D map compared to the 2D map. However, no such significant main effect was observed in Task 2, Task 3, and Task 5. The possible reasons are as follows: Firstly, although all our tasks align with functions frequently used in daily life, there are differences in task difficulty. Regarding Task 1 and Task 4, they may involve more intuitive spatial navigation or object localization. These tasks can provide richer spatial information and depth perception in a 3D environment, thereby helping participants complete the tasks more quickly. Hence, the 3D map demonstrated a significant advantage in these tasks. In contrast, the characteristics of Task 2, Task 3, and Task 5 are such that the 2D map may have already provided sufficient information, and the additional dimension of the 3D map did not bring about a noticeable improvement in efficiency. It might even slightly slow down the task completion speed due to the increased complexity of information processing.
5.2 Discussion of subjective evaluations
Analysis of the System Usability Scale (SUS), subjective preference, attractiveness, information clarity, and physical demand consistently showed that landmark description location significantly influenced user experience. Participants rated landmark descriptions on or below the map more favorably than those within the map, with no significant difference between descriptions placed on or below the map. The higher density of labels within the map increases the cognitive load required to process the information (Goldberg and Kotval, 1999). In contrast, placing landmarks outside the map reduced visual complexity and facilitated faster spatial mental model construction. These findings support Q3, confirming that landmark descriptions on or below the map are more attractive to users. From the semi-structured interviews, many participants mentioned that when the landmark descriptions were within the map, they felt overwhelmed by the amount of information. On the other hand, when the descriptions were on or below the map, participants reported a clearer and more organized view.
The subjective evaluation also revealed a significant interaction between virtual map presentation and landmark location. When landmarks were placed on or below the map, 3D maps were rated higher in attractiveness and information clarity compared to 2D maps. However, when landmarks were within the map, 2D maps outperformed 3D maps. This is likely due to the higher density and complexity of 3D maps when landmarks are within the map, which demands greater cognitive resources to process (Popelka and Doležalová, 2015). Furthermore, the high visual complexity of 3D maps can overload the visual system, resulting in serial searches and reducing search fluency (Kahneman, 1973). These findings align with Q4, indicating a clear interaction effect between map presentation and landmark location. The interviews also supported this interaction. When using 3D maps with landmarks on or below, participants found the perspective and depth appealing. However, when landmarks were placed inside the 3D map, the complexity became a deterrent.
5.3 Limitations
While this study provides valuable insights, several limitations should be noted. First, the participant sample was limited to college students aged 18–39, representing a narrow demographic. Although this age group is typical of intelligent shopping guide terminal users, future studies should include broader demographic factors such as age, gender, occupation, and user experience, as these may significantly influence wayfinding visual search performancee. Second, the color scheme of the experimental interface could have affected participants’ visual search and perception during wayfinding, as color is known to influence visual cognition. Future research could employ eye-tracking technology to explore the effects of different color schemes on wayfinding visual search performance. Lastly, the complexity of the virtual environment, including the density of landmark information, plays a crucial role in spatial perception and search efficiency. This study did not simulate highly complex and realistic virtual environments, which may limit the generalizability of the findings. Future studies should explore the impact of environmental complexity in more realistic settings to provide a deeper understanding of its influence on wayfinding behavior.
6 Conclusion
This study explored the influence of the virtual map’s visual presentation and the placement of landmark descriptions on participants’ task performance and subjective evaluations when using intelligent shopping guide terminals, providing crucial insights for interface visual design refinement. Firstly, regarding the optimal placement of landmark descriptions, positioning them on or below the map leads to better wayfinding visual search performance, lower physical demand during tasks, and more positive subjective evaluations compared to placing them within the map. Secondly, in terms of the virtual map’s visual presentation, 3D maps generally enhance wayfinding visual search performance, attractiveness, and information clarity when landmarks are on or below the map. Conversely, 2D maps are more effective when landmarks are within the map.
These findings expand the existing understanding of user interface design for intelligent shopping guide terminals. Future research should delve into additional visual design variables and explore multimodal design strategies to further enhance user experience and improve wayfinding visual search performance in such systems.
Data availability statement
The raw data supporting the conclusions of this article will be made available by the authors, without undue reservation.
Ethics statement
Ethical approval was not required for the studies involving humans because although this study involved human participants, it did not require formal ethical approval because it was a non-invasive human-computer interaction study with minimal risk. All participants (university students) provided written informed consent before the experiment, and they were fully informed of their right to withdraw at any time without penalty. The studies were conducted in accordance with the local legislation and institutional requirements. The participants provided their written informed consent to participate in this study.
Author contributions
LX: Supervision, Project administration, Visualization, Data curation, Writing – review & editing. WZ: Writing – original draft, Methodology, Investigation, Conceptualization, Writing – review & editing.
Funding
The author(s) declare that financial support was received for the research and/or publication of this article. This research was supported by the 2024 Higher Education Research Project of the Guangdong Higher Education Association (24GQN16) and the Teaching and Research Project for Ideological and Political Theory Courses in Higher Education Institutions of the Guangdong Regional Collaborative Innovation Center for Ideological and Political Courses in Higher Education Institutions (ZFJ202464).
Acknowledgements
The research did not receive any specific support from individuals, public, or commercial organizations. Many thanks to the reviewers for their comments and efforts to improve this paper.
Conflict of interest
The authors declare that the research was conducted in the absence of any commercial or financial relationships that could be construed as a potential conflict of interest.
Generative AI statement
The author(s) declare that no Generative AI was used in the creation of this manuscript.
Any alternative text (alt text) provided alongside figures in this article has been generated by Frontiers with the support of artificial intelligence and reasonable efforts have been made to ensure accuracy, including review by the authors wherever possible. If you identify any issues, please contact us.
Publisher’s note
All claims expressed in this article are solely those of the authors and do not necessarily represent those of their affiliated organizations, or those of the publisher, the editors and the reviewers. Any product that may be evaluated in this article, or claim that may be made by its manufacturer, is not guaranteed or endorsed by the publisher.
References
Akrimi, Y., and Khemakhem, P. R. (2014). An analysis of perceived usability, perceived interactivity and website personality and their effects on consumer satisfaction. Int. J. Manag. Excell. 2 (3), 227–236.
Albarrak, L., Metatla, O., and Roudaut, A. (2021). Exploring the influence of subliminal stimulus type and peripheral angle on the priming effect. Int. J. Human-Computer Stud. 151, 102631. doi:10.1016/j.ijhcs.2021.102631
Allen, G. L. (1999). Spatial abilities, cognitive maps, and wayfinding: bases for individual differences in spatial cognition and behavior. Wayfinding Behav., 46–80.
Battleson, B., Booth, A., and Weintrop, J. (2001). Usability testing of an academic library web site: a case study. J. Acad. Librariansh. 27 (3), 188–198. doi:10.1016/s0099-1333(01)00180-x
Bojko, A. (2006). Using eye tracking to compare web page designs: a case study. J. Usability Stud. 1 (3), 112–120.
Caduff, D., and Timpf, S. (2006). A framework for assessing the salience of landmarks for wayfinding tasks. Cogn. Process. 7, 23. doi:10.1007/s10339-006-0049-7
Casakin, H., Barkowsky, T., Klippel, A., and Freksa, C. (2000). “Schematic maps as wayfinding aids,” in Spatial cognition II: integrating abstract theories, empirical studies, formal methods, and practical applications, 54–71.
Chambers, M., and Bowman, K. L. (2011). Finishes and furnishings: considerations for critical care environments. Crit. Care Nurs. Q. 34 (4), 317–331. doi:10.1097/cnq.0b013e31822bad05
Chan, H. Y., Cheng, D., and Chen, A. (2024). Routes with roots: pedestrian route choices and sense of place of an urban university community. J. Transp. Geogr. 118, 103943. doi:10.1016/j.jtrangeo.2024.103943
Chebat, J., Gélinas-Chebat, C., and Therrien, K. (2005). Lost in a mall, the effects of gender, familiarity with the shopping mall and the shopping values on shoppers' wayfinding processes. J. Bus. Res. 58 (11), 1590–1598. doi:10.1016/j.jbusres.2004.02.006
Chen, K. B., Savage, A. B., Chourasia, A. O., Wiegmann, D. A., and Sesto, M. E. (2013). Touch screen performance by individuals with and without motor control disabilities. Appl. Ergon. 44 (2), 297–302. doi:10.1016/j.apergo.2012.08.004
Cheng, B., Wunderlich, A., Gramann, K., Lin, E., and Fabrikant, S. I. (2022). The effect of landmark visualization in mobile maps on brain activity during navigation: a virtual reality study. Front. Virtual Real. 3, 981625. doi:10.3389/frvir.2022.981625
Cheung, A. K. L. (2006). “Representational issues in interactive wayfinding systems: navigating the Auckland university campus,” in Web and Wireless Geographical Information Systems: 6th International Symposium, W2GIS 2006, Hong Kong, China, December 4-5, 2006 (Springer Berlin Heidelberg), 90–101. doi:10.1007/11935148_9
Choi, D., and Park, J. (2024). Flowing line: a new proposal of visual guidance considering FoMO and flow in.
Davids, M. R., Chikte, U., Grimmer-Somers, K., and Halperin, M. L. (2014). Usability testing of a multimedia e-learning resource for electrolyte and acid-base disorders. Br. J. Educ. Technol. 45 (2), 367–381. doi:10.1111/bjet.12042
Deakin, A. K. (1996). Landmarks as navigational aids on street maps. Cartogr. Geogr. Inf. Syst. 23 (1), 21–36. doi:10.1559/152304096782512159
Delikostidis, I., and Van Elzakker, C. P. (2009). Geo-identifi cation and pedestrian navigation with Geo-Mobile applications: how do users proceed? Location based services and TeleCartography II: from sensor fusion to context models, 185–206.
Devlin, A. S., and Bernstein, J. (1997). Interactive way-finding: map style and effectiveness. J. Environ. Psychol. 17 (2), 99–110. doi:10.1006/jevp.1997.0045
Dong, W., Qin, T., Liao, H., Liu, Y., and Liu, J. (2020). Comparing the roles of landmark visual salience and semantic salience in visual guidance during indoor wayfinding. Cartogr. Geogr. Inf. Sci. 47 (3), 229–243. doi:10.1080/15230406.2019.1697965
Fu, M., Liu, R., and Liu, Q. (2024). Why individuals do not use emergency exit doors during evacuations: a virtual reality and eye-tracking experimental study. Adv. Eng. Inf. 60, 102396. doi:10.1016/j.aei.2024.102396
Gilboa, S., Vilnai-Yavetz, I., Mitchell, V., Borges, A., Frimpong, K., and Belhsen, N. (2020). Mall experiences are not universal: the moderating roles of national culture and mall industry age. J. Retail. Consumer Serv. 57, 102210. doi:10.1016/j.jretconser.2020.102210
Goldberg, J. H., and Kotval, X. P. (1999). Computer interface evaluation using eye movements: methods and constructs. Int. J. industrial ergonomics 24 (6), 631–645. doi:10.1016/s0169-8141(98)00068-7
Gong, Y., Yang, Y., Zhang, S., and Qian, X. (2012). Effects of graphical panel layout characteristics on human-computer interactive efficiency. J. Comput.-Aided Des. & Comput. Graph. 24 (9), 1145–1150.
Goodman, J., Brewster, S. A., and Gray, P. (2005). How can we best use landmarks to support older people in navigation? Behav. & Inf. Technol. 24 (1), 3–20. doi:10.1080/01449290512331319021
Harrie, L., Oucheikh, R., Nilsson, Å., Oxenstierna, A., Cederholm, P., Wei, L., et al. (2022). Label placement challenges in city wayfinding map production—identification and possible solutions. J. Geovisualization Spatial Analysis 6 (1), 16. doi:10.1007/s41651-022-00115-z
He, G., Ishikawa, T., and Takemiya, M. (2014). Where are you now? Dynamics of simultaneous, collaborative navigation. Spatial cognition: poster presentations, SFB/TR, 8, 44–47.
Iftikhar, H., and Luximon, Y. (2024). Multiple layer digital wayfinding information: a study of user preferences for information content and design in wayfinding applications. Multimedia Tools Appl. 83 (13), 39197–39216. doi:10.1007/s11042-023-17085-z
Inman, J. J., and Nikolova, H. (2017). Shopper-facing retail technology: a retailer adoption decision framework incorporating shopper attitudes and privacy concerns. J. Retail. 93 (1), 7–28. doi:10.1016/j.jretai.2016.12.006
Kim, J., and Kim, M. (2020). Exploring visual perceptions of spatial information for wayfinding in virtual reality environments. Appl. Sci. 10 (10), 3461. doi:10.3390/app10103461
Kray, C., Elting, C., Laakso, K., and Coors, V. (2003). “Presenting route instructions on mobile devices,” in Proceedings of the 8th international conference on Intelligent user interfaces, 117–124. doi:10.1145/604045.604066
Krey, N., Picot-Coupey, K., and Cliquet, G. (2022). Shopping mall retailing: a bibliometric analysis and systematic assessment of Chebat's contributions. J. Retail. consumer Serv. 64, 102702. doi:10.1016/j.jretconser.2021.102702
Kutnicki, S. (2018). Wayfinding media and neutralizing control at the shopping mall. Crit. Stud. Media Commun. 35 (5), 401–419. doi:10.1080/15295036.2018.1490024
Lee, P. U., and Tversky, B. (2005). Interplay between visual and spatial: the effect of landmark descriptions on comprehension of route/survey spatial descriptions. Spatial cognition & Comput. 5 (2-3), 163–185. doi:10.1080/13875868.2005.9683802
Lee, E., Daugherty, J., Selga, J., and Schmidt, U. (2020). Enhancing patients' wayfinding and visitation experience improves quality of care. J. PeriAnesthesia Nurs. 35 (3), 250–254. doi:10.1016/j.jopan.2019.11.003
Lei, T. C., Wu, S. C., Chao, C. W., and Lee, S. H. (2016). Evaluating differences in spatial visual attention in wayfinding strategy when using 2D and 3D electronic maps. GeoJournal 81, 153–167. doi:10.1007/s10708-014-9605-3
Li, H., and Giudice, N. A. (2013). “The effects of 2D and 3D maps on learning virtual multi-level indoor environments,” in Proceedings of the 1st ACM SIGSPATIAL International Workshop on MapInteraction, 7–12. doi:10.1145/2534931.2534941
Li, Y., Wu, Q., and Zhang, Y. (2021). “Choice of behavior model in new retail: usability testing of intelligent shopping terminals functional framework,” in Advances in Ergonomics in Design: Proceedings of the AHFE 2021 Virtual Conference on Ergonomics in Design, USA, July 25-29, 2021, 554–563. doi:10.1007/978-3-030-79760-7_66
Liao, H., Dong, W., Peng, C., and Liu, H. (2017). Exploring differences of visual attention in pedestrian navigation when using 2D maps and 3D geo-browsers. Cartogr. Geogr. Inf. Sci. 44 (6), 474–490. doi:10.1080/15230406.2016.1174886
Lu, Y., and Peponis, J. (2014). Exhibition visitors are sensitive to patterns of display covisibility. Environ. Plan. B Plan. Des. 41 (1), 53–68. doi:10.1068/b39058
Meziani, R., and Hussien, H. A. (2017). A study on the space layout and configuration of shopping malls in relation to pedestrian movement behavior-case of UAE. Int. Rev. spatial Plan. Sustain. Dev. 5 (3), 53–65. doi:10.14246/irspsd.5.3_53
Millonig, A., and Schechtner, K. (2007). Developing landmark-based pedestrian-navigation systems. IEEE Trans. intelligent Transp. Syst. 8 (1), 43–49. doi:10.1109/tits.2006.889439
Montello, D. R., Waller, D., Hegarty, M., and Richardson, A. E. (2004). “Spatial memory of real environments, virtual environments, and maps,” in Human spatial memory (Psychology Press), 271–306.
Neider, M. B., and Zelinsky, G. J. (2011). Cutting through the clutter: searching for targets in evolving complex scenes. J. Vis. 11 (14), 7. doi:10.1167/11.14.7
Nicholas, D., Huntington, P., and Williams, P. (2001). Establishing metrics for the evaluation of touch screen kiosks. J. Inf. Sci. 27 (2), 61–71. doi:10.1177/0165551014233554
Oulasvirta, A., Nurminen, A., and Nivala, A. M. (2007). Interacting with 3D and 2D mobile maps: an exploratory study. Helsinki Inst. Inf. Technol. April 11.
Pillai, R., Sivathanu, B., and Dwivedi, Y. (2020). Shopping intention at AI-powered automated retail stores (AIPARS). J. Retail. Consumer Serv. 57, 102207. doi:10.1016/j.jretconser.2020.102207
Popelka, S., and Doležalová, J. (2015). “Non-photorealistic 3D visualization in city maps: an eye-tracking study,” in Modern trends in cartography: selected papers of CARTOCON 2014, 357–367.
Pouyan, A. E., Ghanbaran, A. H., Hosseinzadeh, A., and Shakibamanesh, A. (2024). The elderly wayfinding performance in an informative healthcare design indoors. J. Build. Eng. 87, 108843. doi:10.1016/j.jobe.2024.108843
Rechel, B., Buchan, J., and McKee, M. (2009). The impact of health facilities on healthcare workers' well-being and performance. Int. J. Nurs. Stud. 46 (7), 1025–1034. doi:10.1016/j.ijnurstu.2008.12.008
Roth, R. E., Hart, D., Mead, R., and Quinn, C. (2017). Wireframing for interactive & web-based geographic visualization: designing the NOAA Lake level viewer. Cartogr. Geogr. Inf. Sci. 44 (4), 338–357.
Rylov, M., and Reimer, A. (2017). A practical algorithm for the external annotation of area features. Cartogr. J. 54 (1), 61–76. doi:10.1179/1743277414y.0000000091
Schwarz, M., and Hamburger, K. (2024). Memory effects of visual and olfactory landmark information in human wayfinding. Cogn. Process. 25 (1), 37–51. doi:10.1007/s10339-023-01169-7
Slocum, T. A., McMaster, R. B., Kessler, F. C., and Howard, H. H. (2022). Thematic cartography and geovisualization. CRC Press.
N. J. Smelser, and P. B. Baltes (2001). International encyclopedia of the social & behavioral sciences. Amsterdam. Elsevier.
Soh, B. K., and Smith-Jackson, T. L. (2004). Influence of map design, individual differences, and environmental cues on wayfinding performance. Spatial Cognition Comput. 4 (2), 137–165. doi:10.1207/s15427633scc0402_2
Vandenberg, A. E., Hunter, R. H., Anderson, L. A., Bryant, L. L., Hooker, S. P., and Satariano, W. A. (2016). Walking and walkability: is wayfinding a missing link? Implications for public health practice. J. Phys. activity health 13 (2), 189–197. doi:10.1123/jpah.2014-0577
Vilaplana, V. (2015). Saliency maps on image hierarchies. Signal Process. image Commun. 38, 84–99. doi:10.1016/j.image.2015.07.012
Wang, W. (2014). Older adults & home medical device interaction: interface type comparison, display design, and touch gesture analysis. North Carolina State University.
Wickens, C. D. (2000). The when and how of using 2-D and 3-D displays for operational tasks. Proc. Hum. Factors Ergonomics Soc. Annu. Meet. 44 (21), 403–406. doi:10.1177/154193120004402107
Ye, Y., Shi, Y., Xia, P., Kang, J., Tyagi, O., Mehta, R. K., et al. (2022). Cognitive characteristics in firefighter wayfinding tasks: an eye-tracking analysis. Adv. Eng. Inf. 53, 101668. doi:10.1016/j.aei.2022.101668
Yoeli, P. (1972). The logic of automated map lettering. Cartogr. J. 9 (2), 99–108. doi:10.1179/caj.1972.9.2.99
Keywords: wayfinding, shopping mall, intelligent shopping guide terminal, virtual map visual presentation, location of landmark description, user experience
Citation: Xu L and Zhai W (2025) The impact of virtual map visual design and landmark description location on users’ wayfinding visual search performance and experience in intelligent shopping guide terminals. Front. Virtual Real. 6:1622522. doi: 10.3389/frvir.2025.1622522
Received: 23 May 2025; Accepted: 17 October 2025;
Published: 19 November 2025.
Edited by:
Weiya Chen, Huazhong University of Science and Technology, ChinaReviewed by:
Otto Parra, University of Cuenca, EcuadorWendan Huang, Guilin University of Electronic Technology, China
Copyright © 2025 Xu and Zhai. This is an open-access article distributed under the terms of the Creative Commons Attribution License (CC BY). The use, distribution or reproduction in other forums is permitted, provided the original author(s) and the copyright owner(s) are credited and that the original publication in this journal is cited, in accordance with accepted academic practice. No use, distribution or reproduction is permitted which does not comply with these terms.
*Correspondence: Weimin Zhai, emhhaXdlaW1pbkBzenR1LmVkdS5jbg==