 John Cass
 Wing Hong Fu
 Yanping Li
 Larissa Cahill3
 Gabrielle Weidemann
- 1School of Psychology, Western Sydney University, Sydney, NSW, Australia
- 2MARCS Institute for Brain, Behaviour and Development, Western Sydney University, Sydney, NSW, Australia
- 3Department of Defence, Defence Sciences Technology Group, Melbourne, VIC, Australia
Introduction: This study investigates two key questions in perceptual learning using a ten-day visual training protocol embedded in a first-person shooter (FPS) task within virtual reality (VR): (1) whether training improves the visual system’s ability to integrate orientation information across the visual field, and (2) whether aversive electrodermal stimulation and associated stress levels influence perceptual performance and/or learning.
Method: 17 participants successfully completed an orientation-averaging task involving Gabor arrays of varying set-sizes (1, 2, 4, or 8 elements) under three shock conditions: no shock, performance-contingent shock, and random shock.
Results: Training led to improvements in both accuracy and response times, while increasing set-size monotonically impaired performance. The interaction between training and set-size was weak, suggesting that training benefits likely emerge at a post-integration or decisional stage. Stress responses, indexed by the State-Trait Anxiety Inventory (STAI), confirmed elevated anxiety in both shock conditions compared to control. However, this increase in state anxiety did not reliably affect task performance or learning outcomes, nor did it modulate set-size effects. Notably, participants’ accuracy degraded when an on-screen health bar depicted lower “health” levels, regardless of actual shock delivery or contingency.
Discussion: These findings indicate that visual feedback cues can shape engagement or motivation independently of experienced stress. More broadly, the results underscore the role of motivational and attentional mechanisms in immersive training environments and provide a framework for evaluating stress effects using subjective anxiety and objective psychophysical measures.
1 Introduction
Modern visual displays—including high-resolution monitors and head-mounted systems—can present complex, dynamic environments with exceptional spatial and temporal precision (Zhao et al., 2022). However, despite this technological fidelity, the human visual system is constrained by sensory, attentional, and contextual factors that limit perceptual access to all available input (Gilbert et al., 2000; Carrasco and Frieder, 1997; He et al., 1996; Carrasco et al., 1995).
Among these modulators, experience plays a critical role. In the short term, perceptual systems exhibit adaptation, whereby recent exposure to stimuli affects the processing of subsequent inputs (Heinemann and Marill, 1954; Blakemore and Nachmias, 1971; Rideaux et al., 2023). Adaptation effects are typically transient, decaying over seconds to minutes depending on the stimulus and task (Zhang et al., 2023; Jones and Holding, 1975). These passive effects contrast with longer-lasting improvements achieved through active engagement—namely, perceptual learning. Perceptual learning refers to sustained enhancements in stimulus discrimination or detection that result from practice and task-specific exposure (Goldstone, 1998; Prettyman, 2019). Such learning influences both low-level sensory processing (Polat and Sagi, 1994; Yehezkel et al., 2015) and higher-order attentional deployment across the visual field (Donovan and Carrasco, 2018).
1.1 Related work
1.1.1 Ensemble perception and sampling efficiency
One class of perceptual task in which perceptual learning has a demonstrable impact is ensemble perception, where observers estimate global statistical properties—such as the average, variance, or range—across a set of spatially distributed elements (Whitney and Yamanashi Leib, 2018; Moerel et al., 2016). Orientation averaging tasks using Gabor patches—sinusoidal gratings commonly used in vision science to assess orientation sensitivity—are often used to study this process. Using an orientation averaging task, Moerel et al. (2016) demonstrated that accuracy improves with practice, which they attributed to increased sampling efficiency: the effective number of local elements integrated by the visual system to estimate the global average.
1.1.2 Attention and computational stages
Dakin et al. (2009) further linked sampling efficiency to attentional resources by employing a dual-task paradigm. Participants simultaneously performed a central task and an orientation-averaging task in the periphery. When central attentional load increased, orientation-averaging performance declined. This led to two theoretical accounts. The early selection account posits that attention limits how many local signals reach the integration stage. Alternatively, the late selection account suggests that integration occurs across all inputs, but attention modulates signal-to-noise at a later, decisional stage.
1.1.3 Aversive conditioning and perception
Affective and motivational factors also influence perception. Aversive conditioning—where a neutral stimulus is paired with an unpleasant outcome—has been shown to enhance discrimination by increasing the distinctiveness of stimulus features (Rhodes et al., 2018; Li et al., 2008; Lawrence, 1949; Stegmann et al., 2021). However, the literature is mixed: other studies have reported decrements in perceptual performance following exposure to aversive stimuli (Resnik et al., 2011; Shalev et al., 2018).
1.1.4 Stress and attention
One proposed mechanism for these opposing effects is stress. Exposure to unpredictable or intense aversive stimuli triggers a stress response involving elevated cortisol and sympathetic nervous system activation (Herman et al., 2016; Arnsten, 2009). This cascade can impair frontally mediated attentional functions, particularly in high-demand tasks (Ebersole, 2016; Sanger et al., 2014; de Voogd et al., 2022; Dinse et al., 2017). As orientation averaging relies on attention, it is plausible that stress may reduce sampling efficiency, either by limiting the number of integrated samples (early selection) or by degrading decision-level processing (late selection).
1.1.5 Motivation and aversive reinforcement
Conversely, performance-contingent punishment—such as shocks administered after incorrect responses—may enhance performance through increased task motivation. This process, grounded in operant conditioning, has been shown to improve perceptual accuracy when feedback is contingent and behaviourally relevant (Watson et al., 2019; Sawaki et al., 2015; Erickson, 1970; Blank et al., 2013). Such effects have been attributed to motivational sharpening of attention and response caution.
1.2 Research aims and hypotheses
The present study explores how training and affective context (via aversive electrodermal stimulation) influence orientation-averaging performance in an immersive virtual reality (VR) environment. Specifically, we investigate:
1. Whether perceptual training improves ensemble processing via early-stage sampling or late-stage decision efficiency.
2. How acute stress (induced by random shocks) and motivation (induced by performance-contingent shocks) modulate perceptual performance.
3. Whether these effects interact with the quantity of task-relevant information (set-size: 1, 2, 4, or 8 Gabors).
Our hypotheses are as follows:
• H1: If training improves early-stage sampling, then increasing set-size will result in shallower performance declines over time (i.e., improved slope). If training improves late-stage decision processes, accuracy will increase overall, but the slope of set-size degradation will remain constant.
• H2: If acute stress impairs attentional capacity, we expect lower performance in the random shock group compared to the no shock and performance-contingent shock groups.
• H3: If motivational contingencies improve performance, accuracy in the performance-contingent shock group will exceed that in the random shock group.
• H4: If stress impacts early encoding, accuracy will decline more steeply with set-size in the shock conditions. If stress or motivation affects late decision stages, we expect group differences in accuracy without significant changes in slope.
1.3 Experimental overview
We employed a 10-day longitudinal design, in which 17 participants completed a VR-based shooting task involving orientation averaging of Gabor stimuli. Gabor arrays were positioned in fixed circular configurations to ensure consistent visual sampling across trials. This design allowed for controlled manipulation of set-size while minimising confounds due to spatial unpredictability, which could affect attention allocation.
Participants were randomly assigned to one of three groups: no shock, performance-contingent shock, or random shock, and we measured accuracy, response time, and anxiety levels using validated instruments (e.g., STAI). While the 10-day period aligns with prior perceptual learning studies indicating reliable gains over such durations (Moerel et al., 2016), future work may examine shorter or longer timelines.
This study seeks to clarify the mechanisms by which perceptual learning unfolds and the influence of stress and motivation on visual decision-making in immersive environments—critical insights for adaptive training and human performance optimisation in VR.
2 Methods
2.1 Participants
Twenty-two participants were recruited from the Western Sydney University community via convenience sampling between 1st April and 31st July 2022. Two participants withdrew from the study—one due to illness (COVID-19) and one voluntarily—leaving 20 who completed all testing sessions. Three additional participants were excluded: one for non-compliance with task instructions, and two for receiving an unusually high number of shocks due to technical error. The final sample comprised 17 healthy adults (8 female; 9 male; mean age = 26.2 years, SD = 12.4), all with normal or corrected-to-normal vision.
All participants provided informed consent prior to participation. The study was approved by the Western Sydney University Human Research Ethics Committee (H13736) and conducted in accordance with the Declaration of Helsinki. Participants were naïve to the study’s aims and received $250 AUD for their participation.
2.2 Experimental design
The experiment used a 3 (Shock Group: No Shock, Random Shock, Performance-Contingent Shock) × 10 (Training Day) × 5 (Set-Size: 1, 2, 3, 4, or 8 Gabor elements) mixed factorial design. Shock group was a between-subjects factor; training day and set-size were within-subjects factors. Each participant completed 10 training sessions on consecutive weekdays.
Participants were randomly allocated to one of three shock conditions. In the performance-contingent shock group, participants received an electrodermal stimulus following every 10th incorrect response. In the random shock group, shocks were administered with a 3% chance per trial, independent of performance. This probability was determined via pilot testing to approximate the average frequency of shocks received by the performance-contingent group. Participants in the no-shock group received no stimulation.
Average daily shocks were 10.9 (SD = 2.3) in the performance-contingent group and 13.1 (SD = 3.0) in the random shock group.
The key outcome measures were orientation discrimination accuracy, correct response time (RT), and state anxiety scores (via the STAI).
2.3 Task overview
Participants performed a custom-built virtual reality orientation-averaging task embedded in a first-person shooter (FPS) game. On each trial, they viewed an array of Gabor elements (stimulus set-size varied across trials) and judged whether the average orientation was tilted clockwise or counter clockwise from vertical (Figure 1). Participants responded by shooting one of two visually identical virtual agents, each standing to the left or right of a central post, depending on the inferred average orientation of the Gabors.
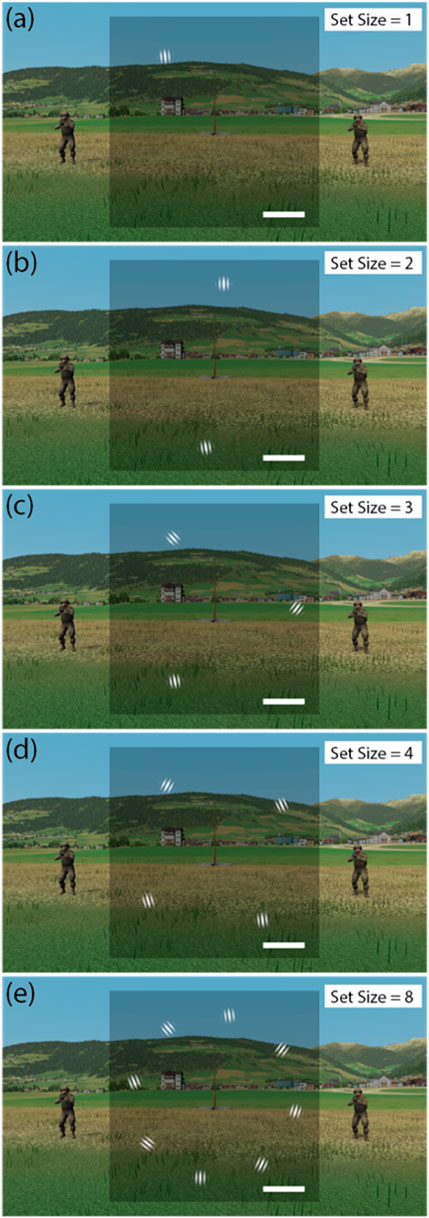
Figure 1. First-person perspective of the VR D-world environment and Gabor arrays. Gabor stimuli of varying set-sizes (1, 2, 3, 4 and 8) illustrated in panels (a–e) respectively. Note on each trial the average orientation was plus or minus 5° from vertical. Images all show Gabors tilted −5° from vertical on average, signifying that the entity on the left is the enemy.
Correct responses prevented hostile fire, while incorrect responses triggered either a visual consequence (loss of health bar) or, in shock conditions, electrodermal stimulation (depending on shock group). The task structure was designed to promote integration of ensemble visual information and translate perceptual decisions into motor actions in an immersive environment.
2.4 Materials and apparatus
2.4.1 Software
The virtual environment was developed using the Unity engine by MultiSim© and presented via a custom-built ‘D-world’ module. The D-world simulated a rural Swiss landscape (coordinates: 46.727° N, 12.219° E) and included all in-game events and stimuli. System events and behavioural data were recorded in H5 format using a built-in logger with a maximum sampling rate of 500 Hz. Only state changes triggered new entries, optimizing data file size.
A separate Python script (v3.8.6) synchronized experimental events, controlled shock delivery, and parsed task performance.
2.4.2 Hardware
The experiment was run on two Windows 10 PCs: one for rendering the D-world (Intel Core i7-9700K, NVIDIA GTX 2060), and another for VR stimulus presentation and headset output (Intel Core i7-9700K, NVIDIA GTX 2070 SUPER). Audio feedback was delivered via Philips/Gibson headphones.
Participants viewed stimuli using an Oculus Rift S headset (1,280 × 1,440 pixels per eye; 80 Hz refresh rate). Interpupillary distances (IPD) were measured using the ‘GlassesOn’ mobile app (LTD, 2022) and matched to the headset’s software-adjustable settings (range: 58–69 mm).
A custom-built replica rifle prop (988 g) (Figure 2a) housed a left-handed Oculus Touch controller to track six degrees of freedom. The prop was ergonomically adapted and visually matched to an EF88 AUS Steyr assault rifle.
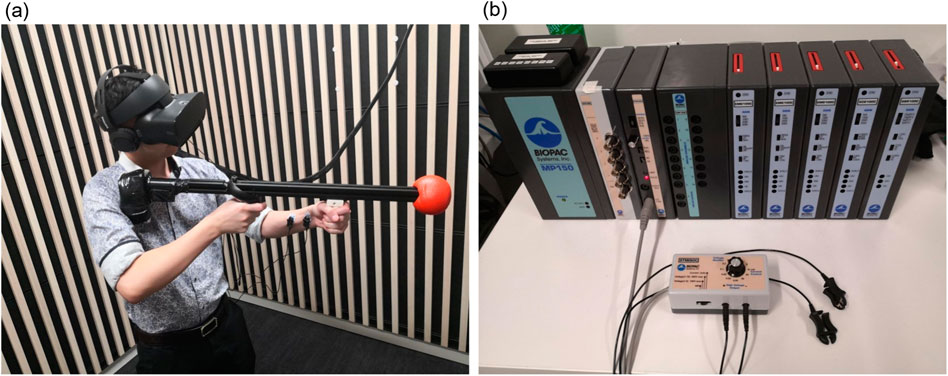
Figure 2. Experimental apparatus and electrodermal stimulus set-up. (a) Shows a participant wearing the VR Oculus headset and headphones holding the controller-mounted custom rifle prop with electrodes applied to the non-dominant forearm. (b) Shows the Biopac MP-150 signal conditioning module and STMISOC electrodermal stimulation device.
2.4.3 Electrodermal stimulation
Electrodermal stimuli were delivered using a Biopac MP-150 with an STMISOC isolated stimulator (Figure 2B). Participants in shock conditions self-adjusted the stimulation intensity prior to each session, targeting a level they reported as “uncomfortable but not painful.” Stimulation pulses were 100 ms in duration, with selected currents ranging from 30 to 90 µA (mean = 62.7 µA, SD = 14.3).
2.4.4 Subjective measures
State and trait anxiety were measured using the State-Trait Anxiety Inventory for Adults (STAI-AD) (Spielberger et al., 1983), administered pre- and post-session via Qualtrics on a tablet. The STAI-AD includes 40 items rated on a 4-point Likert scale. It has high reliability (α = 0.86–0.95) and strong construct validity.
2.5 Stimuli and virtual environment
The virtual environment included a central pole flanked by two stationary soldier agents (98 × 256 pixels), one of whom was designated “hostile” each trial. Hostility was randomly assigned on each trial and signaled solely via the mean orientation of the Gabor array: −5° indicated the left agent was hostile; +5° indicated the right.
Stimuli appeared in a semi-transparent 1,024 × 1,024 pixel square, fixed to the participant’s visual field. The health bar in the lower-right corner reduced by 10% after incorrect responses for all participants, acting as performance feedback and shock countdown (in the performance-contingent group). Following any trial in which the health bar reached 0%, it was reset to 100% at the start of the subsequent trial.
2.5.1 Gabor arrays
Each trial presented 1, 2, 3, 4, or 8 Gabor patches arranged equidistantly, but otherwise randomly positioned on a circular annulus (radius: 400 pixels; ∼25° visual angle). Each Gabor was a sinusoidal grating (0.8–1.6 cycles/deg) with a Gaussian envelope (FWHM = 83 pixels). For multi-element trials, orientations were sampled from a Gaussian distribution (SD = 20°) with a mean of ±5° from vertical. The final Gabor’s orientation was adjusted to ensure the overall mean orientation met the ±5° offset exactly. Figure 1 illustrates all five set-size conditions.
2.5.2 Trial timing and response
Each trial began with a 500 ms system initialization delay, followed by display of the visual field square. After 500 ms, the Gabor array appeared and remained visible for up to 2,500 ms or until the participant shot a target. Reaction time was calculated from Gabor onset to response. If no response was made within 2,500 ms, an animation showed the hostile agent firing at the participant.
Incorrect trials (shooting the friendly agent or failing to shoot the hostile one) triggered a 10% reduction in the health bar. In the performance-contingent group, a shock was administered when the health bar reached 0%. In the random group, shocks were probabilistic and unrelated to health status.
2.6 Procedure
All participants completed 10 testing sessions on consecutive weekdays. On Day 1, participants were briefed, consented, and randomly assigned to a shock group (No Shock: n = 5; Random Shock: n = 5; Performance-Contingent: n = 7). After measuring IPD and fitting the headset, participants completed a practice session (∼20 trials) to ensure task understanding.
Shock group participants underwent a daily calibration to identify their preferred stimulation level. Each testing session consisted of two blocks of 210 trials (42 per set-size), separated by a 5–10 min break. Participants completed the STAI before and after each session.
2.7 Ethical considerations and data availability
The experiment was approved by the WSU Human Research Ethics Committee (H13736). All procedures complied with the Declaration of Helsinki. This study was not preregistered. De-identified data and analysis scripts are available upon request.
2.8 Competing interests statement
The authors declare no competing interests.
3 Results
In this study we assessed two measures of behavioural performance, accuracy and correct response times. Accuracy was indexed as the proportion of trials in which the participant correctly identified and shot the hostile agent prior to themselves being shot by the hostile agent. Trials in which the participant shot the friendly agent or were shot by the hostile agent were considered incorrect trials. Response times refer to the time between the appearance of the diagnostic Gabor elements and the participant shooting the hostile agent. Only ‘correct’ trials (those where the participant shot the hostile agent before the hostile agent was able to shoot) were used in the calculation of response times.
Performance analyses were conducted using linear mixed-effects models and growth curve analysis, in accordance with established methods for longitudinal performance modeling.
The overall effects of set-size and training session on accuracy and correct reaction times orientation-averaging/shooting task averaged across participants in each of the three shock conditions are shown in Figure 3. Visual inspection of this figure reveals several trends. Most notable are the effects of training session, with performance generally improving (accuracy increasing (top row Figures 3a-e), response times decreasing (bottom row Figures 3f-j)) with subsequent days of testing. With regard to set-size (columns Figure 3), one can observe overall reductions in accuracy and increases in response times with increasing set-size. The effects of our various shock conditions (coloured curves) are less obvious from visual inspection.
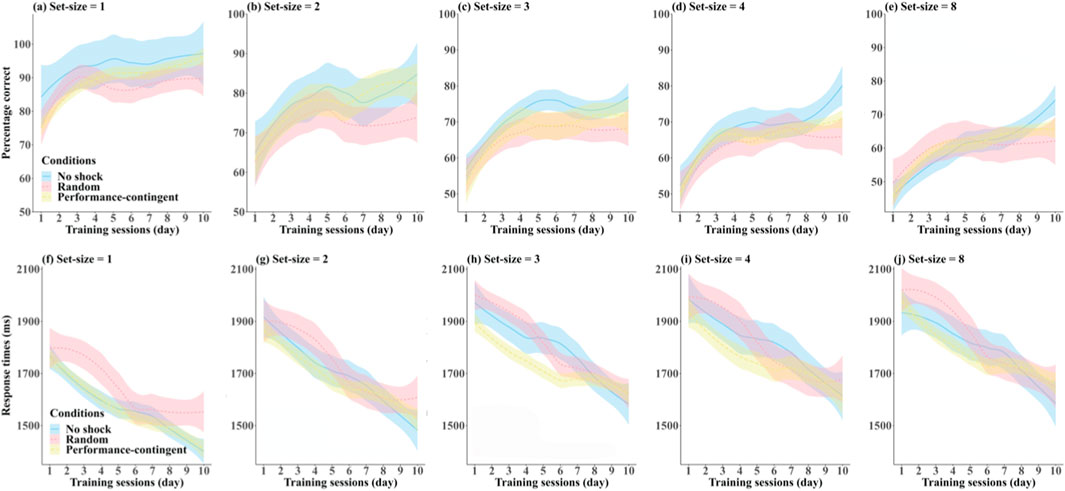
Figure 3. Accuracy and correct response times. Effects of training session and set-size on participant-averaged accuracy (a-e) and response times (f-j) in each of the three shock condition training groups: no shock (blue), random shock (red) and performance-contingent shock (yellow). Shaded regions are between-subjects standard errors.
To statistically assess the main and interactive effects of training and shock condition we applied growth curve analysis (Mirman, 2014). Growth curve analysis can be used to analyse performance changes in longitudinal studies, so we employed this technique to model the effects of training in our orientation-averaging task. This was done using the lmer function from the package lmerTest (Kuznetsova et al., 2017) in R version 4.2.1 (Team, 2022). Given that several of the curves in Figure 4 had at least a single inflection, growth curve data were modelled with up to second-order orthogonal polynomials, which were assessed by three terms in the fitted model: the intercept describes the mean values, the linear term captures the negative or positive slope of the curve over time, and the second-order quadratic term signifies degree of inflection in curve complexity, i.e., the depth of any peak or valley in the training curve over time. Differences in at least one of the three terms (intercept, linear, and quadratic) must be significant to indicate a reliable growth curve difference between the three shock conditions groups.
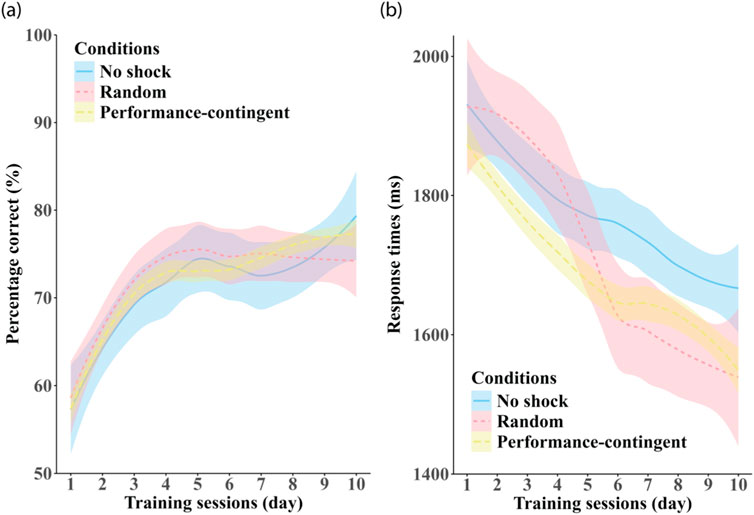
Figure 4. Effects of training session. Panel (a) shows on participant-averaged accuracy and panel (b) shows response times averaged across set-size in each of the three shock-conditions: no shock (blue), random shock (red) and performance-contingent shock (yellow). Shaded regions are between-subjects standard errors.
3.1 Training effects
Whether participants performed differently across training sessions was assessed by fitting linear mixed-effect models with shock condition and training session as fixed effects and set-size and participants as random effects. The Kenward-Roger degrees of freedom approximation (Kuznetsova et al., 2017) was used to calculate p values for the fixed-effect factors, and the ANOVA function from package car (Fox and Weisberg, 2018) was used to calculate F. Pairwise comparisons were conducted using the lsmeans package (Lenth, 2016) in R when necessary. Linear mixed-effect ANOVAs on our performance measures were undertaken using Type-II Wald F tests with Kenward-Roger degrees of freedom.
3.1.1 Accuracy
There was no main effect of shock condition on accuracy (F (2, 13) = 0.004, p = 0.996), suggesting that exposure to either random or performance-contingent shock did not influence overall accuracy.
A significant main effect of training session was observed (F (9, 754.02) = 54.639, p < 0.001), with participants showing improved accuracy over the 10-day training period. Post hoc comparisons indicated that these gains were driven by improvement after Day 1 (Day 1 vs. Days 2–10, all p < 0.001), with no significant changes between subsequent training days (all p-values > 0.05).
No interaction between training session and shock condition was found (F (18, 754.02) = 1.04, p = 0.343), suggesting that shock exposure did not modulate learning-based accuracy improvements.
3.1.2 Response times
Similarly, no main effect of shock condition was observed on RTs (F (2, 13) = 0.453, p = 0.646), and no between-group differences were detected on any testing day (all p > 0.05).
A significant main effect of training session was detected (F (9, 745.01) = 99.249, p < 0.001), with RTs decreasing across sessions. However, a significant interaction between shock condition and training session was also found (F (18, 745.01) = 5.181, p < 0.001). Despite this interaction, follow-up growth curve modeling revealed no significant differences in intercept, slope, or curvature across shock groups (all p > 0.05).
Contrasts examining within-group RT changes revealed that improvements occurred at different time points: performance-contingent shock participants showed gains from Day 3, no-shock participants from Day 4, and random shock participants from Day 5. Further improvements were observed late in training only in the performance-contingent and random shock groups. These patterns suggest differential timing in learning progression across shock conditions, with random shock potentially delaying early gains.
3.2 Set-size effects
3.2.1 Accuracy
Effects of set-size on accuracy are shown in Figure 5a. A robust main effect of set-size was observed (F(4, 755) = 484.951, p < 0.0001), with increasing set-size yielding lower accuracy. All pairwise comparisons between set-sizes showed significant differences (all p < 0.0001), except between set-sizes 3 and 4 (p = 0.006).
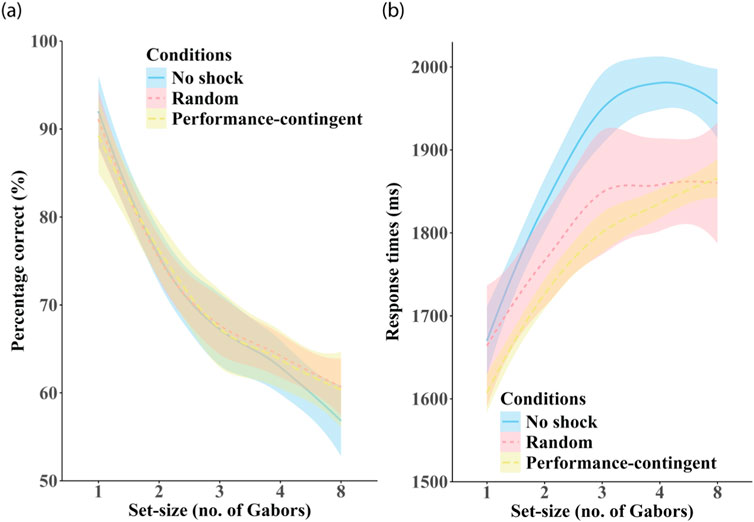
Figure 5. Effects of set-size. Panel (a) shows participant-averaged accuracy and panel (b) shows response times averaged across training session in each of the three shock-conditions: no shock (blue), random shock (red) and performance-contingent shock (yellow). Shaded regions are between-subjects standard errors.
A significant interaction between set-size and shock condition was found (F(8, 755) = 2.186, p = 0.026). However, no growth curve model differences were detected between shock groups (all p > 0.05). Within each group, performance declined with increasing set-size, though comparisons between set-sizes 3 and 4 were non-significant in all groups (all p > 0.05). No significant between-group accuracy differences were detected at any set-size (all p > 0.05).
3.2.2 Response times
Effects of set-size on response times are shown in Figure 5b. Response times increased significantly with set-size (F(4, 755) = 118.530, p < 0.0001). Planned contrasts showed significant increases for most comparisons, except those involving set-sizes 3, 4, and 8 (all p > 0.05), suggesting performance plateaued beyond set-size 3.
A significant interaction between set-size and shock condition was observed (F (8, 755) = 2.423, p = 0.013), but again no differences in model fit were found (all p > 0.05). Within-group contrasts showed generally increasing RTs with set-size, but differences were non-significant between specific sizes, especially beyond set-size 3. No between-group RT differences were found at any set-size (all p > 0.05).
3.3 Training × set-size interaction
Mixed-effects models revealed main effects of training session on both accuracy (F (9, 727.01) = 53.634, p < 0.0001) and RTs (F (9, 727.01) = 86.607, p < 0.0001). Set-size also produced significant main effects for both accuracy (F (4, 727.00) = 471.307, p < 0.0001) and RTs (F (4, 727.00) = 111.968, p < 0.0001).
No significant training × set-size interactions were found for accuracy (F (36, 727.00) = 0.660, p = 0.9441) or RTs (F (36, 727.00) = 0.125, p = 1.0), indicating that training improved performance uniformly across set-sizes.
3.4 Health-bar feedback
For the next series of analyses, we investigated whether performance feedback visible to participants via the ‘health bar’ (present throughout each training session) affected participant performance (see Methods for information on health bar performance feedback. Figure 6 shows the relationship between health-bar level (low (≤20%), medium (21%–80%) and high values (>80%)) on average accuracy and response times in each of the three group training conditions.
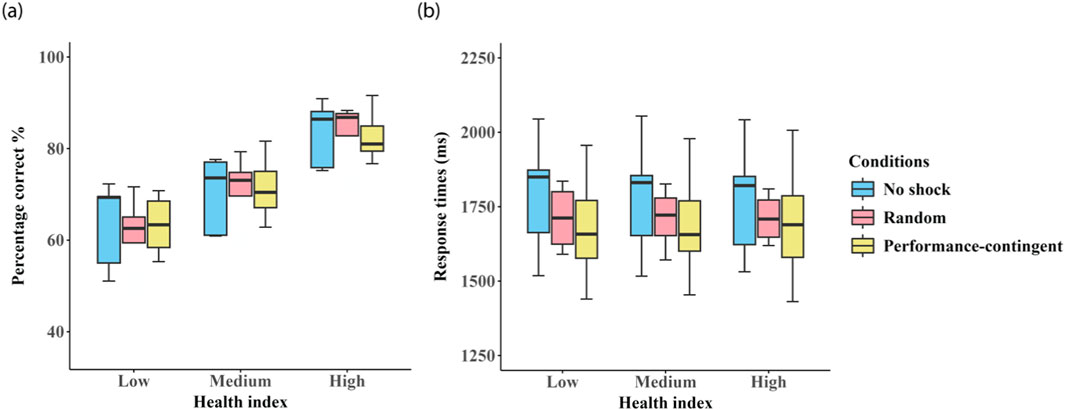
Figure 6. Effects of visual health-bar status. Box plots showing the effect of visual health-bar performance feedback (low (≤20%), medium (21%–80%) and high values (>80%)) on average accuracy are shown in panel (a) and response times in panel (b) in each of the three shock groups: no shock (blue), random shock (red), and performance-contingent shock (yellow). Error bars represent between subject standard errors.
Health-bar level had a significant main effect on accuracy (F (2, 922) = 497.380, p < 0.0001), with higher visual feedback levels corresponding to better performance. All pairwise comparisons were significant (all p < 0.0001).
No effect of health-bar level was observed on RTs (F (2, 922) = 0.310, p > 0.05). Shock condition did not significantly influence accuracy (F (2, 922) = 0.001, p > 0.05) or RTs (F (2, 922) = 0.475, p = 0.632), and no interactions were found between health-bar and shock condition (accuracy: F (2, 922) = 0.326, RTs: F (2, 922) = 0.299, both p > 0.05).
3.5 Response to shock delivery
The health-bar provides performance feedback to the participant, dropping 10% following each incorrect trial, and refreshing after each 10th incorrect trial. It is worth noting that the health bar status is predictive and consequential only for participants in the performance-contingent shock group who received a shock following nine previous errors. The health bar level is completely inconsequential (i.e., unpredictive of the of a shock stimulus) for participants in both the no-shock and random shock groups. To determine whether there exist additional effects of anticipating and/or receiving a physical shock, we conducted additional analyses evaluating the effects on performance (accuracy and response times) on the five trials immediately preceding and the five trials immediately succeeding a physical shock (Figure 7). Given that shock was only presented to participants in the random and performance-contingent shock conditions, participants in the no-shock condition were omitted from these analyses.
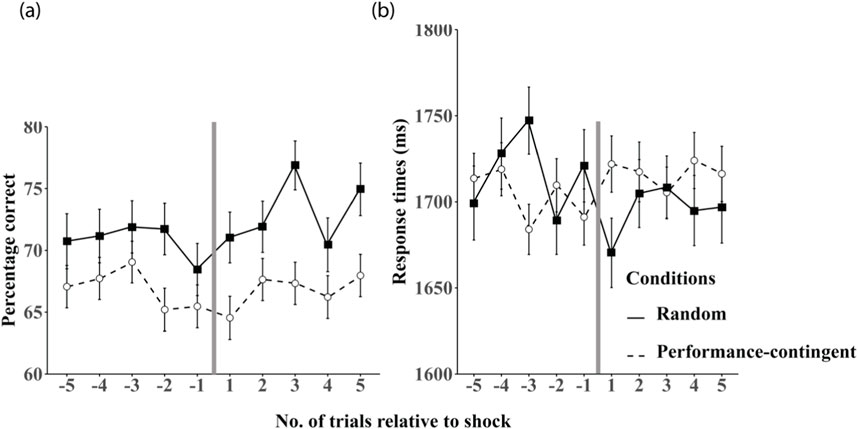
Figure 7. Performance relative to shock delivery. Mean accuracy on the five trials preceding and succeeding a shock stimulus are shown in panel (a) and mean response times are shown in panel (b) in the random (black squares) and performance-contingent (unfilled circles) shock training groups. The vertical grey line in each figure represents the point at which a shock stimulus was presented. Error bars are between-subjects standard errors.
Analyses of the five trials before and after shock events in random and performance-contingent groups revealed no main effects between these groups on accuracy or RTs (all p > 0.05). A significant interaction between trial number and shock condition was observed for RTs (F (4, 99) = 3.313, p = 0.016), but no pairwise comparisons survived Bonferroni correction (all p > 0.05).
3.6 State anxiety
Effects of pre-vs. post-session training and shock condition on subjective stress are shown in Figure 8. No main effects were found for shock condition (F (2, 12.99) = 0.186, p = 0.832) or training session (F (9, 245.01) = 0.326, p = 0.966) on state anxiety. A significant effect of test time (pre vs. post) was detected (F (1, 345.00) = 22.032, p = 0.0001), with post-training anxiety higher than pre-training.
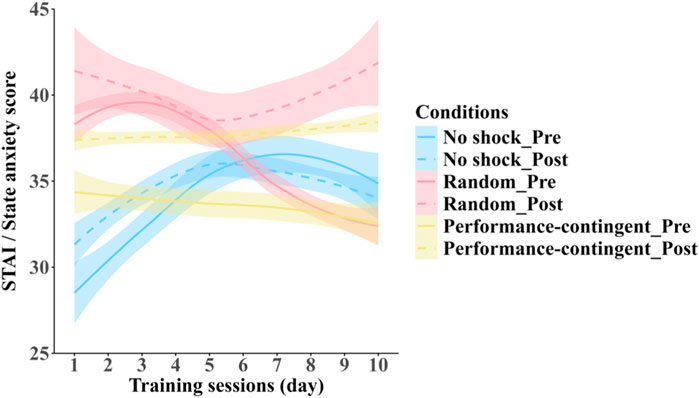
Figure 8. Self-reported anxiety before and after training across groups. Relationship between average STAI state anxiety subscale scores obtained across training sessions for each shock-condition training group: no shock (blue), random shock (red) and performance-contingent (yellow); measured immediately prior to (solid lines) and following (dashed lines) each training session. Shaded regions represent between-subject standard errors.
A significant interaction between time (pre vs. post) and shock condition was found (F (2, 245.00) = 3.359, p = 0.036). Post hoc analyses revealed no change in the no-shock group (p = 0.996), but significant post-training increases in anxiety for the performance-contingent (p < 0.001) and random shock conditions (p = 0.02).
4 Discussion
4.1 Summary of aims and key findings
This study addressed two key questions in perceptual learning. First, we investigated whether training enhances the human visual system’s capacity to integrate orientation information across the visual field. Second, we explored whether aversive electrodermal stimulation (used as acute stress or punishment) modulates perceptual learning in an orientation-averaging task implemented in virtual reality.
Our findings demonstrate (1) consistent performance degradation with increasing set-size, (2) significant training-related improvements in accuracy and response times, and (3) no evidence that training altered the slope of the set-size effect. These results suggest that training does not enhance early-stage sensory integration but likely operates at a post-integration or decisional stage. We also observed (4) no robust effects of shock condition on learning outcomes, and (5) an unexpected, systematic influence of visual performance feedback (“health bar”) on accuracy.
4.2 Visual integration and training effects
Whilst broadly consistent with prior work, we show for the first time that orientation-averaging performance degraded with larger set-sizes. This suggests that the visual system’s capacity for averaging orientation information across 2D space is fundamentally constrained. Whilst training led to significant gains in accuracy and response speed, there was with no interaction between training and set-size, implying that the quantity of integrated information did not increase. These gains, therefore, are likely to arise at decision-related stages—possibly by increasing the signal-to-noise ratio during integration or decision execution (Dakin et al., 2009; Moerel et al., 2016).
Our task design departed from prior orientation-averaging studies in several important respects, particularly in how local Gabor orientations were sampled on each trial. While previous studies typically draw orientations randomly from Gaussian distributions with a defined mean and standard deviation (e.g. (Moerel et al., 2016; Dakin et al., 2009)), we used a deterministic method to fix the global mean orientation across trials. Specifically, we first sampled all but one Gabor from a Gaussian distribution and then adjusted the final Gabor’s orientation to ensure that the mean orientation of the array exactly matched a predefined target (e.g., ±5° from vertical). This approach eliminated trial-by-trial variability in global mean orientation that can arise in probabilistic sampling schemes.
However, one potential drawback of our method is that it may have encouraged participants to adopt a “max-rule” strategy—relying on the most tilted element in the array rather than computing a true average. Such a strategy would introduce substantial variability in responses and lead to a higher rate of incorrect choices. If participants relied on this approach, at least on a subset of trials, task performance may have been supported in part by relational visual search mechanisms (e.g. (Becker et al., 2025)), rather than global ensemble processing. Future work could address this limitation by drawing stimulus sets from a large library of pre-generated Gaussian samples with fixed means and variances, which would preserve statistical consistency across trials without encouraging max-rule heuristics.
4.3 Crowding, eye movements, and generalisability
While visual crowding can impair averaging by reducing access to local features, we argue that crowding is unlikely to account for our set-size effects. First, the inter-Gabor spacing in our design exceeded Bouma’s limit for crowding interference (Kurzawski et al., 2023; Van der Burg et al., 2024; Bouma, 1970). Second, participants were free to move their eyes, which reduces crowding by maintaining central fixation and reducing retinal eccentricity. Nonetheless, because eye movement patterns were not monitored, comparisons with fixed-eccentricity paradigms should be interpreted with caution as the distinction between early and late selection frameworks typically hinges on whether orientation averaging depends on retinotopically local filters—such as V1 neurons—which are spatially specific and sensitive to gaze position. In our task, Gabor elements were visible for extended durations, allowing participants to freely move their eyes. This limits our ability to isolate the contribution of early, retinotopically specific encoding mechanisms, as participants may have used saccades to serially sample the array. That said, it is nonetheless noteworthy that performance consistently declined with increasing set-size, suggesting that averaging was at least partially capacity-limited despite the opportunity for foveal sampling. Future studies should address this issue by using brief stimulus presentations (<200 m) to ensure that saccades are not utilised during encoding. In addition, gaze-contingent presentation could be employed to fix the eccentricity of the Gabor elements relative to gaze, enabling more direct assessment of peripheral ensemble processing. Finally, integrating eye-tracking measures would allow quantification of oculomotor strategies and their impact on orientation averaging.
4.4 Role of attention in perceptual learning
Although perceptual learning can improve orientation discrimination through early-stage enhancements (Matthews et al., 1999; Zhang et al., 2010), our task introduced random variation in both Gabor location and orientation across trials. Such variation likely prevented low-level learning. Prior work shows that perceptual learning generalises across location and orientation when exogenous attentional cues are present (Donovan et al., 2020). In line with this, we propose that learning in our task reflects enhancements in attentional efficiency at a post-integration or decisional stage—rather than early-stage sensory encoding.
4.5 Shock, stress, and perceptual learning
Contrary to predictions, we observed no main effect of shock condition on task accuracy or learning rate. However, a shock condition × session interaction was observed for response times, with participants in the performance-contingent shock condition improving faster than those in no-shock or random-shock groups. This may reflect increased urgency or motivation to avoid aversive outcomes.
Temporal patterns differed across groups: performance-contingent shock yielded improvements by Day 3, while other conditions lagged by 1–2 days. These differences suggest subtle effects of punishment contingency on response preparation or motivational state, although not robust enough to affect accuracy.
Self-reported anxiety, as measured by the STAI, was elevated post-training in shock conditions, particularly in the performance-contingent group. Yet, no correlation was found between anxiety scores and behavioural performance. This suggests that STAI may lack sensitivity to trial-level changes or that anxiety’s influence is indirect. Future studies should incorporate objective physiological stress markers (e.g., salivary cortisol (Hellhammer et al., 2009), pupillometry (Ginton et al., 2022)) to clarify these relationships.
4.6 Unexpected role of visual feedback
A key and unexpected finding was that orientation-averaging accuracy varied systematically with health-bar status—even in conditions where the health bar had no consequences (no-shock, random-shock). Higher displayed “health” predicted better accuracy, regardless of shock contingency. This effect was not accompanied by changes in response times, ruling out a speed-accuracy trade-off.
We propose that the health bar acted as a motivational or attentional cue. Visual feedback has been shown to enhance perceptual learning by directing attention and reinforcing effort (Seitz and Watanabe, 2003; Posner, 1980; Ahissar and Hochstein, 1993). In our task, the health bar may have operated as an implicit performance incentive, encouraging attentional persistence and error avoidance. This aligns with prior findings showing that feedback—even when decoupled from consequence—can shape perceptual strategies (Blank et al., 2013; Eisma et al., 2021; Choi and Watanabe, 2012). While some studies dispute the necessity of feedback for learning (Asher and Hibbard, 2020), our findings suggest that continuous visual feedback can enhance perceptual accuracy independently of external reinforcement.
Time-course analyses further support this view: performance was not different immediately before or after shock events, ruling out the possibility that shock anticipation alone explains the health bar effect.
4.7 Limitations and future directions
While the present study offers novel insights into perceptual learning and the effects of aversive stimulation within a VR environment, several limitations should be acknowledged.
First, although our findings suggest that training-related gains occur at a post-integration stage, the possibility that eye movements may have contributed to orientation averaging performance limits our ability to draw definitive conclusions about early-stage mechanisms. Because Gabor arrays were visible until response and no gaze-contingent control was implemented, participants were free to foveate individual elements. Future studies should adopt brief (<200 m) stimulus presentation times and/or gaze-contingent displays to ensure that ensemble averaging relies on peripheral processing and to isolate the contributions of early, retinotopically specific filters.
Second, the lack of objective physiological markers of arousal limits interpretation of the observed elevation in STAI-measured anxiety following shock exposure. While the STAI is widely used, it may not capture transient fluctuations in arousal that occur on a trial-by-trial basis. Incorporating direct physiological metrics such as salivary cortisol, galvanic skin response, or pupillometry would enable more precise characterization of stress responses and their relationship to perceptual performance.
Third, while our findings suggest that the health bar acts as a visual feedback signal that improves performance, we did not include a condition in which the health bar was absent. As such, although the statistical association between health bar magnitude and accuracy was robust—even in conditions where it had no consequences—causal inferences are constrained. Future research should include a no-health-bar control condition and manipulate the timing, visibility, or relevance of feedback to better understand its role in attentional persistence and performance modulation.
Finally, although our immersive VR platform enabled a more engaging and ecologically valid testing environment, it also introduced some variability in response timing and user interaction. Comparing outcomes from VR-based tasks with those obtained from conventional 2D psychophysics paradigms would help assess the generalisability of results across modalities and help establish VR as a reliable platform for vision science.
Taken together, these limitations suggest several promising directions for future work. Larger sample sizes, objective arousal measures, constrained visual exposure, and systematic feedback manipulation will be key to refining our understanding of the interplay between motivation, stress, and perceptual learning.
5 Conclusion
This study investigated how perceptual learning in a visual averaging task unfolds over time and under varying levels of aversive electrodermal stimulation in an immersive VR environment. We found that while training led to clear improvements in accuracy and response time, these gains did not interact with set-size, suggesting that learning likely occurred at a post-integration or decisional stage rather than through enhancements in early-stage sensory processing.
Contrary to expectations, shock-based stimulation—whether performance-contingent or random—had limited impact on task accuracy, although the performance-contingent shock condition did yield faster improvements in response time. Self-reported anxiety increased in shock groups, but this did not correlate with performance outcomes.
A key and unanticipated finding was that visual feedback, in the form of a health bar, strongly predicted accuracy—even in conditions where it carried no external consequences. This suggests that persistent visual feedback may serve as an implicit motivator or attentional cue, influencing perceptual performance independently of reinforcement.
Taken together, our findings highlight the role of attentional and motivational mechanisms in perceptual learning and demonstrate that immersive VR platforms can be used to systematically investigate these processes. Future studies should include objective physiological measures, remove or manipulate feedback mechanisms, and compare immersive versus traditional platforms to further distinguish the factors that shape learning in across visual presentation environments.
Data availability statement
The original contributions presented in the study are included in the article/supplementary material, further inquiries can be directed to the corresponding author.
Ethics statement
The studies involving humans were approved by Western Sydney University Human Research Ethics Committee. The studies were conducted in accordance with the local legislation and institutional requirements. The participants provided their written informed consent to participate in this study. Written informed consent was obtained from the individual(s) for the publication of any potentially identifiable images or data included in this article.
Author contributions
JC: Investigation, Writing – original draft, Conceptualization, Resources, Project administration, Formal Analysis, Supervision, Funding acquisition, Writing – review and editing, Methodology, Validation. WHF: Methodology, Writing – review and editing, Writing – original draft. YL: Visualization, Formal Analysis, Writing – original draft, Writing – review and editing. LC: Conceptualization, Writing – review and editing, Funding acquisition. GW: Supervision, Methodology, Writing – original draft, Investigation, Funding acquisition, Project administration, Writing – review and editing.
Funding
The author(s) declare that financial support was received for the research and/or publication of this article. This project was funded by a Human Performance Research Project (ID9104), funded by DSTG, awarded to JC and GW.
Conflict of interest
The authors declare that the research was conducted in the absence of any commercial or financial relationships that could be construed as a potential conflict of interest.
Generative AI statement
The author(s) declare that no Generative AI was used in the creation of this manuscript.
Any alternative text (alt text) provided alongside figures in this article has been generated by Frontiers with the support of artificial intelligence and reasonable efforts have been made to ensure accuracy, including review by the authors wherever possible. If you identify any issues, please contact us.
Publisher’s note
All claims expressed in this article are solely those of the authors and do not necessarily represent those of their affiliated organizations, or those of the publisher, the editors and the reviewers. Any product that may be evaluated in this article, or claim that may be made by its manufacturer, is not guaranteed or endorsed by the publisher.
References
Ahissar, M., and Hochstein, S. (1993). Attentional control of early perceptual learning. Proc. Natl. Acad. Sci. U. S. A. 90, 5718–5722. doi:10.1073/pnas.90.12.5718
Arnsten, A. F. (2009). Stress signalling pathways that impair prefrontal cortex structure and function. Nat. Rev. Neurosci. 10, 410–422. doi:10.1038/nrn2648
Asher, J. M., and Hibbard, P. B. (2020). No effect of feedback, level of processing or stimulus presentation protocol on perceptual learning when easy and difficult trials are interleaved. Vis. Res. 176, 100–117. doi:10.1016/j.visres.2020.07.011
Becker, S. I., Hamblin-Frohman, Z., and Amarasekera, K. D. R. (2025). Visual search is relational without prior context learning. Cognition 260, 106132. doi:10.1016/j.cognition.2025.106132
Blakemore, C., and Nachmias, J. (1971). The orientation specificity of two visual after-effects. J. Physiol. 213, 157–174. doi:10.1113/jphysiol.1971.sp009374
Blank, H., Biele, G., Heekeren, H. R., and Philiastides, M. G. (2013). Temporal characteristics of the influence of punishment on perceptual decision making in the human brain. J. Neurosci. 33, 3939–3952. doi:10.1523/jneurosci.4151-12.2013
Bouma, H. (1970). Interaction effects in parafoveal letter recognition. Nature 226, 177–178. doi:10.1038/226177a0
Carrasco, M., and Frieder, K. S. (1997). Cortical magnification neutralizes the eccentricity effect in visual search. Vis. Res. 37, 63–82. doi:10.1016/s0042-6989(96)00102-2
Carrasco, M., Evert, D. L., Chang, I., and Katz, S. M. (1995). The eccentricity effect: target eccentricity affects performance on conjunction searches. Percept. Psychophys. 57, 1241–1261. doi:10.3758/bf03208380
Choi, H., and Watanabe, T. (2012). Perceptual learning solely induced by feedback. Vis. Res. 61, 77–82. doi:10.1016/j.visres.2012.01.006
Dakin, S. C., Bex, P. J., Cass, J. R., and Watt, R. J. (2009). Dissociable effects of attention and crowding on orientation averaging. J. Vis. 9, 28. doi:10.1167/9.11.28
DE Voogd, L. D., Hagenberg, E., Zhou, Y. J., DE Lange, F. P., and Roelofs, K. (2022). Acute threat enhances perceptual sensitivity without affecting the decision criterion. Sci. Rep. 12, 9071. doi:10.1038/s41598-022-11664-0
Dinse, H. R., Kattenstroth, J. C., Lenz, M., Tegenthoff, M., and Wolf, O. T. (2017). The stress hormone cortisol blocks perceptual learning in humans. Psychoneuroendocrinology 77, 63–67. doi:10.1016/j.psyneuen.2016.12.002
Donovan, I., and Carrasco, M. (2018). Endogenous spatial attention during perceptual learning facilitates location transfer. J. Vis. 18, 7. doi:10.1167/18.11.7
Donovan, I., Shen, A., Tortarolo, C., Barbot, A., and Carrasco, M. (2020). Exogenous attention facilitates perceptual learning in visual acuity to untrained stimulus locations and features. J. Vis. 20, 18. doi:10.1167/jov.20.4.18
Ebersole, A. (2016). “Stress as a Moderator of visual perception: do elevated stress levels Interfere with visual cognition?. Master thesis. Booth Library, Eastern Illinois University. 2439. Available online at: https://thekeep.eiu.edu/theses/2439.
Eisma, Y. B., Borst, C., Paassen, R. V., and Winter, J. (2021). Augmented visual feedback: cure or distraction? Hum. Factors 63, 1156–1168. doi:10.1177/0018720820924602
Erickson, J. R. (1970). Effects of punishment for errors on discrimination learning by humans. J. Exp. Psychol. 83, 112–119. doi:10.1037/h0028521
Fox, J., and Weisberg, S. (2018). An R companion to applied regression. Thousand Oaks, CA, United States: SAGE Publications, Inc.
Gilbert, C., Ito, M., Kapadia, M., and Westheimer, G. (2000). Interactions between attention, context and learning in primary visual cortex. Vis. Res. 40, 1217–1226. doi:10.1016/s0042-6989(99)00234-5
Ginton, L. M., Vuong, E., Lake, M. T., Nhapi, R. T., Zar, H. J., Yrttiaho, S., et al. (2022). Investigating pupillometry to detect emotional regulation difficulties in post-traumatic stress disorder. World J. Biol. Psychiatry 23, 127–135. doi:10.1080/15622975.2021.1935316
Goldstone, R. L. (1998). Perceptual learning. Annu. Rev. Psychol. 49, 585–612. doi:10.1146/annurev.psych.49.1.585
He, S., Cavanagh, P., and Intriligator, J. (1996). Attentional resolution and the locus of visual awareness. Nature 383, 334–337. doi:10.1038/383334a0
Heinemann, E. G., and Marill, T. (1954). Tilt adaptation and figural after-effect. J. Exp. Psychol. 48, 468–472. doi:10.1037/h0061512
Hellhammer, D. H., Wust, S., and Kudielka, B. M. (2009). Salivary cortisol as a biomarker in stress research. Psychoneuroendocrinology 34, 163–171. doi:10.1016/j.psyneuen.2008.10.026
Herman, J. P., Mcklveen, J. M., Ghosal, S., Kopp, B., Wulsin, A., Makinson, R., et al. (2016). Regulation of the hypothalamic-pituitary-adrenocortical stress response. Compr. Physiol. 6, 603–621. doi:10.1002/j.2040-4603.2016.tb00694.x
Jones, P. D., and Holding, D. H. (1975). Extremely long-term persistence of the McCollough effect. J. Exp. Psychol. Hum. Percept. Perform. 1, 323–327. doi:10.1037//0096-1523.1.4.323
Kurzawski, J. W., Burchell, A., Thapa, D., Winawer, J., Majaj, N. J., and Pelli, D. G. (2023). The Bouma law accounts for crowding in 50 observers. J. Vis. 23, 6. doi:10.1167/jov.23.8.6
Kuznetsova, A., Brockhoff, P. B., and Christensen, R. H. B. (2017). lmerTest package: tests in linear mixed effects models. J. Stat. Softw. 82, 1–26. doi:10.18637/jss.v082.i13
Lawrence, D. H. (1949). Acquired distinctiveness of cues: I. Transfer between discriminations on the basis of familiarity with the stimulus. J. Exp. Psychol. 39, 770–784. doi:10.1037/h0058097
Lenth, R. V. (2016). Least-squares means: the R package lsmeans. J. Stat. Softw. 69, 1–33. doi:10.18637/jss.v069.i01
Li, W., Howard, J. D., Parrish, T. B., and Gottfried, J. A. (2008). Aversive learning enhances perceptual and cortical discrimination of indiscriminable odor cues. Science 319, 1842–1845. doi:10.1126/science.1152837
Matthews, N., Liu, Z., Geesaman, B. J., and Qian, N. (1999). Perceptual learning on orientation and direction discrimination. Vis. Res. 39, 3692–3701. doi:10.1016/s0042-6989(99)00069-3
Mirman, D. (2014). Growth curve analysis and visualization using R. Boca Raton, FL, United States: CRC Press.
Moerel, D., Ling, S., and Jehee, J. F. (2016). Perceptual learning increases orientation sampling efficiency. J. Vis. 16, 36. doi:10.1167/16.3.36
Polat, U., and Sagi, D. (1994). The architecture of perceptual spatial interactions. Vis. Res. 34, 73–78. doi:10.1016/0042-6989(94)90258-5
Posner, M. I. (1980). Orienting of attention. Q. J. Exp. Psychol. 32, 3–25. doi:10.1080/00335558008248231
Prettyman, A. (2019). Perceptual learning. Wiley Interdiscip. Rev. Cogn. Sci. 10, e1489. doi:10.1002/wcs.1489
Resnik, J., Sobel, N., and Paz, R. (2011). Auditory aversive learning increases discrimination thresholds. Nat. Neurosci. 14, 791–796. doi:10.1038/nn.2802
Rhodes, L. J., Ruiz, A., Rios, M., Nguyen, T., and Miskovic, V. (2018). Differential aversive learning enhances orientation discrimination. Cogn. Emot. 32, 885–891. doi:10.1080/02699931.2017.1347084
Rideaux, R., West, R. K., Rangelov, D., and Mattingley, J. B. (2023). Distinct early and late neural mechanisms regulate feature-specific sensory adaptation in the human visual system. Proc. Natl. Acad. Sci. U. S. A. 120, e2216192120. doi:10.1073/pnas.2216192120
Sanger, J., Bechtold, L., Schoofs, D., Blaszkewicz, M., and Wascher, E. (2014). The influence of acute stress on attention mechanisms and its electrophysiological correlates. Front. Behav. Neurosci. 8, 353. doi:10.3389/fnbeh.2014.00353
Sawaki, R., Luck, S. J., and Raymond, J. E. (2015). How attention changes in response to incentives. J. Cognitive Neurosci. 27, 2229–2239. doi:10.1162/jocn_a_00847
Seitz, A. R., and Watanabe, T. (2003). Psychophysics: is subliminal learning really passive? Nature 422, 36. doi:10.1038/422036a
Shalev, L., Paz, R., and Avidan, G. (2018). Visual aversive learning compromises sensory discrimination. J. Neurosci. 38, 2766–2779. doi:10.1523/jneurosci.0889-17.2017
Spielberger, C. D., Gorsuch, R. L., Lushene, R., Vagg, P. R., and Jacobs, G. A. (1983). Manual for the state-trait anxiety inventory. Palo Alto, CA: Consulting Psychologists Press.
Stegmann, Y., Andreatta, M., Pauli, P., and Wieser, M. J. (2021). Associative learning shapes visual discrimination in a web-based classical conditioning task. Sci. Rep. 11, 15762. doi:10.1038/s41598-021-95200-6
Van Der Burg, E., Cass, J., and Olivers, C. N. L. (2024). A CODE model bridging crowding in sparse and dense displays. Vis. Res. 215, 108345. doi:10.1016/j.visres.2023.108345
Watson, P., Pearson, D., Reinout, W. W., and Le Pelley, M. (2019). Prioritizing pleasure and pain: attentional capture by reward-related and punishment-related stimuli. Curr. Opin. Behav. Sci. 26, 107–113. doi:10.1016/j.cobeha.2018.12.002
Whitney, D., and Yamanashi Leib, A. (2018). Ensemble perception. Annu. Rev. Psychol. 69, 105–129. doi:10.1146/annurev-psych-010416-044232
Yehezkel, O., Sterkin, A., Lev, M., and Polat, U. (2015). Training on spatiotemporal masking improves crowded and uncrowded visual acuity. J. Vis. 15, 12. doi:10.1167/15.6.12
Zhang, T., Xiao, L. Q., Klein, S. A., Levi, D. M., and Yu, C. (2010). Decoupling location specificity from perceptual learning of orientation discrimination. Vis. Res. 50, 368–374. doi:10.1016/j.visres.2009.08.024
Zhang, Y., Valsecchi, M., Gegenfurtner, K. R., and Chen, J. (2023). The time course of chromatic adaptation in human early visual cortex revealed by SSVEPs. J. Vis. 23, 17. doi:10.1167/jov.23.5.17
Keywords: visual perception, stress, ensemble processing, visual capacity, psychophysics, orientation processing, first-person shooter (FPS)
Citation: Cass J, Fu WH, Li Y, Cahill L and Weidemann G (2025) Effects of stress on perceptual learning in a virtual reality environment. Front. Virtual Real. 6:1623584. doi: 10.3389/frvir.2025.1623584
Received: 06 May 2025; Accepted: 26 August 2025;
Published: 23 September 2025.
Edited by:
Brian Klebig, Bethany Lutheran College, United StatesReviewed by:
Hui Chen, Chinese Academy of Sciences (CAS), ChinaYing Yang, Monash University, Australia
Copyright © 2025 Cass, Fu, Li, Cahill and Weidemann. This is an open-access article distributed under the terms of the Creative Commons Attribution License (CC BY). The use, distribution or reproduction in other forums is permitted, provided the original author(s) and the copyright owner(s) are credited and that the original publication in this journal is cited, in accordance with accepted academic practice. No use, distribution or reproduction is permitted which does not comply with these terms.
*Correspondence: John Cass, ai5jYXNzQHdlc3Rlcm5zeWRuZXkuZWR1LmF1