 Qiyun Lu
 Peng Han*
- 1School of Art and Design, Beijing Forestry University, Beijing, China
This study investigates the critical role of public information in conveying protective guidance during earthquakes, a significant and sudden natural disaster threatening human life and property. Utilizing virtual imitation experiments to simulate earthquake scenarios, we established an experimental group and a control group to assess the impact of indoor Earthquake Early Warning (EEW) on individuals’ hedging behavior. Our findings indicate that the experimental group, which received protective guidance, demonstrated higher accuracy in selecting avoidance areas and required less time compared to the control group, suggesting that protective guidance significantly enhances the correctness and efficiency of earthquake evacuation. Additionally, value functions, weight functions, and prospect values were compared, revealing that the experimental group’s average prospect value was substantially higher, underscoring the necessity for incorporating specific earthquake guidelines in the content of earthquake early warnings. These conclusions offer valuable insights for optimizing earthquake warning system design and enhancing indoor environmental emergency self-rescue and information guidance in residential settings.
1 Introduction
Earthquakes, as a type of sudden and highly destructive natural disaster, pose a significant threat to human life and property. During an earthquake, public emergency responses are often influenced by panic and confusion, leading to inefficient or incorrect evacuation behaviors (Takagi and Wada, 2019) For example, during the 2011 Great East Japan Earthquake, many individuals failed to take timely and effective evacuation measures after receiving earthquake early warnings, which resulted in unnecessary casualties (Ahn et al., 2021). This highlights the critical issue of how to quickly and accurately convey evacuation information to the public during an earthquake, a challenge that remains unresolved in current earthquake early warning systems (Uchida and Bürgmann, 2021).
With the development of earthquake early warning technologies, earthquake early warnings have emerged as a key interface element that rapidly attracts public attention. These notifications play an essential role in the communication of earthquake early warning information (Allen and Melgar, 2019). However, the design and method of delivering earthquake early warning information are crucial for ensuring effective emergency responses from the public (Velazquez et al., 2020). He (2023) evaluated the effectiveness of earthquake early warning information in China using immersive virtual reality (IVR) technology, analyzing its usability from functional, cognitive, sensory, and emotional perspectives (He et al., 2023). The study found that, while earthquake early warning information provides important parameters (such as magnitude, epicenter, and countdown), current designs fall short in guiding the public to take effective evacuation actions. Based on this, the present study aims to explore the optimization of earthquake early warning information, particularly in indoor environments. It focuses on how earthquake early warning information can guide the public to quickly and accurately select evacuation zones, incorporating Prospect Theory to quantitatively analyze the impact of earthquake early warning information on evacuation behavior. This approach seeks to provide scientific evidence to enhance the design of earthquake early warning systems.
The core question of this study is: Can earthquake early warning information effectively improve the accuracy and efficiency of evacuation behaviors during an earthquake? To address this question, this research uses virtual simulation experiments to construct simulated earthquake scenarios (Feng et al., 2020), investigating the impact of indoor earthquake early warning information on individuals’ evacuation behaviors. The study examines how earthquake early warning information affects the accuracy and speed with which users select safe evacuation zones, ultimately providing scientific support for the optimization of earthquake early warning system designs.
Figure 1 presents the research framework. The structure of the paper is as follows: Section 1 introduces the background of the study, emphasizing the significant threat posed by earthquakes to human life and property, and the importance of rapidly and accurately communicating evacuation information, with a special focus on the role of earthquake early warning information. Section 2 provides a literature review, summarizing current research on emergency responses to natural disasters and virtual reality (VR) technology, laying a solid theoretical foundation for the subsequent experimental design. Section 3 details the research methodology, discussing the application of Prospect Theory, which models the effects of earthquake early warning information on evacuation behavior through value and weight functions. Section 4 describes the experimental design, including the construction of the virtual environment, the selection of experimental scenarios, and functional settings. Section 5 presents the experimental results and data analysis, utilizing SPSSAU and Matlab software to provide an in-depth analysis of the results, including questionnaire responses, normality tests for evacuation area choices, and an analysis based on Prospect Theory. Section 6 discusses the research findings, exploring effective earthquake evacuation strategies, summarizing the study’s innovations and limitations, and proposing directions for future research. Section 7 concludes the paper, summarizing key findings and emphasizing the importance of optimizing earthquake early warning information designs to improve evacuation efficiency during real earthquakes, while also addressing the study’s limitations and suggesting future research directions.
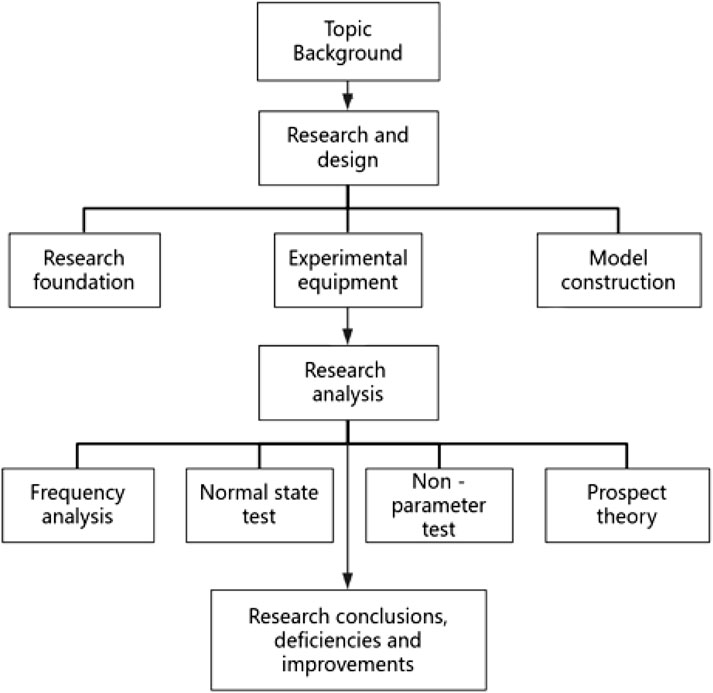
Figure 1. Research framework.
2 Literature review
When an earthquake occurs unexpectedly, the public’s initial response is often marked by panic and confusion, which significantly impacts the efficiency of individuals in seeking safe avoidance areas. For instance, Papatheodoro and Theodoulidis (2023) analyzed the effectiveness of different types of informational guidance in improving public emergency response capabilities through simulation experiments and surveys (Papatheodorou et al., 2023). Bernardini, Quagliarini, and D’Orazio (2018) proposed an innovative database for earthquake evacuation models, which used video recordings of real events to provide human behavior and movement data, offering new tools for developing and validating evacuation models (Bernardini et al., 2018). Their research emphasized the importance of understanding and quantifying human behavior and decision-making motivations in emergencies, which is critical for the development of emergency management and planning tools. Mahmud et al., (2024) introduced the ATR HarmoniSAR system, which enhances the detection of disaster victims in robot-assisted disaster scenarios by generating synthetic images of the victims (Mahmud et al., 2024).
Some studies further explore the role of information design in earthquake emergency responses. Weinstein (2000) found that the nature, recency, and severity of an individual’s experience significantly influence their judgment of the likelihood and severity of potential disasters, as well as their emotional reactions (Weinstein et al., 2000). These findings suggest that the design of earthquake early warning information must take into account the impact of personal experience and cultural background. For instance, after the 2010 Chile earthquake, residents who had previously experienced earthquakes were more likely to take proactive evacuation measures after receiving the warning (Catalan et al., 2020). Moreover, during earthquakes, effective user location technologies are crucial for rescue operations (Lv et al., 2018). Alnoman et al., (2024) introduced the latest applications of AI and 6G technology in emergency and disaster scenarios, significantly improving rescue efficiency and effectiveness (Alnoman et al., 2024).
Cross-cultural studies have revealed differences in the public’s acceptance and response to earthquake early warning information across different cultural backgrounds. In earthquake-prone countries like Japan, the public’s response to earthquake information is generally quicker and more accurate, which may be due to long-standing earthquake education and training (Paton et al., 2010). These studies suggest that cultural factors significantly affect the design and effectiveness of informational guidance. Therefore, it is essential to design earthquake early warning systems that are adaptable to local cultures and habits. For example, New Zealand’s earthquake early warning system was designed with consideration for the cultural characteristics and language preferences of the Māori people, improving the accessibility and effectiveness of the information (Jang et al., 2015).
The effectiveness of earthquake early warning systems is crucial for reducing casualties and property damage caused by earthquakes. Noprisson (2021) conducted a systematic review of earthquake early warning systems in various countries, analyzing their system architectures, data modeling, and user interface designs (Noprisson, 2021). The study pointed out that the interface design of earthquake early warning systems needs to be simple and intuitive to ensure that users can quickly understand the earthquake early warning information and take evacuation action. For example, the design of Mexico City’s earthquake early warning system emphasized the simplicity and readability of the information to ensure that it could be quickly communicated to the public during emergencies (Santos-Reyes, 2019).
In the field of earthquake and visual imagery research, Huang (2023) compared remote sensing images with different resolutions to analyze their impact on detecting landslides triggered by earthquakes. Their research found that higher image resolution improved the accuracy of landslide detection (Huang et al., 2023). Colombelli (2020) focused on mobile application design, introducing a web-based mobile app that could receive and process earthquake information in real time, providing users with intuitive guidance on taking appropriate evacuation measures (Colombelli et al., 2020). The study demonstrated that map features, epicenter locations, and countdown functions in the app’s interface effectively guided users’ responses, especially during earthquake alerts, through clear graphical and textual indications.
This study makes two primary contributions: First, it applies Prospect Theory to earthquake early warning (EEW) research, providing a new theoretical framework and analytical approach for future EEW studies. Previous research (e.g., He et al., 2023) primarily employed the Affordance Perspective to analyze functional and cognitive dimensions of warning information, lacking quantitative analysis of individual risk decision-making psychological mechanisms (He et al., 2023). Prospect Theory, through value functions and weighting functions, has for the first time achieved mathematical modeling of participants’ shelter selection behavior, revealing how “loss aversion” and “probability perception bias” influence earthquake emergency decision-making. Second, it specifically focuses on the concrete value of textual protective guidance, validating through virtual simulation experiments its effectiveness in improving shelter selection accuracy, thereby providing empirical evidence for EEW information optimization. Previous studies only examined the overall effects of EEW information (such as countdown timers and magnitude displays), while this study demonstrates that adding textual guidance breaks through the generalized analysis of information integrity in traditional EEW research, offering specific directions for optimizing information content design.
3 Research methodology
3.1 Prospect theory
In scientific research, methodology refers not only to the collection of specific research methods but also to the theoretical framework that guides the design and implementation of the study. This research adopts Prospect Theory as its theoretical foundation and combines it with virtual simulation experiments to investigate the impact of earthquake early warning information on public evacuation behavior in response to earthquakes. Prospect Theory, proposed by Kahneman and Tversky (1979), is used to explain human decision-making behavior under conditions of risk and uncertainty (Kahneman and Tversky, 1979). The core of this theory lies in revealing how individuals balance potential gains and losses, and how they make decisions under different event probabilities.
Prospect Theory consists of two key components: the value function and the weight function. The value function measures the psychological value individuals assign to outcomes, while the weight function adjusts their subjective perception of probabilities (Levy, 1992). These two functions allow Prospect Theory to quantify and analyze individual decision-making processes in risky situations (Prietzel, 2019). Prospect Theory challenges the rational decision-making models assumed by traditional economic theories, such as expected utility theory (Levy, 1997), and provides a new perspective on understanding human decision-making behavior in uncertain and risky situations. These insights are crucial for analyzing people’s evacuation decisions when exposed to earthquake early warning information.
A central concept in Prospect Theory is reference point dependence (Schwartz et al., 2008). When individuals assess decision outcomes, they do so relative to a reference point, rather than in absolute terms. This reference point is influenced by various factors such as current asset levels, personal expectations, and previous experiences (Meng and Weng, 2018). In the context of earthquakes, individuals’ perception of their safety forms a reference point, which plays a key role in how they interpret earthquake early warning information and make evacuation decisions (Chou et al., 2021). For instance, individuals living in areas with low earthquake risks may have a lower reference point for earthquake risk. As a result, they may perceive the risk as less urgent upon receiving an earthquake early warning, which may affect their evacuation decisions. Conversely, individuals living in high-risk areas may have a higher reference point, which may lead them to respond more actively to the warning and take evacuation measures.
The value function is an important part of Prospect Theory and has distinct characteristics. As shown in Figure 2, it typically exhibits an S-shape. In the domain of gains, it is concave, meaning that individuals are risk-averse. As gains increase, the psychological value derived from each additional unit of gain decreases, reflecting diminished sensitivity to further increases in gains. In the domain of losses, the value function is convex, indicating that individuals tend to exhibit risk-seeking behavior, where the psychological pain from each additional unit of loss decreases as losses increase. Furthermore, the value function is steeper in the loss domain than in the gain domain, illustrating loss aversion—individuals are more sensitive to losses than to equivalent gains (Kahneman and Tversky, 1979). For example, in earthquake evacuation decisions, individuals are more focused on avoiding losses, such as injury or threats to life, than on relatively small gains, such as saving minor property. This is because, according to the value function, the psychological impact of a loss far outweighs the satisfaction derived from an equivalent gain (Loewenstein et al., 2001).
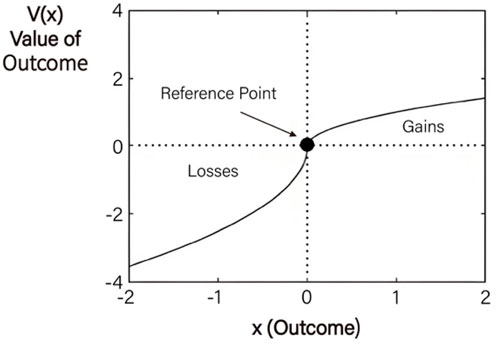
Figure 2. Graphical representation of the value function.
The probability weighting function in Prospect Theory measures the impact of event probabilities on the attractiveness of a prospect. As shown in Figure 3, this function exhibits nonlinear characteristics. Decision weights differ from objective probabilities, and individuals often overestimate the likelihood of low-probability events, assigning them higher decision weights, while underestimating high-probability events, resulting in lower decision weights. This characteristic leads to subcertainty, where the sum of decision weights is often less than 1. This bias makes it difficult for individuals to make fully rational decisions based on objective probabilities (Kahneman and Tversky, 1979).

Figure 3. Graphical representation of the weight function.
Prospect value, as described in Prospect Theory, refers to the evaluation of a decision-making process based on the value function and the probability weighting function. When faced with a risky decision, individuals evaluate the attractiveness of various options by considering the subjective value of outcomes and their subjective perception of the probabilities of those outcomes occurring. The calculation of prospect value involves two key elements: the value function and the probability weighting function (Kahneman and Tversky, 1979). The value function measures the subjective value of each outcome relative to a reference point, while the probability weighting function adjusts the objective probability to reflect an individual’s subjective perception of different events. The prospect value is calculated by multiplying the value of each outcome by its corresponding probability weight and summing the results. These elements interact within Prospect Theory, creating a complex and systematic decision-analysis framework, providing a solid theoretical foundation for studying human decision-making under risk and uncertainty.
In the context of earthquake early warning, the theoretical significance of the value and weight functions is threefold: 1. Revealing psychological mechanisms: Through the value and weight functions, we can quantify and analyze participants’ psychological utility and probability perception in an earthquake early warning context. 2. Providing a decision-making model: These functions provide a theoretical model for explaining and predicting human behavior in risk-related decisions. 3. Optimizing the warning system: By analyzing the fitting results of these functions, we can offer scientific recommendations for the interface design and information delivery of earthquake early warning systems.
Although the value and weight functions in Prospect Theory are theoretically significant, the parameters, such as α, β, λ and γ. Used to define them are typically derived from experimental data, making them somewhat subjective and dependent on the context. Therefore, fully replicating these functions presents two challenges: 1. Individual differences: Participants differ in their risk perception and decision-making behaviors, making it difficult to apply a uniform set of parameters across all individuals. 2. Experimental conditions: The virtual simulation environment and scenario settings may influence participants’ responses and, consequently, the fitting of the value and weight functions. To address these challenges, this study adopts the following strategies: 1. Parameter calibration: During the experimental design phase, reasonable parameter ranges are determined through pre-experiments or literature reviews and are calibrated in the formal experiments. 2. Context control: The virtual simulation environment is designed to closely mirror real earthquake early warning scenarios, reducing function-fitting errors caused by experimental condition differences. 3. Multi-method validation: Quantitative and qualitative methods from participant surveys are combined to validate the fitting of the value and weight functions, ensuring the reliability and reproducibility of the study.
3.2 Virtual reality
Virtual Reality (VR) technology, as an innovative tool, plays a significant role in various fields, particularly in natural disaster response, safety education and training, healthcare, and construction safety. It shows vast potential in enhancing development and ensuring safety across industries. A study by Bernabei et al., (2024) emphasized the importance of VR technology in occupational health and safety training. The study proposed a comprehensive set of nine key elements aimed at effectively designing, developing, integrating, and validating VR tools for occupational health and safety training (Bernabei et al., 2024). In the field of earthquake simulation and research, (Kellogg et al., 2008) applied VR technology to model the Earth’s internal structure and seismic activity, simulating details such as crustal movement, building shaking and collapse, and ground vibration. This helped scientists better understand seismic mechanisms and provided a basis for earthquake prediction and disaster mitigation measures (Kellogg et al., 2008). In the realm of safety education and training, Vinh T. Nguyen (2019) developed the VRescuer app, which created urban disaster scenarios simulating ambulance rescue workers and trapped individuals. The app used smart ambulances to find the optimal rescue routes, allowing trainees to intervene by adding obstacles or more rescuers to practice rescue skills in a virtual environment (Nguyen et al., 2019). In healthcare, Wu (2021) utilized mixed reality technology for comprehensive preoperative management of complex cervical spine fractures in orthopedic surgery, simulating surgical processes to help doctors become familiar with the steps and improve their surgical skills (Yan et al., 2021). Zhang (2021) proposed a VR-based method for evaluating indoor earthquake safety behaviors by constructing virtual earthquake scenarios to assess the effectiveness of different safety behaviors during an earthquake (Zhang et al., 2021). Additionally, Rajabi (2022) demonstrated that VR technology significantly improved trainee performance and reduced anxiety levels during earthquakes (Rajabi et al., 2022).
In this experiment, VR technology is applied to explore the value of text-based protective guidance in earthquake early warning messages. This study builds upon He (2023)’s research methodology, using immersive VR technology to construct earthquake scenarios and evaluate the effectiveness of earthquake early warning messages (He et al., 2023). Similar to He (2023)’s study, this research uses VR equipment to simulate earthquake scenarios and records participants’ behavioral responses after receiving earthquake early warning messages. However, this study introduces several innovations in experimental design and data collection. First, it incorporates Prospect Theory to quantify the impact of warning messages on participants’ evacuation behavior through value and weight functions. Second, it further refines the elements of the earthquake early warning messages in the virtual scenes by adding text-based protective guidance on earthquake avoidance areas. Finally, this study comprehensively assesses the effectiveness of the text-based protective guidance through a combination of surveys and behavioral data.
4 Experimental design
4.1 Experimental equipment
The development environment for the scene is based on a Windows 10 system with an Intel i7-14700 KF processor and an RTX 4060ti graphics card. The software involved in developing the experimental scene includes Adobe Illustrator 2024, Meta Quest Link, Jianying Professional Edition, Unreal Engine 5.2, and Adobe Photoshop 2024. As shown in Figure 4, participants are required to wear the Oculus Quest 2 VR headset and use handheld controllers to interact with the experiment. The VR visuals are displayed in real-time on the PC monitor, while the controllers are used for navigation and provide vibration feedback during the earthquake simulation.
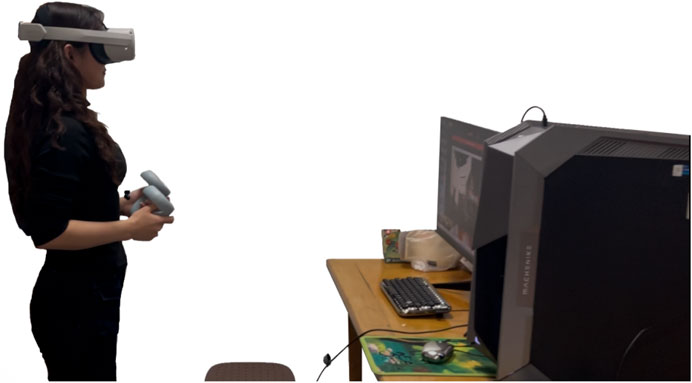
Figure 4. Experimental scene and basic facilities and equipment display.
4.2 Questionnaire design
4.2.1 Informed consent form
The informed consent form covers an overview of the research background, the specific objectives of the experiment, data collection methods, strategies for protecting participants’ privacy, their right to withdraw from the study at any time, and potential experimental risks. The purpose of this document is to ensure that participants fully understand all relevant details of the experiment. Specifically, when explaining the purpose of the experiment, participants were only informed that they would be participating in a simulated earthquake scenario within a home environment, without providing specific details regarding earthquake avoidance procedures.
4.2.2 Experimental questionnaire
Two questionnaires were designed for this experiment, with the goal of collecting data before and after the experiment. As shown in Figure 5, the first questionnaire was distributed to all participants, both in the experimental group and the blank group, and served as a pre-experiment survey. This questionnaire aimed to collect participants’ basic information, including gender, age, education level, experience with Virtual Reality (VR) devices, and history of participating in earthquake emergency drills. These data will serve as important background information during the analysis of the experimental results, helping to understand how individual differences among participants may influence their performance in the experiment.
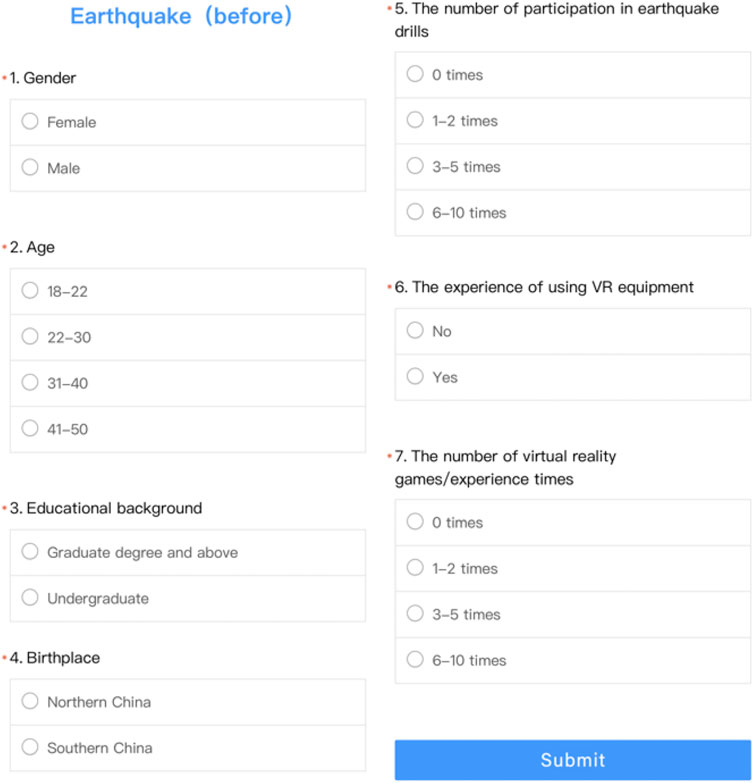
Figure 5. Pre-experiment questionnaire on participant demographics and VR experience.
The second questionnaire was a post-experiment feedback survey, designed to assess the impact of the protective guidance provided during the experiment on participants’ behavior. As shown in Figure 6, the questionnaire covers three key aspects: whether the participants noticed the textual protective guidance provided during the experiment, whether the guidance influenced their choice of avoidance areas, and if so, what specific aspects of the guidance were helpful. This could include whether the guidance provided directional cues, safety tips, or other forms of assistance.

Figure 6. Post-experiment questionnaire on adherence to and perceived helpfulness of textual protective guidance.
4.3 Virtual scene construction
4.3.1 Indoor residential environment model design
In this study, a 3D scene model was developed to successfully create an earthquake simulation environment within Virtual Reality (VR) devices. As shown in Figure 7, the simulated environment represents a typical residential indoor space, which includes four main areas: the living room, bedroom, bathroom, and balcony. Before the study began, participants were informed that the location they were in was their virtual home. This virtual residence is furnished with everyday items such as a television, storage shelves, a dining table, and a sofa. The television screen displayed earthquake early warning (EEW) information as part of the simulation. Participants were made aware that their apartment was located on a high floor of a building, and they could only move within the indoor space, unable to exit through the door. To enhance the realism of the virtual environment, the study not only rendered lighting and shadow maps in real time but also incorporated realistic physical collision effects. This allowed for the simulation of the shaking of the building and the scattering of objects during an earthquake.

Figure 7. Simulated indoor earthquake environments constructed in Unreal Engine 5: (a) Living room scene; (b) Balcony scene; (c) Bathroom scene; (d) Bedroom scene.
4.3.2 Virtual scene settings
4.3.2.1 Earthquake shaking effect setup
In the earthquake simulation phase of this experiment, participants experienced a virtual earthquake lasting 60 s, including both visual and physical shaking effects. Initially, the visual shaking was simulated using Blueprint technology within the indoor scene of Unreal Engine 5. To create the desired dynamic physical response, the objects in the scene were assigned box-shaped collisions. In order to achieve immersive effects such as object drops, building shaking, and a 1-min earthquake duration, the vertical vibrations of the earthquake waves were simulated by adjusting the world position and timeline functions in Unreal Engine 5. According to Sun and Zhang (2010), non-seismically designed masonry structures in Intensity IX zones (PGA ≈0.4 g) generally collapse completely, while seismically designed buildings in Intensity VI-VII zones (PGA 0.07–0.2 g) sustain only minor damage. This evidence establishes Moment Magnitude 6 (corresponding to Intensity VII-VIII) as a critical threshold for structural performance differentiation. (Sun and Zhang, 2010). Therefore, the earthquake intensity was set to a moderate level (Magnitude 6). Observational data from the L’Aquila earthquake (Bordoni et al., 2011) reveals that vertical ground motions in the 3–5 Hz range disproportionately affect mid-rise buildings. Statistical analysis demonstrates a direct correlation between energy concentration in this frequency band and damage severity for 7–12 story buildings (natural frequency 3.2–4.8 Hz), manifesting primarily as slab penetration cracks and infill wall shear failures. Consequently, the vibration frequency was adjusted to a range of 3Hz–5 Hz by modifying the Oscillation Frequency parameter. (Bordoni et al., 2011). The Chinese Seismic Code (GB 50011-2001) specifies 0.2 g as the design basis acceleration for Intensity VIII regions (e.g., Beijing), representing collapse prevention requirements under rare earthquakes. This validated the selection of Peak Ground Acceleration (PGA) was set to 0.2 g by adjusting the Shake Scale parameter. (Sun and Zhang, 2010).
During the earthquake simulation, the Z-axis displacement was achieved by adjusting the world position function. Additionally, a looping animation was created for the floor model using the Blueprint’s timeline function, which allowed the floor to move vertically at specific time points to simulate the shaking caused by the initial P-waves of an earthquake. Furthermore, the physical simulation of objects in the scene was activated to produce physical effects that matched the floor vibrations, such as objects falling off a bookshelf due to the shaking.
Various methods for integrating physical vibrations into the gaming experience have been explored in current research. In this experiment, the vibration feedback from the game controller was chosen to simulate physical shaking. This approach is easy to implement and free from spatial limitations. As a result, a haptic effect was integrated into the VR pawn Blueprint in Unreal Engine 5, allowing both controllers to continuously vibrate throughout the earthquake simulation, enhancing participants’ immersion.
4.3.2.2 Earthquake early warning message video
As shown in Figure 8, the earthquake early warning message includes information such as the countdown timer (10 s), magnitude, arrival time, and epicenter. In the experimental group, additional protective guidance was provided, such as text-based warnings for hazardous and safe areas. The earthquake early warning video was edited using the computer software Jianying Professional Edition. The blank group did not receive any text-based protective guidance on earthquake avoidance, while the experimental group was provided with this information.

Figure 8. The protective guidance design of Earthquake Early Warning (EEW): (a) Instructional information provided to the experimental group (during the earthquake countdown); (b) Instructional information provided to the experimental group (after the earthquake onset); (c) Instructional information provided to the blank group (during the earthquake countdown); (d) Instructional information provided to the blank group (after the earthquake onset).
In Unreal Engine 5 (UE5), the first step is to create a File Media Source, Media Player, and Media Texture in the Content folder. The texture is then applied to the screen of the TV model. The File Media Source is used to specify the video file path, which is then imported into UE5. To enhance the video display’s brightness and overall quality, the Media Texture is changed to an emissive material.
Once the experiment begins, a 40-s movie clip will play on the living room TV. At the end of the movie, the earthquake early warning message will pop up, along with the earthquake countdown.
4.3.2.3 VR movement method
In the field of virtual reality (VR), the technology used to move within virtual spaces is called VR locomotion. This technology can generally be divided into two types: controller-based locomotion and body movement-based locomotion.
For body movement-based VR locomotion solutions, users can walk freely in real space, with their gait captured and translated into corresponding actions in the virtual environment. However, due to the risk of injury to participants in simulated earthquake scenarios, this method was excluded from the study.
In contrast, teleportation, a controller-based VR movement method, is widely used in current VR gaming. As shown in Figure 9, users can instantly move to their focal point in their line of sight by pressing a button on the controller. The user moves the joystick forward, which activates a blue cursor. Upon releasing the joystick, the user is teleported to the targeted location. While this movement method may not offer the same level of immersion as real walking, it was prioritized in this study to avoid potential issues such as motion sickness, which can be caused by improper movement speeds when controlling the character’s perspective. This consideration was made to reduce the risks of symptoms like nausea and dizziness.
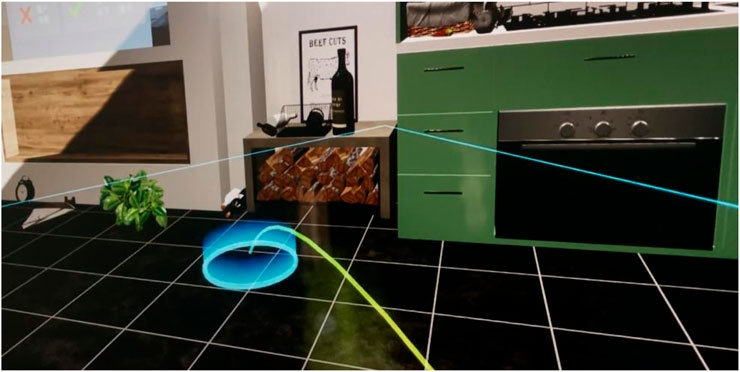
Figure 9. Third-Person perspective of the experimenter using VR equipment (movement operation using teleportation pointer—yellow line and blue circle).
4.3.2.4 Virtual characters and NPCs (Non-Player Characters) setup
In this experimental design, participants were required to complete the evacuation process on their own, with the goal of eliminating any potential influence from other individuals or collective behaviors. Therefore, no NPCs (Non-Player Characters) were included in the experimental model, and the potential social dynamics that could arise between virtual characters and NPCs during the evacuation process were not considered. This means that the evacuation process was entirely autonomous, allowing participants to evacuate independently.
4.3.2.5 Experiment duration setup
Considering the varying familiarity of participants with VR devices and the unique movement method of the Oculus Quest two controllers, different wrist rotation angles during the forward movement of the joystick can lead to different movement distances—greater wrist angles result in longer distances. Due to the differences in participants’ operating habits, the movement speed varied for each participant. Furthermore, considering the differences in participants’ levels of anxiety and the potential delays in VR device visuals, no fixed duration was set for the experiment.
4.3.2.6 Sound settings
The experiment simulated a scenario in which a residential indoor environment was suddenly affected by an earthquake. The environmental sounds included: audio from the movie, the countdown sound of the earthquake early warning, and the earthquake alarm. Throughout the entire experiment, none of the sounds provided any guidance or related information about the location of earthquake avoidance areas.
4.3.2.7 Experiment design and procedure
The experiment was conducted in Office 1,222 of the Science and Research Building at Beijing Forestry University, over a period of 3 days. Before the experiment began, participants were required to sign an informed consent form and complete a pre-experiment questionnaire, which aimed to collect basic information. It was expected that each participant would take approximately 3 min to complete the questionnaire.
In the practice phase of the experiment, to reduce errors caused by unfamiliarity with the controls, participants would complete a series of practice scenarios to master basic skills such as character movement and turning, until they became proficient. This phase was expected to take 3–5 min. These practice scenarios were unrelated to the main experimental scenarios but were consistent in terms of basic settings, such as speed parameters.
After a short break, participants would enter the formal experiment phase, where they would wear the Oculus Quest two device and watch a film in a virtual residential environment. During the movie, an earthquake early warning countdown would appear, prompting participants to select a safe location. During the experiment, real-time tracking of the participants’ evacuation time and selected location would be recorded. After the earthquake evacuation experiment concluded, participants would complete a post-experiment questionnaire, expected to take 3–5 min. Throughout the entire experimental process, participants had the right to withdraw from the experiment at any stage without any conditions attached.
To avoid increasing familiarity with the scene due to repeated exposure, which could affect immersion and the accuracy of the data, each participant would only experience the virtual scene once, following a between-subjects design. The experiment was divided into two groups: the blank group, which did not receive text-based guidance for earthquake evacuation, and the experimental group, which received text-based guidance for earthquake evacuation. The only difference between the two groups was the protective guidance; other elements, such as scene construction, design, settings, and experimental steps, remained consistent.
4.3.2.8 Participant safety and risk control
To ensure participant safety and the reliability of the data, this study paid particular attention to potential physical discomfort caused by immersive Virtual Reality system, especially under the high-stress conditions of earthquake simulation. Immersive Virtual Reality systems are known to potentially trigger symptoms such as motion sickness, nausea, dizziness, and spatial disorientation, primarily due to sensory conflicts between visual and vestibular inputs (Ugur and Konukseven, 2022). Throughout the experiment, researchers observed participants for signs of physical distress. All participants were fully informed of possible risks during the consent process and were explicitly told that they could withdraw from the study at any time without penalty.
To minimize adverse reactions, the Oculus Quest two system was adjusted for comfort, including limiting visual acceleration and implementing a teleportation-based movement system instead of continuous motion. A scheduled break was provided between the practice and formal sessions to reduce fatigue. By the end of the experiment, no participants reported significant discomfort or withdrew due to VR-related symptoms, indicating that the experimental setup was generally well-tolerated. Nonetheless, the potential influence of physiological responses was carefully considered during data interpretation.
5 Experimental results
After the initial processing and export of the experimental data, this study conducted a thorough analysis using SPSSAU and Matlab software. Given that the experiment produced data of various types with complex interactions, the results will be presented systematically and clearly based on the analysis techniques used. The results will be discussed in detail according to the corresponding sections.
5.1 Participants
As shown in Table 1, a total of 74 participants were recruited for this study, all of whom actively participated in the experiment, resulting in a final valid sample size of 74. Among them, 23 were male (31.08%) and 51 were female (68.92%). These participants were randomly assigned into two groups, with 37 participants in each group. One group was the blank group, which received no earthquake evacuation guidance in the experiment, while the other group was the experimental group, which received earthquake evacuation guidance within the virtual environment. Both groups included participants of different genders.
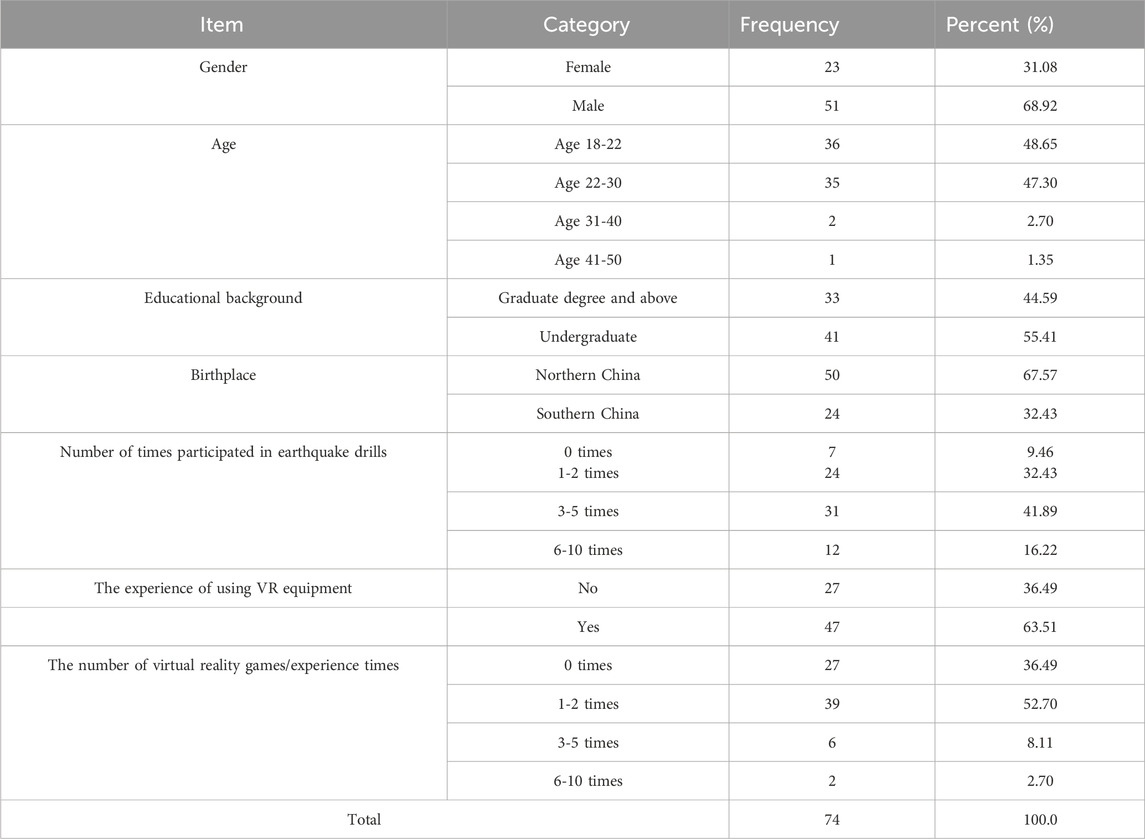
Table 1. Demographic characteristics and VR/earthquake drill experience of participants.
The age of the participants ranged primarily from 18 to 40 years, which is related to the experimental setting being located within a university campus. This age group is more likely to be interested in virtual reality experiments compared to middle-aged and older adults, and it is easier to recruit volunteers from student populations. In terms of educational background, the survey found that 55.41% of the 74 participants held a bachelor’s degree, while 44.59% had a graduate degree or higher. Geographically, 67.57% of the participants were from northern China, and 32.43% were from southern China.
Regarding prior experience with virtual reality devices, 63.51% of participants had used VR equipment before, with 52.7% having participated in one to two VR games or experiences, and 2.7% having engaged in 6–10 VR games or experiences. In terms of earthquake experience, 32.43% had participated in one to two earthquake drills, 41.89% had experienced 3-5 earthquake drills, and 16.22% had participated in six or more earthquake drills.
All participants had normal or corrected vision and did not suffer from color blindness, color weakness, or other visual impairments. Furthermore, none of the participants had cardiovascular diseases, such as heart disease or hypertension, or respiratory diseases. Participation in the experiment was entirely voluntary.
This section of the study aims to analyze the background characteristics of the participants (e.g., age, gender, educational background, earthquake experience) to assess the diversity and representativeness of the sample. This will help in understanding the applicability of the experimental results and provide contextual support for subsequent analyses. Overall, the sample shows a certain level of diversity, but it is primarily composed of younger, highly educated individuals, mostly from university and graduate student populations, with an age range of 18–40 years. This may not fully represent a broader population. Future research should consider expanding the sample size and increasing diversity in terms of age, occupation, and cultural background to enhance the generalizability of the results.
This study employed a stratified random sampling method, implemented using Python’s pandas and sklearn libraries for sample grouping. A 3 × 3 stratification framework was constructed based on VR device usage experience (high/medium/low) and earthquake drill participation frequency (regular/occasional/none) to ensure balanced distribution of key variables between experimental and control groups. During the sampling process, participants were randomly assigned (50% each group) according to stratification labels, with between-group differences verified through chi-square tests (VR experience: χ2 = 0.32, p = 0.85; earthquake drills: χ2 = 0.41, p = 0.81), showing standardized mean differences (SMD) all <0.1. The study adopted a single-blind design and excluded extreme samples (e.g., professional VR users), ultimately achieving effective control of inter-group imbalance in a small sample while enhancing internal validity.
5.2 Definition and correctness of evacuation zones
To clearly display the different evacuation zones selected by participants for data analysis purposes, this study divided the indoor space involved in the experiment into various regions. Based on the choices made by the participants, nine evacuation zones were defined. As shown in Figure 10, Zone 1 (gray) represents the living room sofa area, Zone 2 (lake blue) represents the bathroom shower area, Zone 3 (yellow) represents the bedroom nightstand area, Zone 4 (purple) represents the living room dining table area, where participants typically chose to take shelter under the table, Zone 5 (red) represents the bathroom toilet area, Zone 6 (green) represents the bedroom bookshelf area, Zone 7 (blue) represents the bathroom washbasin area, Zone 8 (orange) represents the bedroom wardrobe area, where participants typically chose to hide inside the wardrobe, and Zone 9 (pink) represents the living room shelving area.

Figure 10. Numbering and color coding of avoidance areas in the virtual indoor environment.
Additionally, the correctness of these zones was assessed, as shown in Figure 11. The criteria for determining the correctness of the zones were whether the zone contained easily falling objects and whether the supporting strength of the area was sufficient. Zone 2, located at a high-support corner and free from heavy objects, was deemed correct. Zones 5, 7, 6, 9, and 1, though located in high-support corners, contained fragile mirrors, metal racks, unstable bookshelves, unstable storage racks, and wooden decorations at the top, making them incorrect zones. Zone 8, located inside the bedroom cabinet, and Zone 4, located under the living room dining table, both exhibited strong support and contained no heavy objects, thus they were deemed correct zones.
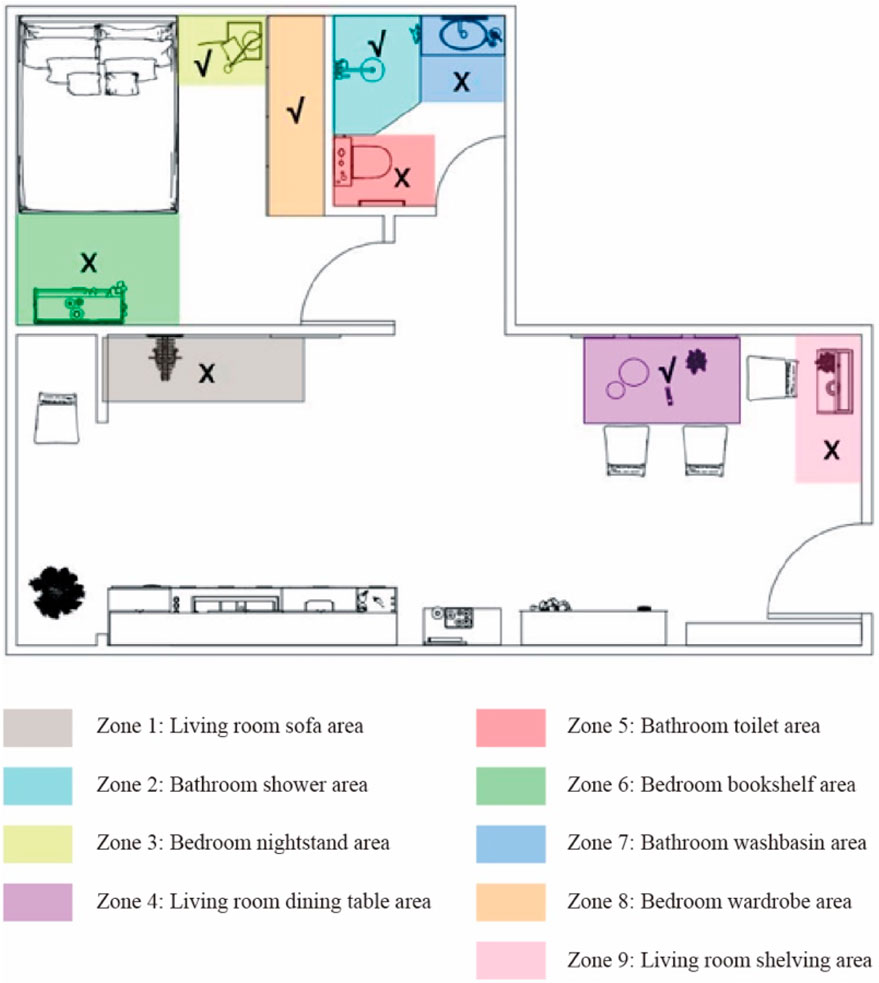
Figure 11. Correctness classification and color coding of avoidance areas in the virtual indoor environment.
This section of the study aims to analyze participants’ behavioral patterns in selecting evacuation zones in the earthquake early warning scenario by dividing the indoor space into designated zones. The zone division allows for a clear display of the frequency of selections, providing a basis for further analyzing the correctness of evacuation behaviors. The zone analysis indicates that participants showed a clear preference for selecting corner locations or areas with strong support.
5.3 Equations
As shown in Tables 2, 3, to analyze whether there are significant differences in the evacuation zones chosen by participants in the experimental group and blank group under the earthquake early warning scenario, and to assess whether the behavior patterns in selecting evacuation zones are consistent across both groups, a frequency analysis of the selected evacuation zones was conducted for both groups. In the two groups, 51.35% and 40.54% of participants, respectively, chose Zone 2 (the bathroom shower area) as their preferred evacuation zone. This was the most frequently selected evacuation zone for both groups. According to participant feedback, this area is located in a corner, making it less likely to collapse, and it also provides access to sufficient water, which made it the first choice for many participants.
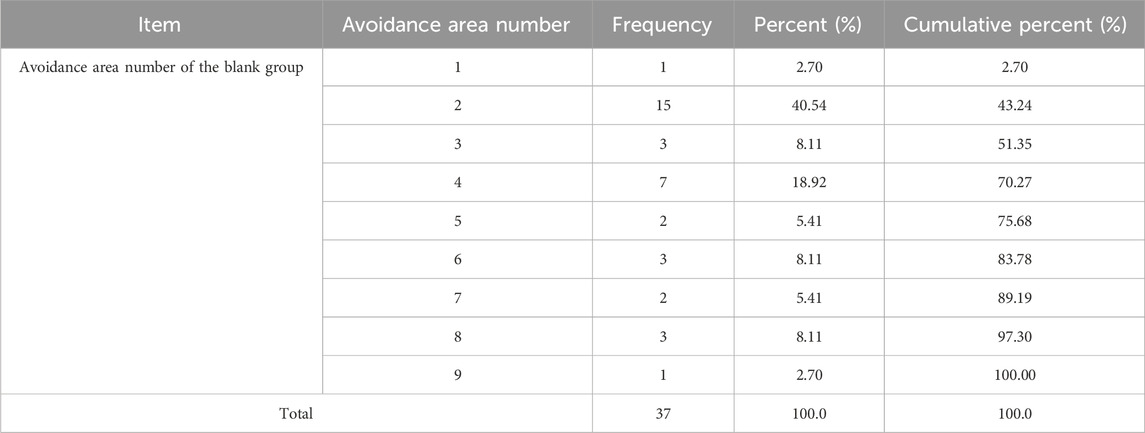
Table 2. Frequency distribution of avoidance area numbers for the experimental group.
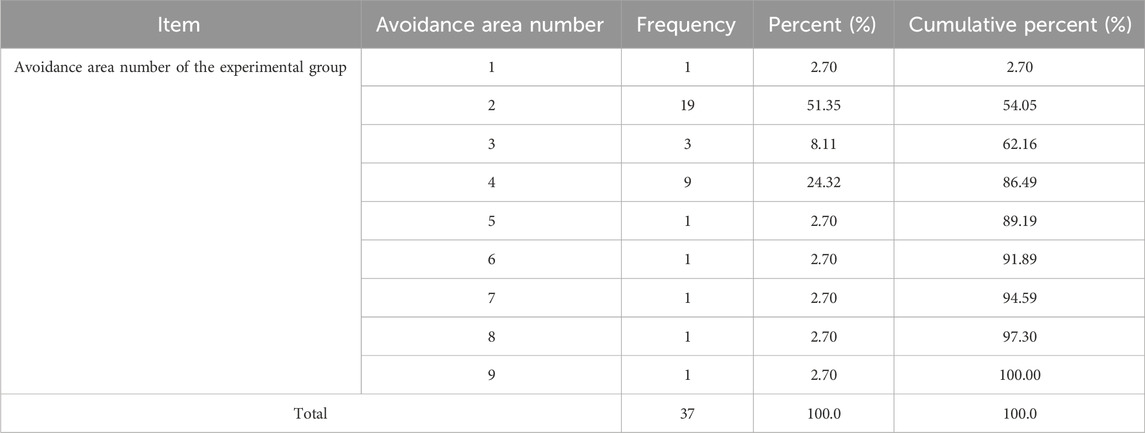
Table 3. Frequency distribution of avoidance area numbers for the blank group.
Additionally, 24.32% and 18.92% of participants chose Zone 4 (the living room dining table area) because it is close to the starting point of the experiment and the table provides strong support. A smaller number of participants selected Zone 3 (the bedroom nightstand area), Zone 6 (the bedroom bookshelf area), and other locations.
To determine the functionality of the protective guidance in the earthquake early warning, it is necessary to assess whether the protective guidance leads to significant differences in the evacuation zones chosen by participants. To this end, the evacuation zone selections of the two groups were subjected to normality tests. Since the sample size of the research data was less than 50, the Shapiro-Wilk (S-W) test was used. The results showed that both x and y were statistically significant (p < 0.05), indicating that the samples from the two groups were consistent with respect to x and y, and there was no significant difference between them.
Since the experimental data did not meet the normality assumption, a non-parametric test was conducted on the evacuation zone selections of the two groups using the Mann-Whitney U test, as shown in Table 4. The results indicated that there were no significant differences in the evacuation zone choices between the two groups (p > 0.05), suggesting that the samples from different groups did not exhibit significant variation in their selections.
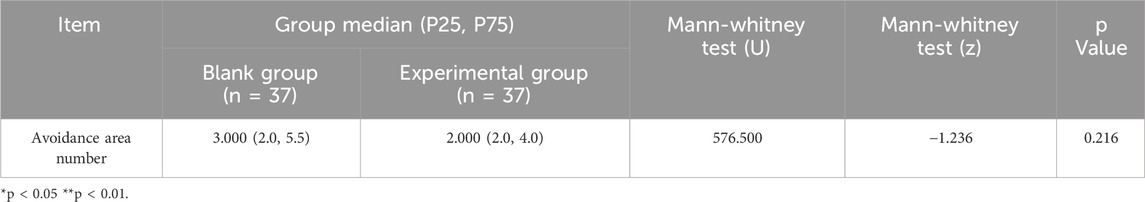
Table 4. The non-parametric test of the avoidance areas between experimental group and blank group.
5.4 Comparison of time and correctness of choices in the experiment
In this experiment, measuring the time spent in finding a safe zone and the correctness of the selected evacuation area were the two key components. The time dimension was used to test whether the earthquake early warning information could reduce the time participants spent in finding a safe zone during an earthquake scenario, thereby improving evacuation efficiency. The correctness dimension was used to assess whether the earthquake early warning information could improve the accuracy of participants’ safe zone selections.
To validate the impact of earthquake early warning information on evacuation efficiency and correctness, this experiment compared the evacuation time and correctness of zone choices between the experimental group and the blank group in the earthquake early warning scenario. The total time taken by the two groups from the start of the experiment to the determination of their evacuation zone was collected, as shown in Table 5, as well as the reaction time from when the earthquake early warning message appeared to the moment participants began searching for a safe zone, as shown in Table 6.
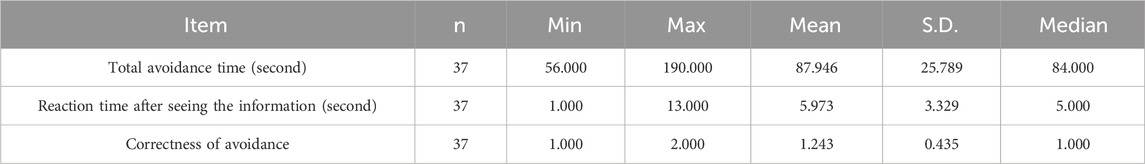
Table 5. Descriptive analysis of total time spent and reaction time in the experimental group.

Table 6. Descriptive analysis of total time spent and reaction time in the blank group.
In this study, reaction time refers to the interval between the appearance of the protective guidance message and the participant’s first behavioral response. This captures the speed of initial cognitive processing and decision initiation.
Total evacuation time is measured from the guidance message onset to the participant’s arrival at the chosen shelter, reflecting overall action execution. Distinguishing these two metrics allows us to analyze both decision-making and behavioral efficiency.
In both groups, the blank group had an average total time of 87.95 s and a reaction time of 5.97 s after receiving the information. In contrast, the experimental group had an average total time of 84.51 s and a reaction time of 11.76 s after receiving the information. Additionally, the maximum reaction time in the blank group was 13 s, whereas in the experimental group, it was 60 s. Thus, participants in the experimental group, who received earthquake evacuation instructions, indeed spent more time reading the earthquake early warning message than those in the blank group, who did not receive such instructions.
A comparison shows that although the experimental group had a longer reaction time after seeing the information, their total time was reduced by 3.4 s. The increased reaction time can be attributed to the presence of text-based guidance, which required participants to spend more time observing, reading, and understanding the information. In contrast, the control group received no such textual cues and thus reacted more quickly, albeit with limited clarity or direction.
However, the clarity and accuracy of the protective guidance provided in the experimental condition allowed participants to identify safe evacuation areas more efficiently. Rather than relying on trial-and-error or self-directed judgment—often observed in the control group—participants in the experimental group were able to navigate directly to appropriate shelter locations. Therefore, it can be concluded that the earthquake early warning information, in terms of time, effectively reduced participants’ response time in responding to an earthquake emergency.
Additionally, this experiment also collected data on the correctness of the evacuation zones chosen by participants in both groups. In the experimental group, the percentage of participants selecting the correct evacuation zone was 86.5%, as shown in Table 7. In the blank group, the percentage of correct selections was 75.7%, as shown in Table 8. The correctness rate in the experimental group was significantly higher than in the blank group, with a difference of nearly 11 percentage points. Therefore, it can be concluded that the earthquake early warning information effectively improved the correctness of participants’ chosen evacuation zones.
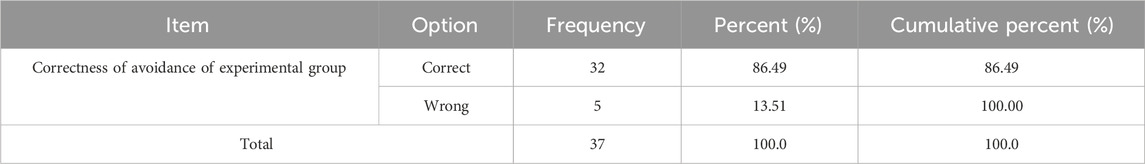
Table 7. Frequency distribution of avoidance correctness in the experimental group.

Table 8. Frequency distribution of avoidance correctness in the blank group.
To assess the difference in accuracy rates between the two groups, a chi-square test was performed,as shown in Table 9. The results demonstrated that the experimental group exhibited significantly higher accuracy in selecting shelter areas (86.5%) compared to the control group (75.7%), with this difference being statistically significant (χ2 = 5.32, df = 1, p = 0.021 < 0.05, Cramer’s V = 0.18). Although the effect size was relatively small (V < 0.2), all expected cell frequencies exceeded 5 (minimum = 12.3), satisfying the test’s underlying assumptions. These findings indicate that VR intervention significantly improves decision-making accuracy, though the practical magnitude of this difference warrants further evaluation in conjunction with additional metrics such as time efficiency.
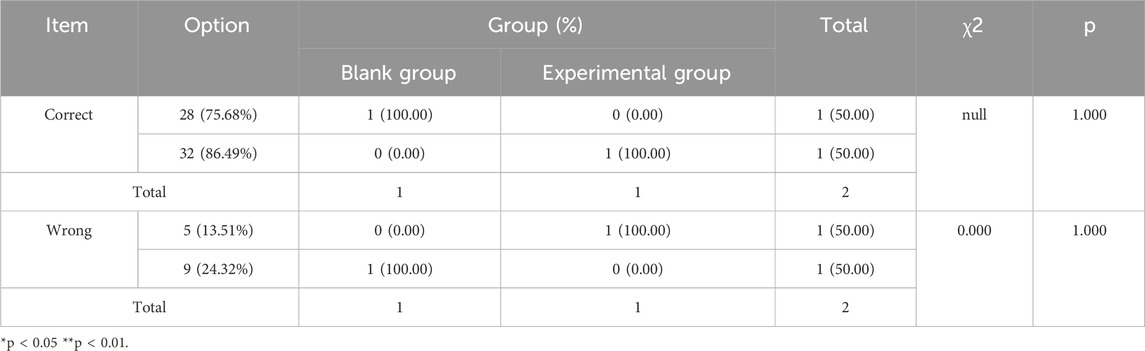
Table 9. Frequency distribution of avoidance correctness in the blank group.
5.5 Memory retention of the earthquake early warning information
Next, to analyze participants’ memory retention of the earthquake early warning information and assess its memorability and practical guidance effectiveness, we analyzed the post-experiment questionnaire regarding memory retention. This section focuses on the value of the textual protective guidance in helping participants in the experimental group choose evacuation zones. As shown in Table 10, the results reveal the extent to which participants paid attention to the textual protective guidance and whether it assisted them in selecting the correct evacuation zone.
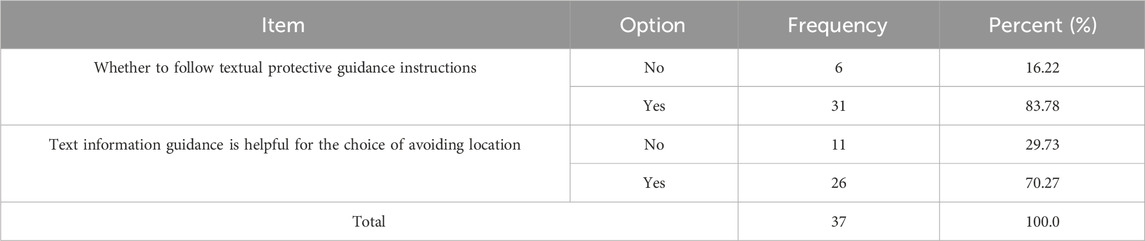
Table 10. The reaction time of the participants in the experimental group.
Among the participants, 83.8% reported noticing the text-based protective guidance, while 16.2% did not. Additionally, 70.3% of the participants believed the guidance helped them in finding a safe evacuation zone, while 29.7% felt that it did not provide any assistance.
Therefore, the majority of participants paid attention to the text-based protective guidance, and most of them found the guidance helpful in selecting their evacuation zone.
Furthermore, this study continued to investigate the specific ways in which the textual protective guidance assisted participants. As shown in Table 11, 23% of the participants believed the text-based protective guidance helped them make a quick decision, 19.2% felt it helped them think clearly in stressful situations, and another 19.2% found that the guidance enabled them to make more selective judgments. Some participants also reported that the guidance directly told them the specific evacuation zones or helped them identify safe locations.
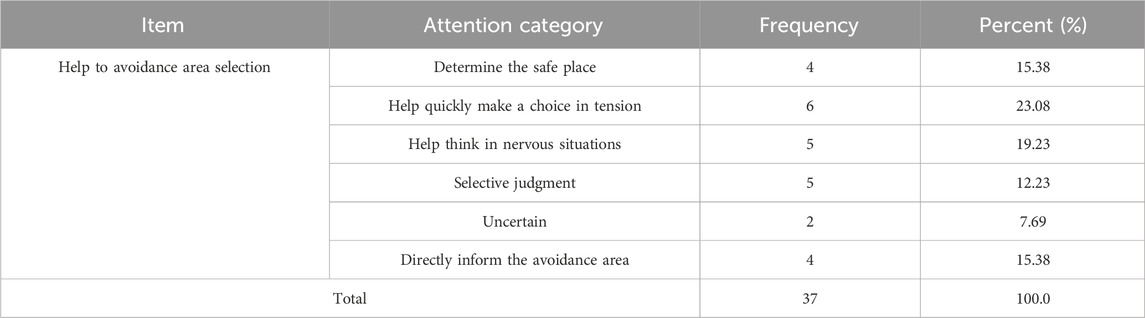
Table 11. Participants’ attention to textual protective guidance.
In general, the earthquake early warning’s textual protective guidance was highly memorable. The majority of participants were able to notice and remember the guidance, and it played a significant role in their actual evacuation behavior. The guidance helped participants quickly select evacuation zones and remain calm under pressure. These results further demonstrate the rationality of the design of the text-based protective guidance and emphasize the importance of providing clear and memorable instructions during emergencies.
5.6 Relationship test between earthquake experience, memory, and correctness of evacuation area
To further understand the impact of participants’ earthquake experience and their memory of textual protective guidance on their evacuation behavior, particularly the relationship with the correctness of evacuation area selection, a normality analysis was conducted on the three variables. Given that the sample size was less than 50, the S-W test was chosen. The results indicate that both x and y were statistically significant (p < 0.05), suggesting that the samples from different groups were consistent in x and y, and no significant differences were found.
Due to the data not meeting normality assumptions, a non-parametric test was conducted. As shown in Table 12, after performing the Mann-Whitney test, the results indicated that the correctness of evacuation area selection showed consistency with earthquake experience and memory (p > 0.05), with no significant differences found.
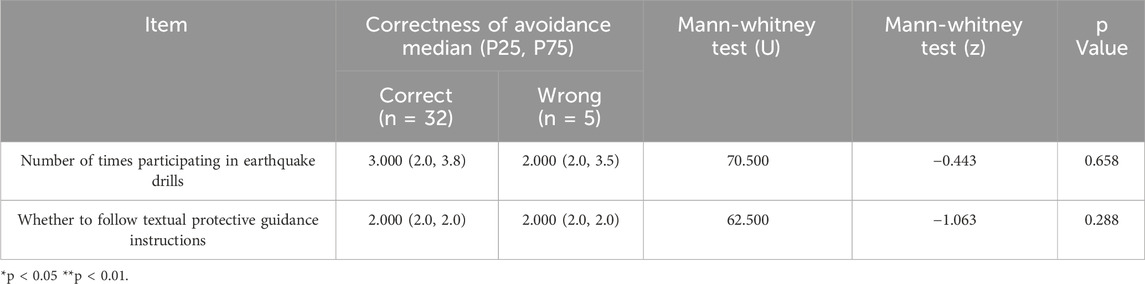
Table 12. Non-parametric test results for earthquake drill participation, guidance adherence, and avoidance correctness.
5.7 Defining the reference point — Escape area scoring system
In prospect theory, the reference point serves as the benchmark for individuals to assess potential gains and losses. It determines how individuals perceive these outcomes. Establishing a reference point is crucial for understanding decision-making behavior, especially when individuals face risk and uncertainty. In this study, a scoring system is used as the reference point to quantitatively assess the safety of different escape areas. Each area is assigned a score based on its structural stability and the risk of falling objects, providing participants with a clear safety evaluation reference.
In section 5.2, “Evacuation Area Division and Accuracy,” the areas are classified into correct and incorrect categories based on their color and number. To support subsequent data analysis, the accuracy of the existing area classification is further assigned scores, as shown in Figure 12. The scoring system is based on an analysis of the physical characteristics of the evacuation areas, including structural support and the presence of any risk of falling objects. Correct evacuation areas are assigned positive scores, while incorrect areas are assigned negative scores. The score reflects the safety level of each area.

Figure 12. Scoring system for avoidance areas across nine zones in the virtual indoor environment.
The scoring criteria were established based on Sakuma (2023) Head Injury Criterion (HIC) and adjusted to the practical context of VR environments, focusing on three key factors: (1) Item height: Higher placement increases the risk of head injury; (2) Item number: More items correlate with a higher risk of being struck; (3) Item weight: Heavier items pose a greater threat upon impact (Sun et al., 2017). As shown in Table 13, the average height, number, and total weight of items in nine zones were first recorded. Height and weight values were then ranked in descending order to assign corresponding scores, while item number was directly used as the number score. Finally, the three scores were summed to calculate a total score for each zone, with higher totals indicating greater danger, as illustrated in Table 14.
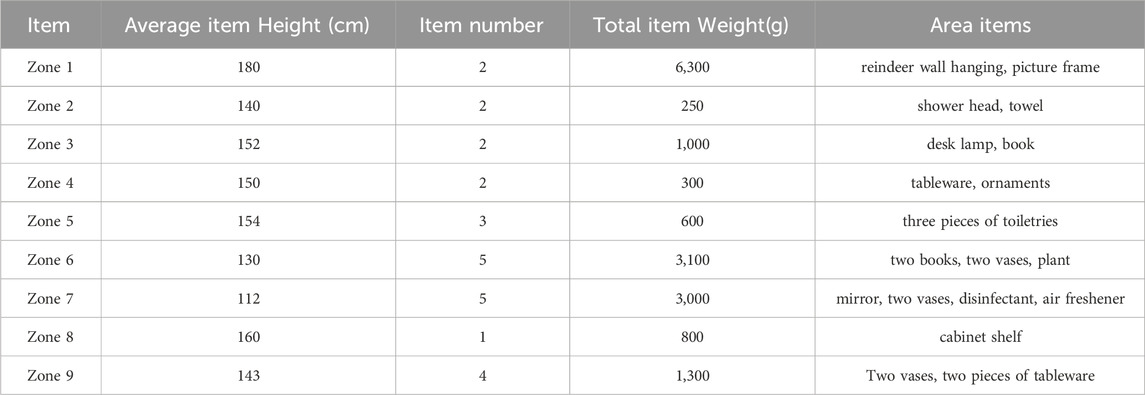
Table 13. Summary of basic item information for the nine zones.

Table 14. Scores and risk rankings for the nine zones.
Among Zone 3 (yellow), Zone 5 (red), Zone 7 (blue), and Zone 8 (orange), which share the same total scores, a further refined ranking is required for subsequent formula calculations. Given their positions in safe wall corners, the ranking is based on the risk of objects falling and causing injury. Zone 7 and Zone 5 both have items positioned above the head, posing a risk of impact injuries. Among these, Zone 7 contains a heavy mirror, while region five holds lighter toiletries (e.g., face wash, conditioner). Therefore, Zone 7 is deemed the most hazardous, followed by Zone 5. Zone three and Zone 8 have no heavy objects above the head. However, Zone 8’s cabinet area is enclosed, eliminating the risk of external objects falling, while Zone 3 is an open space where the table lamp and desk could potentially cause harm. Thus, Zone 8 is the safest, and Zone 3 is the second safest. The final ranking of these four zones, from safest to most dangerous, is: Zone 8 (orange) > Zone 3 (yellow) > Zone 5 (red) > Zone 7 (blue).
Based on the division of correct and incorrect zones in Table 11 (correct zones assigned positive scores, incorrect zones assigned negative scores), and the risk level classification from Tables 13 and 14, the refined scoring system for the nine zones can be expressed as follows: Zone 2 (blue-green), with a score of 4; Zone 4 (purple), with a score of 3; Zone eight (orange), with a score of 2; and Zone 3 (yellow), with a score of 1. In terms of danger, the areas ranked from highest to lowest risk are: Zone 1 (gray), with a score of −5; Zone 6 (green), with a score of −4; Zone nine (pink), with a score of −3; Zone 7 (blue), with a score of −2; and Zone 5 (red), with a score of −1,as shown in Figure 12.
The scoring system serves as a crucial reference point in this study. It not only provides participants with a clear safety evaluation standard but also offers important evidence for analyzing the effectiveness of earthquake early warning information design. Additionally, the system provides an objective reference point for further analysis. Furthermore, this study considers individual differences, contextual factors, and information design in order to gain a comprehensive understanding of participants’ decision-making processes.
5.8 Constructing the prospect theory model
To input the data from both the experimental and blank groups into MATLAB, it is necessary to integrate the three key formulas of prospect theory—the value function, the weight function, and the prospect value—along with the two reference metrics required for this study: correctness and time spent. This integration allows for the construction of the model.
The steps for constructing the earthquake early warning analysis model based on prospect theory are as follows:
Step 1: Define the file path and import the data for both the control and experimental groups.
Step 2: Load and clean the dataset, categorize the data for both groups, and rename the columns to organize the escape time, correctness, and escape area choices.
Step 3: Extract the relevant data for escape areas and their corresponding scores.
Step 4: Input the preset parameter values for the three formulas (the alpha, beta, and lambda values for the value function, and the gamma and delta values for the weight function).
Step 5: Calculate the value function for both groups separately.
Step 6: Use the weight values to calculate the score’s corresponding success probability (p). Define both positive and negative weight functions and assume that the success probability based on the score will scale the score from the original range to the [0,1] interval. Then, calculate the weight values for both groups.
Step 7: Define the prospect value calculation formulas for both groups. These formulas combine the positive and negative weight functions with the value function, and the prospect values for both groups are then calculated.
Step 8: Display the prospect values for both groups and compare their average prospect values.
Step 9: Visualize the prospect value data by plotting a bar chart of the average prospect values and a scatter plot of the individual prospect values.
5.9 Calculating the value function
The value function V(x) is a mathematical expression used to measure an individual’s psychological value of different outcomes (gains or losses). Its mathematical formulation is as follows:
In this context, x represents the actual change in wealth or outcome, which can be either positive (gain) or negative (loss). In this study, x refers to the participant’s choice of escape point. Since escape areas are categorized as either correct (gain) or incorrect (loss), correct choices are greater than 0, and incorrect choices are less than 0, so the possibility of x = 0 is not considered.
Α Represents the curvature parameter for gains, reflecting an individual’s sensitivity to additional gains. A smaller αindicates a faster diminishing marginal satisfaction from additional gains. In this study, α reflects the participants’ sensitivity to the psychological value of selecting a safe area.
βrepresents the curvature parameter for losses, indicating that individuals are more sensitive to losses than to gains, reflecting the phenomenon of loss aversion. In this study, β reflects participants’ sensitivity to the psychological value of selecting a dangerous area.
λ Represents the weight of losses, typically greater than 1, and adjusts the intensity of loss impact, indicating that losses have a greater psychological effect than gains of the same size. In this study, the values of α = β = 0.88 and λ = 2.25 were calibrated based on the research by Kahneman (Liu et al., 2011).
By converting the participants’ escape area choices into numerical scores and applying the value function, we can quantify the psychological value of each choice. This helps us understand the psychological motivations behind participants’ decision-making behavior under the influence of earthquake early warning information. The calculated value functions for both the blank group and the experimental group are shown in Tables 15, 16.
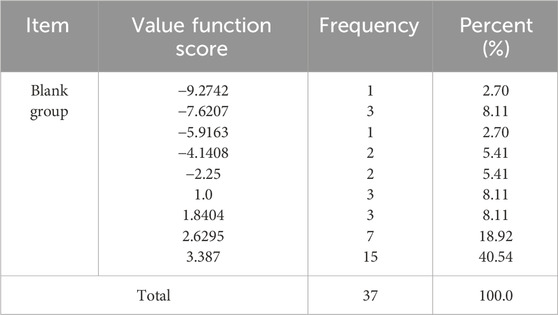
Table 15. Frequency distribution of value function scores in the blank group.
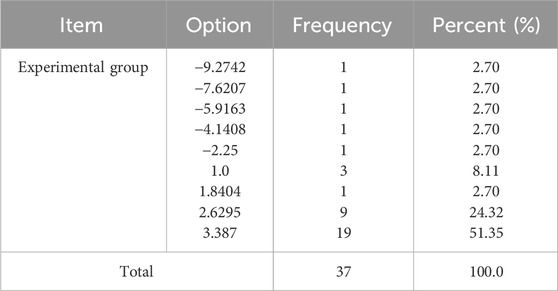
Table 16. Frequency distribution of value function scores in the experimental group.
The blank group participants did not receive any earthquake escape text-based protective guidance, so their choices were more dependent on their intuition and judgment of the environment. The highest value was 3.3870, corresponding to the previously mentioned blue-green area 2, which the blank group participants considered the safest escape area. The lowest value was −9.2742, corresponding to the gray area 1, which they considered the most dangerous escape area. The highest value corresponds to the area with the highest score, and the lowest value corresponds to the area with the lowest score, both of which were correctly judged. If multiple participants have a value function of 1, it indicates that they are neutral toward gains and losses, meaning they found it difficult to assess whether the escape area they chose was safe or dangerous.
The experimental group participants received earthquake escape text-based protective guidance, so their choices were more influenced by the content of the protective guidance. The highest and lowest values were the same as in the blank group, consistent with the experimental scoring. However, the value function values for several participants were concentrated between 2.3104 and 3.3870, which were generally higher than those of the blank group, indicating that the experimental group participants, with the help of the protective guidance, were better able to assess the safety of the escape areas.
5.10 Calculating the weight function
The weight function reveals how individuals adjust their attention to different outcomes based on the likelihood of events. This theory posits that people have different internal evaluation mechanisms for the probabilities of success and failure, and this difference is reflected in the parameters γ and δ. Specifically, the positive weight function w+(p) reflects an individual’s psychological response to the probability of success, while the negative weight function w−(p) reflects their psychological perception of the probability of failure. Together, these two functions depict how individuals subjectively process probability information during decision-making. The mathematical expressions for the weight functions are as follows:
In this context, p represents the actual probability of successful avoidance, while γ is the curvature parameter of the positive weight function, reflecting the individual’s subjective evaluation of the success probability. A smaller value of γ means that the marginal importance of the success probability decreases more quickly. δ is the curvature parameter of the negative weight function, reflecting the individual’s subjective evaluation of the failure probability. According to the research by Kahneman et al., the values are calibrated as γ = 0.61 and δ = 0.69.
In this study, for w+(p), p refers to the probability of successful avoidance, and for w−(p), p refers to the probability of failure. The weight functions for both the blank group and the experimental group are calculated, focusing on both the success and failure data for each group. The results show that the weight functions for the blank group are as follows:
As shown in Table 17, in the positive weight function, the highest weight value is 1, corresponding to the blue-green area 2, which has the highest accuracy. This indicates that the participants were extremely optimistic about the success probability of this escape area. The lowest weight value is 0.1962, corresponding to the green area 6, which has the second-highest error rate. This suggests that the participants were relatively pessimistic about the success probability for this area. Multiple weight values are concentrated between 0.5128 and 0.6974, indicating that most participants were neutral in their assessment of the success probability.
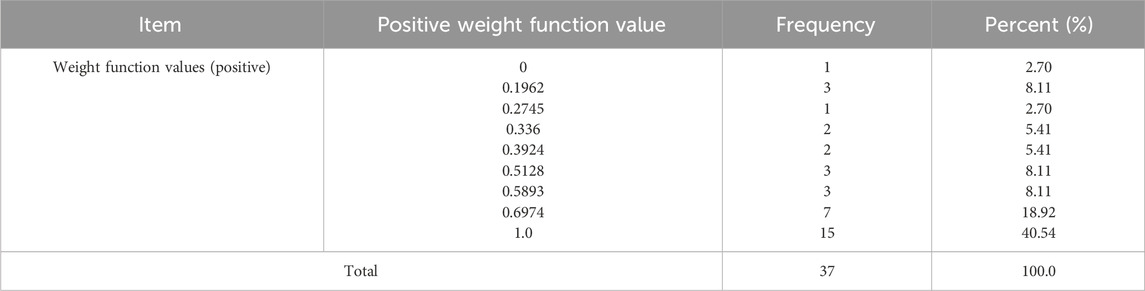
Table 17. Frequency distribution of positive weight function values in the blank group.
As shown in Table 18, in the negative weight function, the highest weight value is 0.761, corresponding to the green area 6, which has the second-highest error rate. This suggests that the participants were highly concerned about the failure probability for this escape area. The lowest weight value is 0, corresponding to the blue-green area 2, which has the highest accuracy. This indicates that the participants were not at all concerned about the failure probability for this area. Multiple weight values are concentrated between 0.3494 and 0.1812, showing that most participants were cautious in their assessment of the failure probability.

Table 18. Frequency distribution of negative weight function values in the blank group.
Therefore, the blank group participants’ subjective evaluations were fully accurate for the escape area with the highest success probability, but there were differences in the evaluation of the escape area with the highest failure probability, as it was not the gray area 1, which was the most dangerous.
The positive and negative weight functions for the experimental group are shown in Tables 19, 20. In the positive weight function, the highest weight value is 1, corresponding to the blue-green area 2, which has the highest accuracy, indicating that participants were extremely optimistic in their assessment of the success probability for this escape area. The lowest weight value is 0.336, corresponding to the blue area 7, which has the fourth-highest error rate, suggesting that participants were relatively pessimistic about the success probability for this area. Many of the weight values are concentrated between 0.5893 and 0.6974, indicating that most participants, with the help of the protective guidance, had an optimistic view of their success in avoidance.
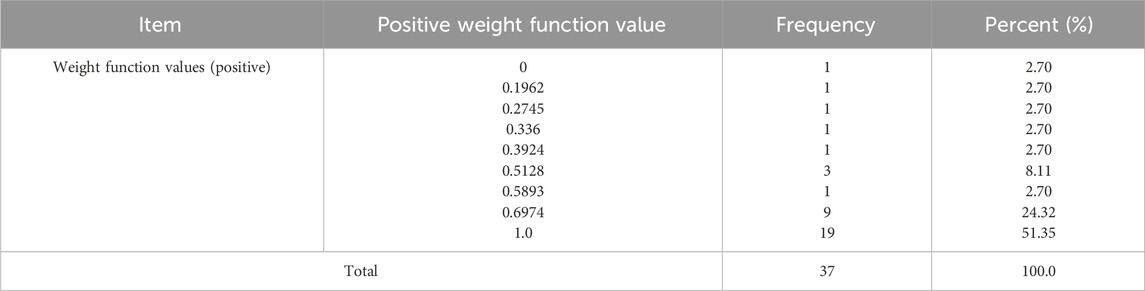
Table 19. Frequency distribution of positive weight function values in the experimental group.
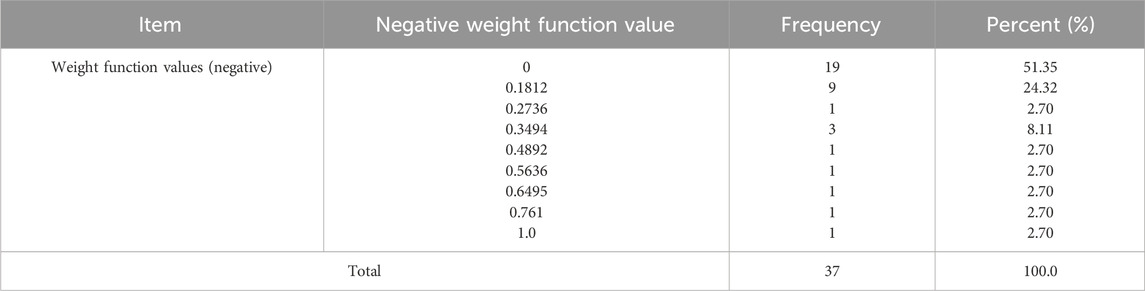
Table 20. Frequency distribution of negative weight function values in the experimental group.
In the negative weight function, the highest weight value is 0.5636, corresponding to the blue area 7, indicating that participants were extremely concerned about the failure probability for this escape area. The lowest weight value is 0, corresponding to the blue-green area 2, suggesting that participants were not at all concerned about the failure probability for this area. Most of the weight values fall between 0.1812 and 0.2736, indicating that, with the protective guidance, most participants were calm in their evaluation of failure avoidance.
By comparing the weight function data for both the blank group and the experimental group, it is evident that the protective guidance significantly influenced participants’ risk perception and decision-making behavior. With the assistance of the earthquake early warning information, participants in the experimental group were able to make safer choices, showing optimism in assessing the success of avoidance and calmness in evaluating failure avoidance. This demonstrates that protective guidance can effectively improve the quality of decision-making and safety during emergencies, enhancing participants’ confidence and their ability to make decisions with a cooler head.
5.11 Calculation of prospect value
By determining the value functions and weight functions for the blank group and the experimental group, we can calculate the prospect values. A comparison of the prospect values between the two groups reveals which group has a higher prospect value. The group with the higher prospect value is considered more valuable and is deemed more preferable for adoption. The mathematical expression for the prospect value is as follows:
The prospect values for both the experimental group and the control group are shown in Tables 21 and 22. The highest prospect value for both groups is 3.3870, corresponding to the most accurate decision in the turquoise-colored Zone 2. This indicates that under optimal conditions, the decision values of participants are the same in both groups. The lowest prospect value for both the experimental and control groups is −9.2742, corresponding to the most inaccurate decision in the gray-colored Zone 1. This suggests that, in the worst-case scenario, some participants’ decision outcomes are similar, regardless of whether protective guidance is provided.
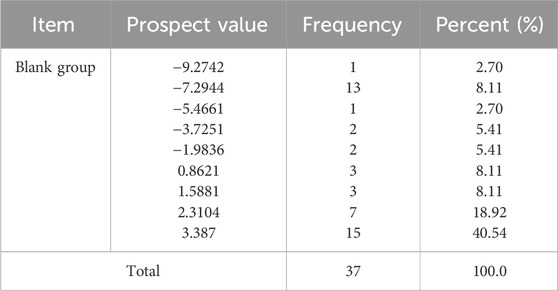
Table 21. Frequency distribution of prospect values in the blank group.
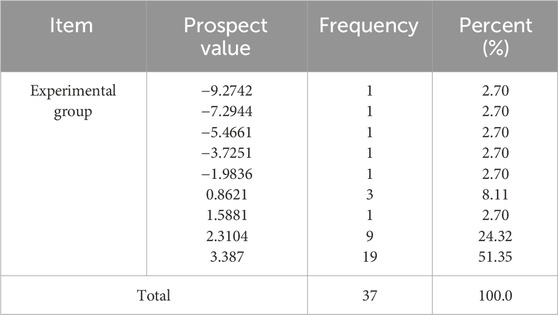
Table 22. Frequency distribution of prospect values in the experimental group.
Furthermore, as shown in Figure 13, the prospect values of the control group are concentrated around 1.0000, while the prospect values of the experimental group are mostly between 2.3104 and 3.3870. The prospect values of the experimental group are generally higher than those of the control group, with a more concentrated distribution. This indicates that the protective guidance improved the participants’ decision value and reduced the variability of their decision outcomes. It reflects the role of protective guidance in enhancing decision consistency and quality, as participants were able to more consistently choose safer avoidance areas with the assistance of the guidance.
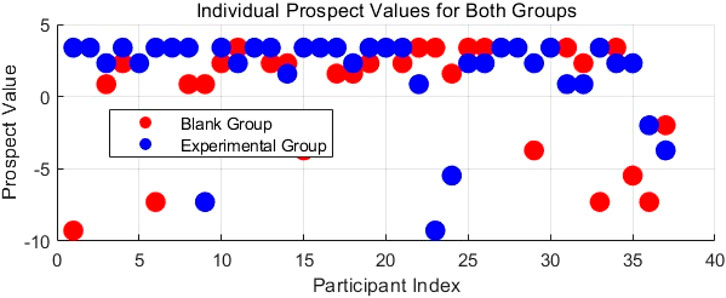
Figure 13. Individual prospect values for the control group and the experimental group.
The average prospect values for both the experimental group and the control group are shown in Figure 14. The mean prospect value for the experimental group (1.6643) is significantly higher than that of the control group (0.7105), indicating that the information design in the experimental group was more valuable and more effective than that of the control group.
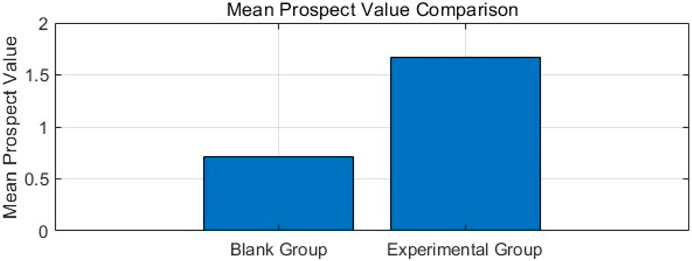
Figure 14. Comparison of mean prospect values between the control group and the experimental group.
In conclusion, the protective guidance played an important role in improving the decision quality and safety of individuals in emergency situations. Providing text-based protective guidance for avoidance significantly enhanced participants’ risk assessment abilities and decision-making efficiency, leading to better choices in urgent situations. These findings provide strong evidence for the design of effective early warning systems and protective guidance.
6 Discussion
This experiment employed immersive Virtual Reality (VR) technology and Prospect Theory to examine the effectiveness of indoor earthquake early warning (EEW) message design. By simulating an earthquake scenario indoors, we evaluated how EEW messages influence participants’ behavior and risk perception. Results showed that such messages significantly affected decision-making, particularly in the choice of avoidance areas. This highlights the importance of well-designed EEW messages in guiding appropriate actions during emergencies.
Using Prospect Theory, we analyzed participants’ perceived value of different avoidance options. The value function revealed how individuals make decisions under uncertainty, balancing potential gains and losses. Despite receiving the same information beforehand, participants showed distinct differences in behavior and choices, likely due to personal background, experience, and risk perception. These findings suggest that EEW messages should be tailored to account for diverse audience characteristics.
The study also examined emotional responses to EEW design. In high-stress situations, anxiety can influence decisions. While EEW messages increased anxiety, they also encouraged information-seeking behavior. This suggests that EEW design should carefully balance urgency with emotional impact to avoid unnecessary panic.
6.1 Limitations and implications
Immersive VR system cannot fully replicate the psychological and physiological stress individuals experience during real earthquakes, which may lead participants to respond more calmly and rationally, potentially influencing behavioral outcomes. To address this limitation, future research could incorporate multisensory feedback to enhance the sense of presence or combine VR experiments with real-world data or post-earthquake surveys to validate the findings.
Moreover, although 83.8% of participants noticed the guidance and 70.3% found it helpful, the accuracy increase was only around 11%. This suggests a gap between subjective perception and actual behavioral improvement. One reason may be that participants relied on prior intuition—accuracy in the control group was also high (75.7%). Additionally, the experimental group took longer to react, indicating increased cognitive load when processing the guidance. These findings imply that well-intentioned messages may not lead to better actions under time pressure. Future design should simplify content and explore multi-modal formats to improve both understanding and response efficiency.
This study employs the fixed parameter values proposed by Kahneman and Tversky (1979) (α = 0.88, β = 0.88, λ = 2.25) as benchmark parameters. This methodological choice not only maintains comparability with classical studies but also ensures baseline consistency for comparisons across different experimental groups. However, it should be noted that this parameter setting approach has three main limitations: First, the fixed parameters may not fully capture the risk preference characteristics of specific subject groups; second, the method inadequately considers the sensitivity to temporal dynamics and contextual factors; and third, fixed parameters may obscure decision-making pattern differences among subgroups. Future research should employ stratified sampling combined with ML-based dynamic calibration to develop subgroup-specific models for more accurate risk preference characterization across populations.
Although Unreal Engine 5’s box collision simulation can achieve visual dynamic effects, it does not account for actual soil-structure interaction (e.g., soil-foundation co-vibration) or cumulative inelastic deformation effects during real earthquakes. Future improvements will incorporate finite element coupling models (e.g., OpenSees) to enhance physical fidelity.
This study has constraints in disciplinary integration, particularly the lack of seismological expertise, which may limit the interpretation of complex wavefield interaction mechanisms. Subsequent experiments should consider including seismodynamics specialists.
The selected parameters inherently exhibit variability - the 3–5 Hz frequency band and 0.2 g PGA can only approximate specific seismic scenarios (e.g., shallow near-field earthquakes), while actual hazard perception may systematically deviate due to coupled effects of variables like hypocenter depth and radiation patterns. Therefore, future research should develop multi-parameter perturbation models to effectively expand scenario coverage.
While the current study recognizes limitations in assessing false-alarm impacts—where the societal sensitivity of false alarm rates manifests both technically through emergency resource misallocation and socially through eroded public trust—future research will implement dynamic threshold algorithms and tiered response protocols to enhance control efficacy of this critical parameter.
7 Conclusion
In this study, we used Virtual Reality (VR) technology to create a simulated environment for earthquake early warning (EEW) messages, aiming to explore how these messages influence people’s emergency responses. The experimental results show that the presentation of earthquake early warning information can effectively capture participants’ attention and prompt them to make avoidance decisions, thereby confirming the importance of warning guidance in indoor earthquake emergency situations.
Furthermore, while the earthquake early warning information was highly effective in increasing participants’ sense of urgency, some participants exhibited relatively low levels of recall of the information. This indicates the need to focus more on making warning messages more attention-grabbing and memorable in future designs.
This study underscores the necessity of optimizing the design of earthquake early warning messages to ensure that, in the event of an actual earthquake, these messages can more effectively guide people to take protective actions, thereby reducing the risks associated with the disaster. In future research, we hope to further improve the practicality and impact of earthquake early warning information through continued studies and design refinements, contributing to enhanced public safety awareness and emergency preparedness.
Data availability statement
The original contributions presented in the study are included in the article/supplementary material, further inquiries can be directed to the corresponding authors.
Ethics statement
The studies involving humans were approved by Ethics Review Form for Human Studies of BJFU. The studies were conducted in accordance with the local legislation and institutional requirements. The participants provided their written informed consent to participate in this study. Written informed consent was obtained from the individual(s) for the publication of any potentially identifiable images or data included in this article.
Author contributions
QL: Investigation, Formal Analysis, Software, Data curation, Writing – review and editing, Writing – original draft, Resources, Methodology, Conceptualization, Visualization, Project administration. PH: Funding acquisition, Resources, Writing – review and editing, Supervision, Conceptualization. ZH: Conceptualization, Resources, Writing – review and editing, Visualization, Data curation, Supervision. ZW: Resources, Writing – review and editing, Project administration, Methodology. YW: Writing – review and editing, Methodology, Funding acquisition.
Funding
The author(s) declare that no financial support was received for the research and/or publication of this article.
Acknowledgments
The authors thank Peng Han, Vice Dean of the School of Art and Design at Beijing Forestry University, for the technical support provided.
Conflict of interest
The authors declare that the research was conducted in the absence of any commercial or financial relationships that could be construed as a potential conflict of interest.
Generative AI statement
The author(s) declare that no Generative AI was used in the creation of this manuscript.
Any alternative text (alt text) provided alongside figures in this article has been generated by Frontiers with the support of artificial intelligence and reasonable efforts have been made to ensure accuracy, including review by the authors wherever possible. If you identify any issues, please contact us.
Publisher’s note
All claims expressed in this article are solely those of the authors and do not necessarily represent those of their affiliated organizations, or those of the publisher, the editors and the reviewers. Any product that may be evaluated in this article, or claim that may be made by its manufacturer, is not guaranteed or endorsed by the publisher.
References
Ahn, A. Y. E., Takikawa, H., Maly, E., Bostrom, A., Kuriyama, S., Matsubara, H., et al. (2021). Perception of earthquake risks and disaster prevention awareness: a comparison of resident surveys in sendai, Japan and Seattle, WA, USA. Int. J. Disaster Risk Reduct. 66, 102624. doi:10.1016/j.ijdrr.2021.102624
Allen, R. M., and Melgar, D. (2019). Earthquake early warning: advances, scientific challenges, and societal needs. Annu. Rev. Earth Planet. Sci. 47 (1), 361–388. doi:10.1146/annurev-earth-053018-060457
Alnoman, A., Khwaja, A. S., Anpalagan, A., and Woungang, I. (2024). Emerging AI and 6G-Based user localization technologies for emergencies and disasters. IEEE Access 12, 197877–197906. doi:10.1109/access.2024.3521005
Bernabei, M., Colabianchi, S., Carli, M., Costantino, F., Ferrarotti, A., Neri, M., et al. (2024). Enhancing occupational safety and health training: a guideline for virtual reality integration. IEEE Access 12, 154349–154364. doi:10.1109/access.2024.3481668
Bernardini, G., Quagliarini, E., and D’Orazio, M. (2018). Investigating exposure in historical scenarios: how people behave in fires, earthquakes and floods. Descartes, France: Rilem bookseries, 1138–1151. doi:10.1007/978-3-319-99441-3_123
Bordoni, P., Haines, J., Milana, G., Marcucci, S., Cara, F., and Giulio, G. D. (2011). Seismic response of L’Aquila downtown from comparison between 2D synthetics spectral ratios of SH, P-SV and Rayleigh waves and observations of the 2009 earthquake sequence. Bull. Earthq. Eng. 9 (3), 761–781. doi:10.1007/s10518-011-9247-5
Catalan, P. A., Gubler, A., Cañas, J., Zuñiga, C., Zelaya, C., Pizarro, L., et al. (2020). Design and operational implementation of the integrated tsunami forecast and warning system in Chile (SIPAT). Coast. Eng. J. 62 (3), 373–388. doi:10.1080/21664250.2020.1727402
Chou, C.-Y., Lin, S.-Y., Yang, C.-T., and Hsu, Y.-T. (2021). Risk perception of earthquakes: modeling conception of willingness to pay and prospect theory. SSRN Electron. J. doi:10.2139/ssrn.3995116
Colombelli, S., Carotenuto, F., Elia, L., and Zollo, A. (2020). Design and implementation of a mobile device app for network-based earthquake early warning systems (EEWSs): application to the PRESTo EEWS in southern Italy. Nat. Hazards Earth Syst. Sci. 20 (4), 921–931. doi:10.5194/nhess-20-921-2020
Feng, Z., González, V. A., Amor, R., Spearpoint, M., Thomas, J., Sacks, R., et al. (2020). An immersive virtual reality serious game to enhance earthquake behavioral responses and post-earthquake evacuation preparedness in buildings. Adv. Eng. Inf. 45, 101118. doi:10.1016/j.aei.2020.101118
He, Z., Han, P., Chen, Z., Liang, Y., Yang, Z., and Li, T. (2023). Evaluating the effectiveness of the earthquake early warning message in China: an affordance perspective using immersive virtual reality. Sustainability 15 (14), 10874. doi:10.3390/su151410874
Huang, Y., Zhang, J., Zhang, L., Ming, Z., He, H., Chen, R., et al. (2023). How spatial resolution of remote sensing image affects earthquake triggered landslide detection: an example from 2022 luding earthquake, Sichuan, China. Land 12 (3), 681. doi:10.3390/land12030681
Jang, L.-J., Wang, J.-J., Paton, D., and Tsai, N.-Y. (2015). Cross-cultural comparisons between the earthquake preparedness models of Taiwan and New Zealand. Disasters 40 (2), 327–345. doi:10.1111/disa.12144
Kahneman, D., and Tversky, A. (1979). Prospect theory: an Analysis of decision under risk. Econometrica 47 (2), 263–292. doi:10.2307/1914185
Kellogg, L. H., Bawden, G. W., Bernardin, T., Billen, M., Cowgill, E., Hamann, B., et al. (2008). Interactive visualization to advance earthquake simulation. Pure Appl. Geophys. 165 (3-4), 621–633. doi:10.1007/s00024-008-0317-9
Levy, J. S. (1992). An introduction to prospect theory. Int. Soc. Political Psychol. 13 (2), 171–186. Available online at: https://www.jstor.org/stable/3791677.
Levy, J. S. (1997). Prospect theory, rational choice, and international relations. Int. Stud. Q. 41 (1), 87–112. doi:10.1111/0020-8833.00034
Liu, P., Jin, F., Zhang, X., Su, Y., and Wang, M. (2011). Research on the multi-attribute decision-making under risk with interval probability based on prospect theory and the uncertain linguistic variables. Knowledge-Based Syst. 24 (4), 554–561. doi:10.1016/j.knosys.2011.01.010
Loewenstein, G. F., Weber, E. U., Hsee, C. K., and Welch, N. (2001). Risk as feelings. Psychol. Bull. 127 (2), 267–286. doi:10.1037//0033-2909.127.2.267
Lv, X., Liao, Y., and Deng, L. (2018). Natural disaster emergency rescue System based on the Mobile phone’s high-precision positioning. IEEE Xplore, 797–801. doi:10.1109/ICIVC.2018.8492850
Mahmud, S., Awal, A. F., and Kim, J.-H. (2024). ATR HarmoniSAR: a System for enhancing victim detection in robot-assisted disaster scenarios. IEEE Access, 1. doi:10.1109/access.2024.3514856
Meng, J., and Weng, X. (2018). Can prospect theory explain the disposition effect? A new perspective on reference points. Manag. Sci. 64 (7), 3331–3351. doi:10.1287/mnsc.2016.2711
Nguyen, V. T., Jung, K., and Dang, T. (2019). “VRescuer: a virtual reality application for disaster response training,” in 2019 IEEE international conference on artificial intelligence and virtual reality (AIVR). doi:10.1109/aivr46125.2019.00042
Noprisson, H. (2021). Earthquake Early Warning (EEW) System: system Architecture, data modelling, and user interface design. Int. J. Sci. Res. Comput. Sci. Eng. Inf. Technol., 650–657. doi:10.32628/cseit2173136
Papatheodorou, K., Theodoulidis, N., Klimis, N., Zulfikar, C., Vintila, D., Cardanet, V., et al. (2023). Rapid earthquake damage assessment and education to improve earthquake response efficiency and community resilience. Sustainability 15 (24), 16603. doi:10.3390/su152416603
Paton, D., Bajek, R., Okada, N., and McIvor, D. (2010). Predicting community earthquake preparedness: a cross-cultural comparison of Japan and New Zealand. Nat. Hazards 54 (3), 765–781. doi:10.1007/s11069-010-9500-2
Prietzel, T. T. (2019). The effect of emotion on risky decision making in the context of prospect theory: a comprehensive literature review. Manag. Rev. Q. 70, 313–353. doi:10.1007/s11301-019-00169-2
Rajabi, M. S., Taghaddos, H., and Zahrai, S. M. (2022). Improving emergency training for earthquakes through immersive virtual environments and anxiety tests: a case Study. Buildings 12 (11), 1850. doi:10.3390/buildings12111850
Santos-Reyes, J. (2019). How useful are earthquake early warnings? The case of the 2017 earthquakes in Mexico city. Int. J. Disaster Risk Reduct. 40, 101148. doi:10.1016/j.ijdrr.2019.101148
Schwartz, A., Goldberg, J., and Hazen, G. (2008). Prospect theory, reference points, and health decisions. Judgm. Decis. Mak. 3 (2), 174–180. doi:10.1017/s1930297500001510
Sun, B., and Zhang, G. (2010). The Wenchuan earthquake creation of a rich database of building performance. Sci. China Technol. Sci. 53 (10), 2668–2680. doi:10.1007/s11431-010-4082-5
Sun, B., Yu, J., and Yan, P. (2017). The safety evaluation of earthquake emergency shelter based on the finite element analysis. AIP Conf. Proc. 1864, 020072. doi:10.1063/1.4992889
Takagi, J., and Wada, A. (2019). Recent earthquakes and the need for a new philosophy for earthquake-resistant design. Soil Dyn. Earthq. Eng. 119, 499–507. doi:10.1016/j.soildyn.2017.11.024
Uchida, N., and Bürgmann, R. (2021). A decade of lessons learned from the 2011 Tohoku-oki earthquake. Rev. Geophys. 59 (2), e2020RG000713. doi:10.1029/2020rg000713
Ugur, E., and Konukseven, B. O. (2022). The potential use of virtual reality in vestibular rehabilitation of motion sickness. Auris Nasus Larynx 49, 768–781. doi:10.1016/j.anl.2022.01.012
Velazquez, O., Pescaroli, G., Cremen, G., and Galasso, C. (2020). A review of the technical and socio-organizational components of earthquake early warning systems. Front. Earth Sci. 8, 533498. doi:10.3389/feart.2020.533498
Weinstein, N. D., Lyon, J. E., Rothman, A. J., and Cuite, C. L. (2000). Preoccupation and affect as predictors of protective action following natural disaster. Br. J. Health Psychol. 5 (4), 351–363. doi:10.1348/135910700168973
Yan, C., Wu, T., Huang, K., He, J., Liu, H., Hong, Y., et al. (2021). The application of virtual reality in cervical spinal surgery: a review. World Neurosurg. 145, 108–113. doi:10.1016/j.wneu.2020.09.040
Keywords: earthquake early warning information, text protective guidance, prospect theory, evacuation areas, virtual reality
Citation: Lu Q, Han P, He Z, Wang Z and Wang Y (2025) Application research on indoor earthquake early warning information design based on virtual simulation experiment. Front. Virtual Real. 6:1628344. doi: 10.3389/frvir.2025.1628344
Received: 14 May 2025; Accepted: 19 August 2025;
Published: 08 September 2025.
Edited by:
Laura Thomas, PARSEC Space, United KingdomReviewed by:
Reza Soleimanpour, Australian University - Kuwait, KuwaitBoyko Ranguelov, University of Mining and Geology “Saint Ivan Rilski”, Bulgaria
Copyright © 2025 Lu, Han, He, Wang and Wang. This is an open-access article distributed under the terms of the Creative Commons Attribution License (CC BY). The use, distribution or reproduction in other forums is permitted, provided the original author(s) and the copyright owner(s) are credited and that the original publication in this journal is cited, in accordance with accepted academic practice. No use, distribution or reproduction is permitted which does not comply with these terms.
*Correspondence: Peng Han, aGFucGVuZ2Rlc2lnbkAxNjMuY29t