 Faren Huo
 Rubanka Alla
- 1Faculty of Arts and Fashion, Kyiv National University of Technologies and Design, Kyiv, Ukraine
- 2School of Art and Design, Shanxi University of Science and Technology, Xi’an, China
Augmented Reality Head-Up Displays (AR HUDs) have been shown to enhance drivers’ performance and road safety. However, with the growing attention to trust in automated driving systems, excessive reliance on automation may lead to complacency and dependency. This study therefore aimed to examine how drivers with different levels of experience depend on AR warning messages under varying environmental conditions (daytime vs. nighttime urban driving) and to propose strategies for optimizing AR warning interaction design. A before-and-after comparative experimental design was employed. Participants completed driving tasks involving a typical urban hazard—pedestrians suddenly running into the road—under two conditions: (1) without AR warning messages and (2) with an induced random AR warning failure in an AR message environment. The perceived time-to-pedestrian values were analyzed to quantify driving dependence. Participants were divided into experienced and novice driver groups, and the effects of driving experience and lighting condition were examined. Objectively, both experienced and novice drivers’ dependence on AR warning messages was primarily influenced by the driving environment. Under high-load conditions such as nighttime driving, both groups maintained higher attention and exhibited minimal dependence on AR warnings. Under lower-load daytime conditions, dependence varied by driving experience: experienced drivers remained self-reliant due to ingrained driving habits and situational awareness, while novice drivers displayed increased relaxation and dependence on AR cues. Subjectively, drivers’ perceived dependence and anticipation of AR warnings correlated more strongly with the perceived intrusiveness of the AR system than with its effectiveness. These findings suggest that dependence on AR HUD warning messages is a complex interaction between environmental load, user experience, and perceived system intrusiveness. To mitigate automation complacency, future AR HUD design should tailor warning strategies according to user experience levels and driving context. The study provides practical insights for optimizing AR interaction design and highlights directions for future research to address additional urban driving risks.
1 Introduction
With the rapid advancement of the automotive industry, manufacturers are increasingly committed to developing vehicles that are faster, more powerful, and offer superior handling (Kelly, 2025; Tsoi et al., 2023), while simultaneously achieving lower noise levels and greater environmental sustainability (Arenas, 2025; Tsoi et al., 2023). In the context of intense market competition, enhancing the driving and riding experience has also become a critical focus (Kelly, 2025). As electrification and intelligentization continue to progress, the intelligent cockpit has emerged as a pivotal element in the evolutionary trajectory of vehicle intelligence. This transformation is driven by three main components: in-vehicle and out-of-vehicle environment perception, multi-modal human-computer interaction solutions (including visual and auditory systems), and vehicle networking that integrates sensory computing. Within this framework, a key aspect of human-computer interaction is the in-vehicle augmented reality head-up display (AR HUD) system, which is considered crucial hardware for realizing vehicle intelligence, Internet connectivity, and advanced in-vehicle interaction. AR HUD technology projects essential driving information directly into the real-world driving environment, thereby enhancing the driver’s experience and road safety (Bauerfeind et al., 2022; Manchon et al., 2023; Zhou et al., 2024). This advantage is particularly evident in complex driving scenarios such as urban roads, mountain paths, and highways, which explains its widespread adoption in the automotive industry.
AR HUD is a display of in-vehicle interactive information, including basic vehicle information, navigation information, and AR warning information (Beck and Park, 2018). The AR warning information in the AR HUD system, as a deep fusion technology of advanced assisted driving system (ADAS) and AR HUD in the intelligent cockpit, aims to visualize the warning information of ADAS in the driver’s field of view through projection technology to improve driving safety and information transmission effect (Herbert et al., 2017). For example, it can project real-time warning messages such as pedestrian dangers on both sides of the road, unexpected conditions at intersections, and collision risks of vehicles ahead. Especially in urban driving environments, these warning messages are displayed in the driver’s field of vision through virtual means, enabling him or her to more intuitively perceive the complex and changing potential dangers and obstacles in urban roads, thus reducing the driver’s driving load and tension, and thus enhancing road safety and driving experience (Charissis et al., 2021). The AR warning message is a powerful tool that can be utilized to improve road safety and driving experience. Therefore, research on AR warning messages is being conducted to meet the growing demand for automotive smart cockpits and the increasing complexity of urban traffic environments.
Against the backdrop of the continuous improvement of automated driving and AR technologies and the related human factors and ergonomics research, trust as a determinant of the use and misuse of automated technologies (Manchon et al., 2023) that has received extensive attention from researchers, You et al. (2023) in their study, a novel invisible hazard warning system was designed to thoroughly investigate the effects of AR warning messages on safe driving in two typical driving scenarios. The results show that the design significantly improves drivers’ situational awareness and reaction time in human and autonomous driving modes and enhances human drivers’ trust in the autonomous driving system. Xia et al. (2023) In an empirical study on the factors influencing users’ willingness to use in -vehicle AR HUD, it was found that perceived trust, as a mediating role of social influence, will affect drivers’ willingness to use AR HUD Li et al. (2022) investigated the issue of AR HUD acceptance in the internet environment. The analysis based on the technology acceptance model (MTM) showed that driver’s trust positively affects perceived usefulness, attitude and intention to use AR HUD.
While most researchers have focused on the potential benefits of trust in enhancing driver use of AR technology, however Liu (2023), in his study, pointed out that automation complacency (also known as “automation over-reliance” is a typical automation-induced human factors risk, which means that excessive trust in automation during automation use may pose a driving hazard during driving. Moderate trust allows users to take full advantage of technology’s convenience and safety benefits, enhancing system effectiveness and user satisfaction. In contrast, excessive trust often results in dependence on the automated system (Kaur and Rampersad, 2018), especially in urgent and dangerous situations encountered while driving (Meyer and Ward, 2013), due to unfamiliarity and nervousness about the current driving scenario will lead to a stronger reliance on AR warning messages by drivers, for example,. Hwang et al. (2016) found a significant result in their study on the effect of AR HUD system use on drivers’ risk perception and psychological changes regarding pedestrian hazard stimuli, and in their controlled experiment found that the reaction time of drivers participating in the control group (no AR HUD) was faster than that of drivers in the group using in -vehicle AR HUD hazard warning messages. The authors analyzed this as an indication that drivers may rely on the in-vehicle AR HUD system to provide TTC-level-based AR warning messages about prevention and hazardous situations. Therefore, in the course of AR HUD research, it is necessary to focus not only on the issue of driver trust in AR technology but also to go further and focus on the issue of trust calibration (Hoff and Bashir, 2015), that is, the question of whether drivers may develop excessive trust in the AR system and thus dependence during autonomous driving.
2 Related work
2.1 Dependency-related studies
Dependence is the degree of dependence or association of a thing or variable on other matters or variables (Wang, 2024). In the context of vehicle driving, driving dependence is a multidimensional concept that covers not only the driver’s dependence on the vehicle itself, such as vehicle control systems and assistive driving technologies but also dependence on the road environment and traffic condition (Guo et al., 2019). Driving dependence reflects drivers’ cognitive and affective states during driving and is a key indicator for assessing the effectiveness of drivers’ interaction with the driving environment.
In recent years, research on the application of Augmented Reality Heads-Up Display (AR HUD) and AR warning messages in autonomous driving technologies has attracted much attention. These technologies improve driving safety and user experience by overlaying virtual information in the driver’s field of view. For example, Jiang and Guo (2023) designed a two-layer virtual image display system to optimize driver concentration in complex traffic environments. However, the problem of driver dependence on these technologies due to over-trust may result in drivers not being able to take over control in time in case of system failure (Reinmueller et al., 2018), which increases safety risks.
The issue of driving dependence has been compounded with the development of autonomous driving technologies. Valentine et al. (2021) explored the application of trust calibration in autonomous driving systems, emphasizing the importance of ensuring that user trust matches its actual reliability. Thus, rational trust calibration plays a key role in managing driving dependence. By adjusting the user’s level of trust in the system to match the actual performance and reliability of the system, dependency creation or insufficient trust can be avoided.
Appropriate trust calibration not only helps to increase drivers’ satisfaction with assistive driving technologies but also optimizes their decision-making and reaction abilities in complex road environments, avoids driving dependence, and ensures driving safety and technology effectiveness. However, specifically when using AR warning messages in urban driving scenarios, the dependency problem has its unique challenges and manifestations, and future research should further explore the dependency problem when using AR warning messages in urban driving scenarios to improve the safety and effectiveness of technology applications.
2.2 Dependency issues when using AR warning messages in urban driving scenarios
The existence of this potential dependence is particularly fatal in urban driving environments. The urban traffic environment, closely related to people’s daily travel, is becoming increasingly complex and volatile as urbanization continues. This trend is not only reflected in the increase in traffic flow but also in the diverse road users, including pedestrians, bicyclists, etc. (Gao et al., 2023), whose behaviors add uncertainty and risk to the urban transportation system, making it often necessary for drivers to be highly vigilant on busy streets. Thus,if and when drivers become aware of the adaptive nature of the AR warning information system during urban driving and therefore rely on the expected system behavior, occasional false alerts or system failures due to the system’s incorrect prediction of the complex and changing driving risk profile in the city may lead to critical situation (Reinmueller et al., 2018).
However, it is unclear in the current study how drivers rely on AR warning messages in different urban driving scenarios (Hwang et al., 2016). By understanding the differences in drivers’ dependence on AR warning messages in different urban driving scenarios, it is possible to understand better drivers’ driving cognition and state of mind during urban driving scenarios, which can help to improve the scientific and targeted design and application of AR warning messages in different urban driving scenarios, and then improve drivers’ driving experience and safety perception so that the human-caused risk problems caused by automated dependence can be avoided or reduced. This will help to avoid or minimize the human-caused risks caused by automation dependence.
Therefore, this study aims to provide insights into the differences in drivers’ reliance on AR warning messages in different urban driving scenarios and how this reliance affects their driving behavior and safety. Meanwhile, it has been found in past studies that drivers with different driving experiences have different driving skills, cognitive processing abilities, and adaptive abilities to new technologies (Ge et al., 2017), which will affect their different driving performance in the same driving environment. Typically, experienced drivers may be more confident, calm, and likely to cope with situations, whereas inexperienced drivers may need more time to adapt to new driving scenarios (Li et al., 2020). All these differences may affect drivers’ perceived trust and reliance on in -vehicle technologies, such as AR warning messages in different scenarios. Thus, this paper includes driving experience as one of the variables in the study of reliance differences in urban driving scenarios.
In the course of the study, the following research question (RQ) was considered:
Experiment 1:
1a. Do AR warning messages significantly improve drivers’ time to perceive pedestrian hazards in urban daytime and nighttime driving scenarios?
1b. Experienced and inexperienced drivers’ time to perceive pedestrian hazards in urban daytime and nighttime contexts without AR warning messages?
1c. Is there a significant difference between experienced and inexperienced drivers’ perception time of dangerous pedestrians in urban daytime and nighttime driving scenarios?
Experiment 2:
2a. How do experienced and inexperienced drivers subjectively perceive AR warning messages during daytime and nighttime, respectively?
2b. How long did experienced and novice drivers, after familiarizing themselves with the presence of AR warning messages, perceive that sub-pedestrian hazard in urban daytime and nighttime driving scenarios, respectively, when the warning system randomly malfunctioned (AR warning messages did not appear in time for the pedestrian hazard to appear)?
2c. Is there a significant difference between experienced and novice drivers comparing the hazard perception times studied in Experiment 1c with those studied in Experiment 2b?
3 Experimental design
Driving dependence, as an implicit emotional state of drivers during driving, is often difficult to quantify directly through conventional performance data. To more accurately assess the degree of driver dependence on AR warning messages, an innovative experimental design was used in this study. Based on existing research methods, the authors designed a two-stage comparison experiment (Figure 1). Pedestrian run-out was selected as a typical urban driving hazard scenario (Figures 2a,b) (Cheng et al., 2023; Wetton et al., 2011). Two experiments before and after Experiment 1 and Experiment 2 the authorsre conducted in a laboratory-simulated driving environment, and eye movement data the authorsre collected using a Tobii Glass 3 head-mounted eye - tracker.

Figure 1. Based on the existing research methods, the authors designed a two-stage simulation driving comparison experiment.

Figure 2. Design of pedestrian danger scenarios in urban driving scenarios during the day and night.
After the experiment, the perceived time data of pedestrian run -out hazards from the before and after experiments the authorsre compared and used to analyze the differences in the reliance on pedestrian run -out, an AR warning message, by drivers with different driving experiences in urban driving environments, Considering the influence of environmental factors, the authors specifically designed two different experimental themes: urban daytime and urban nighttime (Figures 2a,b) further to deepen the depth and breadth of the study.
3.1 Experiment 1 design
Based on the urban pedestrian run-out hazard scenario designed in Figure 2, an experiment was designed as shown in Figure 3, where the driver drove the self-driving car at a speed of 50 km/h in an urban road,and based on the TTC (Time-To-Collision) level setting of 2.5 s when the vehicle was about 34.72 m away from the pedestrian run-out location, the pedestrians in the AR group were accompanied by an AR warning message that flashing message. At the same time, there was no AR warning message in the control group. To control the randomness and outliers of the experimental data, this experiment set up two random appearances of pedestrians rushing out in each video. The average of the two pedestrian hazard perception times was used as the hazard perception time of that subject in that scene after the experiment.

Figure 3. Design an experimental logic diagram for comparing the hazard perception time between theAR group and the control group, and collecting the hazard perception time of the control group for subsequent comparison.
In the AR group, the authors collected hazard perception time A and B and took their mean value as hazard perception time 1. In the control group, the authors collected hazard perception time C and hazard perception time D and took their mean value as hazard perception time 2 (similarly, the authors can get the data of hazard perception time 3 and hazard perception time 4 in Figure 1 in the urban nighttime scenario). In Experiment 1, the authors first analyzed the significant difference between hazard perception time 1, 3, and hazard perception time 2, 4, respectively, to evaluate the usability of the AR warning information system designed in this study in the simulated driving scenario. Secondly, the average daytime hazard perception time M and the average nighttime hazard perception time N of 50% of experienced drivers and the average daytime hazard perception time P and the average nighttime hazard perception time Q of 50% of inexperienced drivers in the control group the authorsre obtained separately (Figure 4), which the authorsre used to compare with the pedestrian hazard perception time during the malfunctioning of the AR warning message in Experiment 2.

Figure 4. The average hazard perception time M and hazard perception time N of 50% of experienced drivers and 50% of novice drivers in the control group.
3.2 Experiment 2 design
The experimental design for Experiment 2 is shown in Figure 5, with the same basic scenario elements and pedestrian hazard principles as in Figure 3. In Experiment 2, the authors designed three pedestrian run-outs, and on one random occasion, when a pedestrian hazard appeared, the vehicle’s AR warning message did not appear due to a malfunction. The remaining two pedestrian hazards the authorsre accompanied by AR warning messages that appeared on time.

Figure 5. Experiment 2 logic diagram: Among the three randomly occurring pedestrian hazards, there is one AR warning message malfunction. The authors need to obtain the driver’s perception time of pedestrian hazards in the AR environment when the AR malfunction occurs.
The main purpose of Experiment 2 was to collect the perceived time of experienced drivers for pedestrian danger during random AR warning message failures 6 and the perceived time of novice drivers for danglperception 5 (similarly, the perceived time of danger 7 and the perceived time of danger 8 in Figure 5 can be obtained as the data for urban nighttime scenarios). Then, they are compared with the hazard perception times M and N and P and Q in Experiment 1, respectively, used to analyze the driver’s dependence on AR warning messages in the study.
4 Experiment 1
Experiment 1 used a between -subjects design in which subjects were divided into a control group (no AR warning message group) and an AR warning message group (the AR warning message would appear along with the pedestrian run-out hazard) to evaluate the usability of the AR warning information system designed in this study in a simulated driving scenario. The perception times of randomly run-out pedestrians by experienced and inexperienced drivers in the control group were also obtained separately and compared between the scenarios in an urban driving environment (urban daytime and nighttime).
4.1 Method and Materials
4.1.1 Participants
In the simulated driving experiment, a total of 52 subjects, 34 males and 18 females, ranging in age from 23 to 50 years, participated in the study. Experienced and novice drivers were included, with experienced drivers being those subjects who had driven a total of more than 50,000 km (Summala et al., 1998) or had held a driving license for more than 4 years (Navarro et al., 2023), as shown in Table 1. All subjects were in good health and mental state, with normal vision (including corrected vision) and no color blindness or color deficiency.

Table 1. Basic information of participants of experiment 1.
Since this experiment needs to obtain the perception time of experienced and inexperienced drivers to randomly run out of pedestrians, experienced and novice drivers were randomly assigned to the control group and the AR warning message group according to the proportion of 50% each, and the results of one - way analysis of variance (ANOVA) showed that there was no statistically significant difference between the two groups.
4.1.2 Appliances
The experiment was conducted on the driving simulation experimental platform in the Ergonomics Laboratory of Ningbo University (Figure 6), and the driving simulation software UC-winRoad version 16.0.4 was used for environment visualization as well as simulation of surrounding traffic and vehicle dynamics. A Logitech G29 force-feedback racing steering wheel, brake, and gas pedals were used as models for the driving simulator. The screen of the simulator is a 75-inch wall-mounted touchscreen all-in-one with a resolution of 1,980 × 1,024 px and a refresh rate of 60 Hz.

Figure 6. Experimental equipment for simulated driving.
In this experiment, the AR warning message of pedestrians rushing out was fused with a simulated driving scenario of pedestrian conflict through Adobe After Effects 2020 so that it was presented directly into the driving scenario and produced as a video with a resolution of 1,980 × 1,024 px. During the experimental driving, the experimenter was able to observe and communicate with the driver.
Driver gaze behavior was measured with a Tobii Glass 3 head-mounted eye-tracker (sampling rate 60 Hz tracking accuracy 0.5°). Subjects wearing glasses were corrected to normal vision by adding lenses to ensure high-quality gaze data; data were synchronized and recorded (60 Hz) using Tobi Pro Lab (×64) software.
4.1.3 Experimental material
Through an expert focus group, a thematic pedestrian run-out AR warning message design was screened, and the AR group subjects experienced its warning effects during urban daytime and nighttime (Figure 7).

Figure 7. The AR warning visuals (left) for the selected theme and the AR warning messages are displayed during the day (center) and at night (right) in the city.
In the experimental videos, the vehicle was traveling at 50 km/h in an urban simulated driving environment, and based on the TTC (Time-To-Collision) 2.5 s level setting when the vehicle was about 34.72 m away from the pedestrian washout location, the pedestrian was accompanied by the flashing of the AR warning message. To control the randomness and outliers of the experimental data, this experiment set up two random appearances of pedestrian washout in each video. The average of the two pedestrian hazard perception times was used as the hazard perception time of this subject in this scenario after the experiment.
4.1.4 Procedure
The whole experiment lasted about half an hour and was divided into two stages.
Initially, participants were received in the laboratory and provided with an overview of the study’s purpose and procedures. For the AR group, concise information about the AR warning message design and its role in hazard detection was presented, ensuring participants had baseline knowledge of the system. For the control group, only the general procedure of the experiment was introduced, and no information was given regarding the presence of AR warning messages to avoid bias. Participants then submitted signed informed consent and privacy agreements, and their demographic and driving background information was collected via a questionnaire. They adjusted their simulator seat position, familiarized themselves with the driving controls, and completed a brief practice session in a simulated urban environment to adapt to the experiment.
Following the familiarization, the experimenter corrected participants’ vision if necessary and calibrated the eye-tracker. Participants then completed the experimental tasks in a randomized order for urban daytime and nighttime scenarios. The perceived time to detect pedestrian hazards was recorded (Figure 3), and participants were instructed to verbally indicate hazard detection to increase cognitive load during the trials.
4.1.5 Analysis and statistics
The data collected from the experiment were analyzed in IBM SPSS Statistics 27 for descriptive and inferential statistics; in order to assess the effectiveness of AR warning messages in the driving scenarios designed for this experiment, independent samples t-tests were used to compare risk perception time 1 with risk perception time 2 and risk perception time 3 with risk perception time 4 in Figure 8, with a significance level of The risk perception time M and risk perception time N of 50% experienced drivers and 50% novice drivers in the control group during urban daytime and urban nighttime, respectively, were also categorized.

Figure 8. The logic flowchart for Experiment 1, which collected four sets of data on the perception time of pedestrians darting out in both the AR group and the control group, during the day and night in an urban setting.
Levene’s test was used to test for variance equivalence. Mann-Whitney U test will be used to analyze the data when the data does not conform to normal distribution because the t-test is robust enough to violate the assumption of normal distribution.
4.2 Results
4.2.1 Perceptual time
A Q-Q plot test for normal distribution was performed on the data from the two groups of subjects during urban daytime and urban nighttime, respectively, and after excluding the extremes, the vast majority of the data points closely followed the reference line, indicating that the four sets of data were essentially acceptable as normally distributed. Table 2 shows the mean hazard perception times for both groups of subjects during the daytime and nighttime in the city. Box plots of perceived time to pedestrian run-out hazards for both groups of subjects for both urban daytime and nighttime driving situations are shown in Figures 9a,b.
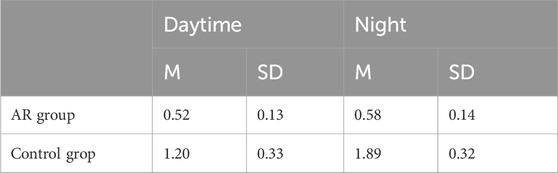
Table 2. Average hazard perception time.

Figure 9. Box plots ofthe perception time of pedestrians rushing out of danger in two groups of participants in both daytime and nighttime driving situations in the city.
In the daytime driving situation, the results showed that the mean hazard perception time (risk perception time 1) of the subjects in the AR warning message group was reduced by 130.77%, and the SD was reduced by 153.85% compared to the control group (risk perception time 2). The box plots showed that the mean risk perception time of the AR group was significantly lower than that of the control group. The box height lQR (interquartile range, lQR) was significantly lower than that of the control group, i.e., the degree of data fluctuation in the AR group was significantly less than that of the control group. In the nighttime condition, subjects in the AR warning message group had an average of 225.86% lower risk perception time (risk perception time 3) than the control group (risk perception time 4). They had a 128.57% reduction in SD. The box plots showed that the mean perception time of the AR group was significantly lower than that of the control group, and the box height lQR was significantly lower than that of the control group.
The results of the independent samples t-test for hazard perception time between the AR group and the control group are shown in Table 3. In the daytime driving scenario, p < 0.01 < 0.05, indicating that AR messages have a significant effect on drivers’ hazard perception time in urban daytime driving warning scenarios, i.e., the use of AR warning messages can significantly improve drivers’ perception time of pedestrian hazards in urban daytime scenarios. In the nighttime driving scenario, p < 0.01 < 0.05, indicating that the AR warning message has a significant effect on the driver’s hazard perception time in the urban nighttime driving scenario, i.e., the use of the AR warning message can significantly improve the driver’s perception time of pedestrian hazards in the urban nighttime scenario and the enhancement effect is better than that in the daytime driving scenario.

Table 3. Independent sample t-test for perception time about daytime and night.
The box plots shown in Figures 10a,b show the perceived time of pedestrian hazards in urban daytime and urban nighttime in the control and AR groups, and combined with the data shown in Table 2, it can be seen that in the control group, the perceived time of hazards in the nighttime driving scenarios increased by 57.5%. The SD decreased by 3.03% compared to the daytime driving scenarios. The box plots show that in the control group, the perceived danger time in urban daytime is significantly lower than in nighttime. In the AR group, the hazard perception time in the nighttime driving scenario increased by 11.54%, and SD increased by 7.69% compared to the daytime. The box plots show that the hazard perception time in the daytime driving scenario is slightly lower than the nighttime with the AR warning message.

Figure 10. The box plot shows the perception time of danger in the control group and the AR group during the day and night in the city.
Further, independent samples t-tests were conducted for the hazard perception time during daytime and nighttime for the control and AR groups, respectively, and the results are shown in Table 4. For the control group, p < 0.01 < 0.05, which indicates that in the absence of the AR warning message, the hazard perception time of the control subjects in the city during the daytime is significantly lower than that at night, proving that the driving performance of drivers under conventional driving conditions can be significantly different depending on the environment. In contrast, in the AR group, p = 0.092 > 0.05, there is no significant difference in the perceived time of pedestrian hazards between daytime and nighttime between subjects in the AR group under the condition of AR warning message-assisted driving.

Table 4. Independent sample t-test for perception time about AR group and control group.
4.2.2 Hazard perception time for experienced and novice drivers in the control group
To investigate the differences in comparing the reliance on AR warning messages between drivers with and without driving experience, the authors consciously controlled 50% of experienced drivers and 50% of novice drivers in the control group at the beginning of the experiment and their average perception time of pedestrian hazards in urban daytime and urban nighttime is shown in Table 5. The data show that in the daytime driving scenario, experienced drivers have 18.38% less time to perceive hazards and 28.21% less SD than novice drivers. In the nighttime driving scenario, experienced drivers had 50.00% less hazard perception time and 18.18% less SD than novice drivers. These data will be compared with the hazard perception data in Experiment 2 to analyze the dependence and differences in AR warning messages among drivers with different driving experiences.

Table 5. Control group perception time.
Moreover, by analyzing the box plots shown in Figure 11a, it was found that in the urban daytime driving scenario, the novice driver’s perception time of pedestrian hazards in the absence of AR warning information was slightly higher than that of the experienced driver. However, the box height lQR was significantly higher than that of the experienced driver, which indicated that the experienced driver’s performance of perception of pedestrian hazards in this scenario was more stable. Meanwhile, independent samples t-tests (Table 6) for experienced and novice drivers’ perceived times of urban daytime and nighttime hazards, respectively, showed that novice drivers’ perceived times of pedestrian hazards in daytime scenarios without AR warning. Messages were not significantly different from those of experienced drivers (p = 0.69 > 0.05).
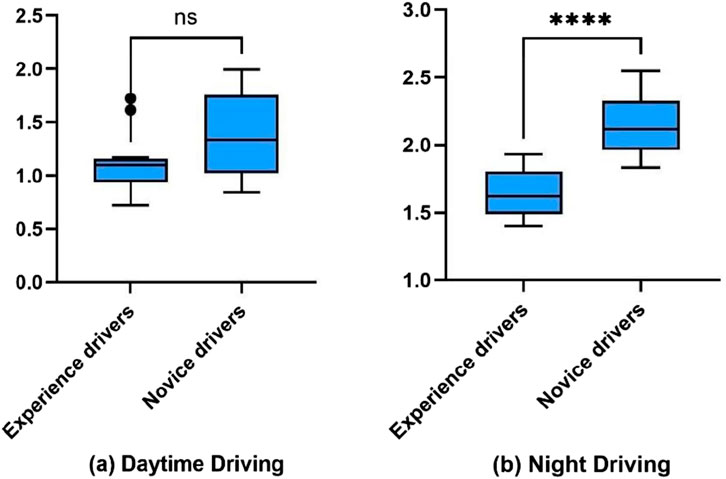
Figure 11. Box plot of the time when experienced and novice drivers perceive danger during the day and at night in the city, respectively.
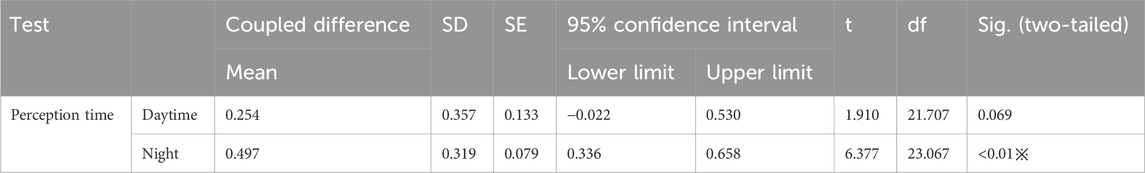
Table 6. Independent sample t-test for perception time about experience drives and novice drives.
Figure 11b box plots show that experienced drivers perceive pedestrian hazards in significantly less time than inexperienced drivers in the urban night driving scenario. The test results (Table 6) show that in the absence of AR warning messages, experienced drivers perceive pedestrian hazards in a similarly significantly lower time than experienced drivers (p < 0.01 < 0.05).
5 Experiment 2
Experiment 2 also took a between-subjects approach by dividing the subjects into a driving-experienced group and a novice group and obtaining their hazard perception time during a random AR warning message failure (AR warning message not present) in urban daytime and nighttime driving scenarios with the presence of an AR warning message, respectively. The purpose was to investigate the dependence and differences of drivers with different driving experiences on AR warning messages under different driving scenarios.
5.1 Method and materials
5.1.1 Participants
In this simulated driving experiment, a total of 36 subjects, 21 males and 15 females, ranging in age from 21 to 48 years old, participated in this study. Including experienced and novice drivers, experienced drivers were subjects who drove more than 50.000 kilo m or held a driver’s license for more than 4 years, as shown in Table 7. The screening range of all subjects was the same as that of Experiment 1, mostly students and teachers from Ningbo University were in good health and mental status, with normal vision (including corrected vision) and no color blindness or color weakness.

Table 7. Basic information of participants of experiment 2.
5.1.2 Appliances
Experiment 2 was also conducted on the driving simulation experimental platform in the Ergonomics Laboratory of Ningbo University (Figure 6), where the driving simulation software UC-winRoad version 16.0.4 was used for environment visualization and simulation of surrounding traffic and vehicle dynamics. A Logitech G29 force-feedback racing steering wheel, brake, and gas pedals were used as models for the driving simulator. The simulator’s screen is a 75-inch wall-mounted touchscreen all-in-one with a resolution of 1,980 × 1,024 px and a refresh rate of 60 Hz.
This experiment also fused the AR warning message of pedestrians rushing out with the simulated pedestrian conflict in the driving scenario through Adobe After Effects 2020. It was presented directly into the driving scenario and produced a video with a resolution of 1,980 × 1,024 px. The experimenter could observe and communicate with the driver during the experimental driving.
Driver gaze behavior was measured with a Tobii Glass 3 head-mounted eye-tracker (sampling rate 60 Hz tracking accuracy 0.5°). Subjects wearing glasses were corrected to normal vision by adding lenses to ensure high-quality gaze data. Data were synchronized and recorded (60 Hz) using Tobii Pro Lab (x64) software.
5.1.3 Experimental material
In Experiment 2, the AR warning message interface effects and driving scenarios used were the same as in Experiment 1 (Figure 7) to control for the same irrelevant variables in the comparison experiments. Moreover, there was a slight difference in the design of the pedestrian run -out hazard. In this experiment, three different pedestrian run-out hazards were designed at different locations in urban daytime and urban nighttime, respectively. In these three pedestrian hazards, there is a random chance that one of the pedestrian run-outs does not have an AR warning message (system failure). In contrast, pedestrians accompany the remaining two AR warning messages. Therefore, three experimental videos with the same pedestrian run - out location but different AR warning message failure locations in the city during daytime and nighttime were recorded, and one of them was randomly selected for the experiment, respectively, to avoid the discrepancy due to different locations.
Meanwhile, in Experiment 2, to construct subjects’ full familiarity with the AR warning information system, two additional videos of daytime and nighttime pedestrian run -out hazards were designed for this experiment, and the driving scenarios of these two videos were different from the formal experiment to avoid learning effects (Figure 12). However, the AR warning message in these two videos always appeared accurately and timely, along with the pedestrian run-out, to gain the subjects’ full perceptual trust.

Figure 12. A video scene of participants fully understanding the AR warning information system was constructed, with daytime on the left and nighttime on the right.
5.1.4 Procedure
Experiment 2 The entire experiment lasted about 40 minutes or so and was divided into three main stages.
Firstly, subjects were welcomed, and all subjects were introduced to the basic information and working principle of AR warning messages, constructed the subjects’ basic knowledge about AR warning messages, and informed about the general procedure of the experiment. Then, the subjects were required to submit and sign various documents (e.g., informed consent, privacy statement), and basic information about the subjects was collected through a questionnaire. Then, the subjects were allowed to enter the simulator, adjust the seat position, and familiarize themselves with the operations. At the same time, the main tasks of the experiment were introduced to the subjects. They were allowed to perform a short driving practice in a simulated driving scenario to familiarize themselves with the simulated driving scenario.
Second, after the driving exercise, the subjects were shown daytime and nighttime videos of the familiarization experiment in turn, and at the end of each video, they were asked to fill out the User Experience Usability Scale (UMUX) (Lewis, 2018), to obtain data on subjects’ subjective evaluations of the AR warning system during daytime and nighttime, respectively, including subjects’ ratings of the AR warning system’s effectiveness evaluation and reliability evaluation, During this process, the experimenter conducted a short interview with each subject to obtain their thoughts and opinions about the AR warning information system.
Finally, after all preparations, the experimenter corrected the subjects’ vision and calibrated the eye - tracker. Then, the subjects were asked to sit in the simulator in a real driving condition as much as possible, and two randomly selected experimental videos were shown to the subjects in a randomized order during daytime and nighttime in the city, respectively. The perceived time of the pedestrian danger on that occasion of the system failure was collected for each of the two groups of subjects (Figure 13), and the subjects were asked to verbally report their detection of the pedestrian run -out in the scenarios during the experiment as well to increase their experimental load.

Figure 13. The logic flowchart for Experiment 2, The main purpose is to obtain the perception time of experienced drivers and novice drivers about the pedestrian danger of random failures in the AR scene.
5.1.5 Analysis and statistics
For data analysis and statistics in Experiment 2, the subjective UMUX scales completed by the subjects were first collated and analyzed for descriptive and inferential statistical analyses after their reliability and validity tests in lBM SPSS Statistics 27. Also, to assess the differences in the reliance of drivers with different driving experiences on AR warning messages during urban daytime and urban nighttime, respectively, their risk perception time during system failure, risk perception time 5 vs. risk perception time 6, risk perception time 7 vs. risk perception (Figure 13).
Independent samples t-test was used to compare risk perception time P with risk perception time 7, risk perception time M with risk perception time 8, risk perception time Q with risk perception time 5, risk perception time N with risk perception time 6, and risk perception time Q with risk perception time 6 in Figure 14. Perception time 5, risk perception time N versus risk perception time 6 with a significance level of 0.05Dependency and difference analyses were performed based on the results.

Figure 14. Comparison of data from dependency studies.
5.2 Results
5.2.1 Perceived time in case of AR system failure
Table 8 shows the mean perceived time of pedestrian hazards during sudden failure of the AR warning system for both groups of subjects, experienced and novice drivers, for urban daytime and nighttime conditions. The box plots of perceived time to pedestrian run-out hazards for both groups of subjects for both urban daytime and nighttime driving situations are shown in Figures 15a,b.

Table 8. Experience drivers and novice drivers perception time.

Figure 15. Experienced and novice drivers perceive the time of pedestrian danger in the event of a failure of the AR warning message at night and during the day in the city.
The average hazard perception time of experienced drivers during urban daytime (risk perception time 8) increased by 2.91%. SD increased by 6.25% from nighttime (risk perception time 6), and the boxplots show that experienced drivers had slightly higher hazard perception times during urban daytime than nighttime. In contrast, novice drivers’ risk perception time for pedestrians during urban daytime (risk perception time 7) was 12.56% lower. SD increased by 6.25% compared to nighttime (risk perception time 5). The box plot shows that the novice drivers’ risk perception time during urban daytime was significantly lower than that of urban during the malfunctioning of the AR warning message at nighttime and the box. Height lQR was also significantly higher than the nighttime driving scenario.
5.2.2 Dependency analysis
After the above experimental analysis in this study, the pedestrian hazard perception times of the control group who were unaware of the AR warning messages in Experiment 1 have been obtained, including the risk perception time M and risk perception time N of 50% experienced drivers and 50% novice drivers in the control group under the urban daytime driving scenario, and the risk perception time P and risk perception time Q of 50% experienced drivers and 50% novice drivers in the nighttime control group. Corresponding to this are the perceived times of the subjects in Experiment 2 who were sufficiently familiar with the construction of the AR warning messages to perceive the pedestrian hazards in the case of AR system failure, including risk perception time 8 in the city daytime and risk perception time 6 in the nighttime situation for the experienced group, and risk perception time 7 in the city daytime and risk perception time 5 in the nighttime situation for the novice drivers. They are compared using independent samples t-tests, according to the relationship in Figure 14.
The results of the independent samples t-test by subjecting the data of risk perception time 8 with risk perception time M and risk perception time 6 with risk perception time N are shown in Table 9. Experienced drivers could have relied more on AR warning messages in daytime driving scenarios (p = 0.594 > 0.05). At the same time, at night, although there was a significant difference (p < 0.01 < 0.05) between the risk perception time N data of risk perception time 6 vs. the mean of the former was found to be significantly lower than that of the latter through analysis.

Table 9. Dependency study independent samples T-test for experienced drivers.
Similarly, by subjecting risk perception time 7 to risk perception time P and risk perception time 5 to risk perception time Q, data to independent samples t-test results are shown in Table 10. Novice drivers significantly differed in daytime perception time of pedestrian hazards (p < 0.01 < 0.05). They did not significantly differ in perception time of pedestrian hazards at nighttime (p = 0.93 > 0.05).

Table 10. Dependency study independent samples T-Test for novice drivers.
5.2.3 Subjective evaluation
To obtain the subjective evaluation comparison of the three dimensions of validity, intrusiveness, and reliability of the subjects’ AR warning information system, after constructing a sufficiently familiar understanding of the AR warning information, all the subjects were allowed to fill out the UMUX seven-point Likert Subjective Evaluation Scale. A total of 32 valid evaluation scales were collected. The samples were examined for reliability and validity according to dimensions using Cronbach’s coefficients and Bartlett’s sphericity coefficient after The scale data were analyzed. The scale-specific data are shown in Table 11.

Table 11. Statistical results of subjective rating scale data.
Figure 16a compares the subjective ratings of experienced drivers during daytime and nighttime in the city. It can be seen that experienced drivers rated the effectiveness of the AR warning system lower at night than during the day. However, overall, both rated the effectiveness of the system positively. In contrast, the evaluations on intrusiveness are the same, both in daytime and nighttime; AR warning messages are visually occluding and distracting for experienced drivers, and thus are rated lower on reliability and show stronger skepticism and nervousness towards the AR system at nighttime, and show lower subjective dependence and expectancy than during the daytime. This would also explain why experienced drivers’ perceived time to pedestrian hazard in case of AR failure was significantly lower at night in the presence of AR warning messages than when they were unaware of AR warning messages.

Figure 16. Comparison of the subjective evaluation of experienced drivers during the day and at night in the city. (a) Experience drive. (b) Nonice drive. (c) Daytime. (d) Night.
Similarly, novice drivers ' subjective ratings during daytime and nighttime in the city are shown in Figure 16b ln terms of effectiveness, novice drivers gave positive effectiveness ratings in both daytime and nighttime, with nighttime ratings slightly lower than daytime. However, significant differences were shown in the interference ratings, with novice drivers perceiving the AR warning system as more intrusive at night and not significantly intrusive during the day. Therefore, regarding reliability ratings, novice drivers showed a stronger subjective dependence and anticipation of the system during the daytime. In contrast, they did not show significant dependence or nervousness during the nighttime.
The authors also analyzed and compared the subjective evaluation data of the AR warning system by drivers with and without driving experience during daytime and nighttime. Figure 16b shows the difference in subjective evaluations between experienced and novice drivers during daytime in the city. It was analyzed that both experienced and novice drivers gave consistently valid ratings of the effectiveness of the AR warning system during daytime. However, in terms of intrusiveness, experienced drivers perceived the system to be more intrusive, while novice drivers perceived the system to be more intrusive. In the reliability dimension, novice drivers gave higher subjective ratings than experienced drivers, showing a stronger subjective dependence and expectation of the AR warning system.
Figure 16d analyzes the subjective ratings of experienced and novice drivers at night in the city. In terms of effectiveness evaluation, although both generally considered the AR warning system effective. The effectiveness evaluation was lower at night than during the day. Experienced and novice drivers were largely similar regarding intrusiveness and reliability ratings. They both agreed that AR warning messages were somewhat intrusive at night, thus creating suspicion and nervousness in the driver. Therefore, regarding reliability, both unanimously failed to develop subjective dependence and expectancy on the AR warning system.
By comparing the subjective ratings of experienced and novice drivers during daytime and nighttime in the city, the authors found that both novice and experienced drivers shothe authorsd positive ratings on the effectiveness dimension of AR warning messages. However, the ratings on the intrusiveness and reliability dimensions vary depending on the driving experience and the driving environment. The ratings on the reliability dimension are low when the ratings on the intrusiveness dimension are high, and vice versa, as if the driver’s reliability ratings of the AR warning message are affected by his or her intrusiveness ratings of the AR warning system. To test this inference, the authors conducted a correlation test between the three dimensions of the UMUX scale (Figure 17).
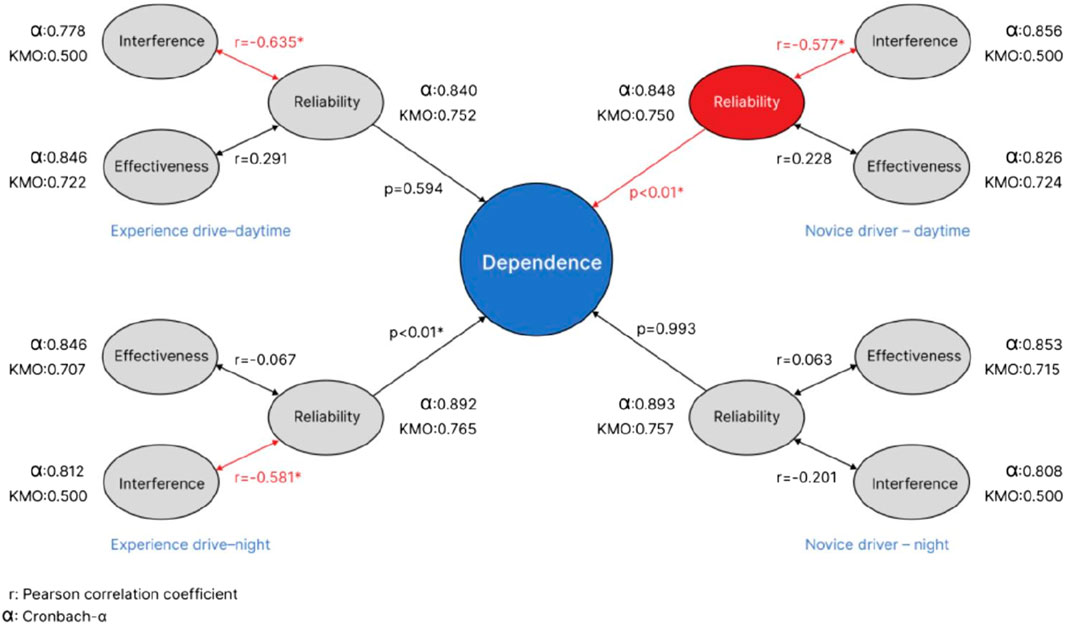
Figure 17. Correlation tests were performed between the three dimensions of the UMUX scale.
The Pearson correlation test results showed that experienced drivers showed some degree of negative correlation between the intrusiveness evaluation and the reliability evaluation of the AR warning message during daytime and nighttime in the city, as well as novice drivers during daytime in the city. The novice drivers did not show a significant correlation at night, which may be due to the high variability of data points within the group caused by the individual differences of the novice drivers. However, summarizing the above findings shows that drivers’ subjective dependence and expectation of AR warning messages depend on their intrusive evaluation of the AR warning system. Whereas the effectiveness ratings will vary depending on the driving environment, the overall positive ratings on usability are all positive.
6 Discussion
The discussion has been expanded to interpret the subjective evaluations in greater depth, with a focus on trust calibration and dependency mechanisms in varying driving environments. The findings now emphasize the need for adaptive AR warning systems that dynamically adjust based on the driver’s experience and the surrounding environment.
This study compared the reliance of novice and experienced drivers on AR warning messages in urban daytime and nighttime, respectively, using both objective performance metrics (perceived time to hazard detection based on eye-movement data) and subjective evaluations (UMUX scale).
In line with prior findings that AR HUD can significantly improve driver performance and hazard perception (Chauvin et al., 2023; Herbert et al., 2017). The present study confirmed that AR warning messages significantly reduced hazard perception times in both daytime and nighttime urban driving scenarios. At the same time, the authors also longitudinally compared the differences in the perceived danger time between daytime and nighttime between the control group and the AR group in Experiment 1 and found that there was a significant difference in the perceived time for danger pedestrians in the control group, which proved the significance of the variable “different urban driving environments” in this study; while there was no significant difference in the danger perceived time in the AR group, suggesting that the application of AR warning messages can also significantly reduce the differences in driving performance due to the different environments. This conclusion, as an exploration of the application of AR HUDs, can be used to solve the problem of the traffic environment that affects the drivers’ driving performance, as Faria et al. (2020) suggested in the study.
Regarding driving experience, the authors compared the hazard perception times of 50% of experienced drivers and 50% of novice drivers in the control group. The authors found that drivers with different driving experiences shothe authorsd significant differences at night. However, during the daytime, it may be due to insufficient driving load (Wood et al., 2014), which did not show significant differences. This suggests that significant differences in driving performance due to differences in driving experience depend on the driving scenario and differences in driving loads imposed by the driving task and not all driving tasks. Navarro et al. (2023) used a Forward Collision Warning System (FCWS) for comparison in a study. Although the FCWS helped reduce near-collision events, there was no significant difference in braking reaction times between experienced and novice drivers. Therefore, studying the effect of driving experience on differences in driving performance should be based on specific driving scenarios. However, this experiment demonstrates the overall significance of the variable “driving experience.” The authors also collected these data and compared them with the hazard perception data in Experiment 2 to analyze the dependence and differences in AR warning messages among drivers with different driving experiences.
Then, in Experiment 2, the hazard perception times of experienced versus novice drivers in the AR environment were obtained in case of a malfunctioning AR warning message and their subjective ratings of the AR warning system.
It was found that experienced drivers did not show dependence on AR warning messages during urban daytime and nighttime and perceived nighttime pedestrian hazards in the presence of AR warning messages but with malfunctioning ones at significantly lower times than the control group in Experiment 1. However, Farooq et al. (2023) showed in their study that drivers have a greater need for assistive information to enhance safety in complex nighttime environments. Therefore, the present study went a step further by incorporating the subjective evaluation data of experienced drivers at night and found that experienced drivers showed strong skepticism and nervousness towards AR warning messages at night. It can be inferred that experienced drivers instead become more cautious in the presence of AR warning messages, especially in high driving load scenarios such as nighttime, and they are more willing to trust their judgment.
Novice drivers similarly did not show reliance on AR warning messages at night but significantly relied on AR warning messages in daytime scenarios. Combined with the subjective evaluation data of novice drivers during the daytime, it can be found that novice drivers perceived that AR warning messages were more effective and less intrusive during the daytime compared to the nighttime, and this subjective performance was consistent with the objective performance of novice drivers. From this, it can be inferred that novice drivers will rely on AR warning messages differently depending on the environment, and will tend to relax their vigilance and thus rely on them in low-load driving scenarios such as daytime, whereas they will still remain relatively vigilant in high-load driving scenarios such as nighttime.
After comprehensive analysis, it was found that both experienced and novice drivers showed relative driving vigilance and did not rely on AR warning messages in the objective data at night. During the daytime, experienced drivers may not show dependence due to their rich driving experience, unlike novice drivers, who may be prone to driving slackness in low-load scenarios with high visibility during the daytime, thus creating dependence. Therefore, this paper suggests that the degree of drivers’ objective dependence on AR warning messages depends on the driving environment load in the first place. The higher the driving load, the more the driver will concentrate on the driving process instead, thus not generating dependence. In the environment with less driving load, the dependence depends on the difference in driving experience; experienced drivers did not show dependence on AR warning messages due to their driving habits and subjective initiative, while novice drivers tend to relax their vigilance in such an environment, thus creating dependence.
Finally, it was found that on subjective evaluation, although all drivers did not deny the effectiveness of AR warning messages, they shothe authorsd different dependencies. An analysis of the correlations between the dimensions of the scales revealed that drivers’ subjective dependence and expectancy on AR warning messages depended on their evaluation of the AR warning system as intrusive rather than effective. In contrast, in past research on the interactive interface of AR warning messages, researchers have mostly focused on the effectiveness of the interface (Calvi et al., 2022; 2020), with little attention paid to visual intrusiveness or the visual capture of interface elements. In the KANO mode (Južnik Rotar and Kozar, 2017), the authors often refer to the functionality of such attributes as essential properties. Therefore, the optimization strategy for the design of AR warning messages should first focus on the visual catchiness of the AR system to the driver in different driving scenarios, which is, of course, based on the premise that it can deliver accurate and effective warning messages to the driver.
From a theoretical perspective, these findings contribute to the body of knowledge on trust calibration in driver–automation interaction, specifically by distinguishing the joint roles of environmental load and driver experience in shaping dependency patterns. From a practical perspective, the results suggest that AR HUD warning designs should dynamically adapt interface intrusiveness and Time-To-Collision thresholds based on driver type and environmental load, to maintain appropriate trust levels and avoid over-reliance.
7 Conclusion
In this study, we investigated how drivers with different levels of experience depend on AR warning messages under urban daytime and nighttime driving conditions, using both objective eye-tracking measures and subjective user evaluations. The results indicate that while AR HUDs enhance hazard detection, they may also induce dependence under low driving loads, especially among novice drivers. To improve reliability and responsiveness, future work should incorporate real-time performance metrics and include comparisons with recent transformer-based methods.
The authors found that objectively, the dependence of both experienced and novice drivers was primarily determined by the load of the driving scenario. Under high-load conditions, drivers concentrated more and did not develop dependency. Under low-load conditions, dependency depended on driving experience: experienced drivers’ habits and initiative prevented dependency, while novice drivers tended to relax and thus developed dependency. Subjectively, drivers’ dependence and expectancy the authorsre influenced more by their perception of the system’s intrusiveness than by its perceived effectiveness.
The study advances the understanding of trust calibration mechanisms in AR-assisted driving by empirically demonstrating the interaction effects of driving environment load and driver experience on dependency formation. This enriches theoretical models of driver–automation trust and extends human factors research into AR HUD design.
The findings provide actionable design principles for automotive interface engineers and policymakers, aiming to enhance road safety by tailoring AR HUD warning systems to both environmental and user characteristics. By preventing automation complacency, such adaptive systems could reduce accident risks, particularly in urban traffic scenarios.
Based on the above, it is recommended that AR HUD warning systems incorporate adaptive interaction interfaces that dynamically adjust visual prominence and alert timing according to both the driving environment and driver experience level.
8 Limitations
A limitation of the current study is that this study was conducted only in a laboratory-simulated driving environment, whereas real urban driving environments tend to be more complex and varied; this paper only compares pedestrian run-outs, which is a typical urban driving hazardous scenario, and further research could consider hazardous driving scenarios such as intersections, on-ramp merges, and slowing down of the vehicle in front of the vehicle. In addition, although the experiments in this study were conducted among 52 plus 32 licensed drivers, there may still be a need to increase the number of subjects, as well as to add more driving scenarios, to accurately identify differences in the reliance on AR warning messages in richer driving scenarios among drivers with different driving experience. Further research may consider exploring the mediating role of driver gender and personality on dependence or attempting to expand the age range of subjects to substantiate the findings of this study further. Additionally, the study only focused on pedestrian run-out hazards. Future research should expand to other common urban risks such as intersection conflicts and sudden braking of preceding vehicles.
The study’s limitation lies in its reliance on a simulated environment. Future work should integrate real-time performance metrics (FPS, latency) and cross-validation with transformer-based methods to ensure the robustness and applicability of AR HUD systems across diverse urban environments and driving conditions.
Overall, the results of this study reveal the dependence and differences in AR warning messages between experienced and novice drivers in urban daytime and nighttime driving scenarios. These findings can serve as a basis for further research on more factors affecting driving dependence performance. It also contributes to a deeper understanding of the specific driving behavior performance and implicit emotional states of different drivers in different driving scenarios with AR-assisted driving technology. Therefore, the results of this study can also be used to design more effective training modules and driver support systems for AR technology applications to prevent automation complacency due to the application of AR technology and ensure driver safety. Finally, in today’s booming development of intelligent cockpit scenario-based personalization, defining the personalized application of AR systems based on the differences in the dependencies of different drivers in different driving scenarios can provide users with a better safety service experience.
Data availability statement
The original contributions presented in the study are included in the article/supplementary material, further inquiries can be directed to the corresponding author.
Ethics statement
The studies involving human participants were reviewed and approved by Ethical Review Committee (NBU-2024-230) Ningbo University. The patients/participants provided their written informed consent to participate in this study.
Author contributions
FH: Conceptualization, Data curation, Methodology, Validation, Writing – original draft, Writing – review and editing. RA: Formal Analysis, Methodology, Supervision, Validation, Writing – review and editing.
Funding
The authors declare that no financial support was received for the research and/or publication of this article.
Conflict of interest
The authors declare that the research was conducted in the absence of any commercial or financial relationships that could be construed as a potential conflict of interest.
Generative AI statement
The authors declare that no Generative AI was used in the creation of this manuscript.
Any alternative text (alt text) provided alongside figures in this article has been generated by Frontiers with the support of artificial intelligence and reasonable efforts have been made to ensure accuracy, including review by the authors wherever possible. If you identify any issues, please contact us.
Publisher’s note
All claims expressed in this article are solely those of the authors and do not necessarily represent those of their affiliated organizations, or those of the publisher, the editors and the reviewers. Any product that may be evaluated in this article, or claim that may be made by its manufacturer, is not guaranteed or endorsed by the publisher.
References
Arenas, J. P. (2025). On the impact of electric vehicle transition on urban noise pollution. Curr. Opin. Environ. Sci. Health 45, 100623. doi:10.1016/j.coesh.2025.100623
Bauerfeind, K., Drüke, J., Bendewald, L., and Baumann, M. (2022). How does navigating with augmented reality information affect drivers’ glance behaviour in terms of attention allocation? Front. Virtual Real. 3, 930117. doi:10.3389/frvir.2022.930117
Beck, D., and Park, W. (2018). Perceived importance of automotive HUD information items: a study with experienced HUD users. IEEE Access 6, 21901–21909. doi:10.1109/ACCESS.2018.2828615
Calvi, A., D’Amico, F., Ferrante, C., and Bianchini Ciampoli, L. (2020). Effectiveness of augmented reality warnings on driving behaviour whilst approaching pedestrian crossings: a driving simulator study. Accid. Anal. Prev. 147, 105760. doi:10.1016/j.aap.2020.105760
Calvi, A., D’Amico, F., Ferrante, C., and Bianchini Ciampoli, L. (2022). Driving simulator study for evaluating the effectiveness of virtual warnings to improve the safety of interaction between cyclists and vehicles. Transp. Res. Rec. J. Transp. Res. Board 2676, 436–447. doi:10.1177/03611981211061351
Charissis, V., Falah, J., Lagoo, R., Alfalah, S. F. M., Khan, S., Wang, S., et al. (2021). Employing emerging technologies to develop and evaluate in-vehicle intelligent systems for driver support: infotainment AR HUD case study. Appl. Sci. 11, 1397. doi:10.3390/app11041397
Chauvin, C., Said, F., and Langlois, S. (2023). Augmented reality HUD vs. conventional HUD to perform a navigation task in a complex driving situation. Cogn. Technol. Work 25, 217–232. doi:10.1007/s10111-023-00725-7
Cheng, Y., Zhong, X., and Tian, L. (2023). Does the AR-HUD system affect driving behaviour? An eye-tracking experiment study. Transp. Res. Interdiscip. Perspect. 18, 100767. doi:10.1016/j.trip.2023.100767
Faria, M. V., Baptista, P. C., Farias, T. L., and Pereira, J. M. S. (2020). Assessing the impacts of driving environment on driving behavior patterns. Transportation 47, 1311–1337. doi:10.1007/s11116-018-9965-5
Farooq, M. S., Khalid, H., Arooj, A., Umer, T., Asghar, A. B., Rasheed, J., et al. (2023). A conceptual multi-layer framework for the detection of nighttime pedestrian in autonomous vehicles using deep reinforcement learning. Entropy 25, 135. doi:10.3390/e25010135
Gao, C., Lai, X., Li, S., Cui, Z., and Long, Z. (2023). Bibliometric insights into the implications of urban built environment on travel behavior. ISPRS Int. J. Geo-Inf. 12, 453. doi:10.3390/ijgi12110453
Ge, Y., Zhang, Q., Zhao, W., Zhang, K., and Qu, W. (2017). Effects of trait anger, driving anger, and driving experience on dangerous driving behavior: a moderated mediation analysis. Aggress. Behav. 43, 544–552. doi:10.1002/ab.21712
Guo, C., Sentouh, C., Haué, J.-B., and Popieul, J.-C. (2019). Driver–vehicle cooperation: a hierarchical cooperative control architecture for automated driving systems. Cogn. Technol. Work 21, 657–670. doi:10.1007/s10111-019-00559-2
Herbert, A. M., Baschnagel, J., Gordon, M. E., and McDonald, Z. (2017). Augmented reality HUDS: warning signs and driver situation awareness. J. Vis. 17, 40. doi:10.1167/17.7.40
Hoff, K. A., and Bashir, M. (2015). Trust in automation: integrating empirical evidence on factors that influence trust. Hum. Factors 57, 407–434. doi:10.1177/0018720814547570
Hwang, Y., Park, B.-J., and Kim, K.-H. (2016). Effects of augmented-reality head-up display system use on drivers? risk perception and psychological changes of drivers. ETRI J. 38 (4), 757–766. doi:10.4218/etrij.16.0115.0770
Jiang, Q., and Guo, Z. (2023). AR-HUD optical system design and its multiple configurations analysis. Photonics 10, 954. doi:10.3390/photonics10090954
Južnik Rotar, L., and Kozar, M. (2017). The use of the Kano model to enhance customer satisfaction. Organizacija 50, 339–351. doi:10.1515/orga-2017-0025
Kaur, K., and Rampersad, G. (2018). Trust in driverless cars: investigating key factors influencing the adoption of driverless cars. J. Eng. Technol. Manag. 48, 87–96. doi:10.1016/j.jengtecman.2018.04.006
Kelly, J. (2025). Top automotive engineering trends in 2025. Redline Group Ltd. Available online at: https://www.redlinegroup.com/insight-details/automotive-engineering-trends-in-2025 (Accessed June 25, 2025).
Lewis, J. R. (2018). Measuring perceived usability: the CSUQ, SUS, and UMUX. Int. J. Human–Computer Interact. 34, 1148–1156. doi:10.1080/10447318.2017.1418805
Li, R., Chen, Y. V., Zhang, L., Shen, Z., and Qian, Z. C. (2020). Effects of perception of head-up display on the driving safety of experienced and inexperienced drivers. Displays 64, 101962. doi:10.1016/j.displa.2020.101962
Li, X., Rong, J., Li, Z., Zhao, X., and Zhang, Y. (2022). Modeling drivers’ acceptance of augmented reality head-up display in connected environment. Displays 75, 102307. doi:10.1016/j.displa.2022.102307
Liu, P. (2023). Reflections on automation complacency. Int. J. Human–Computer Interact. 40, 7347–7363. doi:10.1080/10447318.2023.2265240
Manchon, J. B., Bueno, M., and Navarro, J. (2023). Calibration of trust in automated driving: a matter of initial level of trust and automated driving style? Hum. Factors J. Hum. Factors Ergon. Soc. 65, 1613–1629. doi:10.1177/00187208211052804
Meyer, S. B., and Ward, P. R. (2013). Differentiating between trust and dependence of patients with coronary heart disease: furthering the sociology of trust. Health Risk Soc. 15, 279–293. doi:10.1080/13698575.2013.776017
Navarro, J., Reynaud, E., Ouimet, M. C., and Schnebelen, D. (2023). Comparison of experienced and novice drivers’ visual and driving behaviors during warned or unwarned near–forward collisions. Sensors 23, 8150. doi:10.3390/s23198150
Reinmueller, K., Koehler, L., and Steinhauser, M. (2018). Adaptive warning signals adjusted to driver passenger conversation: impact of system awareness on behavioral adaptations. Transp. Res. Part F. Traffic Psychol.Behav. 58, 242–252. doi:10.1016/j.trf.2018.06.013
Summala, H., Lamble, D., and Laakso, M. (1998). Driving experience and perception of the lead car’s braking when looking at in-car targets. Accid. Anal. Prev. 30, 401–407. doi:10.1016/S0001-4575(98)00005-0
Tsoi, K. H., Loo, B. P. Y., Li, X., and Zhang, K. (2023). The co-benefits of electric mobility in reducing traffic noise and chemical air pollution: insights from a transit-oriented city. Environ. Int. 178, 108116. doi:10.1016/j.envint.2023.108116
Valentine, D. C., Smit, I., and Kim, E. (2021). Designing for calibrated trust: exploring the challenges in calibrating trust between users and autonomous vehicles. Proc. Des. Soc. 1, 1143–1152. doi:10.1017/pds.2021.114
Wang, C. (2024). Role of recovery profile dependency in time-dependent resilience. Eng. Rep. 6, e12716. doi:10.1002/eng2.12716
Wetton, M. A., Hill, A., and Horswill, M. S. (2011). The development and validation of a hazard perception test for use in driver licensing. Accid. Anal. Prev. 43, 1759–1770. doi:10.1016/j.aap.2011.04.007
Wood, J. M., Collins, M. J., Chaparro, A., Marszalek, R., Carberry, T., Lacherez, P., et al. (2014). Differential effects of refractive blur on day and nighttime driving performance. Investig. Opthalmol. Vis. Sci. 55, 2284. doi:10.1167/iovs.13-13369
Xia, T., Lin, X., Sun, Y., and Liu, T. (2023). An empirical study of the factors influencing users’ intention to use automotive AR-HUD. Sustainability 15, 5028. doi:10.3390/su15065028
You, F., Fu, Q., Yang, J., Chen, H., Cui, W., and Wang, J. (2023). Team situation awareness-based augmented reality Head-Up display design for security requirements. Int. J. Human–Computer Interact. 40, 5119–5138. doi:10.1080/10447318.2023.2231281
Keywords: AR warning messages, trust calibration, technology dependence, driving experience, hazard perception
Citation: Huo F and Alla R (2025) Differences in drivers’ dependence on AR warning information in urban driving environments: the role of driving experience. Front. Virtual Real. 6:1638823. doi: 10.3389/frvir.2025.1638823
Received: 31 May 2025; Accepted: 24 October 2025;
Published: 20 November 2025.
Edited by:
Edward Wilson Ansah, University of Cape Coast, GhanaReviewed by:
Ruibin Zhang, Chengdu Polytechnic, ChinaMuhammad Javed, Shanghai Maritime University, China
Copyright © 2025 Huo and Alla. This is an open-access article distributed under the terms of the Creative Commons Attribution License (CC BY). The use, distribution or reproduction in other forums is permitted, provided the original author(s) and the copyright owner(s) are credited and that the original publication in this journal is cited, in accordance with accepted academic practice. No use, distribution or reproduction is permitted which does not comply with these terms.
*Correspondence: Faren Huo, aHVvZmFyZW5AbmJ1LmVkdS5jbg==