 Nicolas Visbecq
1,2*
Nicolas Visbecq
1,2*
 Mahdiyehsadat Moosavi
1
Mahdiyehsadat Moosavi
1
 Jean-Philippe Farrugia
3
Jean-Philippe Farrugia
3
 Frédéric Merienne
1
Frédéric Merienne
1 Frédéric Rabellino2
- 1 Arts et Métiers Institute of Technology, Chalon-surSaône, France
- 2 Volvo Group Trucks Technology, Saint Priest, France
- 3 Université Claude Bernard Lyon 1, CNRS, Villeurbanne, France
Introduction: This paper explores the feasibility of using virtual reality (VR) environments to evaluate the technical characteristics of displays. Based on a literature review, we analyze key display parameters, such as resolution, refresh rate, and luminance, as well as human perception and evaluation methods.
Methods: An experimental study was conducted comparing the perception of these parameters in a physical environment and in two virtual reality cases, using high- and low-resolution VR headsets.
Results and discussion: The results show that the perception of luminance and refresh rate variations is reliable in VR environments, especially with high-resolution headsets, while the detection of resolution differences remains limited.
1 Introduction
1.1 Context
Immersive technologies like Virtual Reality (VR), Augmented Reality (AR), and Mixed Reality (MR) are common in the automotive industry, especially for rapid prototyping. Instead of building multiple physical prototypes, engineers can now work with digital models, which saves both time and money. These tools make it possible to adjust designs instantly, encourage smoother collaboration between teams, and help reduce errors as well as the environmental footprint linked to traditional prototyping. At the same time, the growing number of screens being integrated into vehicles creates new challenges. Engineers must assess how these displays fit into the cockpit and how they affect ergonomics and the overall user experience. Thanks to virtual mockups, it is now possible to simulate screen layouts in realistic driving conditions, giving designers the ability to evaluate visibility, accessibility, and integration with the rest of the vehicle’s components. This raises a central research question: can VR headsets be used as reliable tools for evaluating the technical characteristics of in-vehicle displays? While standards and perceptual models are well established for direct display assessment, their transposability into immersive environments remains uncertain. Addressing this gap is crucial, since VR could provide engineers with controlled, reproducible, and cost-effective environments for early evaluation of display performance in realistic driving conditions. Through this study, we aim to examine whether it is possible to simulate screen characteristics in Virtual Reality and analyze them as if they were studied in the real world. This paper begins with a review of related work, followed by a presentation of our experimental procedure, and concludes with a discussion of the results.
1.2 Related work
1.2.1 Conventional display performance metrics
The quality of a display is generally characterized by key physical parameters such as luminance
1.2.2 Specific constraints and challenges of Head-Mounted Displays
The relevance of display parameters changes significantly in Head-Mounted Displays (HMDs) used in Virtual Reality (VR), which introduce specific optical and temporal constraints not found in conventional monitors. HMD design involves unique geometric and optical considerations, such as the optical axis alignment, inter-pupillary distance (IPD), and lens-induced distortions, as highlighted by Melzer and Moffitt (1997). Furthermore, modern optical architectures (e.g., freeform lenses, waveguides, pancake optics) modify the light path, thereby affecting perceived luminance uniformity, contrast, and chromatic aberrations, as shown by Kress (2020).
At the spatiotemporal level, factors such as pixel fill factor (related to the Screen-Door Effect), per-pixel latency, and response time strongly impact motion clarity and perceived image quality in VR, a subject emphasized by Zhao et al. (2022). Virtual reality also introduces the vergence-accommodation conflict, a major source of visual fatigue, as demonstrated by Hoffman et al. (2008), and application latencies that can potentially lead to simulator sickness. While VR offers the advantage of testing in controlled and reproducible environments (Masia et al., 2013; Tregillus et al., 2019), these hardware-level characteristics are essential for defining the fidelity of the simulation.
1.2.3 The influence of HMDs on simulated display perception
A crucial discussion is required on the validity of evaluating a simulated display (such as a car display) when it is viewed through an HMD. The HMD-display does not merely present an image; it acts as a limiting factor in the entire rendering pipeline, fundamentally influencing the perception of the simulated characteristics. The technical limits of the HMD define the maximum range of differences an observer can perceive between two simulated displays.
A major constraint is the Angular Resolution of the HMD, typically measured in Pixels Per Degree (PPD). The PPD represents the density of pixels available within one degree of the user’s field of view (FOV). For an HMD to faithfully reproduce the high-resolution details of a simulated car display, its PPD must meet or exceed the visual acuity required to perceive those details.
If the PPD of the HMD is lower than the effective PPD of the simulated display (i.e., the density of pixels that the car display would present to the user’s eye in the real world), the HMD becomes the bottleneck for perceived clarity. This low-density HMD will fail to render the fine details (such as thin fonts, anti-aliasing, or subtle graphical patterns) of the high-resolution simulated screen, resulting in a loss of fidelity. As illustrated in Figure 1, the visual information from a high-resolution virtual screen can be severely degraded when viewed through an HMD with insufficient PPD.
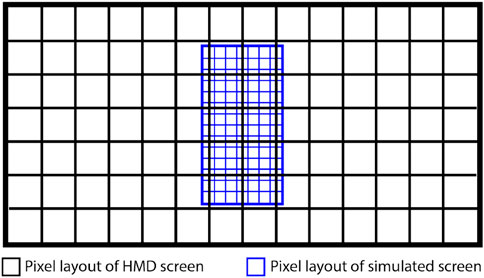
Figure 1. Illustration of the PPD bottleneck in HMDs. The diagram highlights the loss of fidelity when a high-resolution simulated display (blue pixel layout) is viewed through an HMD with insufficient Angular Resolution (black HMD screen layout).
An additional factor influencing perception is the slight movement of the head during the VR task. Even if a single HMD pixel covers multiple pixels of the simulated texture (pixel bottleneck), these simulated pixels shift on the HMD screen with small head movements, producing slight changes in the color of each HMD pixel. This effect is similar to super-sampling anti-aliasing in computer graphics, where each pixel integrates information from multiple sub-pixels, providing additional visual cues. While this partially mitigates the limitations of the pixel bottleneck, fine details may still be partially blurred.
Furthermore, the HMD’s refresh rate imposes a strict temporal constraint. If the refresh rate of the HMD screen is lower than the refresh rate of the simulated display (e.g., simulating a
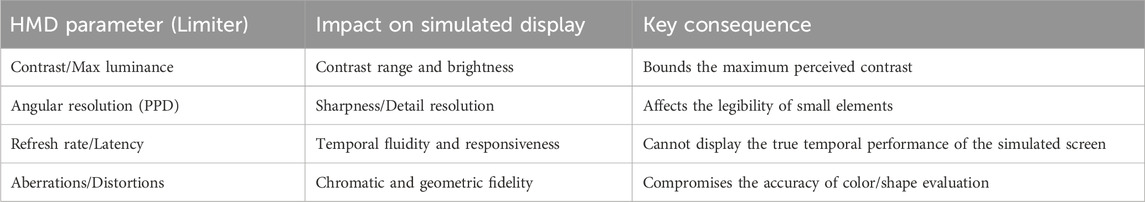
Table 1. Influence of HMD parameters on the evaluation of a simulated display.
1.2.4 Human perception and thresholds
Human retinas are composed of rods and cones, which together provide sensitivity to light, contrast, and color. Rods are essential for vision in low light conditions, while cones enable color discrimination and perception of fine spatial details (Kolb, 2003; Dowling, 2012). Visual perception therefore depends on several complementary mechanisms. Contrast sensitivity, described by Campbell and Robson (1968) and modeled by Barten (1999), varies with spatial frequency. Color vision relies on the combined activity of L, M, and S cones, which have distinct spectral sensitivities (Stockman and Sharpe, 2000; Brainard and Stockman, 2010). Visual acuity defines the ability to distinguish fine details, while field of view (FOV) defines the size of the visible space. These factors establish natural thresholds that limit the perception of display differences. From the point of view of this study, these perceptual thresholds are crucial: if the resolution or luminance of a VR headset does not exceed the limits of the human visual system, then it will restrict the user’s ability to assess the differences between screen feature.
1.2.5 Methods for display assessment
Display evaluation traditionally combines instrumental measurements and human-based assessments. Instrumental protocols, defined by International Organization for Standardization (ISO) (2008a) and Commission Internationale de l’Éclairage (CIE) (2018) standards, provide objective measurements of luminance, contrast, uniformity, and response time. However, these values do not directly predict user experience. To address this gap, perceptual models such as Daly (1993) visible difference predictor have been developed to link physical data to visual detection thresholds. Subjective methods include psychophysical approaches (Pelli and Bex, 2013; Barten, 1999), paired comparisons, and Mean Opinion Score (MOS). These methods measure perceptual quality but often lack reproducibility between observers. Standardized tests (still images, video sequences, Gabor patterns, optotypes) are commonly used to assess contrast detection, motion blur, or latency (Pinson and Wolf, 2004).
Each approach has advantages and limitations: instrumental methods are objective but insensitive to perceptual phenomena, while psychophysical and subjective methods capture perception better but are time-consuming and observer-dependent.
1.2.6 Synthesis
To recap, display quality is determined by measurable physical characteristics, such as brightness, contrast, refresh rate, and color accuracy. These parameters interact with the limitations of human visual perception. Complementary instrumental and psychophysical methods exist for evaluating displays, but their transferability to virtual reality is unclear. Virtual reality both limits and enriches perceptual assessment: while headset optics and resolution can distort measurements, virtual reality offers the possibility of realistic, controlled, and cost-effective simulations. This raises the question of whether virtual reality can be used to evaluate the technical characteristics of a display. This study fills this gap by testing the ability of virtual reality headsets to reproduce perceptual differences in resolution, refresh rate, and luminance, thus examining their relevance for evaluating displays in the automotive context.
1.3 Research question and hypothesis
The current state of the art highlights several gaps and uncertainties regarding the ability of virtual reality to evaluate the technical specifications of a display. From this review, the central research question emerges: Can the technical characteristics of displays be evaluated in virtual reality in the same way as in real-world environments? To address this, we propose testable hypotheses and research questions that structure the rest of this work.
H1: Differences in display quality can only be assessed when the pixel density of the VR headset exceeds that of the simulated display, so that small variations become perceptible in high-density headsets but remain indistinguishable in lower-density ones.
H2: Variations in refresh rate will be perceived similarly across all headsets, as long as the headset’s display refresh rate is higher than the one being evaluated.
H3: Variations in brightness will be perceived in a similar way across all headsets, provided that the headset’s luminance range is greater than the range being assessed.
2 Materials and methods
2.1 Study design
2.1.1 Definition of screen characteristics
The characteristics selected for this study, summarized in Table 2, were chosen to cover the key technical parameters influencing perception. standard 24-inch monitor was selected as the reference display, as it represents a commonly available screen type.
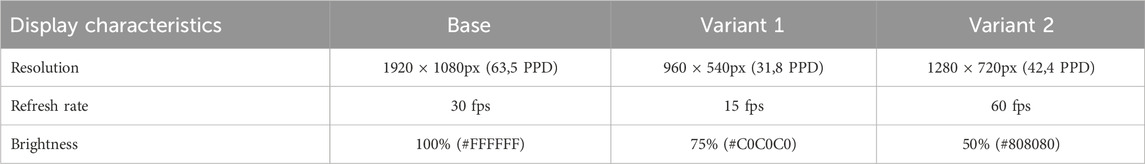
Table 2. Technical specifications of screen evaluated.
No currently available VR headset would allow us to properly conduct this experiment, given the complexity of accurately simulating resolution differences on a high-pixel-density display. Therefore, we selected a 24-inch 1080p monitor, a standard model, to ensure reproducibility of the experiment across different environments. This monitor has a pixel density of 63.5 PPD, significantly lower than the screens used in our vehicles (95.7 and 98.3 PPD), making it possible to study the effects of varied resolutions in a controlled context. The goal of the experiment is to assess whether a VR headset, such as the Quest 3, with an estimated pixel density of 25 PPD, can detect resolution changes on a screen with a higher pixel density. We compared the experience using a headset with lower pixel density and one with higher pixel density, allowing us to measure the impact of resolution in distinct configurations.
The refresh rate was set to 30 fps to represent standard audiovisual content, reduced to 15 fps to simulate decreased motion smoothness, and increased to 60 fps to reproduce the fluidity of video game experiences. Brightness was varied by adjusting the background color (100%, 75%, and 50%), enabling the evaluation of participants’ sensitivity to luminance differences in an immersive environment.
The two VR headsets used in this study offered different display qualities. The Varjo XR3, with a central resolution of 70 pixels per degree (PPD), provides a pixel density higher than the evaluated display, allowing the perception of fine details. In contrast, the Oculus Quest 3, with about 25 PPD, delivers lower resolution, which limits fine-detail perception in this context. Lower resolutions were also included to replicate the characteristics of in-vehicle displays of similar size. Main features of the HMD are resumed on Table 3. This setup allowed us to examine how headset quality influences the perception of the technical parameters listed in Table 2. To replicate the real evaluation room as accurately as possible, we created a virtual model in Blender using the exact room dimensions and incorporating CAD files of the furniture and equipment. This approach allowed us to preserve spatial relationships and visual cues present in the physical environment. The VR application was developed in Unity 2022.3.15f1 using the Built-in Render Pipeline. Although this environment reproduced the geometric and spatial layout of the real setup, its lighting and material rendering were not physically accurate. Therefore, the virtual scene should not be considered a fully realistic representation. Instead, it provided a controlled geometric replication of the evaluation space, allowing comparable viewing conditions while acknowledging limited photometric fidelity. The realism of the virtual environment was not explicitly evaluated in this study; however, we attempted to minimize the impact of this limitation by reproducing the real environment as faithfully as possible in terms of geometry, scale, and spatial arrangement. Figure 2 presents a comparison between the real and virtual environment.

Table 3. Technical specifications of HMD diplays.
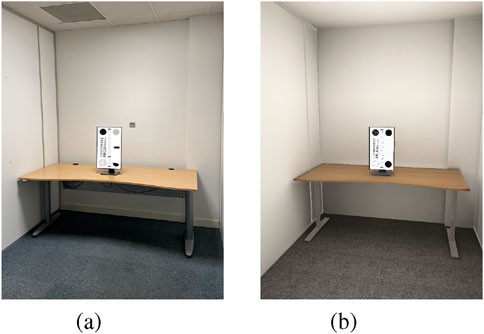
Figure 2. Environments used for the assessment. (a) Environment used for the physical assessment. (b) Virtual representation of the room.
2.1.2 Assessment patterns
To assess the perception of different display characteristics, we designed a test pattern inspired by standard calibration test patterns, in particular the International Display Standardization Manual (IDSM) published by the Society for Information Display (2023). As illustrated in Figure 3, this pattern combines static and dynamic elements to provide a variety of visual cues. Motion was incorporated to evaluate refresh rates, while the pattern is reshe textures used in the evaluation were created in three resolutions: 1920
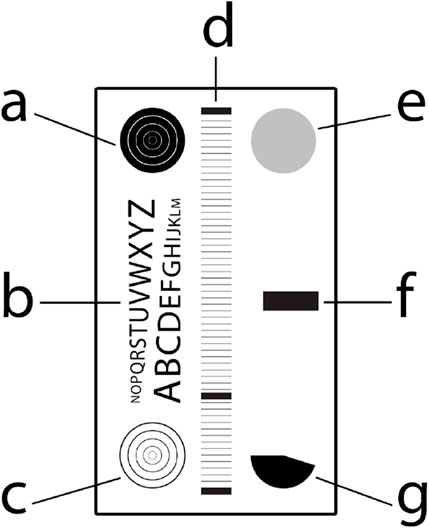
Figure 3. Evaluation pattern used.

Table 4. Explanation of the different effect on the pattern used for the assessment.
2.2 Experimental procedure
To determine if virtual reality allows screens to be evaluated under conditions comparable to a physical test, each participant conducts two successive evaluations, one in a physical environment and the other in VR, using one of two headsets randomly selected before the start of the experiment.
Each participant performed two successive evaluations (in random order), one in the real environment and the other in virtual reality, with one of the two headsets selected at random at the start of the experiment. The overall sequence and structure of the experiment can be seen in Figure 4. Variations in resolution, refresh rate, and brightness were introduced via video sequences, allowing the parameters to be dynamically modified independently of the medium (screen or headset). To avoid any prediction effects, each sequence was played between one and three times at random. In a first study, several parameters were simultaneously changed, which made it difficult to identify the perceived parameter. For this reason, the procedure was adjusted with a second study to systematically alternate between a reference animation (1080p, 30fps, 100% brightness) and a stimulus that varied only one parameter at a time.

Figure 4. Figure describing the experimental procedure.
For each experimental condition, each feature was tested three times per participant. When a change was perceived, the participant was asked to press a button on the controller, which recorded their reaction time, as well as errors and non-responses. For each experimental condition, each feature was tested three times per participant. When a change was perceived, the participant was asked to press a button on the controller, which recorded their reaction time. Reaction times were measured to quantify the interval between the appearance of a feature change and its detection by the participant: a short reaction time indicates that the change was easily detectable, whereas a longer reaction time suggests it was more difficult to perceive. In addition, special values were assigned in specific cases: a value of −1 was recorded when a participant failed to detect a change, and a value of −2 was recorded when the participant pressed the button multiple times for the same feature change, which was considered an error.
2.2.1 Population and sampling
During a first study (study A), 36 participants, aged between 24 and 57 years, were asked to detect variations in characteristics on the physical screen. Participants were requested to bring their corrective glasses if they had any vision issues. Of these 36 participants, 11 were women and the remaining 25 were men. A second study (study B) was then conducted with 19 new participants, including five women and 14 men, using an adjusted protocol. The participants were randomly assigned to four groups corresponding to the experimental conditions, with their order of evaluation described in Table 5 and their distribution detailed in Table 6. Both series were retained, and we plan to verify subsequently whether the results are sufficiently similar to be considered as a single combined dataset.
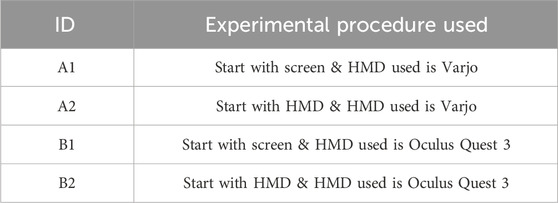
Table 5. Different experimental conditions used.
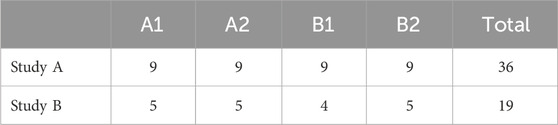
Table 6. Distribution of participants for the assessments.
3 Results
3.1 Statistical preprocessing of data
In order to determine whether the data from the two sets of measurements could be grouped together for each device (screen, Varjo, Oculus), we first checked their statistical properties. Normality was tested using the Shapiro-Wilk test, and homogeneity of variances was tested using the Levene test. Finally, the Mann-Whitney test was applied to assess the existence of significant differences between the series within each condition.
The results indicate that, for all conditions and series, the distributions deviate significantly from a normal distribution
A comparison of the reaction time distributions between the two series reveals a statistically significant difference
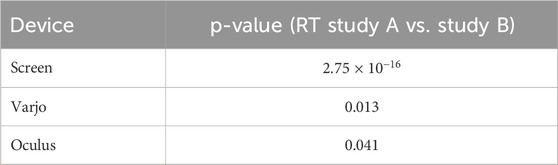
Table 7. p-values from the comparison of total responses between study A and study B for each device.
These observations indicate that the data from the two series cannot be considered as coming from the same statistical set for any of the experimental conditions. Consequently, all subsequent analyses were conducted separately for each series and each device, thus ensuring a rigorous and specific interpretation of the observed effects.
3.2 Overall device performance
Results presented in Table 8 indicate that regardless of the device tested (physical screen, Varjo, or Oculus), the proportion of correct responses decreases between the study A and study B, while the proportion of non-responses tends to decrease. These trends reflect a shift in detection strategies depending on the experimental context. However, there are marked differences between devices: the physical screen is the most stable reference, Varjo offers intermediate performance, and Oculus appears to be the most inconstant.
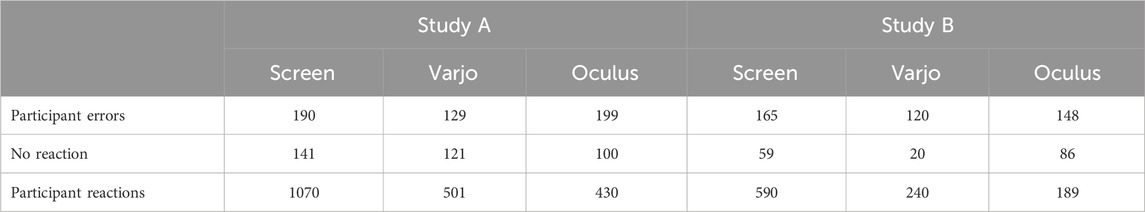
Table 8. Summary of errors, non-responses, and average reaction times for each device and series.
Table 9 shows that reaction times systematically increase from the Screen to the Varjo, and then to the Oculus across both study series, indicating a progressive decrease in performance in immersive VR environments. Mean and median reaction times are generally shorter in Study A, where multiple display characteristics could change simultaneously, making differences easier to detect and allowing participants to adapt more quickly. In contrast, Study B always returned to baseline characteristics and only one feature was altered at a time, limiting perceptual cues and resulting in longer reaction times as well as greater variability, as reflected by the higher standard deviations. The Screen yields the fastest and most consistent responses, the Varjo is slightly slower but remains relatively stable, while the Oculus shows the longest and most variable reaction times, reflecting increased perceptual and cognitive load associated with immersive simulation and lower visual fidelity. Overall, these results indicate that VR, particularly with lower-performance headsets, introduces a measurable perceptual delay and affects the consistency of users’ responses.
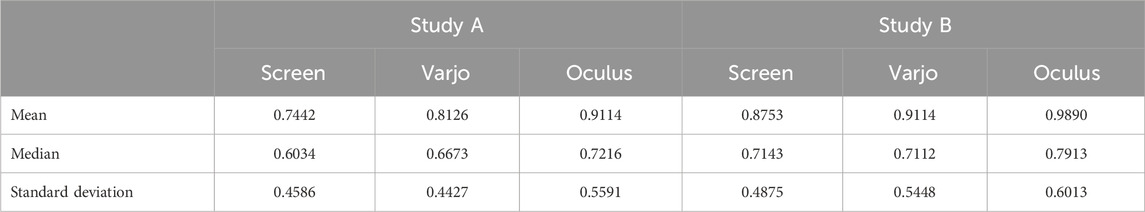
Table 9. Summary of mean, median, standard deviation of reaction times for each device and series.
Based on the results obtained, we compaired each HMD with the screen. And we can generate these heatmaps for each study (Study A and Study B) highlighting the characteristics for which VR headsets can reliably be used. These visualizations are visible in Figure 4 and in Figure 5, and can help to identify which technical aspects of a display can be effectively assessed in immersive environments.
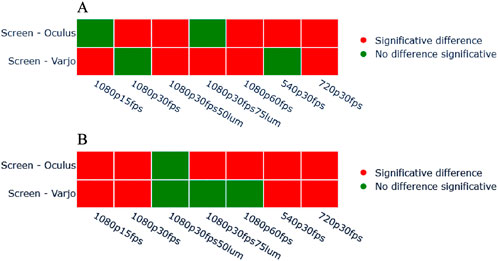
Figure 5. Heatmap representing the characteristics evaluable in VR for the study (A). Heatmap representing the characteristics evaluable in VR for the study (B).
3.3 Study A: Dynamic sequence
In the first study, participants had to detect a change in technical characteristics within a dynamic sequence (e.g., switching from 1080p30fps to 540p30fps, then to 1080p75lum). The results confirm the superiority of the physical screen, with medians between 0.553 and 0.652 s and moderate variability. The Oculus had higher reaction times, up to 1.034 s in 1080p15fps, and significant dispersion, particularly for 720p30fps. The Varjo fell between the two, with performance close to that of the screen and more stable than the Oculus. Variations in brightness (50 lum, 75 lum) are most easily detected: with the Oculus, the median drops from 0.963 s (1080p30fps) to 0.611 s (1080p30fps50lum). Higher frame rates (up to 60fps) generally improve detection, without systematically exceeding the 30fps reference. Changes in resolution (540p, 720p) do not induce any systematic trend. Finally, extreme times (
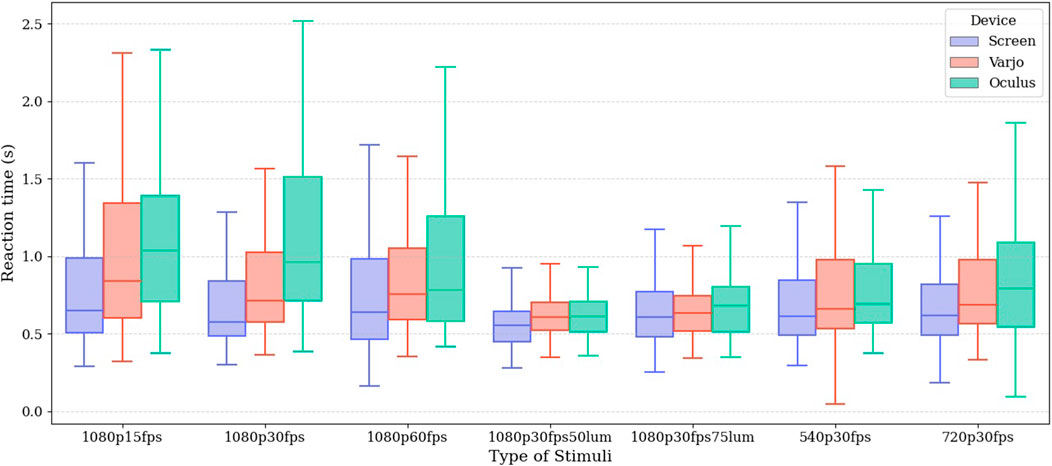
Figure 6. Reaction time by devices for each stimulus for the first serie.
3.4 Study B: comparison with a standard
In the study B, participants had to detect a visual change compared to a reference stimulus (1080p30fps) presented at a distance of 1 m. The physical screen gives reference times for the comparison (medians 0.553–0.652 s, with moderate variability). The Oculus showed longer times (up to 1.034 s in 1080p15fps) and marked variability, while the Varjo was closer to the screen with more stable performance. Fluctuations in brightness (50 lum, 75 lum) are the most detectable changes: with only 0.611 s (1080p30fps50lum) for the Oculus. Increasing the frame rate also improves detection, with no systematic advantage over 30fps. Resolution variations (540p, 720p) do not produce a clear effect. As with the study A, exceptionally long times (
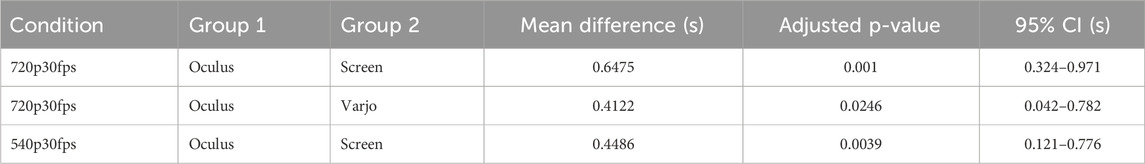
Table 10. Significant comparisons of reaction times for the first assessment series. Only differences greater than approximately 0.3 s are shown for clarity.

Table 11. Significant comparisons of reaction times for the second assessment series. Only differences greater than approximately 0.3 s are shown for clarity.
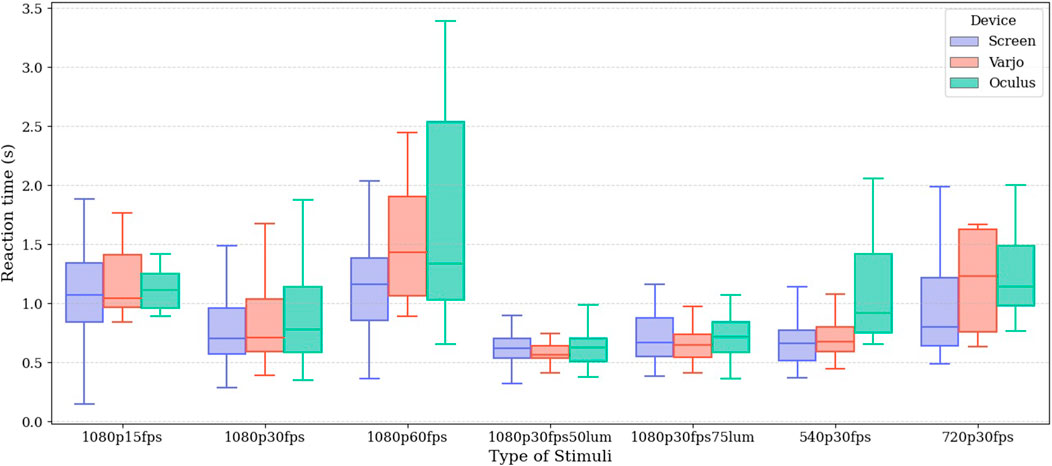
Figure 7. Reaction time by devices for each stimulus for the study B.
3.5 Comparative overview of series
A comparison between the two studies reveals a consistent hierarchy among the devices: the physical screen remains the one on which the assessment was easiest, followed by the Varjo, while the Oculus shows more variable and generally less favorable results. The main differences concern the nature of the tasks: in the study A, the difficulty stems from continuous detection, while in the comparison with a standard, the task is facilitated by the existence of a stable reference. In both cases, variations in brightness and frame rate appear to be the easiest to detect, while changes in resolution prove to be more ambiguous.
4 Discussion
This study aimed to evaluate the ability of immersive environments to reproduce the conditions for evaluating a physical display. The results highlight a clear hierarchy among the devices and confirm our expectations bases on theoritical calculations: the Varjo headset comes closest to the performance of a real display, while the Oculus shows more variable performance and is generally less accurate at detecting technical changes. Some characteristics are particularly discriminating: variations in brightness and frame rate are most easily detected by participants, while changes in resolution did not produce a systematic effect. To improve the accuracy and richness of the evaluations, it would be useful to modify the test pattern used to include colored elements, allowing for the evaluation of color perception and colorimetric fidelity in VR environments.
Regarding the initial hypotheses, the study shows that the high resolution of the Varjo does indeed allow for more precise perception of variations in resolution (H1 validated), while variations in frequency and brightness are detectable in a similar manner with both headsets (H2 and H3 validated). However, this study has limitations: the sample size is small and the experimental conditions are specific to our configuration. The results cannot yet be generalized to all virtual environments or all types of headsets. Future investigations could include a larger number of participants, a greater diversity of VR devices, and the evaluation of other visual characteristics such as colorimetry or dynamic contrast.
Overall, the results suggest that VR environments, particularly with high-resolution headsets such as the Varjo, are a credible alternative for certain screen evaluations, while highlighting the continuing superiority of direct physical evaluation for the most accurate measurements.
Data availability statement
The datasets presented in this article are not readily available because they involve confidential employee data, specifically sensitive reaction time measurements, the release of which would violate GDPR rules concerning the protection of personal data and the risk of re-identification or profiling. Requests to access the datasets should be directed to Nicolas VISBECQ,bmljb2xhcy52aXNiZWNxQHZvbHZvLmNvbQ==and Frédéric RABELLINOZnJlZGVyaWMucmFiZWxsaW5vQHZvbHZvLmNvbQ==.
Ethics statement
Ethical approval was not required for the studies involving humans because at the time of the study, it was not possible to establish an ethics committee, as such a body did not yet exist within our laboratory; it was only created a few months later. All participants were employees of AB Volvo, and after discussions with the legal department and the Renault Trucks Data Protection Officer (DPO), the study was approved based on the nature of the data collected—namely, anonymized user responses—and in compliance with GDPR regulations regarding data security. Although formal ethical approval was not required, all participants provided informed consent by signing a consent form prior to their involvement. Since all participants were Volvo employees, their data remained stored within Volvo’s internal databases, with access limited to the author; no one else had access to individual-level data. The studies were conducted in accordance with the local legislation and institutional requirements. The participants provided their written informed consent to participate in this study.
Author contributions
NV: Writing – review and editing, Project administration, Software, Writing – original draft, Methodology, Conceptualization. MM: Supervision, Conceptualization, Writing – review and editing, Methodology. J-PF: Investigation, Writing – review and editing, Supervision, Methodology, Conceptualization. FMe: Supervision, Methodology, Writing – review and editing, Investigation, Conceptualization. FR: Writing – review and editing, Supervision, Conceptualization, Project administration.
Funding
The authors declare that financial support was received for the research and/or publication of this article. The authors declare that no financial support was received for the research and/or publication of this article.
Conflict of interest
The authors declare that the research was conducted in the absence of any commercial or financial relationships that could be construed as a potential conflict of interest.
Generative AI statement
The authors declare that Generative AI was used in the creation of this manuscript. The authors declare that generative AI (ChatGPT, OpenAI) was used to reformulate and improve the syntax of some sentences. All content was manually checked afterwards to ensure factual accuracy and that the scientific meaning was not altered.
Any alternative text (alt text) provided alongside figures in this article has been generated by Frontiers with the support of artificial intelligence and reasonable efforts have been made to ensure accuracy, including review by the authors wherever possible. If you identify any issues, please contact us.
Publisher’s note
All claims expressed in this article are solely those of the authors and do not necessarily represent those of their affiliated organizations, or those of the publisher, the editors and the reviewers. Any product that may be evaluated in this article, or claim that may be made by its manufacturer, is not guaranteed or endorsed by the publisher.
References
Barten, P. G. J. (1999). Contrast sensitivity of the human eye and its effects on image quality. Bellingham, WA: SPIE Press.
Brainard, D. H., and Stockman, A. (2010). “Colorimetry,” in Encyclopedia of the Eye Editors D.R. H. Allan (Academic Press) 1 141–149.
Campbell, F. W., and Robson, J. G. (1968). Application of fourier analysis to the visibility of gratings. J. Physiology 197, 551–566. doi:10.1113/jphysiol.1968.sp008574
Chang, C.-H., Chan, L. K., and Lau, H. Y. (2020). A study of cybersickness and sensory conflict theory using a motion-coupled virtual reality system. Displays 61, 101922. doi:10.1016/j.displa.2019.08.004
Commission Internationale de l’Éclairage (CIE) (2018). Cie 15:2018 – colorimetry. Vienna, Austria: International standard.
Daly, S. (1993). The visible differences predictor: an algorithm for the assessment of image fidelity. Bellingham: SPIE.
Dowling, J. E. (2012). The retina: an approachable part of the brain. 2nd edn. Cambridge, MA: Belknap Press.
Hoffman, D. M., Girshick, A. R., Akeley, K., and Banks, M. S. (2008). Vergence-accommodation conflicts hinder visual performance and cause visual fatigue. J. Vis. 8 (33), 33–30. doi:10.1167/8.3.33
International Organization for Standardization (ISO) (2008a). Iso 9241-303:2008 – ergonomics of human-system interaction — part 303: requirements for display measurement methods. Geneva, Switzerland.
International Organization for Standardization (ISO) (2008b). Iso 9241-305:2008 – ergonomics of human-system interaction — part 305: optical laboratory test methods for electronic visual displays. Geneva, Switzerland.
Kolb, H. (2003). “How the retina works,” in Webvision: the organization of the retina and visual System.
Kress, B. C. (2020). Optical architectures for Augmented-, Virtual-, and mixed-reality headsets. Bellingham, WA, USA: SPIE Press. doi:10.1117/3.2559303
Masia, B., Wetzstein, G., Didyk, P., and Gutierrez, D. (2013). “The effect of sound on visual fidelity perception in stereoscopic 3-d,” in Proceedings of the 2013 IEEE international symposium on mixed and augmented reality, 1–4doi. doi:10.1109/ISMAR.2013.6671762
Melzer, J. E., and Moffitt, K. W. (1997). Head-Mounted displays: designing for the user. New York, NY, USA: McGraw-Hill.
Pelli, D. G., and Bex, P. J. (2013). Measuring contrast sensitivity. Vis. Res. 90, 10–14. doi:10.1016/j.visres.2013.04.015
Pinson, M. H., and Wolf, S. (2004). A new standardized method for objectively measuring video quality. IEEE Trans. Broadcast. 50, 312–322. doi:10.1109/tbc.2004.834028
Society for Information Display (SID) (2023). “Information Display Measurements Standard (IDMS) v1.2,” in International Committee for display metrology.
Society of Motion Picture and Television Engineers (SMPTE) (2011). “SMPTE RP 431-2:2011– digital cinema projection: reference projector performance and measurement,”. White Plains, NY, USA: Society of Motion Picture and Television Engineers (SMPTE).
Stockman, A., and Sharpe, L. T. (2000). The spectral sensitivities of the middle- and long-wavelength-sensitive cones derived from measurements in observers of known genotype. Vis. Res. 40, 1711–1737. doi:10.1016/s0042-6989(00)00021-3
Tregillus, S. (2019). “Evaluating visual quality in vr without calibration: case study and lessons learned,” in Proceedings of the ACM symposium on applied perception.
Keywords: virtual reality, human perception, displays assessment, immersive environments, virtual prototyping
Citation: Visbecq N, Moosavi M, Farrugia J-P, Merienne F and Rabellino F (2025) Virtual reality as a tool for perceptual evaluation of display characteristics. Front. Virtual Real. 6:1719546. doi: 10.3389/frvir.2025.1719546
Received: 06 October 2025; Accepted: 13 November 2025;
Published: 01 December 2025.
Edited by:
Dioselin Gonzalez, Independent Researcher, Greater Seattle Area, WA, United StatesReviewed by:
Yoichi Ogata, Choi-Ogata Platform, JapanJohannes Tümler, Anhalt University of Applied Sciences, Germany
Chiara Di Paolo, University of Modena and Reggio Emilia, Italy
Copyright © 2025 Visbecq, Moosavi, Farrugia, Merienne and Rabellino. This is an open-access article distributed under the terms of the Creative Commons Attribution License (CC BY). The use, distribution or reproduction in other forums is permitted, provided the original author(s) and the copyright owner(s) are credited and that the original publication in this journal is cited, in accordance with accepted academic practice. No use, distribution or reproduction is permitted which does not comply with these terms.
*Correspondence: Nicolas Visbecq, bmljb2xhcy52aXNiZWNxQHZvbHZvLmNvbQ==