 Rajesh Melaram1*
 Brandon Lopez-Dueñas2
- 1School of Health Sciences, Walden University, Minneapolis, MN, United States
- 2Department of Science, Eastern Florida State College, Melbourne, FL, United States
A Correction on
Detection and occurrence of microcystins and nodularins in lake Manatee and lake Washington-two Floridian drinking water systems
by Melaram, R., and Lopez-Dueñas, B. (2022). Front. Water 4:899572. doi: 10.3389/frwa.2022.899572
In the published article, there were errors in reporting the highest concentration in Lake Manatee and correlation results between nutrient and cyanotoxin concentrations.
Corrections have been made to the Abstract. The sentences previously stated:
“The highest toxin concentration (0.46 μg/L) was reported in Lake Manatee at Site 15, a location where other toxin concentrations demonstrated statistical significance with toxins detected at Sites 6 (p = 0.014) and 8 (p = 0.011).”
“Furthermore, phosphate and nitrite concentrations strongly correlated with total MCs and NODs in each lake (p < 0.01).”
The corrected sentences appear below:
“The highest toxin concentration (0.47 μg/L) was reported in Lake Manatee at Site 15, a location where other toxin concentrations demonstrated statistical significance with toxins detected at Sites 6 (p = 0.014) and 8 (p = 0.011).”
“Furthermore, phosphate and nitrite concentrations showed no significant relationships with total MCs and NODs in each lake (p > 0.05).”
Corrections have been made to the Introduction, Paragraphs 7 and 9. The sentences previously stated:
“ELISA can track relative changes in MC concentrations and serve as an indication to control algae blooms (Guo et al., 2005).”
“Two years later, the adjacent Manatee River was endured algal blooms scattered along riverbanks as blue and green hues.”
The corrected sentences appear below:
“ELISA can track relative changes in MC concentrations and serve as an indicator to control algae blooms (Guo et al., 2005).”
“Two years later, the adjacent Manatee River endured algal blooms scattered along riverbanks as blue and green hues.”
Corrections have been made to the Materials and Methods, Nutrient Measurement. The detection range of the Griess Reagent Kit ab234044 was missing. Also, the final concentrations of nutrients were incorrectly converted and reported as μg/L. The sentences previously stated:
“They assessed concentrations between 0.001 and 1 mM.”
“Final concentrations were converted and reported in μg/L.”
The corrected sentences appear below:
“They assessed concentrations between 0.001 and 1 mM and between 0.1 and 1 mM, respectively.”
“Final concentrations were converted and reported in mg/L.”
Corrections have been made to the Materials and Methods, Statistical Analysis. The units of concentration for nutrients (nitrite and phosphate) were misrepresented as μg/L. The sentences previously stated:
“Two-tailed Pearson correlations measured the strength of associations between nutrients and cyanotoxins.”
“For nutrients, 11 samples (nitrite) returned non-detectable concentrations (<0.01 μg/L).”
The corrected sentences appear below:
“Two-tailed Spearman rank correlations measured the strength and direction of associations between nutrients and cyanotoxins.”
“For nutrients, 11 samples (nitrite) returned non-detectable concentrations (<0.01 mg/L).
Corrections have been made to Results, Measurement and Frequency of Nitrite and Phosphate Concentration. The sentences previously stated:
“Nitrite concentrations occurred in 49 (81.66%) samples and ranged from 0.005 to 0.845 μg/L. In Lake Manatee, nitrite concentrations largely measured at 0.13 μg/L or 0.29 μg/L (Figure 4). Nitrite concentrations in Lake Washington varied considerably, with three samples having a concentration of 0.19 μg/L (Figure 5). Phosphate concentrations occurred in 60 (100 %) and ranged from 0.12 μg/L to 0.58 μg/L. Most samples had a concentration of 0.19 μg/L, with two samples attaining a maximum concentration of 0.52 μg/L (Figure 6).”
The corrected statements appear below:
“Nitrite concentrations occurred in 49 (81.66%) samples and ranged from 0.005 to 0.845 mg/L. In Lake Manatee, nitrite concentrations largely measured at 0.13 or 0.29 mg/L (Figure 4). Nitrite concentrations in Lake Washington varied considerably, with three samples having a concentration of 0.19 mg/L (Figure 5). Phosphate concentrations occurred in 60 (100%) and ranged from 0.12 to 0.58 mg/L. Most samples had a concentration of 0.19 mg/L, with two samples attaining a maximum concentration of 0.52 mg/L (Figure 6).”

Figure 4. Measurement of nitrite in Lake Manatee.
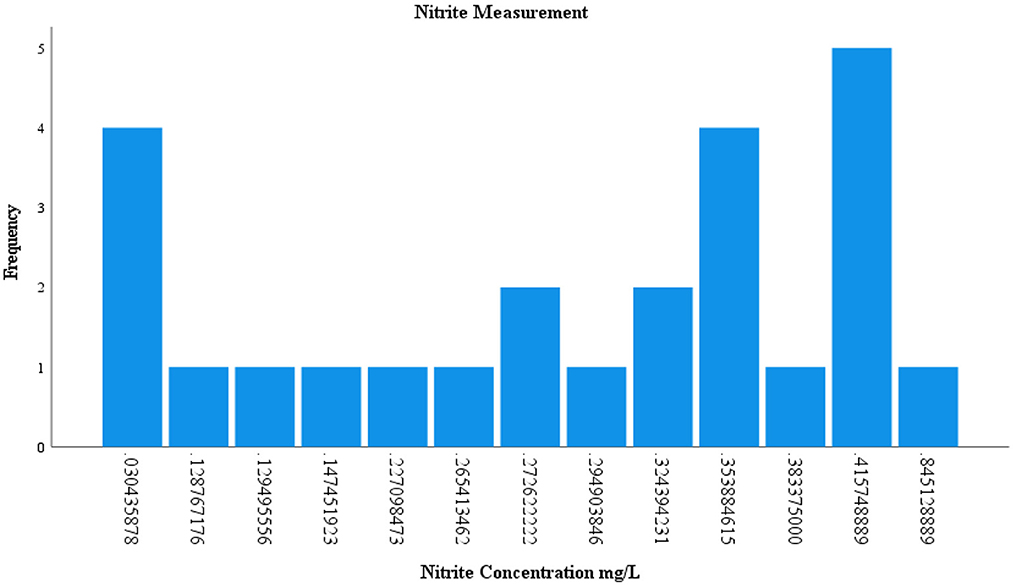
Figure 5. Measurement of nitrite in Lake Washington.
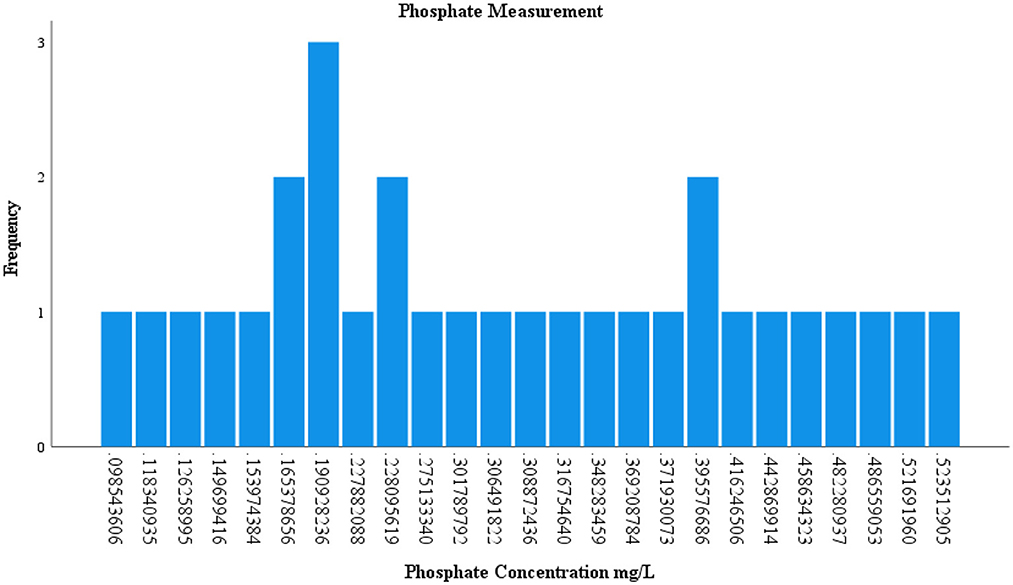
Figure 6. Measurement of phosphate in Lake Manatee and Lake Washington.
Corrections have been made to Results, Associations Between Nutrients and Cyanotoxins. The sentences previously stated:
“Associations between nutrient and cyanotoxin concentrations in Lake Manatee and Lake Washington were measured by two-tailed Pearson correlations. Correlation results indicated strong associations between total MC and NODs and nutrients in the drinking water systems (p < 0.01). Correlation coefficients were higher for associations between nutrients and total MCs and NODs in Lake Manatee (Table 3).”
The corrected statements appear below:
“Associations between nutrient and cyanotoxin concentrations in Lake Manatee and Lake Washington were measured by two-tailed Spearman rank correlations. Correlation results indicated no significant relationships between total MCS and NODs and nutrients in the drinking water systems (p > 0.05). Correlation coefficients were similar for associations between nutrients and total MCs and NODs in Lake Manatee and Lake Washington (Table 3).”
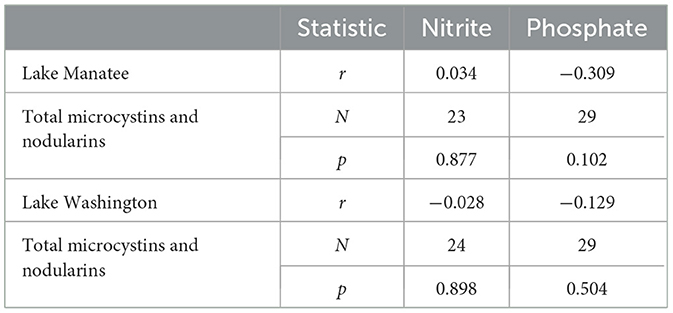
Table 3. Correlation coefficients for nutrients and total microcystins and nodularins.
Corrections have been made to Discussion, Paragraph 4. The sentences previously stated:
“Strong positive associations occurred between nutrient and cyanotoxin concentrations in each lake, suggesting increased nitrite and phosphate concentrations influence increased total MC and NOD concentrations. The observed associations supported multiple studies on nutrients and cyanobacterial growth (Smith et al., 2006; Dodds et al., 2009; Paerl et al., 2011; O'Neil et al., 2012). Total phosphorus demonstrated a weak relationship with MC concentrations in the Harris Chain of Lakes in Florida (Bigham et al., 2009), contradictory of the observed relationship between soluble phosphorus and total MCs and NODs in Lake Manatee and Lake Washington.”
The corrected statements appear below:
“No significant associations occurred between nutrient and cyanotoxin concentrations in each lake, suggesting nutrient availability alone may not directly influence total MCs and NODs during the sampling period. The observed associations differed from multiple studies on nutrients and cyanobacterial growth (Smith et al., 2006; Dodds et al., 2009; Paerl et al., 2011; O'Neil et al., 2012). Total phosphorus demonstrated a weak relationship with MC concentrations in the Harris Chain of Lakes in Florida (Bigham et al., 2009), which is consistent with the weak relationship observed between phosphate and total MCs and NODs in Lake Manatee and Lake Washington.”
In the published article, there was an error in the units of concentration in Figures 4, 5, and 6 as published. In addition, the presentation of Figure 5 was representative of phosphate as opposed to nitrite. The corrected Figures 4, 5, and 6 are presented below.
There was an error in the presentation of results in Table 3. These originally stated r 0.955 and 0.986, N 24 and 30, and p < 0.01 and < 0.01 for nitrite and phosphate, respectively, in Lake Manatee, and r 0.876 and 0.988, N 25 and 30, and p < 0.01 and < 0.01 for nitrite and phosphate, respectively, in Lake Washington.
The corrected Table 3 appears below.
In the published article, there was an error in Supplementary Table 3. The units of concentration were missing, as well as the nutrient concentration levels for Sample ID 30 in Lake Manatee and Lake Washington. The correct material statement appears below.
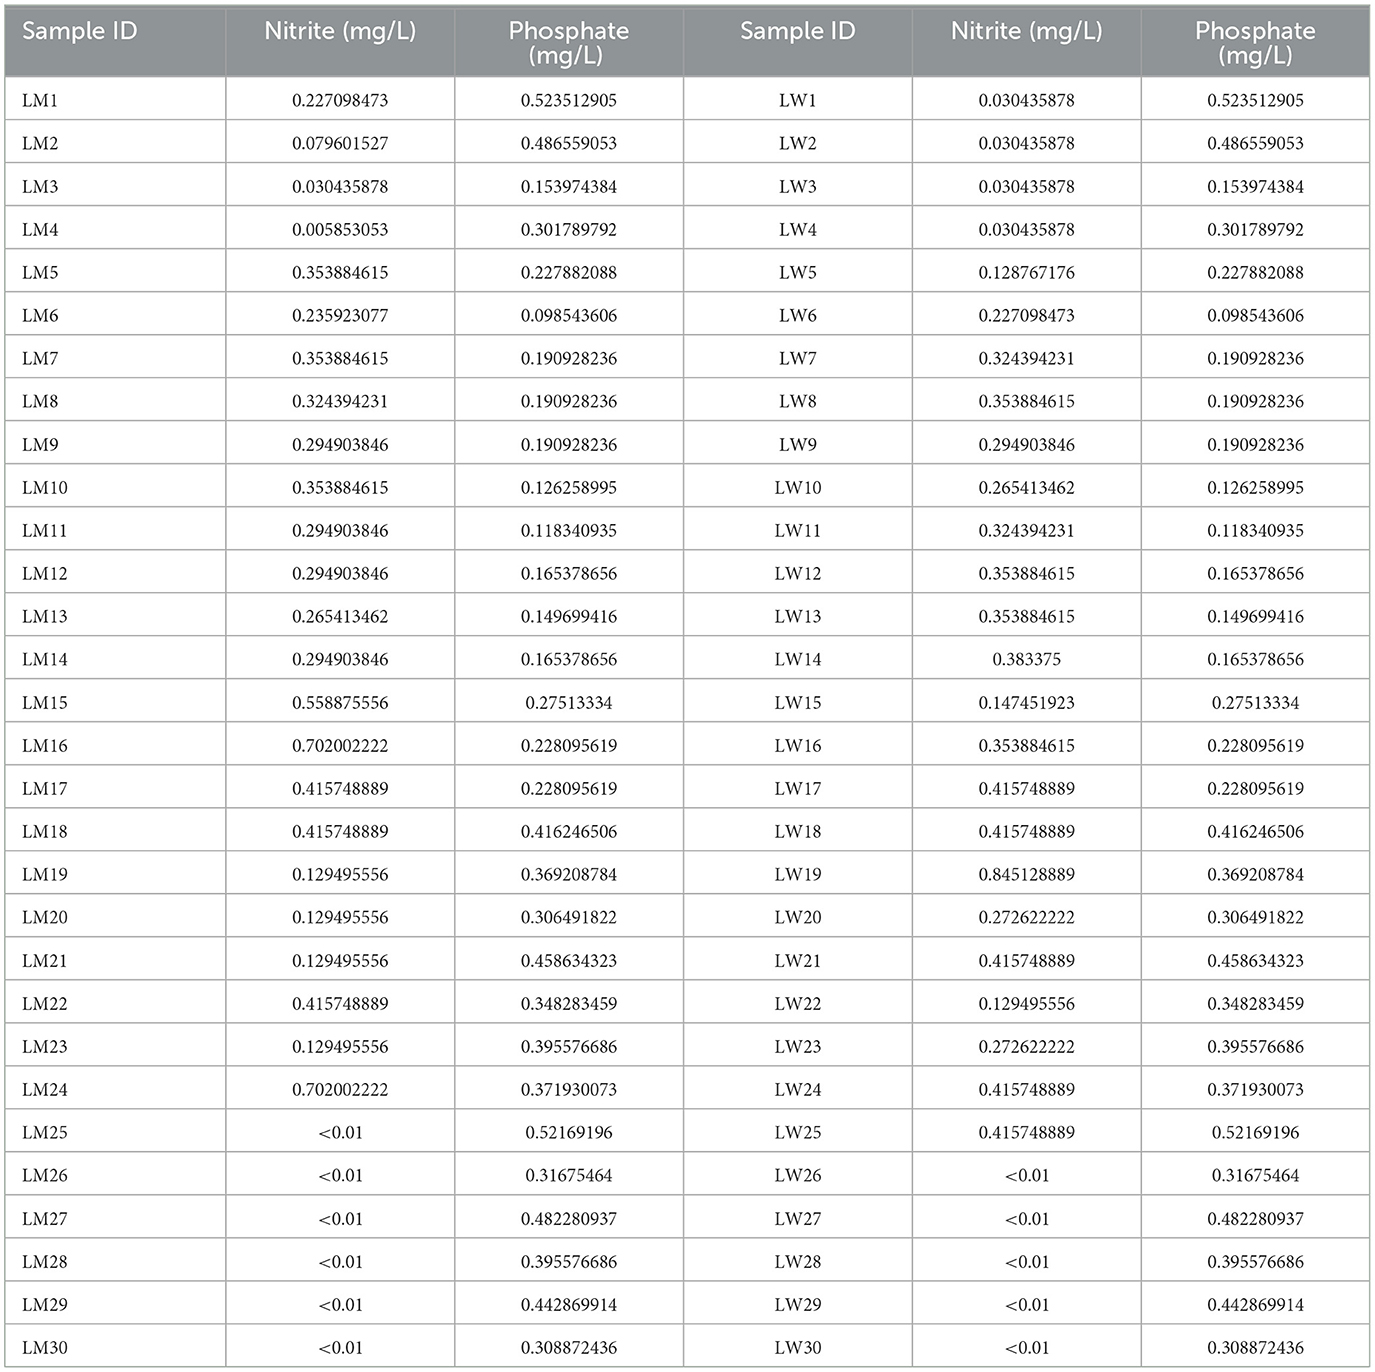
Supplementary Table 3. Concentrations of nitrite and phosphate in environmental samples from Lake Manatee and Lake Washington.
The original article has been updated.
Generative AI statement
Any alternative text (alt text) provided alongside figures in this article has been generated by Frontiers with the support of artificial intelligence and reasonable efforts have been made to ensure accuracy, including review by the authors wherever possible. If you identify any issues, please contact us.
Publisher's note
All claims expressed in this article are solely those of the authors and do not necessarily represent those of their affiliated organizations, or those of the publisher, the editors and the reviewers. Any product that may be evaluated in this article, or claim that may be made by its manufacturer, is not guaranteed or endorsed by the publisher.
Keywords: drinking water, enzyme-linked immunosorbent assay, microcystins, nodularins, cyanotoxin
Citation: Melaram R and Lopez-Dueñas B (2025) Correction: Detection and occurrence of microcystins and nodularins in Lake Manatee and Lake Washington-two Floridian drinking water systems. Front. Water 7:1653373. doi: 10.3389/frwa.2025.1653373
Received: 24 June 2025; Accepted: 20 August 2025;
Published: 18 September 2025.
Edited and reviewed by: Xubo Gao, China University of Geosciences Wuhan, China
Copyright © 2025 Melaram and Lopez-Dueñas. This is an open-access article distributed under the terms of the Creative Commons Attribution License (CC BY). The use, distribution or reproduction in other forums is permitted, provided the original author(s) and the copyright owner(s) are credited and that the original publication in this journal is cited, in accordance with accepted academic practice. No use, distribution or reproduction is permitted which does not comply with these terms.
*Correspondence: Rajesh Melaram, cmFqZXNoLm1lbGFyYW1Ad2FsZGVudS5lZHU=