 Joyce H. D. M. Westerink1,2*
 Roos J. E. Rajae-Joordens1Martin Ouwerkerk1Marieke van Dooren1Sam Jelfs1
 Ad J. M. Denissen1Eric Penning de Vries3Raymond van Ee1,4,5
- 1Department Brain, Behavior and Cognition, Philips Research, Eindhoven, Netherlands
- 2Human-Technology Interaction Group, Eindhoven University of Technology, Eindhoven, Netherlands
- 3Philips IP&S, Integrated Technology Solutions, Eindhoven, Netherlands
- 4Donders Institute for Brain, Cognition and Behavior, Radboud University, Nijmegen, Netherlands
- 5Laboratory of Experimental Psychology, University of Leuven, Leuven, Belgium
In order to find a stress indicator that can be used to monitor stress with wearables, we compare the almost instantaneous effects of psychological stress on skin conductance, with the effects on the stress hormone cortisol, peaking about 20–30 min later. We modeled this relation deploying a convolution of the height of the skin conductance peaks with the cortisol stress response curve, and used it to determine a skin conductance-derived estimate of stress-induced cortisol. We then conducted a first experiment to validate this model, comparing the stress-induced cortisol estimates with cortisol as measured in saliva samples. Participants (N = 46) completed stressful, boring, and performance tasks in a controlled laboratory setting. Salivary cortisol samples were taken at regular moments. Based upon the pattern of measured salivary cortisol before and after the performed stressful task we divided subjects in high-cortisol responders and low-cortisol responders. For both groups, we found substantial correlations between the skin conductance-based stress-induced cortisol estimates and the measured salivary cortisol. In addition, the (Fisher-corrected) mean within-participant correlation between these variables was found to be 0.48, which proved to be significantly different from zero. These findings support the use of the skin conductance-based stress-induced cortisol estimates as a stress indicator reflecting in-body cortisol changes.
Introduction
Psychological stress—which comprises cognitive, emotional, and psychosocial stress—can compromise health when not adequately dealt with. Short periods of psychological stress can cause sleep disturbance, fatigue, headaches, and mood changes (Arnsten, 2015). Accumulated psychological stress can cause anxiety, depression, chronic fatigue, digestive problems, autoimmune disease, and cardiovascular disease (Arnsten, 2015). Monitoring devices have become available to allow users to become aware of their stress levels and to adequately deal with them. Usually, these devices track various aspects of the activation level of the autonomic nervous system through skin conductance or heart beat measurements. However, frequently the direct relationship of these measurements with psychological stress is not clear. In this article, we therefore attempt to take another approach: We operationalize the stress level as the amount of stress-induced cortisol in the body, and we estimate this level from skin conductance measurements. Our intention is to find an estimate of stress-induced cortisol that can be used as a stress indicator in wearable monitoring devices that make users aware of their stress levels.
It is generally accepted that there are two main stress responses: a quick neural stress response and a delayed hormonal stress response (Gunnar and Quevedo, 2007). The neural stress response is mediated by the nerves of the sympathy-adreno-medullary pathway, acting quickly (in the order seconds) to immediate danger or challenge, preparing the body for a fight or flight response, being accompanied by rapid increases in sweat gland activity, heart rate, breathing rate, etc. The hormonal stress response is a much slower response mediated by the hypothalamo-pituitary-adrenal pathway, secreting the stress hormone cortisol, yielding a peak after a delay of about 25 min (Kirschbaum et al., 1992; Gunnar and Quevedo, 2007).
One of the consequences of high levels of cortisol is a reduced cognitive functioning (Arnsten, 2015). This cognitive functioning is regulated via cortisol-sensitive receptors in the hippocampus, which are involved in e.g., the consolidation of memory, and in the prefrontal cortex, which is involved in e.g., decision making (Arnsten, 2015). For example, participants with a high cortisol response showed poorer declarative memory performance after psychosocial laboratory stress (“Trier Social Stress Test”) than those with a low cortisol response (Kirschbaum et al., 1996). Another study demonstrated that memory retrieval of a word list (learned 24 h earlier) by free recall was significantly impaired after a psychosocial stress condition (Kuhlmann et al., 2005a). Similar effects on free recall were found when cortisol was administered (Kuhlmann et al., 2005b). In addition, subjects exposed to psychosocial stress showed significant working memory impairments in workload conditions as measured by the n-Back Working Memory Task (Schoofs et al., 2008). Thus, psychological stress leads to increased cortisol, thereby subsequently affecting cognitive functioning.
Importantly, successive stressors are bound to cause accumulating cortisol responses as it takes time before an individual stress-induced cortisol response extinguishes. Thus, we hypothesize that not only a serious stressor, but also a sequence of relatively light stressors may give rise to increased cortisol levels. For optimal cognitive performance it may, therefore, be of interest to provide people with a means that supports them to avoid high levels of cortisol. Currently, however, methods to determine the cortisol level are intrusive (blood-plasma sampling) or time-consuming (saliva assays) and are, therefore, impractical to form the basis for such support.
Since psychological stress results in both a skin conductance peak (Figure 1, t1) as well as a cortisol release which peaks about 20–30 min later (Figure 1, t2), a relatively simple skin conductance measure may be predictive of the upcoming cortisol level 20–30 min later. Skin conductance is one of the symptoms of the stress response, because of the immediate secretion of sweat by the eccrine sweat glands, found all over the body (Allen et al., 1973; Boucsein, 2012; Machado-Moreira and Taylor, 2012; Van Dooren et al., 2012). Variations in skin conductance can be relatively easily measured by passing a weak current through the skin (Boucsein, 2012), also by means of wearables devices (Poh et al., 2010; Ouwerkerk et al., 2013).
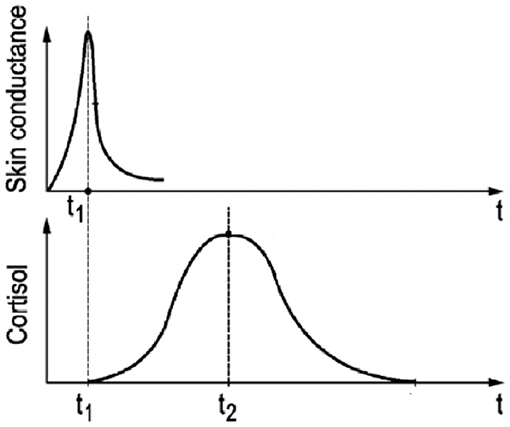
Figure 1. Schematic graphical representation of the temporal relation between skin conductance response (t1) and the delayed cortisol response (t2) to a short-lasting psychological stressor (t = 0).
In this paper we investigate whether it is possible to estimate, and predict, stress-induced cortisol from wearable-based skin conductance measurements. Below we first derive a model to estimate the upcoming accumulated cortisol increases for a series of events through calculating the convolution of the related skin conductance peaks with the cortisol response curve. Afterwards we present results of an experimental validation of the model's skin conductance-derived estimate of stress-induced cortisol (ESIC) on the one hand, and cortisol as measured in saliva samples on the other hand. To that end we exposed participants to a boring task (Psychomotor Vigilance Task), a stressful task (Trier Social Stress Test), and a performance task measuring working memory (n-Back Working Memory Task) in a controlled laboratory setting, while taking salivary cortisol samples at regular moments.
Model: Accumulative Cortisol Estimation
The essence of our model is that we assume that each increase in skin conductance reflects the presence of a stressful event, and that each stressful event is followed by an increase (and subsequent decay) in cortisol level. In order to make this quantitative, two elements are needed: a way to detect increases in skin conductance and a way to model the cortisol response. We will start by describing the latter.
The salivary cortisol response (e.g., Kirschbaum et al., 1992) describes the body's cortisol reaction to a stressing event over time, i.e., how the cortisol level rises after the stressing event, comes to a peak about 20–30 min later, and then slowly decays afterwards until it is close to zero after 90 min. This cortisol response (CoRe) can be parameterized using the equation below where g is a gain, cr is a rise time constant, and cd is a decay time constant:
We use the above equation to parameterize the cortisol response to the Trier Social Stress Test as measured by Kirschbaum et al. (1992). It has been demonstrated using the Trier Social Stress Test, that the curve is different for male and female (Kirschbaum et al., 1992): Figure 2 shows that the effect of exposure to the Trier Social Stress Test lingers on in the salivary cortisol concentration up to 90 min for females and even longer for men. The curve parameters that are associated with the approximation of the data of Kirschbaum et al. (1992) are represented in Table 1. The rise time constant cr is similar for both sexes, whereas the decay time constant cd differs considerably. The gain parameter g is about 1.5 times larger for females than for males. Note that in the calculations for Figure 2 we assumed the baseline cortisol level (4.3 nmol/l) to be constant, which has been subtracted from Kirschbaum's data. It must be further noted that these data involve prolonged exposure (20 min) to a stressful period, as opposed to exposure to a single short-lasting stressor. The cortisol-curve for a single stressor may therefore be more peaked.
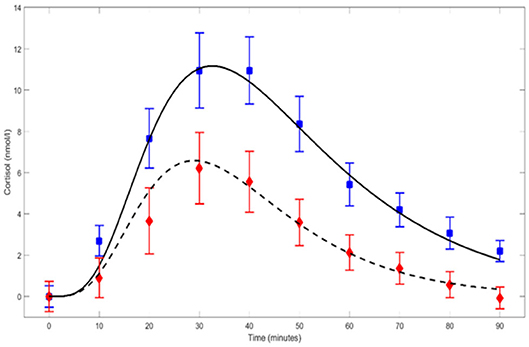
Figure 2. Parameterized CoRe cortisol response curves for males (solid line) and females (dashed line) after prolonged exposure (20 min) to, amongst others, the Trier Social Stress Test. The curves are based on data points (blue-male; red-female) published by Kirschbaum et al. (1992). Error bars represent ±SE.
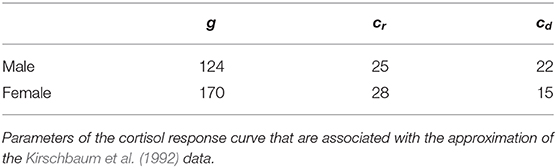
Table 1. Cortisol response curve parameters.
In our model we use the cortisol response curve to predict the stress-induced cortisol response to a stressful event, and this stressful event we detect from the skin conductance data. The presence and timing of a stressful event is determined from a steep increase (e.g., a peak) in skin conductance, and the strength of the stress of such an event is estimated from the height of this skin conductance increase. When such a steep skin conductance increase is detected, our model assumes that this is the start of a gradual increase (and subsequent decay) of bodily cortisol following the cortisol response curve described above. The height of the cortisol response is modeled to be proportional to the height of the increase in skin conductance, which means that larger skin conductance peaks are assumed to lead to larger cortisol responses.
As argued in the Introduction section, in order to calculate a stress-induced cortisol level also the accumulation of past events needs to be taken into account. This model indeed allows to predict bodily cortisol on the basis of multiple subsequent stressful events by just adding up the cortisol effects for each them. Ultimately, our Estimation of the level of Stress-Induced Cortisol (ESIC) is calculated by accumulating all cortisol responses to all individual skin conductance increases at each moment in time. In mathematical terms this procedure involves a convolution of the skin conductance peak height with the cortisol response curve:
in which Hi and ti are the height and time, respectively, of each of the N skin conductance peaks detected in a 90-min period before the present time t. The cortisol response (CoRe) to any skin conductance peak that might have occurred before that period has died out already in the meanwhile, and thus these earlier peaks do not contribute anymore to the present ESIC estimate. Given the shape of the cortisol response CoRe curve, formula (2) can also be understood as a combination of a low-pass filter in combination with a 30-min delay.
The convolution formula also allows us to predict upcoming stress-induced cortisol level changes, since a skin conductance peak at the present moment corresponds to an elevated stress-induced cortisol level after 20–30 min. For illustration of the model, Figure 3 shows the skin conductance trace of a female volunteer having psychological stress, together with the coupled salivary cortisol response curves to the strongest stressors. The individual cortisol contributions associated with the single stressors are accumulated into a cortisol level variation contributed by the stressors.
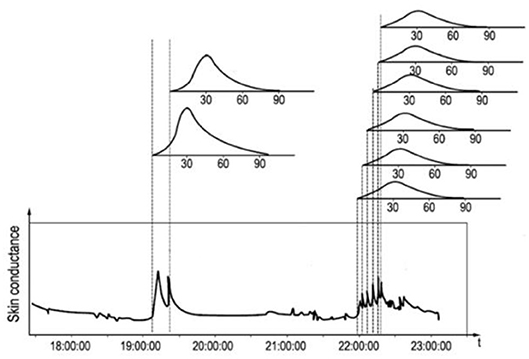
Figure 3. Skin conductance trace of a female with its characteristic response peaks and the hypothesized associated delayed salivary cortisol response curves above the graph.
Note that the skin conductance signal is known to provide information about the psychological state of the person involved. Thus, the cortisol estimates and predictions are restricted to cortisol fluctuations that have a psychological origin. Therefore they do not account for changes in cortisol level due to other origins, such as the cortisol awakening response (Dierolf et al., 2016), food intake (Follenius et al., 1982), or physical activity (Buddea et al., 2010; Nikolic-Popovic and Goubran, 2011). As a consequence, our model is only intended to predict changes—not absolute values—in bodily cortisol levels due to (psychological) stress.
We developed computational tools (using MATLAB) for the determination of the level of stress-induced cortisol. Figure 4 provides an example of such a calculation. In this figure the skin conductance is depicted for a 10-h period (blue trace). After applying a 10 Hz lowpass filter to remove wideband noise from the raw skin conductance (SC) signal, it is checked for missing data and for contact artifacts by detection of fast edges: Edges increasing faster than 10% of SC level per second, or decreasing faster than 1% per second are flagged. For missing data and for ±500 ms windows around the flagged edges SC values are replaced by the most recent trusted SC value. Then a moving average filter at 0.75 Hz is applied for further noise removal, and in this filtered skin conductance signal peaks are detected using a method capitalizing on the 1st derivative of this curve: a negative-to-positive zero-crossing is detected as the start of the peak, and the following positive-to-negative zero-crossing as its top. The rise time in between should be at least 1 s. From the peak heights (black spikes) the cortisol level (red trace) has been calculated using the mentioned convolution with the cortisol response. In Figure 3, a series of skin conductance responses can be seen, as they could have been caused by a number of consecutive stressors. Each estimated cortisol peak is calculated as the sum of an estimated cortisol response to a single event and the residual cortisol peaks of previous stress events. Note that the gain factor g of the cortisol response curve will only determine the height of the resulting cumulative cortisol curve (red line in Figure 4), but not its pattern of tops and valleys. The same holds for the range of the skin conductance signal itself (the range of the blue line): a large range will lead to a higher cumulative cortisol curve, but the pattern of tops and valleys will be independent of it.
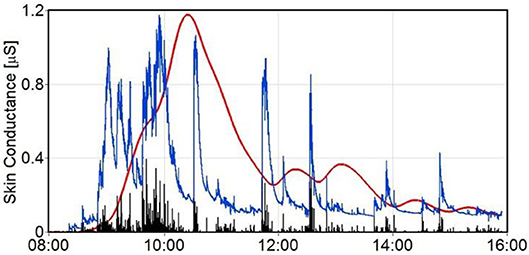
Figure 4. Raw skin conductance trace (blue) with calculated cumulative cortisol estimates (red trace) caused by the psychological stressors. Peak heights are shown as black spikes.
In the remainder of this paper we experimentally investigate whether the skin conductance-derived stress-induced cortisol estimations are indeed related to the actual cortisol values in the body. While we do not anticipate that the estimated cortisol values are identical to the actual cortisol values in absolute level, we hypothesize that a correlation between the two may be present.
Experimental Methods
In the experiment we monitored skin conductance while regular saliva-based cortisol samples were taken.
Participants
Forty-six healthy volunteers (18 males, 28 females) were recruited by an external agency and took part in the experiment. Their ages were relatively equally distributed between 25 and 55 years, with an average age of 43 years (±8 years SD). All volunteers self-reported to be in healthy mental and physical condition. To check further on inclusion and exclusion criteria, participants filled out an online screening questionnaire and indicated to be free from the following medical conditions: ADHD, allergies, anxiety disorders, diabetes, epilepsy, skin disease, obesity, psychological complaints, psychosis, and dementia. Also pregnant women and persons with a pacemaker, a medication pump, a neuro-stimulator, or a prosthesis were excluded. All volunteers signed an informed consent form and received a monetary incentive for their participation.
Device
A (CE-approved) in-house wearable wristband was used for measuring skin conductance throughout the experiment: the DTI-4, a successor of a well-described earlier device (Ouwerkerk et al., 2013). Wrist-based wearables like this one have proven their usefulness in measuring skin conductance (Poh et al., 2010). The DTI-4 has the measurement electrodes located on the outside of the wrist (dorsal), samples at a frequency of 160 Hz, and was worn on the dominant hand (see Figure 5). It had a range of 16 μSiemens, a 24-bit analog-to-digital conversion, and used circular platinum-plated metal electrodes.
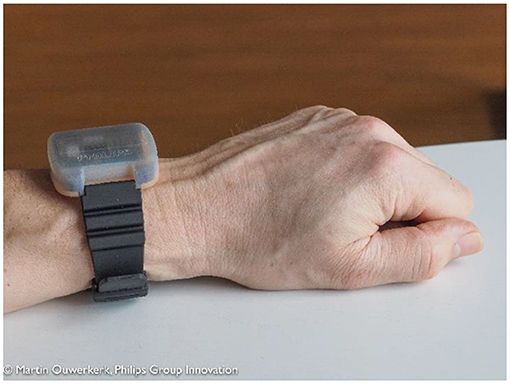
Figure 5. The DTI-4 worn on the outside of the wrist.
Questionnaires
Participants completed the “Perceived Stress Scale” (PSS-10) (Cohen et al., 1983) at the intake meeting to gain information about their stress levels during the past month. Individual scores of the PSS can range from 0 to 40. To assess the subjects' momentary feelings the Positive Affect and Negative Affect Scale (PANAS) (Watson et al., 1988) was administered as well.
Cortisol Collection
Saliva sampling was obtained with standard commercially available salivettes consisting of a cotton wad (swab) to put underneath the tongue for absorbing saliva, and a container to collect it. The timing of the sample collection was aligned with the tasks in the experiment. Saliva samples were stored in a refrigerator at a temperature of −26°C. Subsequently, the Saliva samples were processed using an immunoassay method by Daacro Saliva Lab (Trier, Germany).
Procedure
At the intake session, subjects were asked to fill out the Perceived Stress Scale. Well before the start of the experiment, the DTI devices were attached to the participant. Between 13.00 and 16.00 h, the experiment, consisting of a 1-h Psychomotor Vigilance Task (PVT), a 20-min break, an n-Back Working Memory Task (NBACK), a Trier Social Stress Test (TSST), another n-Back Working Memory Task, and an exit interview, was executed. During this experiment, nine saliva samples were collected at various fixed moments: M1, M2, and M3, at the beginning, one third, and end of the PVT (so at 0, 20, and 60 min); M4 and M5 at the beginning and end of the first NBACK each 20 min later; M6 and M7 directly before and after the TSST with 10 min in between; M8 at the end of the last NBACK 20 min later; and one last sample at M9, the end of the experiment.
The Psychomotor Vigilance Task (PVT) is a simple reaction time task to evaluate sustained attention and was carried out as the first of all tasks in the lab. It is known to be boring rather than stressful. Subjects were instructed to respond as fast as possible to a small and low-contrast visual cue that appeared on a computer monitor. The interstimulus interval varied randomly between 2 and 10 s. The task was carried out in a dark room. After the first hour of PVT task, subjects got a 20-min break in which they could drink water or decaffeinated tea, but no coffee. All subjects reported to feel bored and some reported to feel sleepy.
After the break, a first session of the n-Back Working Memory Task (NBACK) was carried out for 20 min. In this task subjects indicate, as fast as possible, whether a newly presented letter matched the nth letter back in the temporal sequence of presented letters. Each participant first performed a 1-back and 2-back practice block of 24 trials each, and then 10 critical blocks of 24 trials each (alternating between 2- and 3-back). Trials began with a central fixation cross for 500 ms, followed by the stimulus in that location for 500 ms, followed by a blank 2,750 ms interstimulus interval. We instructed participants to respond as quickly and accurately as possible whether each letter matched the letter presented n positions earlier in time.
Next, a conventional Trier Social Stress Test (TSST) was administered. The TSST is a validated method to increase the stress level of subjects in a laboratory setting (Kirschbaum et al., 1993). For this TSST a participant was brought into a separate room and asked to prepare for a job interview in the coming 5 min concerning a vacancy for a marketing position, for which preparation material was given. After 5 min a panel of collaborators entered the room and the participant was asked to present his suitability for the vacancy in a free speech of 5 min. This is considered to be a particularly stressful task because it involves lack of control over the stressor as well as social evaluation (Frankenhaeuser, 1992; Al'Absi et al., 1997). Directly before and after the TSST task subjects completed the PANAS questionnaire to measure positive and negative affect. A saliva sample was taken while filling in each questionnaire.
After the TSST and the subsequent PANAS questionnaire, the second NBACK session of 10 blocks of 24 trials was carried out, at the end of which another saliva sample was taken. Then the participant was brought to a different room for taking off the devices and for a debriefing. The majority of the participants indicated to have experienced the PVT as easy and boring, whereas they found both the NBACK and TSST difficult and arousing. After the debriefing the final saliva sample was collected.
Analysis
One participant was excluded from task performance analyses because he did not seriously commit to perform the PVT and NBACK. The relation between his saliva samples and his DTI measurements, however, was considered reliable, as it is not influenced by his lack of commitment. Statistical analyses were carried out with SPSS statistics (v23.0).
Analysis of Questionnaires
The Perceived Stress Scale scores were obtained by summing across its 10 items, after reversing the scores on the four positive items. The Positive Affect Score was derived from the PANAS by adding the scores on the positive items, while the Negative Affect Score was the result of summing up the remaining items. Negative Affect Scores and Positive Affect Scores were calculated both before and after the Trier Social Stress Test (TSST). In order to test the effect of the TSST on positive affect, mean Positive Affect Scores were analyzed using the non-parametric Wilcoxon test for two related samples with Time (2 levels: before vs. after TSST) as within-subject factor. A similar analysis was performed for the mean Negative Affect Scores.
Analysis of Cortisol
The cortisol swabs were processed by Daacro GmbH, Trier, Germany, and measured for their cortisol concentration in nmol/l. Duplo tests were made for each sample, and repeated when not comparable within 10% (or less for small cortisol values). The average of the two duplo values was taken for further analyses. A repeated measures ANOVA with Time as a 9-level within-subject factor was performed on the cortisol values to establish the presence of a cortisol variation. Participants were assigned to a high-responder group if they individually showed an increase in cortisol level from before to after the TSST; if not, they were assigned to the low-responder group.
Analysis of Performance
For the performance analyses of the PVT task, mean reaction times (RT) were calculated for 15 sequential epochs of 4 min each. Only valid responses with a RT <500 ms were taken into account. Invalid responses, i.e., RT≥500 ms or missing responses, were labeled as a “lapse.” The PVT performance measures were each analyzed with a repeated measures ANOVA, with Time (15 levels for the 15 sequential 4-min epochs) as a within-subject factor, and stress responder group (2 levels: high stress response, low stress response) as a between-subjects factor.
For the performance analyses of the NBACK task, mean reaction times (RT) of all correct responses were calculated. This was done for both sessions (the one before and the one after the TSST). In addition, accuracy was calculated by dividing the total number of correct responses by the total number of presented trials. These NBACK performance measures were each analyzed with a repeated measures ANOVA, with Time (2 levels: pre-TSST, post-TSST) as a within-subject factor, and stress responder group (2 levels: high stress response, low stress response) as a between-subjects factor.
Analysis of Skin Conductance
We calculated the estimated stress-induced cortisol (ESIC) values from the raw DTI-4 skin conductance (SC) signal by applying the convolution of the skin conductance peaks with the cortisol response curve, as described before, taking the gender of the participant into account. In this process we replaced artifacts and missing data by the last trusted SC sample, which of course makes the ESIC calculations less trustworthy. Therefore, we made an estimate of the trustworthiness of the ESIC values by putting the quality signal (consisting of 0's for missing data and data in a ±500 ms window around detected artifacts, and 1's for the rest of the data) through the ESIC convolution algorithm as well, thus convoluting the quality signal itself with the cortisol response curve. The result is a so-called ESIC-OK signal, which is calculated for each moment in time, can vary between 0 and 1 itself as well, and gives an indication of the trustworthiness of the estimated ESIC values.
For comparison of the results of our ESIC algorithm with the measured salivary cortisol levels, we extracted the values of the (continuous) ESIC and ESIC-OK signals for each moment at which we took a cortisol swab. We did so by averaging the ESIC and ESIC-OK values over a 10-min window around these moments, and we call these our ESIC and ESIC-OK estimates. In further processing we only used ESIC estimates that we considered trustworthy, that is, when the ESIC-OK estimate for that moment in time was 0.90 or higher. Since our model predicts changes in cortisol levels rather than absolute levels, we reverted to correlations to assess how well these ESIC estimates reflect the salivary cortisol values. Thus, we correlated the mean measured salivary cortisol values with our mean normalized (z-score transformed) ESIC estimates. For each participant also an individual (Pearson) correlation was computed. We also calculated the Fisher-corrected average correlation over participants, and used a t-test on this correlation to assess whether it was significantly different from zero.
Experimental Results
Cortisol
Figure 6 depicts the mean salivary cortisol levels obtained during the experiment. A repeated measures analysis of variance of salivary cortisol with Time as a within-subject factor (9 levels for the 9 saliva samples) revealed that cortisol varied significantly over the course of the experiment [F(8, 34) = 8.198, p < 0.001]. For three participants, one or two cortisol samples were missing. As a repeated measurement ANOVA procedure cannot deal with missing values these three participants were omitted from this analysis.
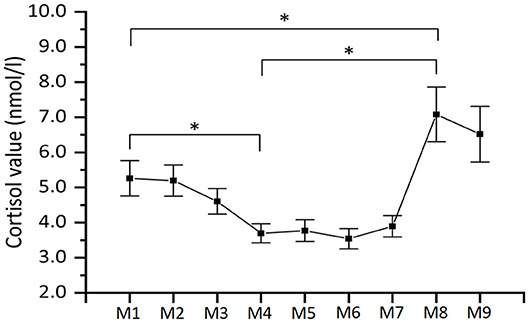
Figure 6. Mean salivary cortisol levels (n = 45). As explained in the main text, the labels along the x-axis specify the moment of collection of the saliva sample. Note that the time periods between the moments of collection of the saliva sample are not equally distributed over time. Error bars represent ±SE. *indicate statistically significant differences.
Since cortisol is known to peak after a delay of 20–30 min, the M1 sample taken the beginning of the PVT task, reflects the stress evoked 20–30 min earlier at the beginning of the experiment when participants arrived at the test room. Similarly, the M4 sample reflects the stress evoked 20–30 min earlier at the end of the PVT task. It is clear that this value is very low, which is corroborated by a post-hoc comparison of the cortisol levels of the M4 and M1 samples, which showed a significant 1.6 nmol/l decrease in cortisol (p = 0.004), reflecting that PVT was not stressful, and rather induced a state of boringness as reported by the participants.
Similarly, the M8 sample reflects the stress evoked 20–30 min earlier at the end of the TSST. A significant 3.4 nmol/l increase in cortisol levels was found from the M4 sample (before TSST) to this M8 sample, and therefore it can be concluded that on average the TSST manipulation induced stress in participants as intended (samples taken at M1 and M8 differ significantly as well, p = 0.04).
Interestingly, not all participants showed an increase in salivary cortisol from the sample taken at M4 (before TSST) to that at M8 (after TSST). For 34 participants the difference of the cortisol values of the M8 and M4 samples indeed resulted in a value above zero, while for 11 participants this result was zero or lower. We will therefore take the increase or decrease of salivary cortisol during the TSST as an indicator as to whether participants were indeed psychosocially stressed by the TSST, thus effectively splitting up the sample into a high-cortisol responder and a low-cortisol responder group. The mean salivary cortisol for each of these two groups is shown in Figure 7.
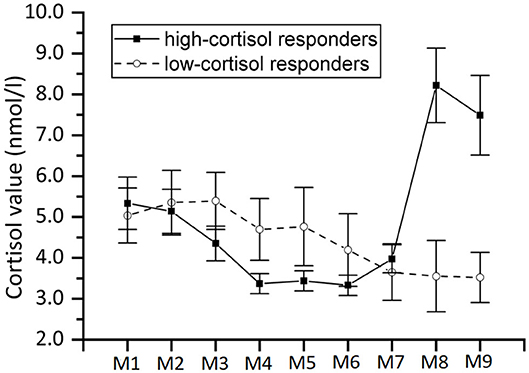
Figure 7. Same as Figure 6 but with separate curves for high-cortisol responders (n = 34) and low-cortisol responders (n = 11).
Questionnaires
On average, participants scored 11.2 ± 5.5 (SD) on the Perceived Stress Scale. Only four of the participants had a score higher than 20. We also determined the mean Positive Affect Scores and Negative Affect Scores, as measured by the PANAS, before and after the Trier Social Stress Test (TSST). We applied a non-parametric Wilcoxon test since the PANAS data cannot be assumed to be distributed normally. It revealed a significant increase in negative affect after the TSST in both the low-cortisol responder group (Z = −2.964, p < 0.01) and high-cortisol responder group (Z = −4.451, p < 0.001), whereas positive affect was not affected by the TSST in the low-cortisol responder group (Z = −0.867, n.s.), nor in the high-cortisol responder group (Z = −1.099, n.s.). A post-hoc Mann Whitney U-test—also applied since data cannot assumed to be distributed normally—revealed that the increase in negative affect scores (i.e., score after TSST minus score before TSST) of the low-cortisol and high-cortisol responder groups were not significantly different (U = 215.0, n.s.).
Psychomotor Vigilance Task (PVT)
The PVT data of one participant was corrupt and therefore omitted from this analysis. Figure 8 shows the mean reaction time (RT) in seconds for valid responses per 4-min epoch for the remaining 44 participants. Four participants gave in at least one 4-min block no correct response at all, and they were omitted from the repeated measures ANOVA, as it cannot deal with missing values. For the remaining participants, a repeated measures ANOVA was performed with Time (15 levels) as within-subject factor, and Stress responder group (2 levels: high-cortisol responders vs. low-cortisol responders) as a between-subject factor. It revealed a significant main effect of Time [F(14,25) = 9.069, p < 0.001], indicating that, as expected, participants responded slower when the time progressed (see Figure 8). The interaction effect between Time and Stress responder group was not significant [F(14,25) = 0.702, n.s.]. Similar results were found for the mean number of lapses of the 44 participants, showing a significant effect of Time [F(14,29) = 3.136, p = 0.005] in a similar way for high-cortisol responders and low-cortisol responders [F(14,29) = 0.763, n.s.]. We conclude that as expected, we find a gradual decrease in cognitive performance over time for both stress responder groups.
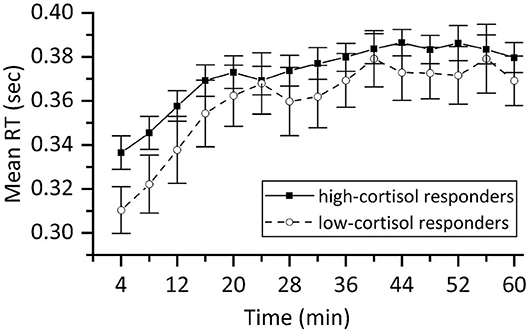
Figure 8. Mean reaction time of valid responses in the PVT expressed in sec for high-cortisol responders (n = 34) and low-cortisol responders (n = 10). The results demonstrate that participants became less alert with progressing time giving rise to slower reactions. Error bars represent ±SE.
Working Memory Task (NBACK)
The NBACK proved to be quite challenging resulting in only 37 subjects who produced meaningful data (reacting to at least two thirds of the stimuli in each session). Figure 9 shows the mean RT in the two NBACK sessions for the high-cortisol responders and low-cortisol responders separately. This figure shows that the low-cortisol responders (who were not stressed during the TSST, judging from their lack of increase in cortisol level) improved much more over the course of the two sessions than the other group, showing a greater reduction of RT. This observation is confirmed by an analysis of variance with repeated measures on RT with Time (2 levels: before vs. after TSST) as within-subject factor and Stress responder group (2 levels: high-cortisol responders vs. low-cortisol responders) as between-subject factor: The main effect of Time [F(1,35) = 25.551, p < 0.001] was found significant, whereas the main effect of Stress responder group [F(1,35) = 1.529, n.s.] was not. The interaction effect between Time and Stress responder group was significant [F(1,35) = 3.585, p = 0.033] in a 1-sided test. A post-hoc test demonstrated that RT in the second NBACK session (after the TSST) was significantly lower than the RT in the first session for both the low-cortisol responders [F(1,8) = 19.312, p = 0.002] and the high-cortisol responders [F(1,27) = 9.768, p = 0.004].
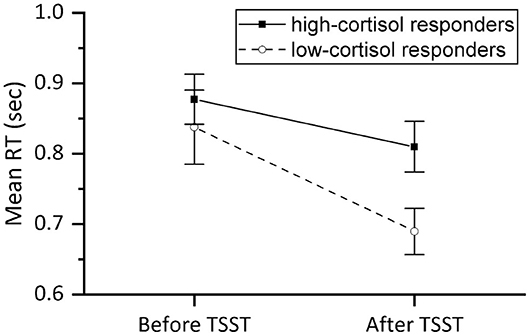
Figure 9. Mean reaction time (sec) of valid responses in the NBACK session before and after the TSST for high-cortisol responders (n = 28) and low-cortisol responders (n = 9). Error bars represent ±SE.
Mostly similar results were found for the accuracy: no effects of Time [F(1,35) = 1.857, n.s.] or Stress responder group [F(1,35) = 1.857, n.s.] were found, yet a significant interaction effect [F(1,35) = 5.730, p = 0.022]. Post-hoc testing revealed that the accuracy of low-cortisol responders in the second NBACK session was significantly improved as compared to the accuracy in the first NBACK session [F(1,8) = 8.261, p = 0.021], whereas the accuracy in high-cortisol responders remained stable over the two NBACK sessions [F(1,27) = 0.968, n.s.], showing no improvement over time. The reaction time and accuracy results both indicate that the improvement in performance is inhibited in participants who showed a TSST cortisol stress reaction (high-responder group).
Skin Conductance and Estimation of Stress-Induced Cortisol
For the comparison of the stress-induced cortisol (ESIC) values estimated from the DTI-4 skin conductance recordings with the salivary cortisol values, the average ESIC values were determined for each 10-min interval around the moment a salivary cortisol sample was taken. This was possible for a maximum of 9 moments, but for a number of participants for some of these moments, the quality of the ESIC calculation was lower than 90%, and then that particular data point was omitted. Any participant with only 5 or less data points remaining was omitted from further analysis, which left us with 28 participants, with an average of 8.5 valid data points each. Twenty-two of these participants had been classed as high-cortisol responders, and 6 as low-cortisol responders.
In order to make a direct comparison between mean ESIC and salivary cortisol, we calculated normalized (z-score transformed) ESIC estimations, as well as normalized (z-transformed) salivary cortisol on a per-participant basis, before averaging over participants. This normalization ensures equal weights for all participants in the calculation of the means, despite large individual differences in ESIC and cortisol ranges. Figure 10 shows the mean normalized results for the high-cortisol responders and low-cortisol responders. For the high-cortisol responders the Pearson correlation between the mean normalized salivary cortisol and the mean normalized ESIC is 0.74 (p = 0.021), while for the low-cortisol responders the correlation is 0.66 (p = 0.056).
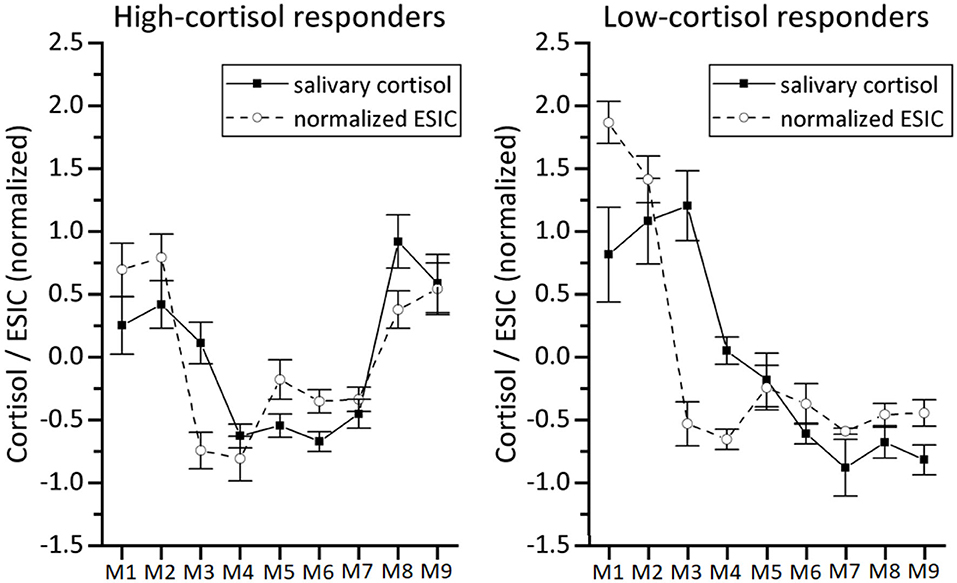
Figure 10. Comparison between normalized salivary cortisol and our normalized stress-induced cortisol estimation (normalized ESIC) based on DTI-4 skin conductance data for the high-cortisol responders (left panel, n = 22) and low-cortisol responders (right panel, n = 6). Because of the z-score normalization, values at the vertical axis are distributed around 0. Error bars represent ±SE.
We also looked at the individual correlations of these 28 participants: 10 had a significant positive correlation between ESIC and salivary cortisol, 12 a non-significant positive correlation, and the rest a non-significant negative correlation (see Figure 11). In order to calculate the average individual correlation, the individual correlation coefficients r underwent a Fisher r-to-Z correction [i.e., Z = 0.5*ln((1 + r)/(1 - r))], were subsequently averaged, and the resulting Zav-value was converted back using the Fisher Z-to-r correction [i.e., rav, cor = (exp(2 * Zav) - 1)/(1 + exp(2 * Zav))]. The mean Fisher-corrected individual correlation based on all 28 participants shows a moderate effect: rav, cor= 0.48. We also used the individual r-to-Z corrected correlation coefficients to test whether the reported mean (Fisher-corrected) individual correlation coefficient is different from zero, which indeed appeared to be the case [t(27) = 3.892, p = 0.001]. In addition, we performed similar analyses using the uncorrected individual correlation coefficients, and found comparable results: A t-test indicated that also the plain average of the individual correlations was significantly different from zero [t(27) = 3.826, p = 0.001].
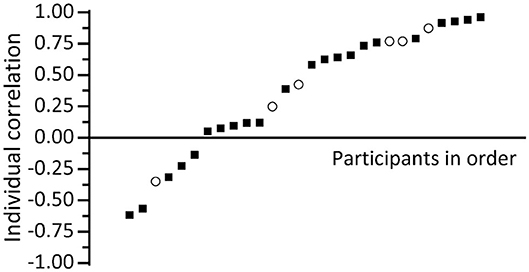
Figure 11. Plot of individual correlation between salivary cortisol and our stress-induced cortisol estimation (ESIC) based on DTI-4 skin conductance data for high-cortisol responders [black squares (n = 22)] and low-cortisol responders [open circles (n = 6)].
Discussion and Conclusion
We presented a calculation model to estimate the stress-induced changes in cortisol level from skin conductance measurements, inspired by the observation that a stressful event is usually directly followed by an increase in skin conductance, and after about 20–30 min by an increase in cortisol level. To lend support to the model, we investigated whether these skin conductance-based cortisol estimations for a particular participant were correlated with increases or decreases in the actual cortisol values in saliva samples taken from the same participant. Note, thus, that our approach capitalizes on relative cortisol levels, not absolute levels.
From the salivary data it can be concluded that on average our test managed to indeed induce stress-based variations in cortisol level: After the PVT test cortisol was significantly lower than before, while during the TSST the average cortisol level increased significantly. These findings are supported by the performance results: For the PVT we found, in line with the literature (e.g., Lee et al., 2010), that participants responded slower with progressing time. This decrease in performance coincides with the low cortisol values found during the PVT part of the test. We did not find PVT performance to be dependent on stress responder group, which makes sense, since it is not necessarily plausible that a classification based on cortisol reactions to a stressor should be relevant in moments of low stress like the PVT.
On the other hand, during the TSST the salivary cortisol level on average increased significantly. This is in line with the significant reduction measured in positive affect (PANAS). The cognitive effects of the TSST were evaluated by the performance on the n-Back tasks: While overall participants showed learning through the significant reduction of reaction times in the post-TSST NBACK session, we found that participants who were hardly or not stressed by the TSST (low-cortisol responders) showed a greater reduction of reaction times than those who were stressed during the TSST. Moreover, for low-cortisol responders the n-Back accuracy significantly improved after TSST, whereas for high-cortisol responders it remained stable over the two NBACK sessions. These results indicate that the improvement in performance is inhibited under psychological stress, and underline the relation between the cortisol increase and cognitive functioning. Our findings are in line with those of Schoofs et al. (2008), who also found that n-Back performance is compromised when stress results in increases in cortisol.
Having established that the test protocol indeed induced stress-based changes in cortisol level, our main interest was to see whether these in-body cortisol changes were related to the ESIC estimations of our model. Note that although for some participants additional factors like e.g., fatigue might have impacted both in-body cortisol and skin-conductance levels, the relation between the two should be present independent of these factors. For the high-cortisol responder group we indeed found a strong and significant correlation between average ESIC and salivary cortisol levels. For the low-cortisol responders the correlation was substantial too, suggesting it is not dependent on the presence of strong stressors. However, this latter suggestion must be taken with caution, since the correlation was not significant. In addition, we found that for individual participants their correlations between cortisol levels and skin-conductance based estimations of stress-induced cortisol were mostly positive, even significantly positive for a substantial number of participants, and never significantly negative. On average, we found a positive Fisher-corrected individual correlation of 0.48, which proved to be significantly different from zero.
This 0.48 average individual correlation to a certain extent reflects the relation between skin conductance and bodily cortisol changes as we have modeled it. It should be noted that we do not assume that the skin conductance peak actually causes the cortisol response, but rather that both are triggered by the same cause, namely a stressful event. This theory-based model uses the well-known cortisol stress response and results in a convolution formula that could roughly be understood as applying both a low-pass filter and a delay to a trace with skin-conductance increases data. It could be an interesting topic for further study to investigate the relative contributions of filter and delay separately.
The average individual correlation of 0.48 between measured and estimated cortisol also implies that at least part of the variation in cortisol saliva samples is being modeled by the variation in our estimated cortisol value. This demonstrates that the estimated cortisol can be useful as a first indication of stress level changes in consumer applications that support the user in avoiding high stress levels potentially leading to cognitive underperformance. In this respect it is all the more interesting that our model allows to make a prediction into the future, based on the history of skin conductance measurement. This prediction of upcoming cortisol level changes may particularly be suited for applications in which such support is provided to avoid detrimental stress levels (e.g., in the form of e-coaching), since it allows the users to timely adapt their present behavior.
A potential improvement of the present work stems from our use of the cortisol response curve: In our skin conductance-based cortisol estimations we made use of the cortisol level data published by Kirschbaum et al. (1992) to determine the convolution kernel parameters for male and female participants. Note that these parameters are based upon mean data of male and female participants and a better individual estimation should be possible if based upon individual data. In addition, it must be noted, as already discussed previously, that the data of Kirschbaum et al. involve prolonged exposure to a stressful period, as opposed to exposure to a single short-lasting stressor. Thus, the cortisol response curve for a single stressor may be more peaked than the approximated curve that we used for our estimations. If in a future study the currently limited amount of participants is extended, these individual cortisol response curve estimations could be taken into account.
All in all, we conclude that we have presented a model that allows to estimate and predict stress-induced cortisol level changes from skin conductance measurement, and that we obtained first evidence that the algorithm does indeed reflect changes in the body's cortisol level.
Data Availability Statement
The datasets for this article are not publicly available because participants have not given permission for the use of their data by third parties. Requests to access the datasets should be directed to Joyce H. D. M. Westerink, am95Y2Uud2VzdGVyaW5rQHBoaWxpcHMuY29t.
Ethics Statement
The studies involving human participants were reviewed and approved by Philips Research Internal Committee on Biomedical Experiments (ICBE). The participants provided their written informed consent to participate in this study.
Author Contributions
MO and JW contributed to conception and design of the model. RR-J, SJ, AD, JW, MO, and MD contributed to conception and implementation of the study. AD, SJ, and EP preprocessed the data. RR-J and SJ performed the statistical analyses. RR-J, RE, and JW wrote the first draft of the manuscript. All authors contributed to manuscript revision, read, and approved the submitted version.
Conflict of Interest
The authors are employed by the company Philips, as academic researchers working in an industrial research lab. Philips holds a patent on the stress metric proposed.
References
Al'Absi, M., Bongard, S., Buchanan, T., Pincomb, G. A., Licinio, J., and Lovallo, W. R. (1997). Cardiovascular and neuroendocrine adjustment to public speaking and mental arithmetic stressors. Psychophysiology 34, 266–275. doi: 10.1111/j.1469-8986.1997.tb02397.x
Allen, J. A., Armstrong, J. E., and Roddie, I. C. (1973). The regional distribution of emotional sweating in man. J. Physiol. 235, 749–759. doi: 10.1113/jphysiol.1973.sp010414
Arnsten, A. F. (2015). Stress weakens prefrontal networks: molecular insults to higher cognition. Nat. Neurosci. 18, 1376–1385. doi: 10.1038/nn.4087
Buddea, H., Pietrassyk-Kendziorraa, S., Bohma, S., and Voelcker-Rehage, C. (2010). Hormonal responses to physical and cognitive stress in a school setting. Neurosci. Lett. 474, 131–134. doi: 10.1016/j.neulet.2010.03.015
Cohen, S., Kamarck, T., and Mermelstein, R. (1983). A global measure of perceived stress. J. Health Soc. Behav. 24, 386–396. doi: 10.2307/2136404
Dierolf, A. M., Arlt, L. E., Roelofs, K., Kölsch, M., Hülsemann, M. J., Schächinger, H., et al. (2016). Effects of basal and acute cortisol on cognitive flexibility in an emotional task switching paradigm in men. Hormones Behav. 81, 12–19. doi: 10.1016/j.yhbeh.2016.02.002
Follenius, M., Brandenberger, G., and Hietter, B. (1982). Diurnal cortisol peaks and their relationships to meals. J. Clin. Endocrinol. Metab. 55, 757–761. doi: 10.1210/jcem-55-4-757
Frankenhaeuser, M. (1992). The psychophysiology of workload, stress, and health: comparison between the sexes. Ann. Behav. Med. 13, 197–204.
Gunnar, M., and Quevedo, K. (2007). The neurobiology of stress and development. Annu. Rev. Psychol. 58, 145–173. doi: 10.1146/annurev.psych.58.110405.085605
Kirschbaum, C., Pirke, K., and Hellhammer, D. H. (1993). The ‘Trier Social Stress Test'- a tool for investigating psychobiological stress responses in a laboratory setting. Neuropsychobiology 28, 76–81. doi: 10.1159/000119004
Kirschbaum, C., Wolf, O. T., May, M., Wippich, W., and Hellhammer, D. H. (1996). Stress-and treatment-induced elevations of cortisol levels associated with impaired declarative memory in healthy adults. Life Sci. 58, 1475–1483. doi: 10.1016/0024-3205(96)00118-X
Kirschbaum, C., Wüst, S., and Hellhammer, D. H. (1992). Consistent sex differences in cortisol response to psychological stress. Psychosomatic Med. 54, 648–665. doi: 10.1097/00006842-199211000-00004
Kuhlmann, S., Kirschbaum, C., and Wolf, O. T. (2005b). Effects of oral cortisol treatment in healthy young women on memory retrieval of negative and neutral words. Neurobiol. Learn. Memory 83, 158–162. doi: 10.1016/j.nlm.2004.09.001
Kuhlmann, S., Piel, M., and Wolf, O. T. (2005a). Impaired memory retrieval after psychosocial stress in healthy young men. J. Neurosci. 25, 2977–2982. doi: 10.1523/JNEUROSCI.5139-04.2005
Lee, I., Bardwell, W. A., Ancoli-Israel, S., and Dimsdale, J. E. (2010). Number of lapses during the psychomotor vigilance task as an objective measure of fatigue. J. Clin. Sleep Med. 6, 163–168. doi: 10.5664/jcsm.27766
Machado-Moreira, C. A., and Taylor, N. A. S. (2012). Sudomotor responses from glabrous and non-glabrous skin during cognitive and painful stimulations following passive heating. Acta Physiol. 204, 571–581. doi: 10.1111/j.1748-1716.2011.02362.x
Nikolic-Popovic, N., and Goubran, R. (2011). “Measuring heart rate, breathing rate and skin conductance during exercise,” in Proceedings of IEEE International Workshop on Medical Measurements and Applications (Bari).
Ouwerkerk, M., Dandine, P., Bolio, D., Kocielnik, R., Mercurio, J., Huijgen, H., et al. (2013). “Wireless multi sensor bracelet with discreet feedback,” in Proceedings of Wireless Health (Baltimore, MD).
Poh, M. Z., Swenson, N. C., and Picard, R. W. (2010). A wearable sensor for unobtrusive, long-term assessment of electrodermal activity. IEEE Trans. Biomed. Eng. 57, 1243–1252. doi: 10.1109/TBME.2009.2038487
Schoofs, D., Preuß, D., and Wolf, O. T. (2008). Psychosocial stress induces working memory impairments in an n-back paradigm. Psychoneuroendocrinology 33, 643–653. doi: 10.1016/j.psyneuen.2008.02.004
Van Dooren, M., De Vries, G. J., and Janssen, J. H. (2012). Emotional sweating across the body: comparing 16 different skin conductance measurement locations. Physiol. Behav. 106, 298–304. doi: 10.1016/j.physbeh.2012.01.020
Keywords: skin conductance, stress, stress-induced cortisol, wearables, stress monitoring
Citation: Westerink JHDM, Rajae-Joordens RJE, Ouwerkerk M, van Dooren M, Jelfs S, Denissen AJM, Penning de Vries E and van Ee R (2020) Deriving a Cortisol-Related Stress Indicator From Wearable Skin Conductance Measurements: Quantitative Model & Experimental Validation. Front. Comput. Sci. 2:39. doi: 10.3389/fcomp.2020.00039
Received: 21 February 2020; Accepted: 30 July 2020;
Published: 29 September 2020.
Edited by:
Anton Nijholt, University of Twente, NetherlandsReviewed by:
Jan Mucha, Brno University of Technology, CzechiaAndrej Košir, University of Ljubljana, Slovenia
Copyright © 2020 Westerink, Rajae-Joordens, Ouwerkerk, van Dooren, Jelfs, Denissen, Penning de Vries and van Ee. This is an open-access article distributed under the terms of the Creative Commons Attribution License (CC BY). The use, distribution or reproduction in other forums is permitted, provided the original author(s) and the copyright owner(s) are credited and that the original publication in this journal is cited, in accordance with accepted academic practice. No use, distribution or reproduction is permitted which does not comply with these terms.
*Correspondence: Joyce H. D. M. Westerink, am95Y2Uud2VzdGVyaW5rQHBoaWxpcHMuY29t