 Leonardo Jose Tadeu de Araújo1,2
 Antonio Marcondes Lerario1,3
 Margaret de Castro4Clarissa Silva Martins4
 Marcello Delano Bronstein1,5Marcio Carlos Machado1,5,6Ericka Barbosa Trarbach7
 Maria Candida Barisson Villares Fragoso1,6*
- 1Laboratory of Hormones and Molecular Genetics LIM-42, University of São Paulo Medical School, São Paulo, Brazil
- 2Laboratory of Quantitative Pathology, Center of Pathology, Adolfo Lutz Institute, São Paulo, Brazil
- 3Division of Metabolism, Endocrinology and Diabetes, University of Michigan, Ann Arbor, MI, United States
- 4Internal Medicine Department, Ribeirao Preto Medical School, University of São Paulo, Ribeirao Preto, Brazil
- 5Neuroendocrine Unit, Division of Endocrinology and Metabolism, University of São Paulo Medical School, São Paulo, Brazil
- 6Endocrinology Service, AC Cancer Center, São Paulo, Brazil
- 7Laboratory of Cellular and Molecular Endocrinology LIM-25, University of São Paulo Medical School, São Paulo, Brazil
ACTH-dependent hypercortisolism caused by a pituitary adenoma [Cushing’s disease (CD)] is the most common cause of endogenous Cushing’s syndrome. CD is often associated with several morbidities, including hypertension, diabetes, osteoporosis/bone fractures, secondary infections, and increased cardiovascular mortality. While the majority (≈80%) of the corticotrophinomas visible on pituitary magnetic resonance imaging are microadenomas (MICs, <10 mm of diameter), some tumors are macroadenomas (MACs, ≥10 mm) with increased growth potential and invasiveness, exceptionally exhibiting malignant demeanor. In addition, larger and invasive MACs are associated with a significant increased risk of local complications, such as hypopituitarism and visual defects. Given the clinical and molecular heterogeneity of corticotrophinomas, the aim of this study was to investigate the pattern of genetic differential expression between MIC and MAC, including the invasiveness grade as a criterion for categorizing these tumors. In this study, were included tumor samples from patients with clinical, laboratorial, radiological, and histopathological diagnosis of hypercortisolism due to an ACTH-producing pituitary adenoma. Differential gene expression was studied using an Affymetrix microarray platform in 12 corticotrophinomas, classified as non-invasive MIC (n = 4) and MAC (n = 5), and invasive MAC (n = 3), according to modified Hardy criteria. Somatic mutations in USP8 were also investigated and mutations were identified in six cases. Differential expression analysis demonstrated that non-invasive MIC and MAC have a similar genetic signature, while invasive MACs exhibited a differential expression profile. Among the genes differentially expressed, we highlighted CCND2, ZNF676, DAPK1, and TIMP2, and their differential expression was validated through quantitative real-time PCR in another cohort of 15 non-invasive and 3 invasive cortocotrophinomas. We also identified potential biological pathways associated with growth and invasiveness, TGF-β and G protein signaling pathways, DNA damage response pathway, and pathways associated with focal adhesion. Our study revealed a differential pattern of genetic signature in a subgroup of MAC, supporting a genetic influence on corticotrophinomas in patients with CD.
Introduction
ACTH-dependent hypercortisolism caused by a pituitary adenoma [Cushing’s disease (CD)] is the most common cause of endogenous Cushing’s syndrome, representing ≈10% of all pituitary adenomas (1, 2). CD is often associated with several morbidities, including hypertension, diabetes, osteoporosis/bone fractures, secondary infections, and increased cardiovascular mortality (3–5). The severity of the clinical manifestations varies according to the level of hormonal overproduction, exposure time, and glucocorticoid receptors sensitivity. While the majority of the corticotrophinomas visible on pituitary magnetic resonance imaging (MRI) are microadenomas (MICs, <10 mm of diameter), some macroadenomas (MACs, ≥10 mm) exhibit increased growth potential and invasiveness, exceptionally exhibiting malignant behaviour (6–9). In addition, larger and invasive MACs are associated with a significant increased risk of local complications, such as hypopituitarism and visual loss (6, 8, 10).
It has been reported that the persistence of cortisol response to desmopressin, in the early postoperative period, could help to identify CD patients with initial remission, who present risk for later recurrence (11). However, apart from clear radiological signs of invasiveness, strong predictors of poor surgical outcomes are not available and early predictors of tumor growth and invasiveness would be of clinical value.
Over the years, molecular markers have emerged as potential predictors of tumor aggressiveness. Previously, the overexpression of fibroblast growth factor receptor-4 (FGFR4) was correlated with the proliferation marker Ki-67 and tended (but not significantly) to be found in invasive pituitary adenomas (12). Also, we have suggested that increased FGFR4 expression levels and the presence of homozygosis for the FGFR4 Gly388 allele were associated with a higher frequency of postoperative recurrence and persistence of CD, respectively (13). Evidence suggests that the signaling properties of N-cadherin, with particular emphasis on its cross talk with cell surface partners such as FGFR4 and NCAM, are important in pituitary tumorigenesis (1, 7, 14, 15). The potential oncogenic contribution of fibroblast growth factors and their receptors to pituitary tumorigenesis and invasiveness is still unclear, although it is well established that these growth factors and respective receptors are important for a variety of biological processes, including mitogenesis, differentiation, development, angiogenesis, and tumorigenesis (16).
Recently, Reincke et al. (17) identified somatic heterozygous mutations in USP8 (ubiquitin-specific protease Y), an important regulator of the epidermal growth factor receptor (EGFR) downstream signaling, in ≈36% of corticotrophinomas. Noteworthy, the majority of the cases with USP8 mutations were MICs from young patients with CD (17, 18). The authors suggest that in the presence of such mutations, EGFR ubiquitination, and turnover would be impaired, causing its accumulation in the plasma membrane, where the receptor remains active and stimulating proopiomelanocortin transcription and ACTH secretion and also contributing to corticotrophic tumorigenesis (17). However, in these studies, the authors did not study any invasive corticotroph tumor.
Lately, a review has collected data from studies of gene and protein expression in corticotrophinomas, compared to normal pituitary gland, with the aim of prioritizing targets that could contribute to the improvement of the molecular diagnosis of CD. Among the differentially expressed genes and respective proteins in corticotrophinomas, the most well-established candidates, emphasized in multiple studies, were NEUROD1 (neuroD1), hPTTG1 (securin), HSD11B2 (11β-hydroxysteroid dehydrogenase 2), AKT (Akt protein kinase B), CCND1 (cyclin D1) (overexpressed), CDKN1B (p27Kip1), CDKN2A (p16), KISS1 (kisspeptin), and ACTHR (ACTH-R) (underexpressed) (19).
hPTTG1 is a member of the securin family, which regulates sister chromatid separation during mitosis. Evidence suggests tissue-specific expression of three hPTTG1 genes and potential roles for each of them in tumorigenesis, cell transformation, DNA repair, angiogenesis, and gene regulation (20). It is noteworthy that it has already been demonstrated that increased hPTTG1 expression was associated with invasiveness in functional pituitary adenomas (21). This overexpression was not only observed in pituitary adenomas but also in various non-pituitary and pituitary carcinoma, at even higher levels (21, 22), and these data contributed to hPTTG1 being classified as a proto-oncogene. Years later, Filippella et al. (23) demonstrated a positive correlation between hPTTG1 expression and the Ki-67 nuclear proliferation index, with the expression, aggressiveness, invasiveness, and recurrence potential of pituitary adenomas.
According to the clinical and molecular heterogeneity of corticotrophinomas, we aimed to explore the pattern of gene expression associated with tumor growth and invasiveness. Therefore, we studied a cohort of corticotrophinomas, with different phenotypic features, by microarray analysis.
Subjects and Methods
Patients and Tumor Samples
Fifteen subjects (14 females and 1 male—age ranged between 14–70 years) with clinical, laboratorial, radiological, and histopathological diagnosis of ACTH-producing pituitary adenoma were included in this study.
Diagnosis of ACTH-dependent Cushing’s syndrome was based on typical clinical features and standard hormonal criteria: increased 24-h urinary cortisol excretion, loss of circadian rhythm of cortisol secretion (increase of nocturnal serum cortisol and/or nocturnal salivary cortisol), lack of suppression of serum cortisol after a low-dose dexamethasone test (1 mg orally overnight), and elevated or inappropriate normal plasma ACTH levels (>15 pg/mL) (24, 25).
Ethical approval was obtained from the institutional review boards of Institution (Comissao de Etica para Analise de Projetos de Pesquisa—CAPPesq), and informed consent was obtained from all participants in written form and in accordance with the Declaration of Helsinki.
Tumoral tissue specimens were obtained during transsphenoidal surgery. Tissue portions not used for histology and were snap-frozen in liquid nitrogen, preceding RNA/DNA extraction (AllPrep DNA/RNA kit®—Qiagen GmbH, Hilden, Germany). After extraction, quality (A260/A280 A260/A280 acceptable ratio range of 1.8–2.0) and integrity were assessed by absorbance measures in a NanoDrop™ spectrophotometer (Thermo Scientific) and agarose gel electrophoresis.
Tumor Characterization
Corticotroph tumors were characterized by immunostaining for ACTH. Tumor size and invasiveness were defined based on preoperative pituitary MRI and perioperative findings (26). We adopted the modified Hardy, as follows: grade I, enclosed MIC (tumor <10 mm); grade II, enclosed MAC (tumor ≥10 mm); grade III, localized perforation of the sellar floor; and grade IV, diffuse destruction of the sellar floor (6, 27). Grade III and IV adenomas were considered invasive, and tumor invasion was based on the evidence of bone destruction and/or tumor extension within sphenoid and/or cavernous sinuses and/or brain, as confirmed at surgery (28, 29). In our cohort, the immunohistochemical markers for aggressiveness: elevated Ki-67 (>3%) and increased nuclear reaction for the p53 protein were not observed in both non-invasive and invasive group of corticotrophinomas that underwent immunohistochemistry analysis (Table 1).
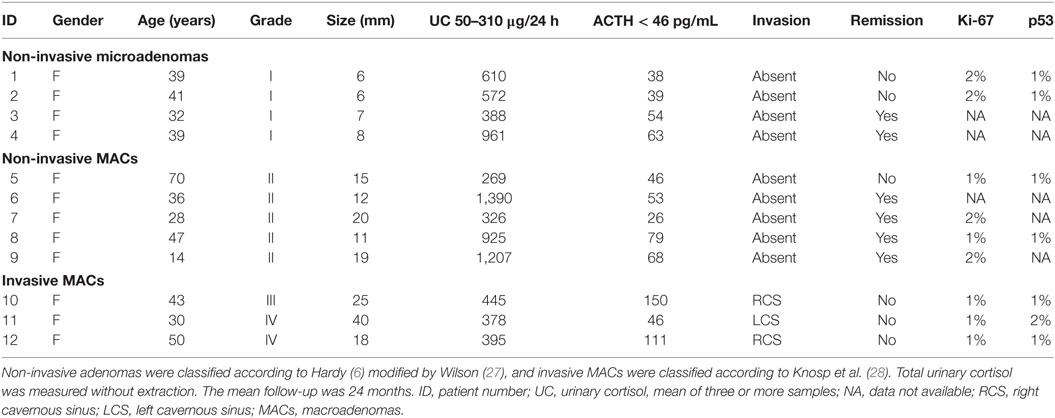
Table 1. Patients with Cushing’s disease included to microarray study.
We assessed the degree of contamination with normal pituitary tissue by measuring the expression levels of POU1F1 and TPIT (the genes encoding the transcription factors Pit-1 and T-pit) as previously described by our group (13). Corticotrophinomas should exhibit high levels of TPIT expression and undetectable levels of POU1F1. On the other hand, POU1F1 expression levels are significantly higher in the normal pituitary, since it is expressed by all the pituitary cell lineages, except the corticotrophic. After PCR analysis, 3 of our 15 primary samples were excluded, due to visible POU1F1 expression, indicating possible contamination with normal pituitary tissue (Figure S1 in Supplementary Material).
Demographic and clinical characteristics of the remaining participants are summarized in Table 1.
USP8 Analysis
As somatic mutations were recently described in the literature (17), we also performed a mutational analysis of the ubiquitin-specific protease 8 (USP8; Ensembl: ENSG00000138592) to investigate its presence/incidence in our cohort. It was accomplished using PCR amplification by specific primers (Table S1 in Supplementaary Material) and automatic SANGER sequencing according to Perez-Rivas et al. (18) in DNA extracted of patients tumors.
Microarray Analysis
We extracted total RNA from four MICs (mean tumor size 6.75 ± 0.96 mm), five MACs (mean tumor size 15.40 ± 4.04 mm), and three invasive corticotrophinomas (mean tumor size 27.67 ± 11.24 mm).
Microarray mRNA expression profiling was performed using the Affymetrix Human Exon 1.0 ST® chip (Affymetrix, Inc., Santa Clara, CA, USA). The mRNA was amplified into single-stranded-cDNA, fragmented, biotin-labeled, and hybridized to a chip using the Gene Chip® WT Plus Reagent Kit (Affymetrix) according to the standard manufacturer’s protocols.
Raw microarray data were acquired using Affymetrix GeneChip operating software (GCOS) (Affymetrix) to yield CEL files. The success of hybridization was evaluated, and data were processed and analyzed using Affymetrix Expression Console® 1.3 (Affymetrix) and gene level differential analysis workflow of Transcriptome Analysis Console® 3.1 (Affymetrix). The background subtraction, normalization, and log base 2 transformation of gene signals were conducted using the robust multi-array average algorithm (30).
Differentially expressed genes were determined by comparing the groups MIC, MAC, and/or invasive using one-way ANOVA (p-value <0.05). Additionally, gene expression was compared by grouping tumors into non-invasive (n = 9) and invasive (n = 3). A Benjamini–Hochberg multiple testing correction adjusted p-value to smaller than 0.05, in addition a twofold change were used to select genes differentially expressed (31) (annotation file: HuEx-1_0-st-v2.na33.1.hg19.transcript.csv). Hierarchical clustering of the expression data was performed using the Euclidean distance metric and complete linkage method. Functional annotation was performed using DAVID1 and Enrich.2 Raw and normalized data of microarray analysis reported here were deposited in Gene Expression Omnibus database under accession number GSE72490.
Quantitative Real-time PCR (qRT-PCR) Analysis
A subset of four target genes and was tested by qRT-PCR, and the assays are summarized in Table 2.
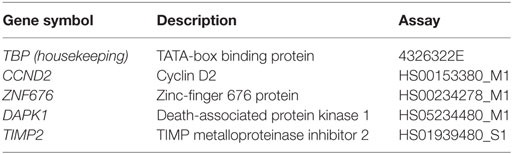
Table 2. Characteristics of the gene probes used in quantitative real-time PCR.
In order to perform data validation, we designed an additional cohort of 18 patients for this analysis; 5 patients from Neuroendocrinology Unit of Hospital das Clinicas of University of São Paulo Medical School and 13 from the Ribeirao Preto Medical School. These patients were selected and classified according to the same criteria described in the Section “Patients and Tumor Samples.” Demographic and clinical characteristics of the individuals, divided into invasive (n = 3) and non-invasive (n = 15) groups, are summarized In Table 3. Similar to our initial cohort, USP8 mutations were also investigated in these patients.
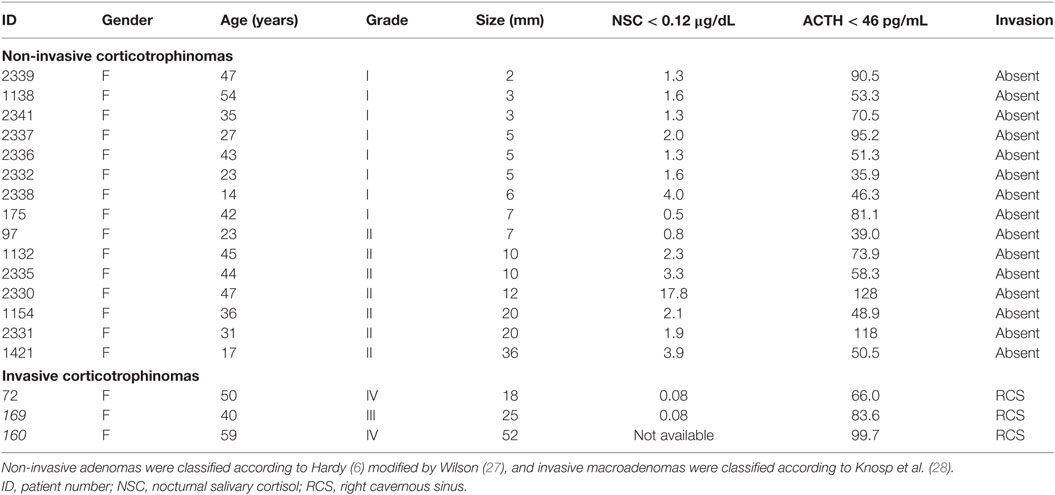
Table 3. Patients with Cushing’s disease included to the validation study using quantitative real-time PCR.
Quantitative RT-PCR used TaqMan Universal PCR Master Mix and was run on an ABI 7000 Sequence Detection Systems® (Applied Biosystems, Foster City, CA, USA). Each reaction was performed with 2.0 μL cDNA (obtained from 5 ng of total RNA). Each target gene was normalized to the Tata-box binding protein gene (TBP), as previously standardized in our laboratory (32). Gene expressions values were calculated with the method, where the ΔCt value of the sample was determined by subtracting the average Ct value of the target gene from the average Ct value of the housekeeping gene. We used as a calibrator a commercial pool of normal pituitary gland (Pituitary Gland Human Poly A + RNA, Clontech, Japan).
Results
Before microarray analysis, we performed the screening for mutations in USP8 in our patients, and somatic variants were found in patients #2 and #5 (p.Ser718Pro), #4 (p.Ser718Cys), patients #3 and #6 (p.Pro720Arg), and #9 (p.Pro720Gln). Both mutations were found in heterozygosis and have been previously described (17, 18).
Differentially Expressed Genes
Using Transcriptome Analysis Console (Affymetrix) software, a fold change and intensity-based filtering approach (>2.0-fold change and ANOVA p < 0.05) demonstrated only 48 transcripts differentially expressed in the MAC group compared to the MIC group: 41 transcripts were relatively overexpressed and 7 were underexpressed (Table 4). However, the hierarchical clustering analysis did not reveal differences that could successfully distinguish these groups (data not shown). In comparing corticotrophinomas grouped into invasive and non-invasive tumors, we observed 748 differentially expressed transcripts: 396 overexpressed and 352 underexpressed.
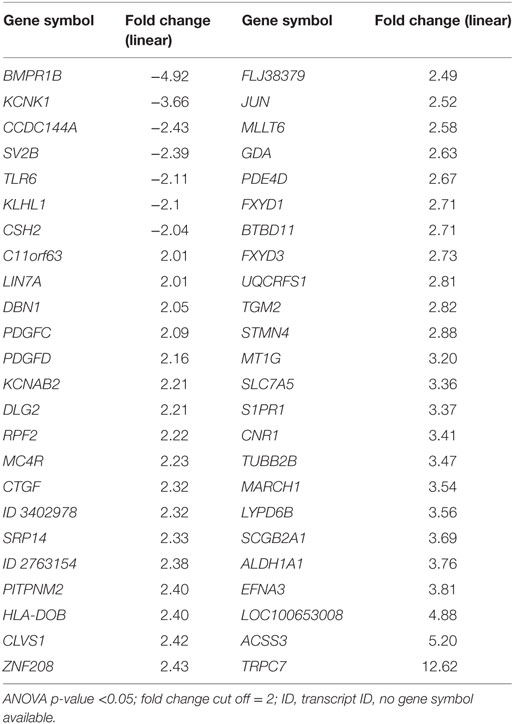
Table 4. Differentially expressed genes in macro versus microcorticotrophinomas.
After that, we applied a false discovery rate (FDR) cutoff of 0.05 to obtain a robust list of 168 differentially expressed genes (Table 5; Table S2 in Supplementary Material; Figure 1A), in which downregulation was the most prevalent feature (n = 150). A heat map and hierarchical cluster of these 168 genes clearly demonstrated a different gene expression signature between invasive and non-invasive groups (Figure 2).
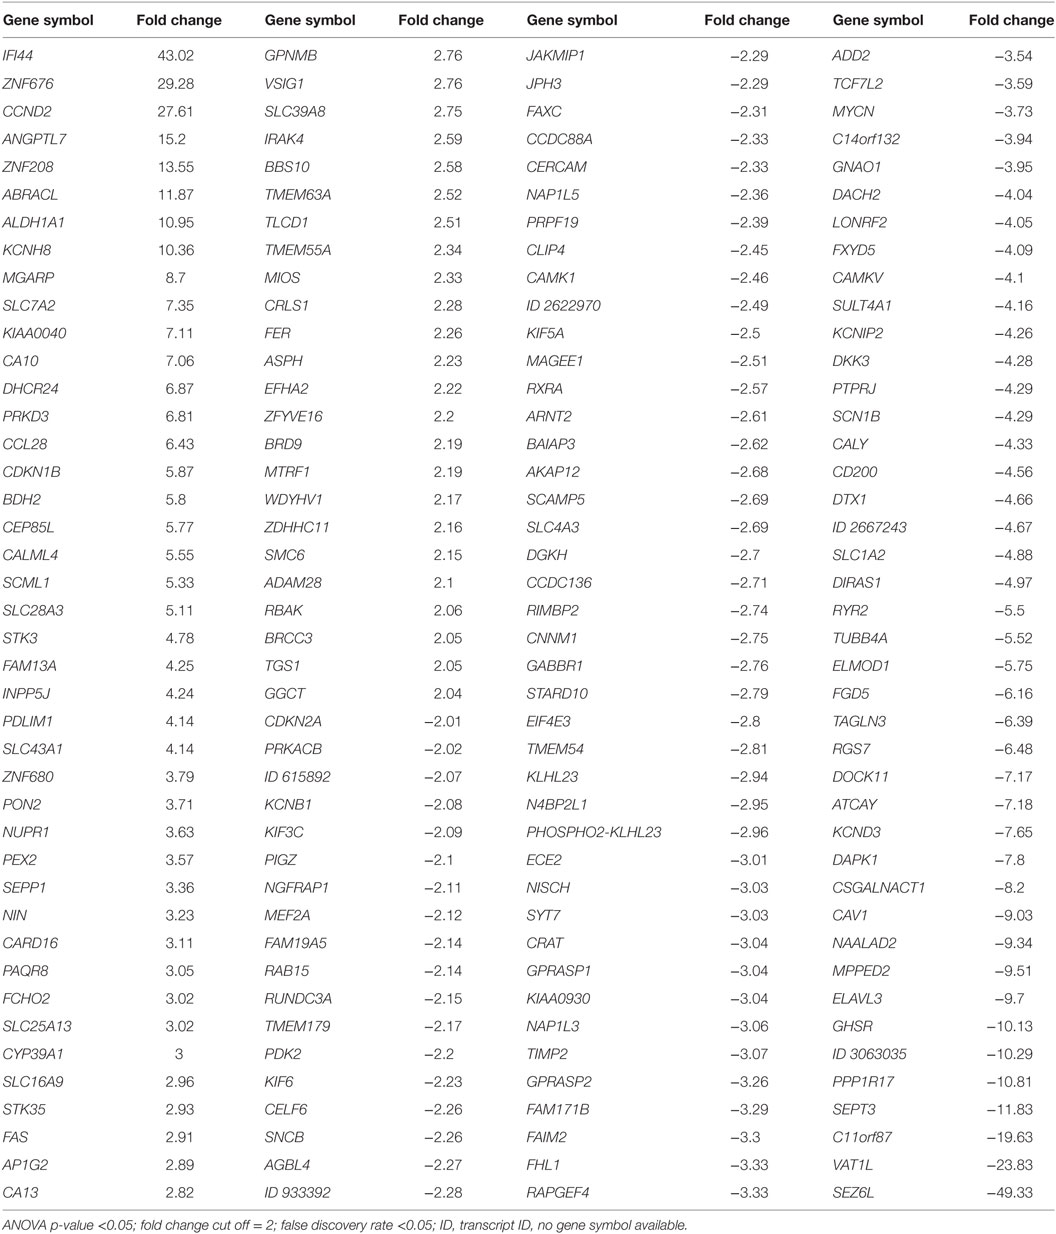
Table 5. Differentially expressed genes in invasive versus non-invasive corticotrophinomas.
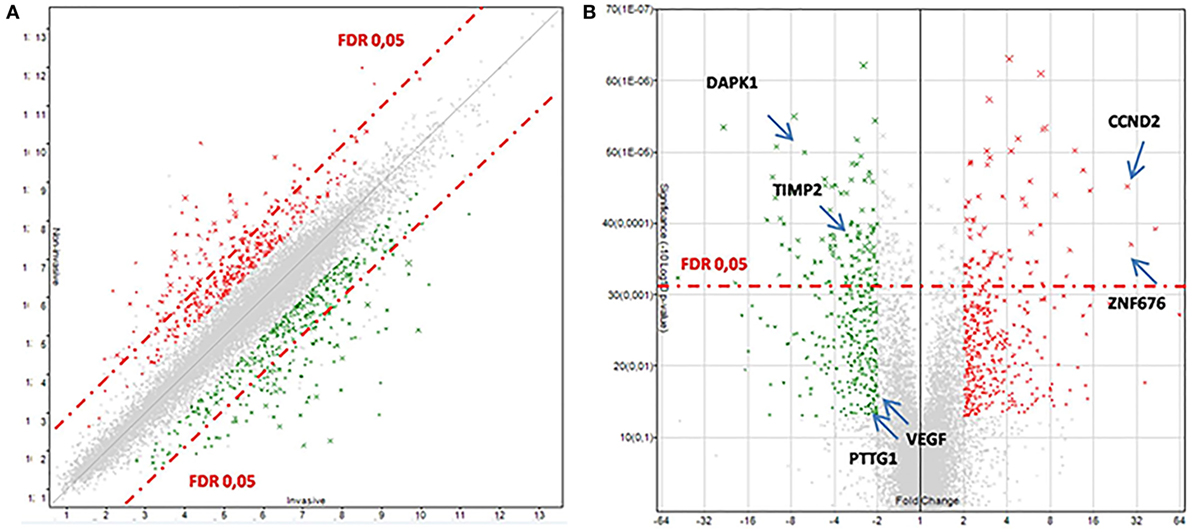
Figure 1. Transcriptomic data between invasive and non-invasive corticotrophinomas. (A) Scatter plot. (B) Volcano plot. The over- and underexpressed genes are represented in red and green, respectively. In these plots, genes with a fold change less than 2 and ANOVA p-value >0.05 are shown in light gray (in the center). The dashed red-line shows where false discovery rate (FDR) = 0.05, with points above the line having p < 0.05. Arrows highlights some genes discussed in the text.
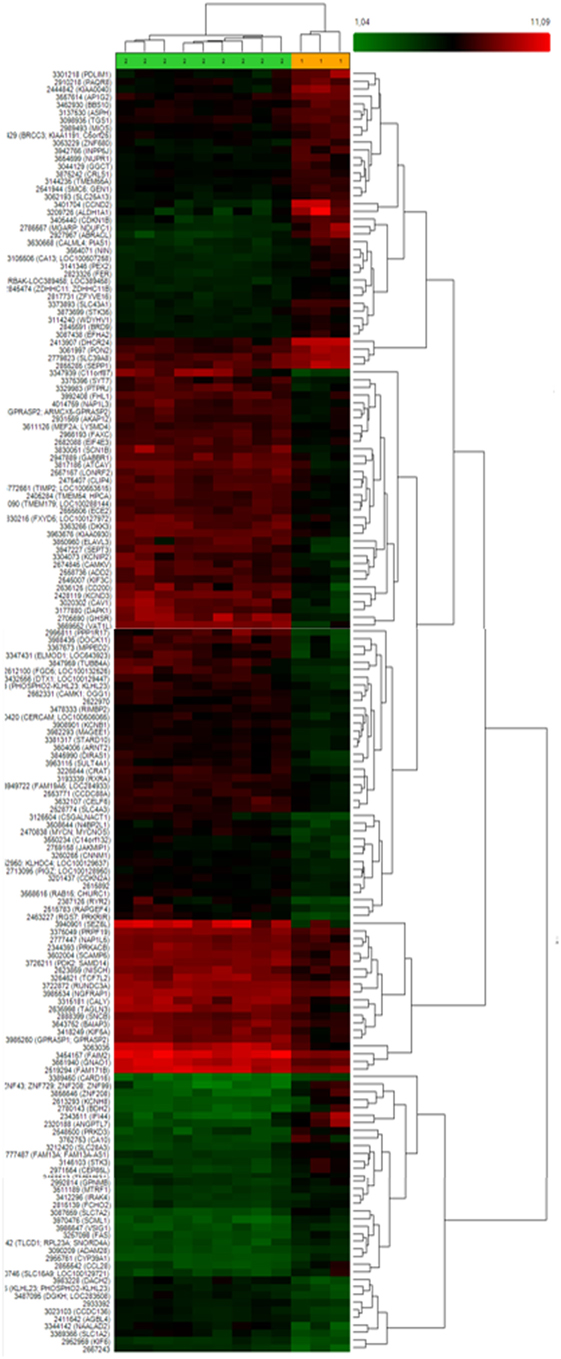
Figure 2. Heat map and hierarchical clustering of 168 differently expressed genes between invasive and non-invasive corticotrophinomas showing that these groups exhibit a distinct gene expression profile. Different genes are represented in different rows and different experiments in different columns. The colored bar above the heat map (horizontal dimension) indicates the grouping variable—green for non-invasive (n = 9) and orange for invasive tumors (n = 3). The normalized expression value of each gene is color coded, from red for higher expressions to green for lower expressions and genes with no change in expression are represented in black.
Figure 1B demonstrates the transcriptomic data between invasive and non-invasive corticotrophinomas, indicating some genes that will be properly discussed later in this paper. Some of the differentially expressed genes have known functions in cancer, cell cycle, and death (overexpressed: CCND2; underexpressed: DAPK1, CDKN2A), transcription factor, and gene expression regulation (overexpressed: ZNF676), cellular homeostasis, adhesion, and motility (overexpressed: KCNH8, DHCR24, MGARP, PRKD3; underexpressed: DOCK11, SPON1, SEPT3), and protein binding (underexpressed: TIMP2).
A list of 20 most significantly and functionally relevant genes differentially expressed between these groups is shown in Table 6.
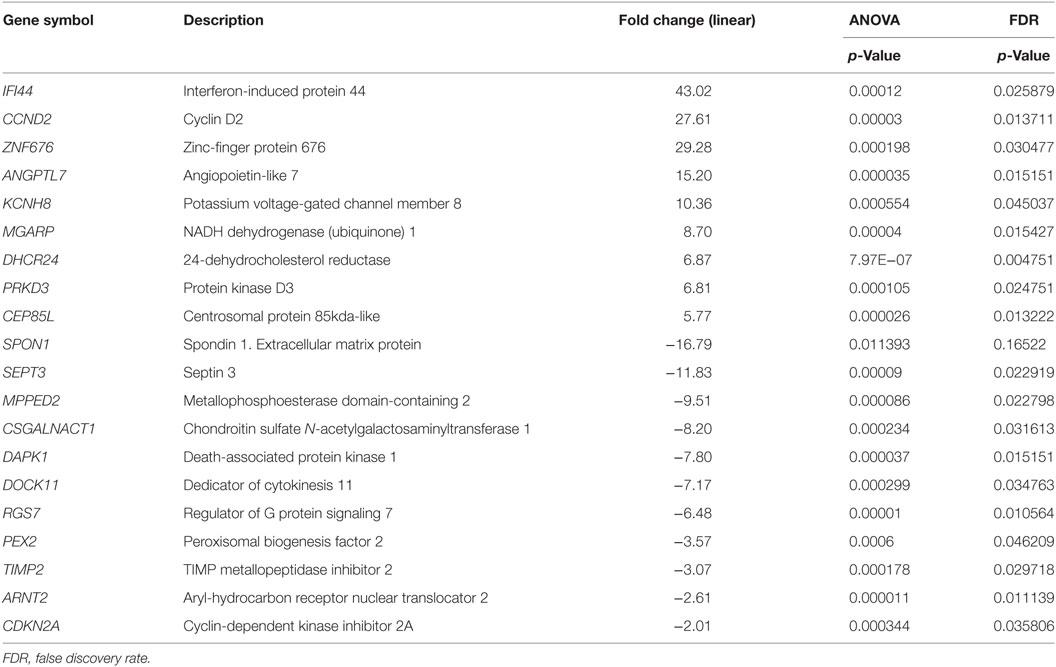
Table 6. Twenty most significantly over- or underexpressed genes in invasive versus non-invasive corticotrophinoma groups.
Further, to analyze the biological significance of these genes, we used DAVID and Enrich chip annotation tools to reveal the functional description, classification, and location of the differentially expressed genes. The annotation results showed that of the 168 differentially expressed genes, 92 were known genes associated with a diverse set of biological pathways. Among these pathways, nine showed altered expression of at least three genes (Table 7). They include the TGF-β and G protein signaling pathways, DNA damage response pathway, and pathways associated with focal adhesion.
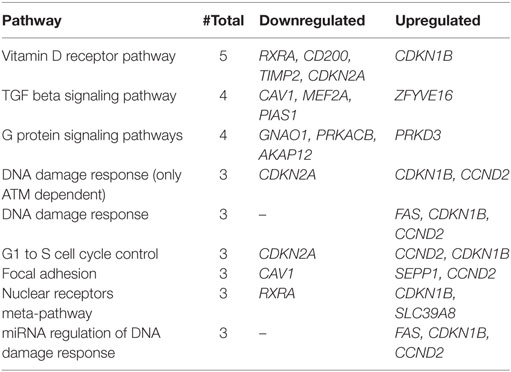
Table 7. List of signaling pathways affected with at least three downregulated and/or upregulated genes.
Quantitative Gene Expression Analysis
Based on the degree of over- or underexpression in invasive versus non-invasive corticotrophinomas, expression of four genes was quantified by qRT-PCR. This analysis confirmed the overexpression of CCND2 (mean increase of 20.57-fold in invasive and 4.01-fold in non-invasive, in relation to calibrator) and ZNF676 (mean increase of 5.13-fold in invasive and 2.04-fold in non-invasive, in relation to calibrator), and the underexpression of DAPK1 (mean increase of 0.18-fold in invasive and 3.3-fold in non-invasive, in relation to calibrator). Regarding to TIMP2, it was possible to observe only a tendency to underexpression (mean increase of 0.85 times in invasive and 1.16 times in non-invasive, in relation to calibrator) (Figure 3).
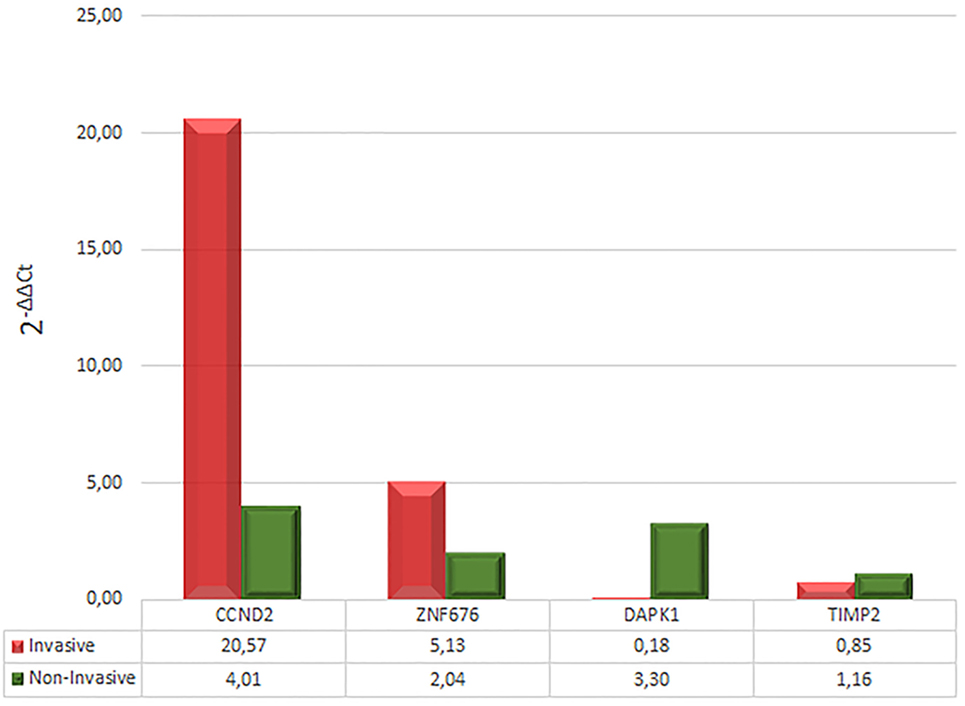
Figure 3. Relative expression levels (fold change) of CCND2, ZNF676, DAPK1, and TIMP2.
Regarding to somatic USP8 mutations, they were identified in 5 (non-invasive corticotrophinomas) out of 18 patients (27.7%) of validation cohort.
Discussion
In the microarray study cohort, we identified six USP8 mutations in 12 samples (50%). In the patients included in the validation study, we could identify somatic USP8 mutations in 5 (non-invasive corticotrophinomas) out of 18 patients (27.7%). According to Reincke et al. (17) and Perez-Rivas et al. (18), these mutations occur in ≈36% of patients with CD. Interestingly, the presence of USP8 mutations did not interfere in the transcriptome expression analysis results comparing invasive vs. non-invasive tumors and in its validation study.
Our study design was original as we compared the gene expression profile of MIC and MAC, also considering tumoral invasiveness. Previous microarray studies have identified genes differentially expressed in pituitary adenomas including corticotrophinomas, but without taking into account their tumor size classification and/or invasiveness (33–35).
Despite our analysis did not show a clear functional distinction between MAC and MIC groups, we were able to identify genes selectively over- and underexpressed in the MAC invasive group, which exhibited a distinct gene expression signature from MIC and non-invasive MAC corticotrophinomas. Among the most differentially expressed genes, we highlighted CCND2 (cyclin D2) and ZNF676 (zinc-finger protein 676), which were increased by 27- and 29-fold, respectively, DAPK1 and TIMP2 which was decreased by 8-fold and 3-fold, respectively.
CCND2 is a crucial cell cycle-regulatory protein; its overexpression is described in several human neoplasms, including colorectal adenomas and gastric cancer, and it is associated with a poor prognosis in gastric cancer (36). Genetic aberrations of CCND2 are also frequently described in gliomas and hematologic malignancies (37, 38).
The ZNF676 is a transcriptional regulator with an interesting suggested role in telomere homeostasis in humans (39). Telomere dysfunction is a common cause and a hallmark of cancer that can lead to genomic instability when associated with loss of cell cycle control (40). It is unclear how ZNF676 controls the length of telomeres. Theoretically, it can modify the telomere length (a) by directly binding to DNA, and it might alter the expression (repression/activation) of genes engaged in telomere maintenance and (b) by binding specifically to and stabilizing the G-quadruplex structure of telomeric DNA (39–42). However, it was recently demonstrated that pituitary tumors do not exhibit alterations in telomeric length, suggesting that telomere biology does not play an important role in pituitary tumor development (43).
DAPK1 is a positive mediator of gamma-interferon-induced programmed cell death with a putative role of metastasis suppressor. DAPK1 expression silencing due to promoter methylation has been frequently found in lung cancer, in which cells with lack of DAPK1 expression appear to be more invasive and more metastatic (41). This gene was also found to be frequently overmethylated in head and neck cancers and in immunodeficiency-related lymphomas (44–46).
TIMP2 is a tissue inhibitor of the matrix metalloproteinase family (MMP) and has been studied in several human tumors, in which a negative correlation between TIMP2 expression and aggressiveness/malignancy was demonstrated (47). Recently, the predictive roles of MMP9 and TIMP1 and 2 in the invasiveness of prolactinomas were studied, and higher MMP9 expression and underexpression of TIMP2 were found in invasive tumors (48). Therefore, it is possible that TIMP2 could also be a potential marker of invasion in corticotrophinomas.
Among our differentially expressed genes, some corroborated published studies that compared gene expression of normal pituitary tissue and pituitary adenomas: the overexpression of CCND1 and underexpression of CDKN2A. CCND1 encodes the cyclin D1 protein, which together with other cyclins, acts in the regulation of cyclin-dependent kinases (CDKs). The activation or inactivation of kinases mechanisms is often associated with cell cycle (49). Additionally, the overexpression of CCND1 is known to be present in many neoplasms, malignant, and non-malignant, and it is considered one of the most important tumorigenic factors (19, 50). Despite this, few studies investigated its role in pituitary adenomas, only two studies have observed the overexpression of CCND1 in adenomas compared with normal pituitary tissue. In addition, the increased expression of cyclin D1 was associated with a greater recurrence of the disease (50, 51). The CDKN2A also encodes a CDK inhibitor, p16, directly involved in cell cycle control (52). It has been demonstrated that CDKN2A methylation occurs in the entire locus, in all subtypes and pituitary tumors. In addition, the dysfunction of p16 was associated with the increased size of these tumors (53). Another study went further and demonstrated that functional corticotrophinomas exhibited an expression of this gene up to four times higher than non-functioning adenomas. The authors suggested that this result could explain why functional corticotrophinomas tend to be smaller than other types of adenomas (54). Corroborating these correlations, in our cohort of invasive corticotrophinomas, with underexpression of CDKN2A, the mean tumor size was significantly higher (27.7 ± 11.2 mm) than in the non-invasive corticotrophinomas (10.9 ± 4.8 mm), even when we consider only the size of MACs (15.40 ± 4.04 mm).
Interestingly, in our study, both the pituitary tumor-transforming gene 1 (hPTTG1) and VEGF were found to be underexpressed in the invasive group. hPTTG1 encodes a mammalian securin found to be overexpressed in several tumors and to transform cells in vitro and in vivo, and VEGF is the most frequently studied angiogenic factor that is involved in endothelial cell proliferation, vascular permeability, and cell motility (8, 20). It has been reported hPTTG1 overexpression in pituitary adenoma (21, 22) and its positive correlation with invasiveness (23, 55). As these studies used different methodologies and they included non-corticotroph pituitary adenoma, it might explain the reason for the discrepancy in our results.
In a similar manner, FGFR4 did not show significant expression difference between invasive and non-invasive corticotrophinomas. It is important to notice that hPTTG1 and FGFR4 overexpression was previously positively correlated with elevated Ki-67 nuclear proliferation index in pituitary adenomas (>3%) (12, 23). However, in our study Ki-67 did not indicate aggressiveness; therefore, this might contribute to the difference obtained in microarray expression results.
Likewise, CDN1B that encodes p27kip1 protein, member of the Cip/Kip family of CDK inhibitors, was overexpressed in our cohort of invasive corticotrophinomas, although it has been demonstrated that the loss of expression of CDN1B may result in pituitary hyperplasia and tumorigenesis (19). Therefore, the reason for this discrepancy of our result with the previous published is not clear.
It is noteworthy to mention that, in the presence of the overexpression of CCND2 and ZNF676, and underexpression of DAKP1 and TIMP2, patients from the invasive group demonstrated a higher mean of presurgical ACTH (102.3 ± 52.2 pg/mL, normal range <46 pg/mL) compared to patients from the non-invasive group (51.7 ± 15.9 pg/mL, normal range 50–310 μg/24 h). In contrast, patients harboring non-invasive corticotrophinomas presented higher concentrations of urinary cortisol (639.6 ± 358.0 μg/24 h) when compared to patients harboring invasive corticotrophinomas (406.0 ± 34.8 μg/24 h).
Despite the intrinsic difficulty of handling and obtaining viable corticotroph tumor tissue for molecular studies and the low incidence of invasive corticotrophinomas, we were able to use a larger cohort of new patients and perform qRT-PCR to the highlighted genes. Our validation results corroborated the initial findings of the microarray study, as we observed CCND2 and ZNF676 overexpression and DAPK1 and TIMP2 underexpression.
Since there are no other molecular studies available comparing invasive and non-invasive corticotrophinomas, this study is an important contribution to the investigation of the biological behavior of these tumors.
Conclusion
We identified a differential pattern of genetic signature in a subgroup of MACs, supporting a genetic influence on the pathogenesis of corticotrophinomas. This study highlighted genes that might contribute for the improvement of molecular diagnosis of invasive corticotrophinomas. Additional analysis are necessary to evaluate the differential protein expression in a larger cohort, therefore they could be used in clinical practice.
Ethical Standards
The authors declare that the experiments comply with the current laws of their country.
Author Contributions
LA: PhD student responsible for all experiments, biostatistical analysis and interpretation, as well as manuscript writing; AL: biostatistical analysis advisor; MC and CM: provided with tumor samples and patient data for validation cohort and manuscript reviewer; MB and MM: manuscript reviewers; ET: technical/experimental advisor, statistical analysis and interpretation and manuscript reviewer; MF: project mentor and advisor, responsible for patient clinical management and manuscript reviewer.
Conflict of Interest Statement
The authors declare that the research was conducted in the absence of any commercial or financial relationships that could be construed as a potential conflict of interest.
Acknowledgments
Preliminary results of this research was presented at IMPROCUSH-1 2014 Improving Outcome of Cushing’s Syndrome (Carl Friedrich von Siemens Stiftung, Munich) as an Oral presentation (A3) and awarded with a grant.
Funding
This work was supported in part by São Paulo Research Foundation (FAPESP 2012/17395-5) and in part by Technological and Scientific Development National Council (CnPQ 307022/2012-9), granted to Maria Candida Barisson Villares Fragoso.
Supplementary Material
The Supplementary Material for this article can be found online at http://journal.frontiersin.org/article/10.3389/fendo.2017.00055/full#supplementary-material.
Figure S1. Electrophoresis on agarose 1% gel for visualization of the PCR products of the genes GAPDH, TPIT, and POU1FT. The expression of GAPDH was used as an endogenous control. Columns 1–15 represent our samples, and column 16 is the negative control. Samples 11, 12, and 15 were excluded because they had visibly positive amplification of POU1FT, suggesting contamination with non-corticotrophic tissue.
Footnotes
References
1. Asa SL, Ezzat S. The pathogenesis of pituitary tumors. Annu Rev Pathol (2009) 4:97–126. doi:10.1146/annurev.pathol.4.110807.092259
2. Feelders RA, Pulgar SJ, Kempel A, Pereira AM. The burden of Cushing’s disease: clinical and health-related quality of life aspects. Eur J Endocrinol (2012) 167:311–26. doi:10.1530/EJE-11-1095
3. Colao A, Pivonello R, Spiezia S, Faggiano A, Ferone D, Filippella M, et al. Persistence of increased cardiovascular risk in patients with Cushing’s disease after five years of successful cure. J Clin Endocrinol Metab (1999) 1(84):2664–72. doi:10.1210/jc.84.8.2664
4. Pivonello R, De Martino MC, De Leo M, Tauchmanova L, Faggiano A, Lombardi G, et al. Cushing’s syndrome: aftermath of the cure. Arq Bras Endocrinol Metabol (2007) 51:1381–91. doi:10.1590/S0004-27302007000800025
5. Newell-Price J. Etiologies of Cushing’s syndrome. 1st ed. In: Bronstein MD, editor. Cushing’s Syndrome: Pathophysiology, Diagnosis and Treatment. (Vol. 1), Sao Paulo: Humana Press (2010). p. 21–9.
6. Hardy J. Transphenoidal microsurgery of the normal and pathological pituitary. Clin Neurosurg (1969) 16:185–216.
7. Ezzat S, Asa SL, Couldwell WT, Barr CE, Dodge WE, Vance ML, et al. The prevalence of pituitary adenomas: a systematic review. Cancer (2004) 101:613–9. doi:10.1002/cncr.20412
8. Di Leva A, Rotondo F, Syro LV, Cusimano MD, Kovacs K. Aggressive pituitary adenomas-diagnosis and emerging treatments. Nat Rev Endocrinol (2014) 10(7):423–35. doi:10.1038/nrendo.2014.64
9. Heaney A. Management of aggressive pituitary adenomas and pituitary carcinomas. J Neurooncol (2014) 117(3):459–68. doi:10.1007/s11060-014-1413-6
10. Ostrom QT, Gittleman H, Liao P, Rouse C, Chen Y, Dowling J, et al. CBTRUS statistical report: primary brain and central nervous system tumors diagnosed in the United States in 2007–2011. Neuro Oncol (2014) 16(4):iv1–63. doi:10.1093/neuonc/nou223
11. Romanholi DJ, Machado MC, Pereira CC, Danilovic DS, Pereira MA, Cescato VA, et al. Role for postoperative cortisol response to desmopressin in predicting the risk for recurrent Cushing’s disease. Clin Endocrinol (Oxf) (2008) 69(1):117–22. doi:10.1111/j.1365-2265.2007.03168.x
12. Qian ZR, Sano T, Asa SL, Yamada S, Horiguchi H, Tashiro T, et al. Cytoplasmic expression of fibroblast growth factor receptor-4 in human pituitary adenomas: relation to tumor type, size, proliferation, and invasiveness. J Clin Endocrinol Metab (2004) 89:1904–11. doi:10.1210/jc.2003-031489
13. Brito LP, Lerário AM, Bronstein MD, Soares IC, Mendonca BB, Fragoso MC. Influence of the fibroblast growth factor receptor 4 expression and the G388R functional polymorphism on Cushing’s disease outcome. J Clin Endocrinol Metab (2010) 95(10):E271–9. doi:10.1210/jc.2010-0047
14. Ezzat S, Zheng L, Asa SL. Pituitary tumor-derived fibroblast growth factor receptor 4 isoform disrupts neural cell-adhesion molecule/N-cadherin signaling to diminish cell adhesiveness: a mechanism underlying pituitary neoplasia. Mol Endocrinol (2004) 18:2543–52. doi:10.1210/me.2004-0182
15. Ezzat S, Zheng L, Winer D, Asa SL. Targeting N-cadherin through fibroblast growth factor receptor-4: distinct pathogenetic and therapeutic implications. Mol Endocrinol (2006) 20:2965–75. doi:10.1210/me.2006-0223
16. Powers CJ, McLeskey SW, Wellstein A. Fibroblast growth factors, their receptors and signaling. Endocr Relat Cancer (2000) 7:165–97. doi:10.1677/erc.0.0070165
17. Reincke M, Sbiera S, Hayakawa A, Theodoropoulou M, Osswald A, Beuschlein F, et al. Mutations in the deubiquitinase gene USP8 cause Cushing’s disease. Nat Genet (2015) 47(1):31–8. doi:10.1038/ng.3166
18. Perez-Rivas LG, Theodoropoulou M, Ferra F, Nusser C, Kawaguchi K, Stratakis CA, et al. The gene of the ubiquitin-specific protease 8 is frequently mutated in adenomas causing Cushing’s disease. J Clin Endocrinol Metab (2015) 100(7):E997–1004. doi:10.1210/jc.2015-1453
19. Seltzer J, Ashton CE, Scotton TC, Pangal D, Carmichael JD, Zada G. Gene and protein expression in pituitary corticotroph adenomas: a systematic review of the literature. Neurosurg Focus (2015) 38(2):E17. doi:10.3171/2014.10.FOCUS14683
20. Salehi F, Kovacs K, Scheithauer BW, Lloyd RV, Cusimano M. Pituitary tumor-transforming gene in endocrine and other neoplasms: a review and update. Endocr Relat Cancer (2008) 15(3):721–43. doi:10.1677/ERC-08-0012
21. Zhang X, Horwitz GA, Heaney AP, Nakashima M, Prezant TR, Bronstein MD, et al. Pituitary tumor transforming gene (PTTG) expression in pituitary adenomas. J Clin Endocrinol Metab (1999) 84:761–7. doi:10.1210/jcem.84.2.5432
22. Sáez C, Japón MA, Ramos-Morales F, Romero F, Segura DI, Tortolero M, et al. hpttg is over-expressed in pituitary adenomas and other primary epithelial neoplasias. Oncogene (1999) 18:5473–6. doi:10.1038/sj.onc.1202914
23. Filippella M, Galland F, Kujas M, Young J, Faggiano A, Lombardi G, et al. Pituitary tumour transforming gene (PTTG) expression correlates with the proliferative activity and recurrence status of pituitary adenomas: a clinical and immunohistochemical study. Clin Endocrinol (Oxf) (2006) 65:536–43. doi:10.1111/j.1365-2265.2006.02630.x
24. Nieman LK, Biller BM, Findling JW, Newell-Price J, Savage MO, Stewart PM, et al. The diagnosis of Cushing’s syndrome: an endocrine society clinical practice guideline. J Clin Endocrinol Metab (2008) 93(5):1526–40. doi:10.1210/jc.2008-0125
25. Machado MC, Alcantara AE, Pereira AC, Cescato VA, Musolino NC, de Mendonça BB, et al. Negative correlation between tumour size and cortisol/ACTH ratios in patients with Cushing’s disease harbouring microadenomas or macroadenomas. J Endocrinol Invest (2016) 39(12):1401–9. doi:10.1007/s40618-016-0504-y
26. Patronas N, Bulakbasi N, Stratakis CA, Lafferty A, Oldfield EH, Doppman J, et al. Spoiled gradient recalled acquisition in the steady state technique is superior to conventional postcontrast spin echo technique for magnetic resonance imaging detection of adrenocorticotropin-secreting pituitary tumors. J Clin Endocrinol Metab (2003) 88:1565–9. doi:10.1210/jc.2002-021438
27. Wilson CB. Neurosurgical management of large and invasive pituitary tumors. In: Tindall GT, Collins WF, editors. Clinical Management of Pituitary Disorders. New York: New York Rav Press (1979). p. 335–42.
28. Knosp E, Steiner E, Kitz K, Matula C. Pituitary adenomas with invasion of the cavernous sinus space: a magnetic resonance imaging classification compared with surgical findings. Neurosurgery (1993) 33:610–7. doi:10.1097/00006123-199310000-00008
29. Galland F, Lacroix L, Saulnier P, Dessen P, Meduri G, Bernier M, et al. Differential gene expression profiles of invasive and non-invasive non-functioning pituitary adenomas based on microarray analysis. Endocr Relat Cancer (2010) 17(2):361–71. doi:10.1677/ERC-10-0018
30. Gautier L, Bolstad BM, Irizarry RA. Affy-analysis of Affymetrix GeneChip data at the probe level. Bioinformatics (2004) 20(4):307–15. doi:10.1093/bioinformatics/btg405
31. Benjamini Y, Hochberg Y. Controlling the false discovery rate: a practical and powerful approach to multiple testing. J R Stat Soc Series B Stat Methodol (1995) 57(1):289–300.
32. Castaño JP, Luque RM, Cerro AL, Robledo M, Tejada LS. Avances en biología molecular en patología neuroendocrina. Endocrinología y Nutrición (2010) 57:2–6. Brito LP, Fragoso et al. (2010). Suitable housekeeping (HK) genes for normalization of real-time quantitative RT-PCR (RTqPCR) expression studies of corticotroph pituitary adenomas. In: XV SINE (Simpósio internacional de NeuroEndocrinologia) São Paulo. [P3–578].
33. Evans CO, Young AN, Brown MR, Brat DJ, Parks JS, Neish AS, et al. Novel patterns of gene expression in pituitary adenomas identified by complementary deoxyribonucleic acid microarrays and quantitative reverse transcription-polymerase chain reaction 1. J Clin Endocrinol Metab (2001) 86(7):3097–107. doi:10.1210/jcem.86.7.7616
34. Jiang ZQ, Gui SB, Zhang YZ. Differential gene expression by fiber-optic beadarray and pathway in adrenocorticotrophin-secreting pituitary adenomas. Chin Med J (2010) 123(23):3455–61. doi:10.3760/cma.j.issn.0366-6999.2010.23.015
35. Morris DG, Musat M, Czirjál S, Hanzély Z, Lillington DM, Korbonits M, et al. Differential gene expression in pituitary adenomas by oligonucleotide array analysis. Eur J Endocrinol (2005) 153:143–51. doi:10.1530/eje.1.01937
36. Bartkova J, Thullberg M, Slezak P, Jaramillo E, Rubio C, Thomassen LH, et al. Aberrant expression of G1-phase cell cycle regulators in flat and exophytic adenomas of the human colon. Gastroenterology (2001) 120(7):1680–8. doi:10.1053/gast.2001.24880
37. Höglund M, Johansson B, Pedersen-Bjergaard J, Marynen P, Mitelman F. Molecular characterization of 12p abnormalities in hematologic malignancies: deletion of KIP1, rearrangement of TEL, and amplification of CCND2. Blood (1996) 87(1):324–30.
38. Büschges R, Weber RG, Actor B, Lichter P, Collins VP, Reifenberger G. Amplification and expression of cyclin D genes (CCND1, CCND2 and CCND3) in human malignant gliomas. Brain Pathol (1999) 9(3):435–42. doi:10.1111/j.1750-3639.1999.tb00532.x
39. Mangino M, Hwang SJ, Spector TD, Hunt SC, Kimura M, Fitzpatrick AL, et al. Genome-wide meta-analysis points to CTC1 and ZNF676 as genes regulating telomere homeostasis in humans. Hum Mol Genet (2012) 21(24):5385–94. doi:10.1093/hmg/dds382
40. Rodier F, Kim SH, Nijjar T, Yaswen P, Campisi J. Cancer and aging: the importance of telomeres in genome maintenance. Int J Biochem Cell Biol (2005) 37(5):977–90. doi:10.1016/j.biocel.2004.10.012
41. Ladame S, Schouten JA, Roldan J, Redman JE, Neidle S, Balasubramanian S. Exploring the recognition of quadruplex DNA by an engineered Cys2-His2 zinc finger protein. Biochemistry (2006) 45(5):1393–9. doi:10.1021/bi050229x
42. Klug A. The discovery of zinc fingers and their applications in gene regulation and genome manipulation. Annu Rev Biochem (2010) 79:213–31. doi:10.1146/annurev-biochem-010909-095056
43. Martins CS, Santana-Lemos BA, Saggioro FP, Neder L, Machado HR, Moreira AC, et al. Telomere length and telomerase expression in pituitary tumors. J Endocrinol Invest (2015) 38(11):1243–6. doi:10.1007/s40618-015-0298-3
44. Rosas SL, Koch W, da Costa Carvalho MG, Wu L, Califano J, Westra W, et al. Promoter hypermethylation patterns of p16, O6-methylguanine-DNA-methyltransferase, and death-associated protein kinase in tumors and saliva of head and neck cancer patients. Cancer Res (2001) 61(3):939–42.
45. Gonzalez-Gomez P, Bello MJ, Alonso ME, Lomas J, Arjona D, Amiñoso C, et al. Frequent death-associated protein-kinase promoter hypermethylation in brain metastases of solid tumors. Oncol Rep (2003) 10(4):1031–4.
46. Rossi D, Gaidano G, Gloghini A, Deambrogi C, Franceschetti S, Berra E, et al. Frequent aberrant promoter hypermethylation of O6-methylguanine-DNA methyltransferase and death-associated protein kinase genes in immunodeficiency-related lymphomas. Br J Haematol (2003) 123(3):475–8. doi:10.1046/j.1365-2141.2003.04644.x
47. Johansson N, Ahonen M, Kähäri VM. Matrix metalloproteinases in tumor invasion. Cell Mol Life Sci (2000) 57(1):5–15. doi:10.1007/s000180050495
48. Gültekin GD, Çabuk B, Vural Ç, Ceylan S. Matrix metalloproteinase-9 and tissue inhibitor of matrix metalloproteinase-2: prognostic biological markers in invasive prolactinomas. J Clin Neurosci (2015) 22(8):1282–7. doi:10.1016/j.jocn.2015.02.021
49. Betticher DC. Cyclin D1, another molecule of the year? Ann Oncol (1996) 7:223–5. doi:10.1093/oxfordjournals.annonc.a010563
50. Hewedi IH, Osman WM, El Mahdy MM. Differential expression of cyclin D1 in human pituitary tumors: relation to MIB-1 and p27/Kip1 labeling indices. J Egypt Natl Canc Inst (2011) 23:171–9. doi:10.1016/j.jnci.2011.11.003
51. Lee EH, Kim KH, Kwon JH, Kim HD, Kim YZ. Results of immunohistochemical staining of cell-cycle regulators: the prediction of recurrence of functioning pituitary adenoma. World Neurosurg (2014) 81:563–75. doi:10.1016/j.wneu.2013.09.035
52. Woloschak M, Yu A, Xiao J, Post KD. Frequent loss of the P16INK4a gene product in human pituitary tumors. Cancer Res (1996) 56:2493–6.
53. Seemann N, Kuhn D, Wrocklage C, Keyvani K, Hackl W, Buchfelder M, et al. CDKN2A/p16 inactivation is related to pituitary adenoma type and size. J Pathol (2001) 193:491–7. doi:10.1002/path.833
54. Tani Y, Inoshita N, Sugiyama T, Kato M, Yamada S, Shichiri M, et al. Upregulation of CDKN2A and suppression of cyclin D1 gene expressions in ACTH-secreting pituitary adenomas. Eur J Endocrinol (2010) 163:523–9. doi:10.1530/EJE-10-0245
Keywords: Cushing’s disease, gene expression, neuroendocrine tumors, microarray, anterior pituitary
Citation: de Araújo LJT, Lerario AM, de Castro M, Martins CS, Bronstein MD, Machado MC, Trarbach EB and Villares Fragoso MCB (2017) Transcriptome Analysis Showed a Differential Signature between Invasive and Non-invasive Corticotrophinomas. Front. Endocrinol. 8:55. doi: 10.3389/fendo.2017.00055
Received: 27 October 2016; Accepted: 03 March 2017;
Published: 22 March 2017
Edited by:
Corin Badiu, Carol Davila University of Medicine and Pharmacy, RomaniaReviewed by:
Hidenori Fukuoka, Kobe University, JapanMaria Chiara Zatelli, University of Ferrara, Italy
Copyright: © 2017 de Araújo, Lerario, de Castro, Martins, Bronstein, Machado, Trarbach and Villares Fragoso. This is an open-access article distributed under the terms of the Creative Commons Attribution License (CC BY). The use, distribution or reproduction in other forums is permitted, provided the original author(s) or licensor are credited and that the original publication in this journal is cited, in accordance with accepted academic practice. No use, distribution or reproduction is permitted which does not comply with these terms.
*Correspondence: Maria Candida Barisson Villares Fragoso, bWFyaWEudmlsbGFyZXNAaGMuZm0udXNwLmJy