 Yanghua Fan1
 Ming Feng
- 1Department of Neurosurgery, Peking Union Medical College Hospital, Chinese Academy of Medical Sciences and Peking Union Medical College, Beijing, China
- 2School of Electrical Engineering and Automation, East China Jiaotong University, Nanchang, China
- 3Department of Radiology, Sichuan Provincial People's Hospital, Sichuan Academy of Medical Sciences, Chengdu, China
- 4Department of Neurosurgery, The Second Affiliated Hospital of Nanchang University, Nanchang, China
Background: Prediction of tumor consistency before surgery is of vital importance to determine individualized therapeutic schemes for patients with acromegaly. The present study was performed to noninvasively predict tumor consistency based on magnetic resonance imaging and radiomics analysis.
Methods: In total, 158 patients with acromegaly were randomized into the primary cohort (n = 100) and validation cohort (n = 58). The consistency of the tumor was classified as soft or firm according to the neurosurgeon's evaluation. The critical radiomics features were determined using the elastic net feature selection algorithm, and the radiomics signature was constructed. The most valuable clinical characteristics were then selected based on the multivariable logistic regression analysis. Next, a radiomics model was developed using the radiomics signature and clinical characteristics, and 30 patients with acromegaly were recruited for multicenter validation of the radiomics model. The model's performance was evaluated based on the receiver operating characteristic (ROC) curve, area under the ROC curve (AUC), accuracy, and other associated classification measures. Its calibration, discriminating capacity, and clinical usefulness were also evaluated.
Results: The radiomics signature established according to four radiomics features screened in the primary cohort exhibited excellent discriminatory capacity in the validation cohort. The radiomics model, which incorporated both the radiomics signature and Knosp grade, displayed favorable discriminatory capacity and calibration, and the AUC was 0.83 (95% confidence interval, 0.81–0.85) and 0.81 (95% confidence interval, 0.78–0.83) in the primary and validation cohorts, respectively. Furthermore, compared with the clinical characteristics, the as-constructed radiomics model is more effective in prediction of the tumor consistency in patients with acromegaly. Moreover, the multicenter validation and decision curve analysis suggested that the radiomics model was clinically useful.
Conclusions: This radiomics model can assist neurosurgeons in predicting tumor consistency in patients with acromegaly before surgery and facilitates the determination of individualized therapeutic schemes.
Introduction
Pituitary adenoma (PA), one of the most frequently seen benign pituitary gland neoplasms, constitutes about 10–25% of all primary intracranial tumors (1, 2); moreover, the prevalence of PA is showing an increasing trend (3). Acromegaly [overproduction of growth hormone (GH) by the PA in adult patients] is associated with numerous complications (4). Typically, the increased GH level will induce cardiovascular and cerebrovascular diseases, and acromegaly will increase the mortality by ≥2-fold compared with that among normal individuals (5, 6).
The Clinical Practice Guideline recommends surgical resection through the transsphenoidal approach, particularly the endoscopic transsphenoidal procedure, as the preferred first-line treatment for acromegaly (7, 8). Nonetheless, tumor consistency remains a major factor that affects the surgical resection rate because of the complicated anatomic structure in the sella region and the limited operative field of view, which is particularly true for macroadenomas (frequently seen among patients with acromegaly) (9, 10). Soft tumors can be easily curetted by means of suctioning. However, about 5–15% PAs are of the firm type (11); these tumors are more difficult to excise, and a two-stage operation is usually needed. Therefore, for firm PAs, surgeons may need to develop a more detailed strategy for the transsphenoidal procedure or directly choose craniotomy to avoid complications such as damage to the normal gland (which may lead to hypopituitarism) and interruption of the arachnoid membrane (which may result in cerebrospinal fluid fistulas and major cerebrovascular lesions). It is of vital importance to develop a noninvasive preoperative technique to enable precise prediction of the tumor consistency and thus to achieve a successful operative outcome and to establish an individualized therapeutic scheme, such as drug treatment (12).
A few studies have been performed to predict the consistency of PA through magnetic resonance (MR) imaging (11, 13). However, this technique is not always successful, and previous studies have been limited by low predictive accuracy, small sample sizes, lack of validation, and complicated imaging sequences. Radiomics has recently emerged as a potent approach for noninvasive high-throughput mining of tumor characteristics (14, 15). Neuro-oncologic radiomics studies can potentially mine hidden data that cannot be mined through a single-parameter approach; such studies can also enhance the accuracy of diagnosis, prognosis, and prediction in patients with brain tumors (16–19). Nonetheless, no report has focused on radiomics signatures to predict the tumor consistency of PA, particularly in patients with acromegaly.
Therefore, the hypothesis of the present study was that the high-dimensional radiomics characteristics acquired, based on conventional MR imaging sequences, can enhance the accuracy of preoperative prediction of the tumor consistency. Efforts were made to validate the constructed MR radiomics model through a completely independent multicenter validation set, thus offering robustness among different image acquisition protocols. Consequently, the current study aimed to construct a radiomics model that incorporates both the radiomics signature and clinical characteristics for preoperative prediction of the tumor consistency in patients with acromegaly.
Materials and Methods
Patients
From July 2012 to June 2018, 158 patients with acromegaly were included in the current analysis. The following four diagnostic criteria for acromegaly were used: clinical features of acromegaly in an adult patient (8), detection of a PA by pituitary MR imaging, meeting of the endocrine diagnostic criteria for acromegaly (8) [elevated insulin-like growth factor 1 level (20), random GH level of >1 ng/ml, and nadir GH level of >0.4 ng/ml after the oral glucose tolerance test], and confirmation of PA by postoperative pathological analysis.
The patients' data and personal information were anonymized before analysis. All patients were then randomized into the primary cohort (n = 100), which was used for model construction, and the validation cohort (n = 58), which was used for model internal validation. Finally, 30 patients with acromegaly were enrolled to prospectively validate the model, including 15 from Peking Union Medical College Hospital, 10 from Sichuan Provincial People's Hospital, and 5 from the Second Affiliated Hospital of Nanchang University. The Ethical Review Committee of Peking Union Medical College Hospital approved the study protocol.
The inclusion criteria for this study was as follows: the presence of acromegaly and performance of initial neurosurgery for PA removal; greatest tumor diameter of >2 cm or grade III to IV tumor (21); high-quality preoperative pituitary MR imaging and surgical video; no history of medical treatment, radiotherapy, or surgery for PA; and complete clinical and surgical data.
The following preoperative clinical features were collected: age, sex, insulin-like growth factor 1 level, random GH level, nadir GH level and GH inhibition ratio after a glucose load, tumor volume, and bilateral Knosp classification (21). After surgery, the tumor consistency was classified as soft or firm according to the classification method described by Bahuleyan et al. (22); specifically, a tumor that could be suctioned out using an aspirator was considered soft, while a tumor that could not be suctioned out was considered firm. A high-quality surgical video was viewed by two neurosurgical experts with >10 years of related experience to determine the tumor consistency. A flow chart of this study is presented in Figure 1.
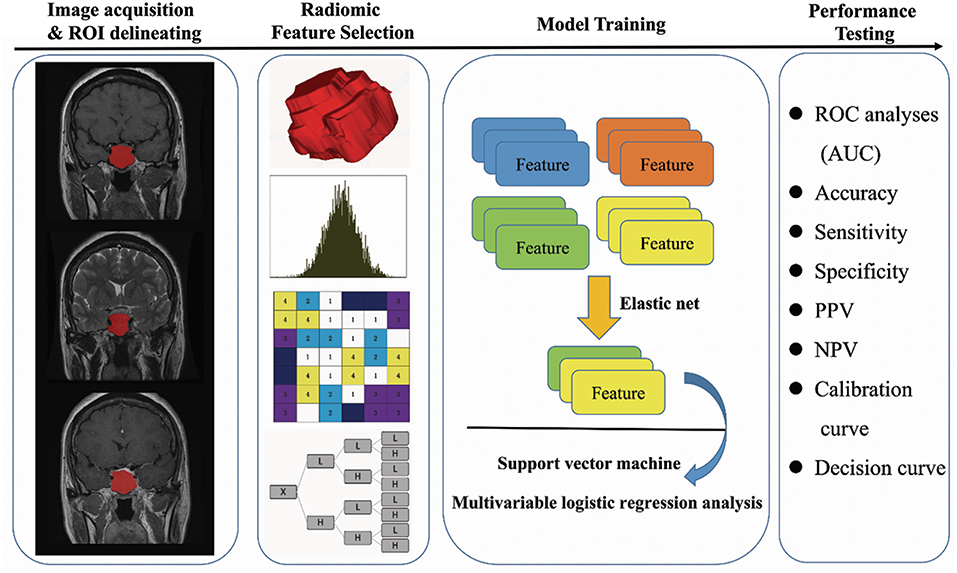
Figure 1. Flow chart of the present study. (I) Original MR image acquisition and ROI segmentation. (II) Radiomics features were extracted from the ROIs, including first-order features, textural features, wavelet features, and shape features. (III) Feature selection and model training. (IV) Performance testing of the model (ROC analysis, calibration curve analysis, decision curve analysis, and multicenter prospective validation). Soft and firm consistency were classified according to the neurosurgeon's evaluation: a tumor that could be suctioned out using an aspirator was considered soft, while a tumor that could not be suctioned out was considered firm.
MR Imaging Protocol and Image Acquisition
All patients underwent pituitary MR imaging before surgery. The precise MR imaging protocol included T2-weighted imaging (T2WI), T1-weighted imaging (T1WI), and contrast-enhanced T1WI. MR imaging was performed in the head-first supine position using a 3.0-T magnetic resonance system (Discovery MR 750, GE Healthcare, Chicago, IL, USA). Specifically, the T2WI sequence acquisition parameters were as follows: repetition time/echo time of 4,200/103 ms, field of view of 200 × 200 mm, flip angle of 90°, acquisition matrix of 320 × 224, slice thickness of 4 mm, and spacing between slices (center to center of each slice) of 5 mm. Additionally, the T1WI sequence acquisition parameters were as follows: repetition time/echo time of 400/9 ms, field of view of 200 × 200 mm, flip angle of 90°, acquisition matrix of 288 × 192, slice thickness of 3 mm, and spacing between slices of 3.5 mm. The contrast-enhanced T1WI sequence acquisition parameters were the same as the T1WI sequence parameters. Contrast-enhanced T1WI was carried out immediately after rapid injection of a gadolinium-DTPA contrast agent (0.1 mmol/kg Gadovist; Bayer AG, Leverkusen, Germany). T2WI, T1WI, and contrast-enhanced T1WI in the coronal plane were utilized, and all images were collected based on the picture archiving and communication system of the hospital.
Tumor Masking and Feature Extraction
A neuroradiologist with 7 years of experience in studying acromegaly was responsible for drawing the related regions of interest (ROIs) that delineated the tumor in each patient with acromegaly on the aforementioned MR images through ITK-SNAP software (University of Pennsylvania, www.itksnap.org). The as-drawn ROIs were confirmed manually by another expert neuroradiologist with 12 years of related experience in investigating acromegaly, and this neuroradiologist was blind to the operation records. Any disagreement between the two neuroradiologists was settled by mutual negotiation between them. The radiomics features were then collected based on these ROIs.
In total, 1,561 quantitative features were collected for every sequence using PyRadiomics (https://github.com/Radiomics/pyradiomics) (23). All radiomics features were normalized to a value of 0 to 1 and classified into four groups: first-order features (n = 180), shape and size features (n = 13), textural features (n = 680), and wavelet features (n = 688). The textural features included the gray-level co-occurrence matrix (GLCM), gray-level run-length matrix, and the gray-level size-zone matrix.
Selection of Radiomics Features
High-dimensional information may be associated with a high level of redundant irrelevant information. This may result in overfitting, thus seriously reducing the learning algorithm performance. Therefore, it was necessary to carry out a feature selection process.
Features were selected by a three-stage process based on the results acquired from the primary cohort. Differences in the features between soft and firm cases in the primary cohort were examined by univariate analysis through the Wilcoxon rank sum test. The elastic net approach (24), which combined the least absolute shrinkage and selection operator algorithm with ridge regression, was adopted to select features with the highest representativeness. The final features were confirmed using the recursive feature elimination algorithm through 7-fold cross-validation.
Establishment and Validation of the Radiomics Signature
The radiomics signature was established based on the radiomics features selected from the primary cohort through the support vector machine method. At the same time, differences in the signature distribution between soft and firm tumors were compared between the two cohorts using a violin plot. A receiver operating characteristic (ROC) (25) curve was drawn to display the predictive value of the as-selected radiomics signature.
Construction and Validation of the Clinical and Radiomics Model
The Akaike information criterion (AIC) (26) was used to screen the clinical features, among which the most valuable ones were further screened through multivariable logistic regression analysis. To establish an individualized model for predicting the tumor consistency for both clinicians and patients, the constructed radiomics signature was used in combination with the selected clinical features, which were further screened according to the AIC, to produce a fusion radiomics model. A nomogram was obtained from the radiomics model.
ROC analyses and calculation of the associated classification measures [including the area under the curve (AUC), accuracy, sensitivity, specificity, positive predictive value, and negative predictive value] were performed to compare the discriminability of the clinical and radiomics model in the two cohorts. Calibration curves were then drawn and used in combination with the Hosmer–Lemeshow test to assess the similarities between the predicted and measured tumor consistency probabilities (27).
Clinical Application and Multicenter Validation
The clinical usefulness of the radiomics model was assessed by means of a decision curve analysis, in which the net benefits were quantified under different threshold probabilities (28). Following construction of the radiomics model, the 30 patients with acromegaly from three hospitals were enrolled for multicenter validation of the model. The prediction accuracy was then evaluated through ROC analyses and associated classification measures.
Statistical Analysis
Differences with a two-sided p-value of < 0.05 were deemed statistically significant. The statistical software R, version 3.4.1 (R Foundation for Statistical Computing, Vienna, Austria) was used by an experienced statistician to carry out the statistical analysis. The combined model was created using the “rms” package, the calibration plot was examined through the “hdnom” packages, and the decision curve analysis was conducted by the function “dca.R.”
Results
Clinical Characteristics
The clinical characteristics of all 158 patients with acromegaly (100 from the primary cohort and 58 from the validation cohort) enrolled in this study are shown in Table 1. In total, 38.0% (38/100) and 34.5% (20/58) patients in the primary cohort and validation cohort, respectively, developed firm tumors. No significant interclass differences were detected in age, sex, random GH level, nadir GH level and GH inhibition ratio following a glucose load, insulin-like growth factor 1 level, tumor volume, or Knosp classification between the two cohorts (p = 0.418–0.999). These results justify the use of these two sets as a primary cohort and validation cohort. Significant interclass differences in the tumor volume and Knosp classification were found in both cohorts, which might be ascribed to the correlations of these parameters with tumor consistency. Patient age was different between the soft and firm groups in the primary cohort only (Table 2).
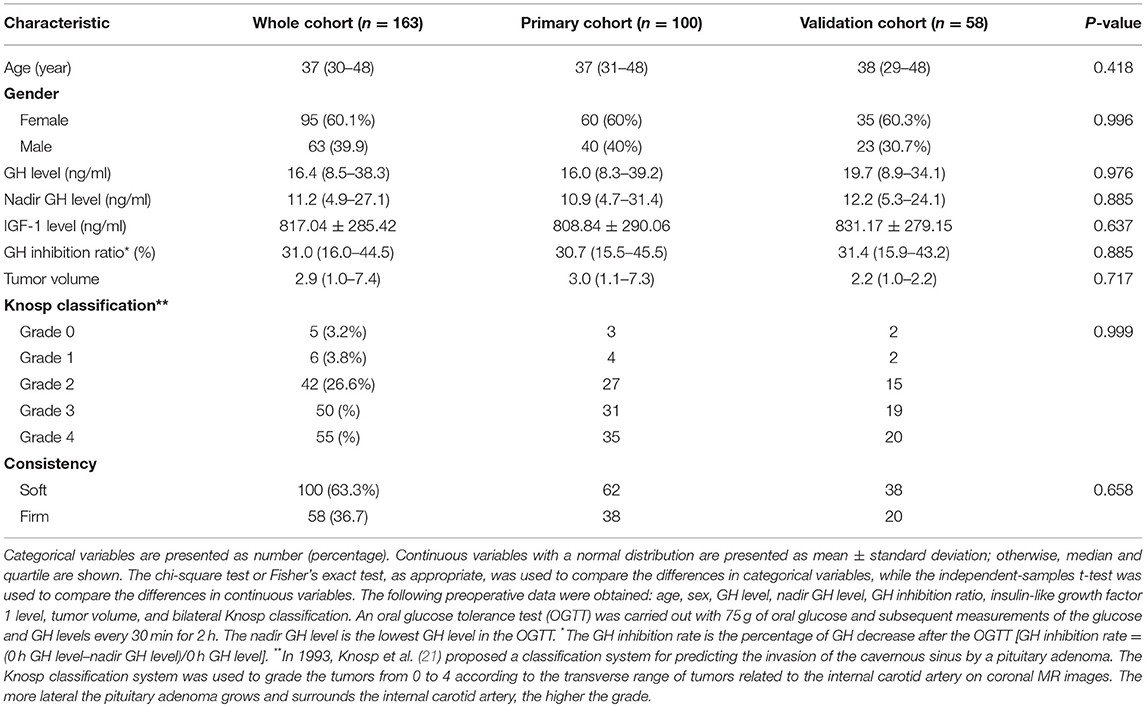
Table 1. Characteristics of patients in the primary and validation cohorts.
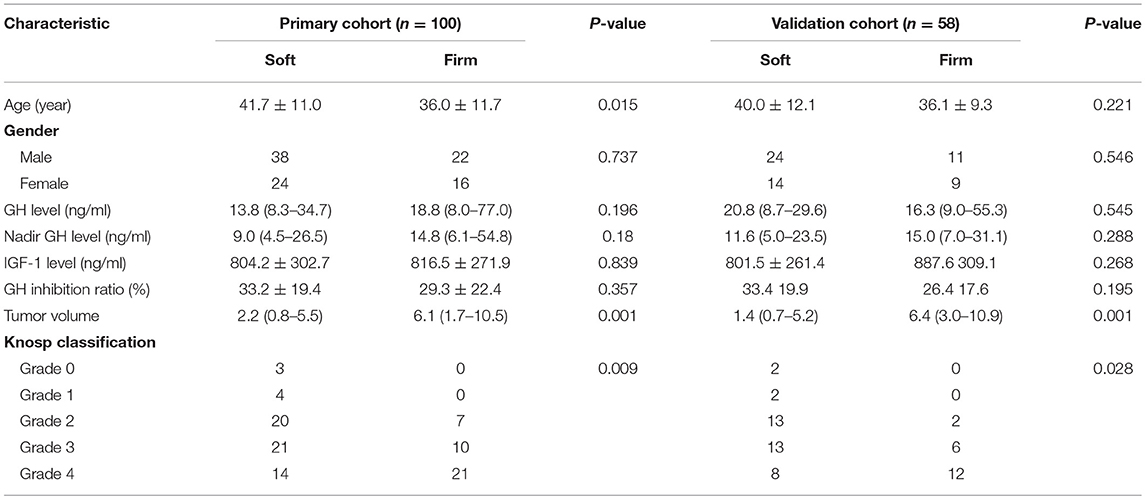
Table 2. Univariate analysis of clinical characteristics of patients and acromegaly in the primary cohort and validation cohort.
Feature Screening and Establishment of the Radiomics Signature
In total, 4,683 radiomics features were calculated in this study. Among these, the four key features were screened through the elastic net feature selection algorithm. The detailed information is presented in Table 3. The four selected radiomics features were statistically different between the two tumor consistencies (Figure 2). Additionally, differences in the radiomics signature distribution were statistically significant between the soft and firm tumors in both cohorts, as revealed by the violin plot (p < 0.01) (Figure 3).
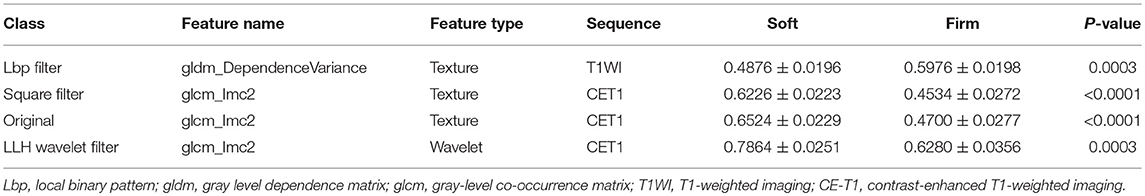
Table 3. The four key radiomic features detail information.
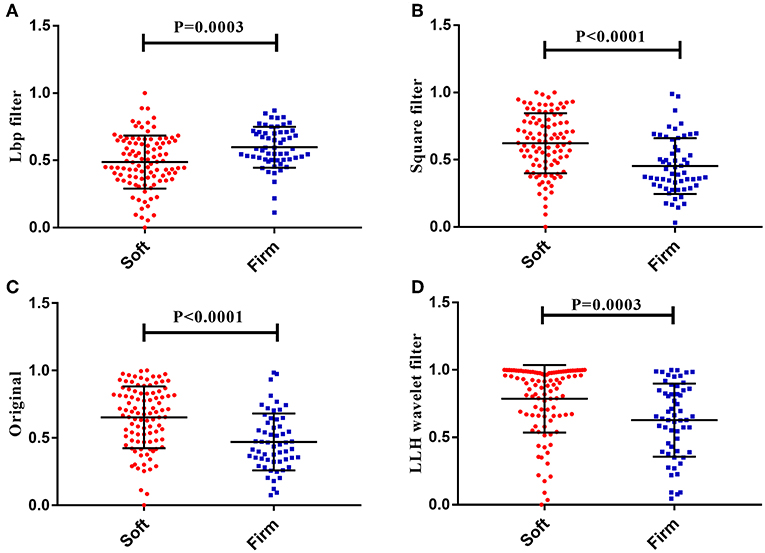
Figure 2. The four radiomics features showed significant differences between the soft and firm tumor groups. (A) Lbp filter gldm_DependenceVariance. (B) Square filter glcm_Imc2. (C) Original glcm_Imc2. (D) LLH wavelet filter glcm_Imc2.
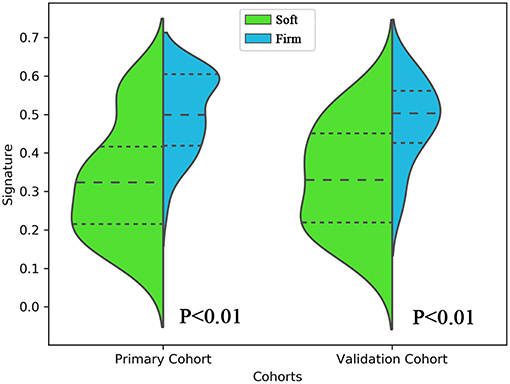
Figure 3. Violin plot comparing the distribution of the radiomics signatures of soft and firm tumors in the primary and validation cohorts. This plot is a combination of a boxplot and kernel density estimate. The signature distributions of each cohort were compared using independent-samples t-tests.
The radiomics signature based on the four selected radiomics features was then established according to the support vector machine model. The results suggested that the constructed radiomics signature had favorable performance in predicting tumor consistency, with an AUC of 0.84 [95% confidence interval (CI), 0.81–0.86] and 0.76 (95% CI, 0.73–0.79) in the primary and validation cohorts, respectively. The ROC curves derived from the two cohorts are shown in Figure 4A. All predictive indicators acquired based on the radiomics signature are shown in Table 4.
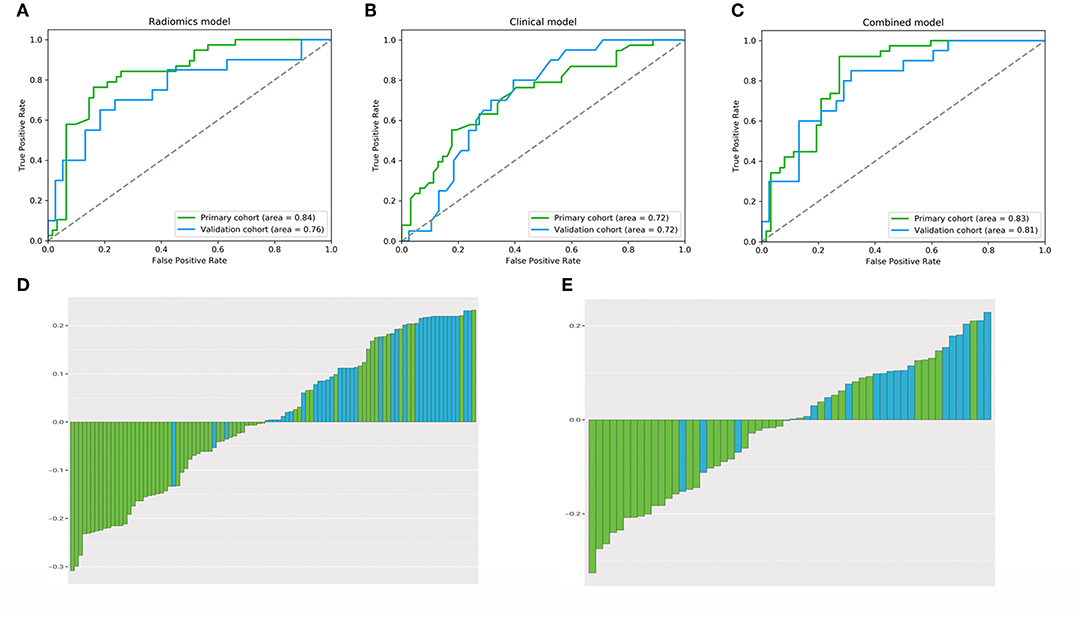
Figure 4. The performance of (A–C) ROC curves for the three models and (D,E) bar plots for the radiomics model in the primary and validation cohorts. The performance of the models was assessed using the AUC. (A) Radiomics signature. (B) Clinical model. (C) Radiomics model. (D) Primary cohort. (E) Validation cohort.
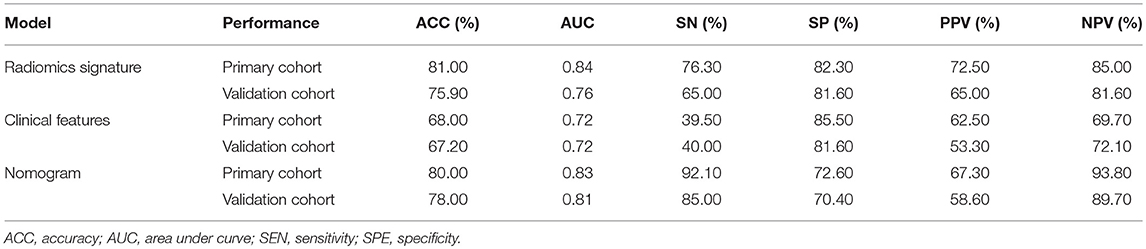
Table 4. Performance of radiomics signature, clinical features and radiomic model.
Performance of the Clinical Radiomics Model
Using the AIC, age and the Knosp classification were chosen as the discriminatory factors to establish the clinical model. The AUCs were 0.72 (95% CI, 0.69–0.76) and 0.72 (95% CI, 0.69–0.75) in the primary and validation cohorts, respectively (Figure 4B). Additionally, the Knosp classification and radiomics signature were screened among various clinical features based on the AIC to establish the fusion radiomics model. The AUCs were 0.83 (95% CI, 0.81–0.85) and 0.81 (95% CI, 0.78–0.83) in the primary and validation cohorts, respectively, whereas the accuracy was 80.0 and 78.0% in the two cohorts, respectively (Figure 4C). Bar plots showing the prediction accuracy of the radiomics model for the two cohorts are shown in Figures 4D,E.
Details of the predictive indicators for the clinical radiomics model are presented in Table 4. A nomogram was obtained based on the radiomics model (Figure 5). Additionally, the results of the DeLong test suggested that the performance of the radiomics model was superior to that of any independent clinical feature (p = 0.03). A calibration curve was also plotted based on the radiomics model to examine the tumor consistency and suggested excellent agreement between the observed and predicted results in both the primary cohort (p = 0.59) (Figure 6A) and validation cohort (p = 0.68) (Figure 6B). No statistical significance was detected by the Hosmer–Lemeshow test, suggesting the absence of a distinct departure from the perfect fit.
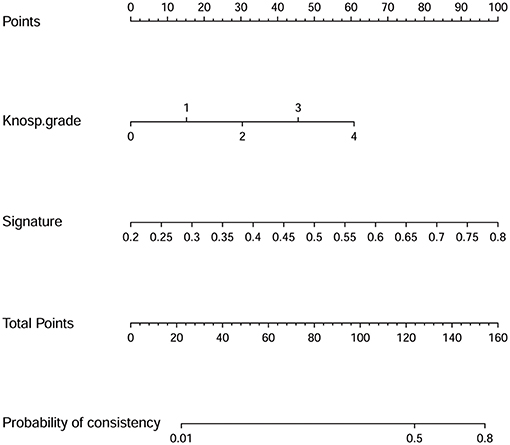
Figure 5. Nomogram derived from the radiomics model applied to the primary cohort. The radiomics model was incorporated with the Knosp grade and radiomics signature. This nomogram is used according to the patient's Knosp grade and radiomics signature value. The position of each variable is found on the corresponding axis (lines 2 and 3), and a vertical line is then drawn to the points axis (the first line) to obtain the corresponding score. As an example, one patient in this study with a Knosp grade of 3 had a score of 45.6, and his radiomics signature value was 0.28, which means a score of 13.0. Next, according to the sum of all scores, the position on the total points axis is identified, and a vertical line is drawn from the position to the last line to determine the tumor consistency possibilities. The above-mentioned patient's total risk score was 58.6, which corresponds to a 2.4% probability of a firm tumor. That is to say, using our nomogram, this patient's tumor consistency was predicted to be soft before surgery. Later, this patient's clinical and surgical data indicated that the tumor was indeed soft. Thus, the model accurately predicted this patient's tumor consistency.
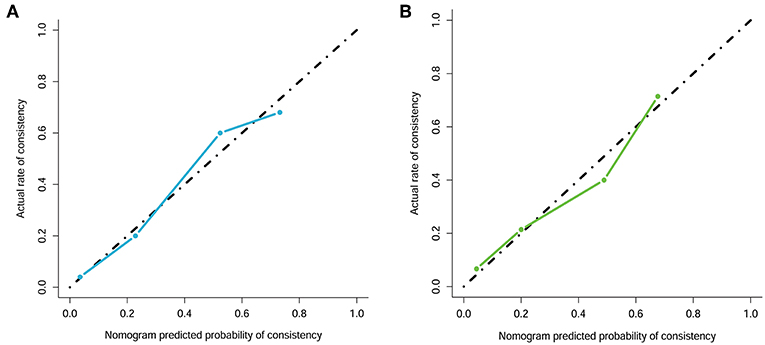
Figure 6. Calibration curve analysis for the radiomics model. (A) Primary cohort. (B) Validation cohort. Calibration curves depict the calibration of each model in terms of the agreement between the predicted and actual probability of the firm tumor rate. The Y axis represents the actual rate. The X axis represents the predicted probability. The diagonal black line represents perfect prediction by an ideal model. The blue and green line represents the performance of the radiomics model, of which a closer fit to the diagonal black line represents a better prediction.
The radiomics model also achieved favorable discriminability and excellent calibration; it could more accurately predict the tumor consistency in patients with acromegaly than the use of clinical features only could.
Clinical Usefulness of the Constructed Radiomics Model
The decision curve analysis of the radiomics model is presented in Figures 7A,B. The radiomics model clearly provided a net benefit over the two schemes, with a threshold probability of >0 and >12% for the primary and validation cohorts, respectively, suggesting the clinical usefulness of the radiomics model. The decision curve attained better performance for the constructed radiomics model with regard to clinical application.
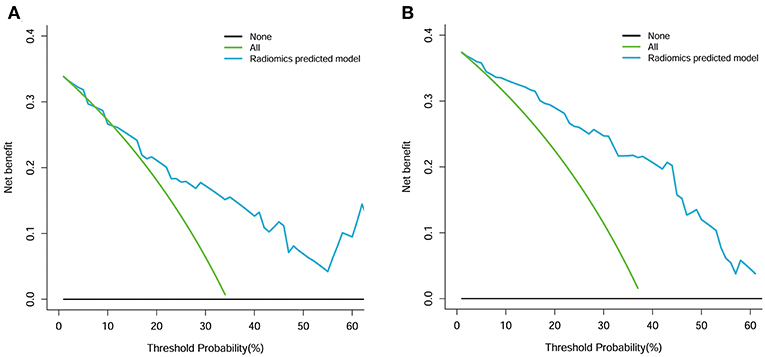
Figure 7. Decision curve analysis for the radiomics model. (A) Primary cohort. (B) Validation cohort. The Y axis measures the net benefit. The blue line represents the radiomics model. The green line represents the assumption that all patients had a firm tumor. The black line represents the assumption that no patients had a firm tumor.
Notably, the radiomics model performed well in the multicenter prospective validation for prediction of the tumor consistency, with an AUC and accuracy of 0.89 and 86.7%, respectively (Figure 8). These findings revealed the ability of the radiomics model to classify the tumor consistency in patients with acromegaly.
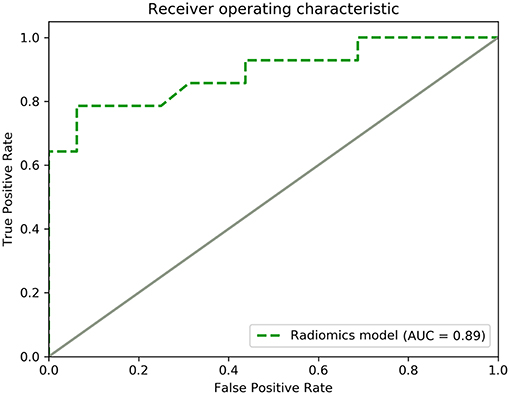
Figure 8. ROC curve for the performance of the radiomics model in the multicenter prospective validation.
Discussion
According to the guidelines, the initial cure rate of transsphenoidal surgery for macroadenomas is 40–50% when performed by experienced pituitary surgeons (8). In patients with acromegaly, a small residual tumor will postoperatively induce persistent GH hypersecretion (29). Therefore, determination of the tumor consistency before surgery is important to plan the surgical approach, avoid the need for a multistage surgical procedure, avoid the development of persistent acromegaly, and improve the surgical cure rate (30). Nonetheless, whether the tumor consistency can be predicted using MR imaging techniques remains unclear.
Several studies have been performed in an effort to predict the PA consistency using MR imaging techniques (11, 13, 22, 31–39); however, the ability of MR pituitary images to predict the PA consistency is controversial (22). In some studies, the apparent diffusion coefficient was not markedly correlated with the PA consistency on diffusion-weighted imaging (35), enhanced reconstructed diffusion-weighted imaging (36), or line-scan diffusion-weighted imaging sequences (37). Bahuleyan et al. (22) suggested that the MR imaging signal intensity alone could not accurately predict the consistency of pituitary macroadenomas. Some other scholars have indicated that contrast-enhanced fast imaging employing steady-state acquisition (11), dynamic MR imaging acquisition (31), and MR elastography (32) sequences can potentially offer preoperative information regarding the PA consistency. In addition, Smith et al. (34) demonstrated a statistically significant difference in the T2WI intensity ratio of adenoma to cerebellar peduncle between soft and firm PAs. On this account, neurosurgeons can effectively prepare for surgical procedures. Moreover, our findings suggest numerous limitations of those studies, such as poor prediction accuracy, small sample sizes, lack of internal, and multicenter validation, and complicated imaging sequences (Table 5). As a result, the development of a highly effective and widely applicable method for preoperative prediction is urgently needed.
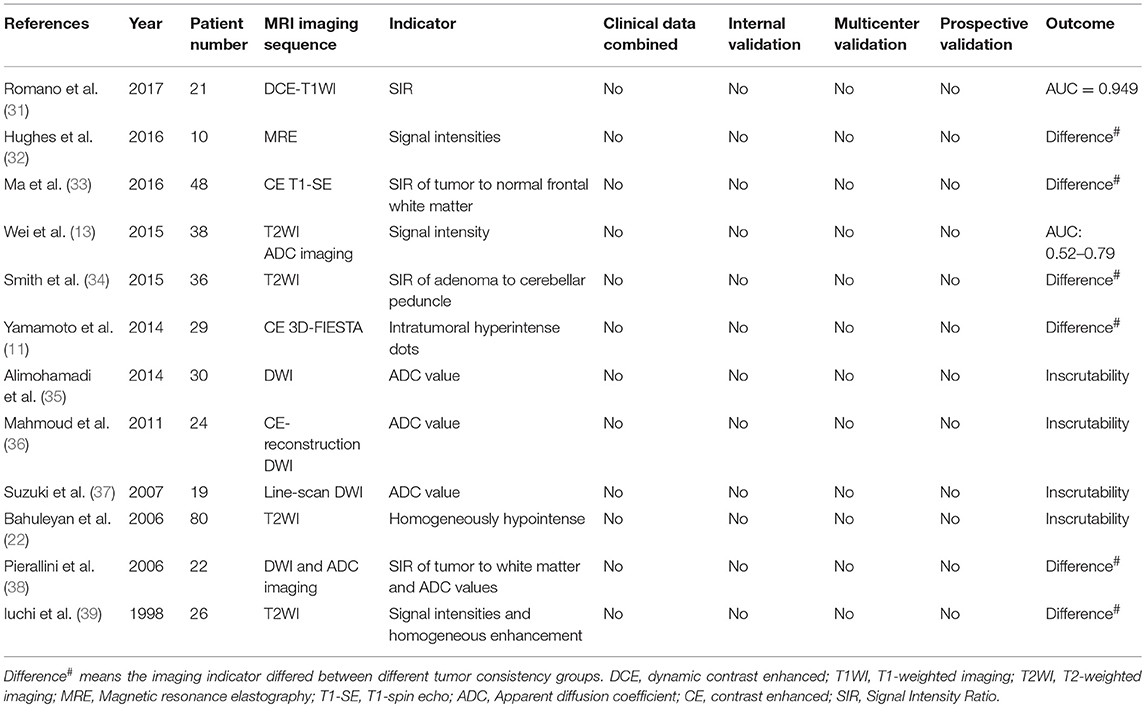
Table 5. Summary of the method and outcome of previous PA consistency prediction studies.
As an emerging study field, radiomics can possibly depict the intratumoral heterogeneity based on quantitative and classified high-throughput data (40). Radiomics is a new area of study in which quantitative and high-throughput data are extracted, processed, and analyzed to explore their relationships with valuable information (15, 41). The radiomics process first converts radiographic images into mineable data in four steps: image acquisition and reconstruction, segmentation of the ROI, feature extraction and quantification, and establishment of predictive and prognostic models. Novel image-based computational models have played increasingly important roles in accurate diagnosis and treatment guidance in the field of neuro-oncology thanks to the development of clinical imaging data (42). As suggested in numerous studies, radiomics analysis can be quite effective. Compared with soft PAs, firm PAs contain large amounts of collagen and are more homogeneously enhanced after injection of a gadolinium-DTPA contrast agent (39). The collagen content is the main factor affecting the texture of PAs and has an impact on the performance of MR imaging (13). Therefore, the use of radiomics technology to predict the tumor consistency in patients with acromegaly has a good theoretical basis and is promising.
A radiomics signature comprising four selected features (three texture features and one wavelet feature) was constructed in the present study. Importantly, the constructed radiomics signature was found to be able to successfully classify both soft and firm tumors in patients with acromegaly. Recent studies have indicated that textural features can serve as imaging markers to predict the PA subtype (43) and the glioma stage (44, 45). Textural features have also been depicted as patterns or spatial distributions of voxel intensity, and they can be computed from the GLCM (46). The voxel intensity values in the volume of interest are required to determine the representative texture matrix (47), and such a step can reduce the image noise and normalize the intensities among all patients. Thus, it is possible to directly compare all of the computed textural features among different patients. Table 3 suggests that the most relevant imaging feature is the GLCM. The GLCM, which is a type of texture-analysis method, can calculate the frequency of occurrence of pixel pairs with specific values at a specified spatial relationship in an image (16) as supported by several recent studies (16, 48). The GLCM can characterize the tumor heterogeneity; therefore, to distinguish between a soft and firm tumor, it is important to obtain the statistical measures and to create the radiomics signature based on the GLCM. The radiomics model constructed in this study incorporated both the radiomics signature and the selected clinical features, with an AUC of 0.83 (95% CI, 0.81–0.85) and 0.81 (95% CI, 0.78–0.83) in the primary and validation cohorts, respectively. More importantly, this radiomics model displayed good calibration and discrimination. Additionally, this model was convenient to use and could accurately predict the tumor consistency in a multicenter prospective validation before surgery.
To our knowledge, the current study is the first to evaluate the consistency of pituitary macroadenomas by means of a radiomics approach. Our study has certain advantages over retrospective studies (Table 5). First, the large sample size in this study provided reliable results. Second, because patients with acromegaly may benefit from preoperative treatment with somatostatin analogs (49, 50), and because somatostatin analogs may induce histological, fibrous, and consistency changes in PAs (51), we only selected patients without a history of preoperative treatment to ensure the accuracy of the predicted results. Third, the preoperative prediction model constructed based on radiomics features incorporated both clinical and quantitative imaging features that were not susceptible to any degradation; moreover, the model was of high effectiveness and extensive application. Finally, the patients were divided into independent primary and validation cohorts for internal validation, and multicenter prospective validation was also conducted thereafter.
This study also had some limitations. First, although this was a multicenter study, we only conducted a holistic prospective validation because some centers provided fewer patients. More prospective datasets are needed for independent center validation and verification of the robustness and repeatability of this radiomics model. Second, different classification methods are used for PA consistency in clinical application, including two groups (11, 22, 34, 39), three groups (13, 32, 35, 37, 38), and other methods (33, 51). We chose to divide the tumors into two groups, but different classification methods may lead to different models and prediction results. Third, although most recent studies (32, 34, 35, 37–39) used only clinical data (surgical records and videos) to differentiate and classify the PA consistency, the cellular type, fibrous characteristics, and reticulin content have a significant relationship with consistency and can help to determine the consistency of PAs (11, 13, 30, 31, 35, 38, 39). Therefore, clinical data and pathological data should be combined in further experiments to provide a more reliable basis for the classification of tumor consistency. Finally, radiomics may serve as a complementary tool to transcriptomics, genomics, and proteomics, all of which may be used in combination to construct a more accurate model for prediction.
In summary, the findings of this study suggest that a radiomics model constructed based on a radiomics signature combined with clinical features can improve the accuracy of predicting the tumor consistency in patients with acromegaly. The as-constructed multiparametric radiomics model was further validated internally and externally, showing robustness. Moreover, the radiomics model performed better than any single model and achieved results superior to those in previous studies. Most importantly, it can serve as an effective noninvasive approach to distinguish the tumor consistency and determine individualized therapeutic schemes for patients with acromegaly.
Data Availability
The data used to support the findings of this study are available from the corresponding author upon request.
Ethics Statement
This study was carried out in accordance with the recommendations of the Ethical Review Committee of Peking Union Medical College Hospital with written informed consent from all prospective subjects. The protocol was approved by the Institutional Review Board of Peking Union Medical College Hospital.
Author Contributions
All authors provided contributions to the study conception and design, acquisition of data or analysis and interpretation of data, drafting of the article, or revising it critically for important intellectual content, and final approval of the version to be published. All authors analyzed and interpreted the data. YF, MH, and AM revised the manuscript for important intellectual content. RW and MF take final responsibility for this article.
Funding
This work was supported by the Graduate Innovation Fund of Peking Union Medical College (2018-1002-01-10), the Natural Science Foundation of Beijing Municipality (grant No. 7182137), the Capital Characteristic Clinic Project (grant No. Z16100000516092), and the Chinese Academy of Medical Sciences (grant No. 2017-I2M-3-014).
Conflict of Interest Statement
The authors declare that the research was conducted in the absence of any commercial or financial relationships that could be construed as a potential conflict of interest.
Acknowledgments
We thank Angela Morben, DVM, ELS, from Liwen Bianji, Edanz Editing China (www.liwenbianji.cn/ac), for editing the English text of a draft of this manuscript.
References
1. Ji-Hu Y, Guo-Dong H, Tao J, Hai-Dong W, Yu-Fei L, Jian G, et al. Endoscopic endonasal surgery treatment strategies for invasive pituitary adenoma: analysis of four approaches. World Neurosurg. (2018) 115:5–13. doi: 10.1016/j.wneu.2018.02.162
2. Wiedmann M, Brunborg C, Lindemann K, Johannesen TB, Vatten L, Helseth E, et al. Smoking, obesity and the risk of pituitary adenoma: a large prospective cohort study (The HUNT Study). Eur J Epidemiol. (2016) 31:95–8. doi: 10.1007/s10654-015-0033-6
3. Raappana A, Koivukangas J, Ebeling T, Pirila T. Incidence of pituitary adenomas in Northern Finland in 1992–2007. J Clin Endocrinol Metab. (2010) 95:4268–75. doi: 10.1210/jc.2010-0537
4. Esposito D, Ragnarsson O, Granfeldt D, Marlow T, Johannsson G, Olsson DS. Decreasing mortality and changes in treatment patterns in patients with acromegaly from a nationwide study. Eur J Endocrinol. (2018) 178:459–69. doi: 10.1530/EJE-18-0015
5. Leopoldo C, Leopoldo F, Santos A, Veiga JCE, Lima JVJ, Scalissi NM, et al. Long term follow-up of growth hormone-secreting pituitary adenomas submitted to endoscopic endonasal surgery. Arq Neuropsiquiatr. (2017) 75:301–6. doi: 10.1590/0004-282x20170035
6. Buliman A, Tataranu LG, Ciubotaru V, Cazac TL, Dumitrache C. The multimodal management of GH-secreting pituitary adenomas: predictive factors, strategies and outcomes. J Med Life. (2016) 9:187–92.
7. Melmed S, Colao A, Barkan A, Molitch M, Grossman AB, Kleinberg D, et al. Guidelines for acromegaly management: an update. J Clin Endocrinol Metab. (2009) 94:1509–17. doi: 10.1210/jc.2008-2421
8. Katznelson L, Laws ER Jr, Melmed S, Molitch ME, Murad MH, Utz A, et al. Acromegaly: an endocrine society clinical practice guideline. J Clin Endocrinol Metab. (2014) 99:3933–51. doi: 10.1210/jc.2014-2700
9. Zhao B, Wei YK, Li GL, Li YN, Yao Y, Kang J, et al. Extended transsphenoidal approach for pituitary adenomas invading the anterior cranial base, cavernous sinus, and clivus: a single-center experience with 126 consecutive cases. J Neurosurg. (2010) 112:108–17. doi: 10.3171/2009.3.JNS0929
10. Sughrue ME, Chang EF, Gabriel RA, Aghi MK, Blevins LS. Excess mortality for patients with residual disease following resection of pituitary adenomas. Pituitary. (2011) 14:276–83. doi: 10.1007/s11102-011-0308-1
11. Yamamoto J, Kakeda S, Shimajiri S, Takahashi M, Watanabe K, Kai Y, et al. Tumor consistency of pituitary macroadenomas: predictive analysis on the basis of imaging features with contrast-enhanced 3D FIESTA at 3T. AJNR Am J Neuroradiol. (2014) 35:297–303. doi: 10.3174/ajnr.A3667
12. Saeger W. Pituitary tumors: prognostic indicators. Endocrine. (2005) 28:57–66. doi: 10.1385/ENDO:28:1:057
13. Wei L, Lin SA, Fan K, Xiao D, Hong J, Wang S. Relationship between pituitary adenoma texture and collagen content revealed by comparative study of MRI and pathology analysis. Int J Clin Exp Med. (2015) 8:12898–905.
14. Gillies RJ, Kinahan PE, Hricak H. Radiomics: images are more than pictures, they are data. Radiology. (2016) 278:563–77. doi: 10.1148/radiol.2015151169
15. Lambin P, Leijenaar RTH, Deist TM, Peerlings J, de Jong EEC, van Timmeren J, et al. Radiomics: the bridge between medical imaging and personalized medicine. Nat Rev Clin Oncol. (2017) 14:749–62. doi: 10.1038/nrclinonc.2017.141
16. Kang D, Park JE, Kim YH, Kim JH, Oh JY, Kim J, et al. Diffusion radiomics as a diagnostic model for atypical manifestation of primary central nervous system lymphoma: development and multicenter external validation. Neuro Oncol. (2018) 20:1251–61. doi: 10.1093/neuonc/noy021
17. Zhou H, Vallieres M, Bai HX, Su C, Tang H, Oldridge D, et al. MRI features predict survival and molecular markers in diffuse lower-grade gliomas. Neuro Oncol. (2017) 19:862–70. doi: 10.1093/neuonc/now256
18. Wang C, Sun W, Kirkpatrick J, Chang Z, Yin FF. Assessment of concurrent stereotactic radiosurgery and bevacizumab treatment of recurrent malignant gliomas using multi-modality MRI imaging and radiomics analysis. J Radiosurg SBRT. (2018) 5:171–81.
19. Niu J, Zhang S, Ma S, Diao J, Zhou W, Tian J, et al. Preoperative prediction of cavernous sinus invasion by pituitary adenomas using a radiomics method based on magnetic resonance images. Eur Radiol. (2019) 29:1625–34. doi: 10.1007/s00330-018-5725-3
20. Guo X, Gao L, Zhao Y, Wang M, Jiang B, Wang Q, et al. Characteristics of the upper respiratory tract in patients with acromegaly and correlations with obstructive sleep apnoea/hypopnea syndrome. Sleep Med. (2018) 48:27–34. doi: 10.1016/j.sleep.2018.04.011
21. Knosp E, Steiner E, Kitz K, Matula C. Pituitary adenomas with invasion of the cavernous sinus space: a magnetic resonance imaging classification compared with surgical findings. Neurosurgery. (1993) 33:610–7. doi: 10.1227/00006123-199310000-00008
22. Bahuleyan B, Raghuram L, Rajshekhar V, Chacko AG. To assess the ability of MRI to predict consistency of pituitary macroadenomas. Br J Neurosurg. (2006) 20:324–6. doi: 10.1080/02688690601000717
23. van Griethuysen JJM, Fedorov A, Parmar C, Hosny A, Aucoin N, Narayan V, et al. Computational radiomics system to decode the radiographic phenotype. Cancer Res. (2017) 77:e104–7. doi: 10.1158/0008-5472.CAN-17-0339
24. Qu J, Shen C, Qin J, Wang Z, Liu Z, Guo J, et al. The MR radiomic signature can predict preoperative lymph node metastasis in patients with esophageal cancer. Eur Radiol. (2019) 29:906–14. doi: 10.1007/s00330-018-5583-z
25. Erturk SM. Receiver operating characteristic analysis. AJR Am J Roentgenol. (2011) 197:W784. doi: 10.2214/AJR.11.6484
26. Pan W. Akaike's information criterion in generalized estimating equations. Biometrics. (2001) 57:120–5. doi: 10.1111/j.0006-341X.2001.00120.x
27. Kramer AA, Zimmerman JE. Assessing the calibration of mortality benchmarks in critical care: the Hosmer-Lemeshow test revisited. Crit Care Med. (2007) 35:2052–6. doi: 10.1097/01.CCM.0000275267.64078.B0
28. Vickers AJ, Cronin AM, Elkin EB, Gonen M. Extensions to decision curve analysis, a novel method for evaluating diagnostic tests, prediction models and molecular markers. BMC Med Inform Decis Mak. (2008) 8:53. doi: 10.1186/1472-6947-8-53
29. Kim EH, Oh MC, Chang JH, Moon JH, Ku CR, Chang WS, et al. Postoperative gamma knife radiosurgery for cavernous sinus-invading growth hormone-secreting pituitary adenomas. World Neurosurg. (2018) 110:e534–45. doi: 10.1016/j.wneu.2017.11.043
30. Boxerman JL, Rogg JM, Donahue JE, Machan JT, Goldman MA, Doberstein CE. Preoperative MRI evaluation of pituitary macroadenoma: imaging features predictive of successful transsphenoidal surgery. AJR Am J Roentgenol. (2010) 195:720–8. doi: 10.2214/AJR.09.4128
31. Romano A, Coppola V, Lombardi M, Lavorato L, Di Stefano D, Caroli E, et al. Predictive role of dynamic contrast enhanced T1-weighted MR sequences in pre-surgical evaluation of macroadenomas consistency. Pituitary. (2017) 20:201–9. doi: 10.1007/s11102-016-0760-z
32. Hughes JD, Fattahi N, Van Gompel J, Arani A, Ehman R, Huston J III. Magnetic resonance elastography detects tumoral consistency in pituitary macroadenomas. Pituitary. (2016) 19:286–92. doi: 10.1007/s11102-016-0706-5
33. Ma Z, He W, Zhao Y, Yuan J, Zhang Q, Wu Y, et al. Predictive value of PWI for blood supply and T1-spin echo MRI for consistency of pituitary adenoma. Neuroradiology. (2016) 58:51–7. doi: 10.1007/s00234-015-1591-8
34. Smith KA, Leever JD, Chamoun RB. Prediction of consistency of pituitary adenomas by magnetic resonance imaging. J Neurol Surg B Skull Base. (2015) 76:340–3. doi: 10.1055/s-0035-1549005
35. Alimohamadi M, Sanjari R, Mortazavi A, Shirani M, Moradi Tabriz H, Hadizadeh Kharazi H, et al. Predictive value of diffusion-weighted MRI for tumor consistency and resection rate of nonfunctional pituitary macroadenomas. Acta Neurochir. (2014) 156:2245–52. doi: 10.1007/s00701-014-2259-6
36. Mahmoud OM, Tominaga A, Amatya VJ, Ohtaki M, Sugiyama K, Sakoguchi T, et al. Role of PROPELLER diffusion-weighted imaging and apparent diffusion coefficient in the evaluation of pituitary adenomas. Eur J Radiol. (2011) 80:412–7. doi: 10.1016/j.ejrad.2010.05.023
37. Suzuki C, Maeda M, Hori K, Kozuka Y, Sakuma H, Taki W, et al. Apparent diffusion coefficient of pituitary macroadenoma evaluated with line-scan diffusion-weighted imaging. J Neuroradiol. (2007) 34:228–35. doi: 10.1016/j.neurad.2007.06.007
38. Pierallini A, Caramia F, Falcone C, Tinelli E, Paonessa A, Ciddio AB, et al. Pituitary macroadenomas: preoperative evaluation of consistency with diffusion-weighted MR imaging–initial experience. Radiology. (2006) 239:223–31. doi: 10.1148/radiol.2383042204
39. Iuchi T, Saeki N, Tanaka M, Sunami K, Yamaura A. MRI prediction of fibrous pituitary adenomas. Acta Neurochir. (1998) 140:779–86. doi: 10.1007/s007010050179
40. Park JE, Kim HS. Radiomics as a quantitative imaging biomarker: practical considerations and the current standpoint in neuro-oncologic studies. Nucl Med Mol Imaging. (2018) 52:99–108. doi: 10.1007/s13139-017-0512-7
41. Lee G, Lee HY, Park H, Schiebler ML, van Beek EJR, Ohno Y, et al. Radiomics and its emerging role in lung cancer research, imaging biomarkers and clinical management: state of the art. Eur J Radiol. (2017) 86:297–307. doi: 10.1016/j.ejrad.2016.09.005
42. Zhou M, Scott J, Chaudhury B, Hall L, Goldgof D, Yeom KW, et al. Radiomics in brain tumor: image assessment, quantitative feature descriptors, and machine-learning approaches. AJNR Am J Neuroradiol. (2018) 39:208–16. doi: 10.3174/ajnr.A5391
43. Zhang S, Song G, Zang Y, Jia J, Wang C, Li C, et al. Non-invasive radiomics approach potentially predicts non-functioning pituitary adenomas subtypes before surgery. Eur Radiol. (2018) 28:3692–701. doi: 10.1007/s00330-017-5180-6
44. Cho HH, Lee SH, Kim J, Park H. Classification of the glioma grading using radiomics analysis. PeerJ. (2018) 6:e5982. doi: 10.7717/peerj.5982
45. Tian Q, Yan LF, Zhang X, Zhang X, Hu YC, Han Y, et al. Radiomics strategy for glioma grading using texture features from multiparametric MRI. J Magn Reson Imaging. (2018) 48:1518–28. doi: 10.1002/jmri.26010
46. Aerts HJ, Velazquez ER, Leijenaar RT, Parmar C, Grossmann P, Carvalho S, et al. Decoding tumour phenotype by noninvasive imaging using a quantitative radiomics approach. Nat Commun. (2014) 5:4006. doi: 10.1038/ncomms5644
47. Shi Z, Zhu C, Degnan AJ, Tian X, Li J, Chen L, et al. Identification of high-risk plaque features in intracranial atherosclerosis: initial experience using a radiomic approach. Eur Radiol. (2018) 28:3912–21. doi: 10.1007/s00330-018-5395-1
48. Lin YC, Lin G, Hong JH, Lin YP, Chen FH, Ng SH, et al. Diffusion radiomics analysis of intratumoral heterogeneity in a murine prostate cancer model following radiotherapy: pixelwise correlation with histology. J Magn Reson Imaging. (2017) 46:483–9. doi: 10.1002/jmri.25583
49. Lv L, Hu Y, Zhou P, Zhang S, Yin S, Zhang N, et al. Presurgical treatment with somatostatin analogues in growth hormone-secreting pituitary adenomas: a long-term single-center experience. Clin Neurol Neurosurg. (2018) 167:24–30. doi: 10.1016/j.clineuro.2018.02.006
50. Petrossians P, Borges-Martins L, Espinoza C, Daly A, Betea D, Valdes-Socin H, et al. Gross total resection or debulking of pituitary adenomas improves hormonal control of acromegaly by somatostatin analogs. Eur J Endocrinol. (2005) 152:61–6. doi: 10.1530/eje.1.01824
Keywords: acromegaly, tumor consistency, magnetic resonance imaging, radiomics, ROC
Citation: Fan Y, Hua M, Mou A, Wu M, Liu X, Bao X, Wang R and Feng M (2019) Preoperative Noninvasive Radiomics Approach Predicts Tumor Consistency in Patients With Acromegaly: Development and Multicenter Prospective Validation. Front. Endocrinol. 10:403. doi: 10.3389/fendo.2019.00403
Received: 22 April 2019; Accepted: 06 June 2019;
Published: 28 June 2019.
Edited by:
Rosario Pivonello, University of Naples Federico II, ItalyReviewed by:
Leila Warszawski, Instituto Estadual de Diabetes e Endocrinologia Luiz Capriglione, BrazilHernan G. Valdes-Socin, University Hospital Center of Liège, Belgium
Copyright © 2019 Fan, Hua, Mou, Wu, Liu, Bao, Wang and Feng. This is an open-access article distributed under the terms of the Creative Commons Attribution License (CC BY). The use, distribution or reproduction in other forums is permitted, provided the original author(s) and the copyright owner(s) are credited and that the original publication in this journal is cited, in accordance with accepted academic practice. No use, distribution or reproduction is permitted which does not comply with these terms.
*Correspondence: Renzhi Wang, d2FuZ3J6QDEyNi5jb20=; Ming Feng, ZmVuZ21pbmdAcHVtY2guY247 cHVtY2hmZW5nbWluZ0AxNjMuY29t