 Hongyan Zhang1†Jingxian Ni2,3,4†
 Changshen Yu5†
 Yanan Wu2,3,4Jingyan Li1Jie Liu2,3,4Jun Tu2,3,4
 Xianjia Ning2,3,4*Qing He1*
 Jinghua Wang2,3,4*
- 1Department of Endocrinology and Metabolism, Tianjin Medical University General Hospital, Tianjin, China
- 2Department of Neurology, Tianjin Medical University General Hospital, Tianjin, China
- 3Department of Epidemiology, Tianjin Neurological Institute, Tianjin, China
- 4Key Laboratory of Post-Neuroinjury Neuro-Repair and Regeneration in Central Nervous System, Ministry of Education and Tianjin City, Tianjin Neurological Institute, Tianjin, China
- 5Department of Neurology, Tianjin Huanhu Hospital, Tianjin, China
Aims: The prevalence of diabetes mellitus (DM) among adults has reached epidemic proportions worldwide, including China. In China, sex-based differences in the prevalence and risk factors of DM may exist, particularly among low-income individuals. Thus, we assessed these differences in the prevalence of DM and its risk factors in a low-income Chinese population.
Materials and Methods: Residents aged ≥45 years without histories of strokes or cardiovascular disease were recruited for this study. Multivariate logistic regression analyses were performed to assess the association of risk factors with DM prevalence.
Results: This study included 3,725 participants (41.2%, men; 58.8%, women). The mean age of the women (61.12 years) was higher than that of the men (59.14 years, P < 0.001). There was no significant sex-based difference in DM prevalence (men, 14.1%; women, 14.5%). Overweight, obesity, high triglyceride levels, and hypertension were independent risk factors for DM in both sexes. However, high-density lipoprotein-cholesterol levels were negatively associated with DM risk among men [odds ratio (OR), 0.544; 95% confidence interval (CI), 0.355–0.833; P = 0.005]. Among women, advanced age and high low-density lipoprotein-cholesterol levels were independent risk factors for DM; there was a higher DM risk for women aged 55–74 years than for those aged 45–54 years; however, physical activity was associated with an increased risk of DM (OR, 1.705; 95% CI, 1.195–2.432; P = 0.003).
Conclusions: These findings suggest a crucial need to implement individualized blood pressure, weight, and lipid managements in low-income populations in China to reduce the burden of DM, especially among older women.
Introduction
Diabetes mellitus (DM) is rapidly becoming one of the most common non-communicable diseases worldwide (1), and its prevalence among adults has increased over the past few decades (2). The International Diabetes Federation estimated that 382 million people, worldwide, had DM in 2013; this number is expected to rise to 592 million by 2035, including an increase from 98.4 to 142.7 million people in China (3). The current estimate of the number of adults (aged >20 years) in China with DM is 92.4 million (including 60.7% of undiagnosed cases) (4). Between 2002 and 2020, the DM age-standardized mortality is projected to rise 1.1% among men and 1.3% among women. In 2002, DM was ranked as the eleventh leading cause of death, globally; it is projected to be seventh by 2030 (5). Additionally, DM is also a major cause of cardiovascular disease (CVD), chronic kidney disease, blindness, and amputations. As a result, between 2006 and 2015, the national income of China was estimated to have declined by $558 billion due to cardio- and cerebrovascular diseases and DM (6).
Numerous studies have demonstrated that conventional CVD risk factors, including age, sex, body mass index (BMI), blood pressure (BP), and dyslipidemia, are also associated with developing DM (4, 7–10). Sex-related differences in DM prevalence and associated risk factors were previously established (11–13). However, few studies have reported on sex-related differences in China, especially among low-income, poorly educated people.
In China, approximately half of the population lives in rural areas where incomes and educational attainment are low. These factors play decisive roles in increasing the burden of disease; thus, we assessed sex-related differences in DM prevalence and associated risk factors in a low-income population in rural China.
Patients and Methods
Study Population
The baseline investigation for this population-based cohort study was conducted between April 2014 and January 2015, as previously described (14–16). Briefly, the total study population included 14,251 individuals from 18 administrative villages. Approximately 95% of the participants were low-income farmers, with a 2014 per capita disposable income of <1,600 USD (17). All residents aged ≥45 years, without diagnosed CVD, were recruited into this study.
The study was approved by the medical research ethics committee at Tianjin Medical University General Hospital; written informed consent was obtained from each participant during recruitment.
Data Collection and Risk Factor Definitions
Pre-designed questionnaire surveys were administered, in person, by trained epidemiology researchers. Demographic information, e.g., name, sex, date of birth, and educational level, were obtained from existing records.
Individual and family medical histories, including hypertension, DM, stroke, transient ischemic attacks, and coronary heart disease, were obtained from medical records or according to participant self-reports.
Lifestyle information included cigarette smoking and alcohol consumption habits as well as physical activity levels and self-reported salt intake. Cigarette smoking was defined as smoking >1 cigarette/day for ≥1 year; participants were categorized as non-smokers, former smokers (stopped smoking for at least 6 months), and current smokers. Alcohol consumption was defined as drinking >500 g (equivalent to 17 oz) of alcohol/week for >1 year; participants were categorized as non-drinkers, former drinkers (temperance for ≥6 months), and current drinkers, both for men and for women. Physical activity was defined as being involved in a physical activity ≥5 days/week for ≥30 min/day. Self-reported salt intake was defined as mild, moderate, and according to self-reported salt intake; mild was defined as with the salt intake of <6 g/day, moderate was defined as with the salt intake of 6–12 g/day, and heavy was defined as with the salt intake of >12 g/day.
Physical Examinations and Measurements
Physical examinations, e.g., those of BP [systolic BP (SBP) and diastolic BP (DBP)], height, and weight, were performed at the local village clinic during the survey. The levels of fasting plasma glucose (FPG), total cholesterol (TC), triglycerides (TG), high-density lipoprotein cholesterol (HDL-C), and low-density lipoprotein cholesterol (LDL-C) were measured at the Ji County People's Hospital. Body mass index (BMI) was calculated as weight (kg) divided by the square of height (m2).
Hypertension was defined as SBP ≥140 mmHg, DBP ≥90 mmHg, or taking hypertension medications. DM was defined as an FPG level ≥7.0 mmol/L, a previous history of diagnosed diabetes, or having a prescription for insulin or oral antidiabetic drugs (18). Weight classifications were based on BMI (normal, 18.5–23.9 kg/m2; low-weight, <18.5 kg/m2; overweight, 24.0–27.9 kg/m2; obesity, ≥28.0 kg/m2) (19). Elevated blood lipids were defined as TC ≥ 6.22 mmol/L, TG ≥ 2.26 mmol/L, and LDL-C ≥ 4.14 mmol/L; low HDL-C was defined as <1.04 mmol/L (20).
Statistical Analyses
The participants were categorized into four age groups: 45–54, 55–64, 65–74, and ≥75 years. Educational levels were categorized into three groups: illiterate (no formal education), 1–6 years of education, and >6 years of education. Continuous variables are presented as means and standard deviations, with comparisons between two groups being conducted using Student's t-tests. Categorical variables are presented as numbers and frequencies; between-group comparisons were performed using chi-squared tests. Multiple linear regression analyses were used to evaluate the association of DM with factors showing statistical significance in the univariate analyses. The relationships are presented as odds ratios (ORs) with 95% confidence intervals (CIs); two-tailed P < 0.05 were considered statistically significant. SPSS for Windows (version 19.0; SPSS, Chicago, IL, USA) was used for the analyses.
Results
The participant selection process was previously described (14). Briefly, 4,012 of the 5,380 qualified residents were interviewed during the study period, yielding a 75% response rate. After excluding 223 residents with prior histories of CVD or strokes and 64 without FPG measurements, 3,725 individuals were ultimately included in the analyses.
Demographic Characteristics
In this study, males (mean age, 61.12 years) accounted for 41.2% (n = 1,536) of the participants; females (mean age, 59.14 years) accounted for 58.8% (n = 2,189) of the participants and were significantly younger than the men (P < 0.001). The men had a higher prevalence of hypertension, higher mean SBP and DBP values, and higher HDL-C levels (P < 0.05) than did the women. However, the frequencies of illiteracy and obesity were higher among women than among men; women were more likely to have elevated levels of TC, TG, and LDL-C (P < 0.05; Table 1).
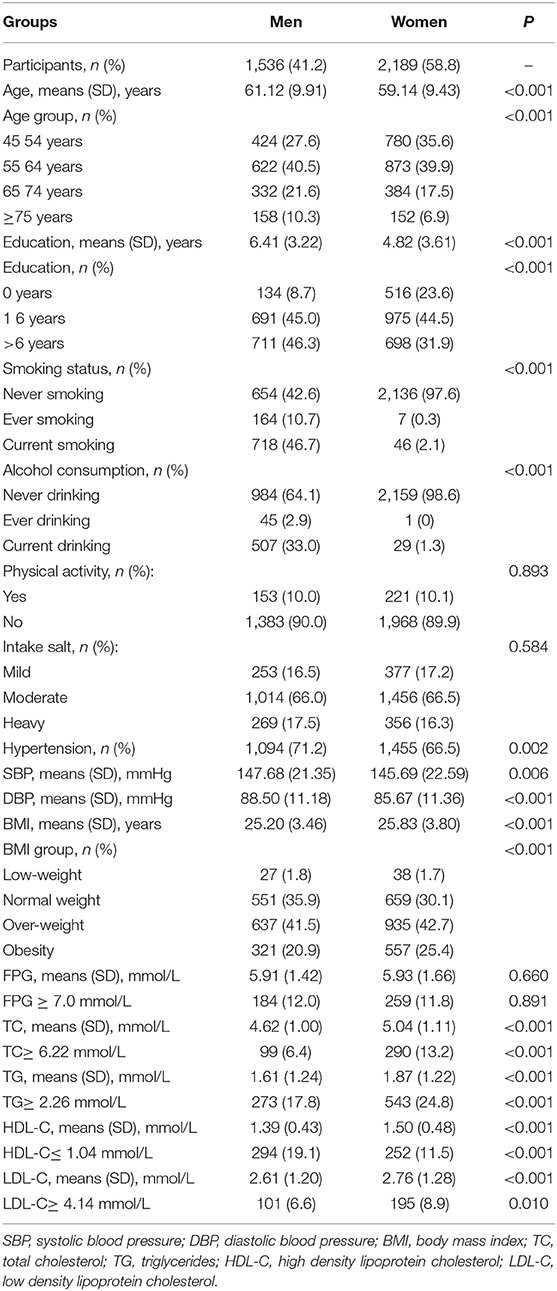
Table 1. Demographical characteristics for all participants in this study by gender.
Prevalence of DM
Table 2 displays the prevalence of DM among men and women in this study; the overall DM prevalence was 14.3%. Among men, the prevalence of DM increased with increasing BMI; the prevalence of DM was significantly higher among individuals with hypertension than among those with normal blood pressure. Moreover, the prevalence of DM among women increased with increasing age, education level, and BMI. There was a higher prevalence of DM among women with hypertension and those who were physically active.
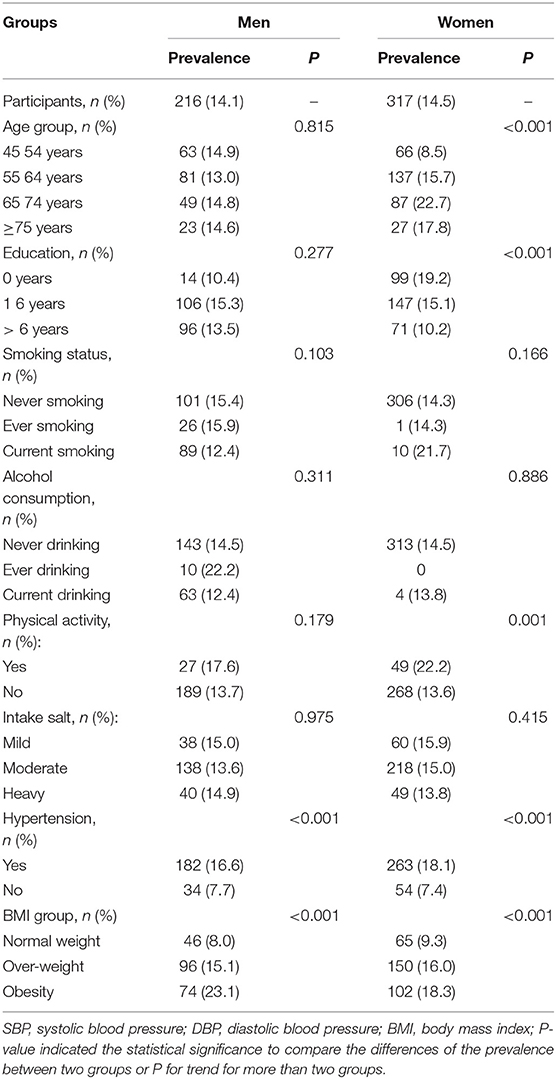
Table 2. The prevalence of DM for all participants in this study by gender.
Table 3 shows that men with DM had higher TG levels and lower HDL-C levels than did men without DM. Moreover, the levels of TC, TG, and LDL-C were significant higher among women with DM than among those without DM, but a converse trend was found for HDL-C levels.
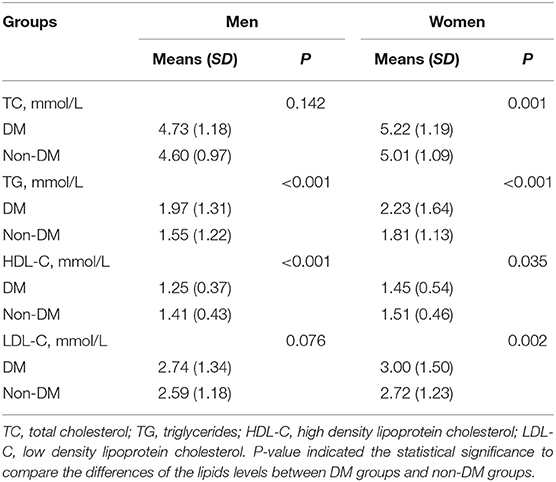
Table 3. Differences of the lipids levels among individuals with or without DM for all participants in this study by gender.
Sex-Based Differences in DM Risk Factors
In the multivariate analysis, overweight, obesity, hypertension, and high TG levels were independent risk factors for DM in both sexes. Compared with those having normal weights, the prevalence of DM was 59.4% higher among men who were overweight (OR, 1.594; 95% CI, 1.083–2.346; P = 0.001) and 125.0% higher among those who were obese (OR, 2.250; 95% CI, 1.462–3.461; P = 0.018). The prevalence of DM was also 115.5% higher among men with hypertension (P < 0.001) than among those with normal BPs; the prevalence of DM among men increased 11.8% with each 1 mmol/L elevation in the TG level (OR, 1.118; 95% CI, 1.010–1.238; P = 0.032). However, there was a negative association between HDL-C levels and DM prevalence (OR, 0.544; 95% CI, 0.355–0.833; P = 0.005; Table 4).
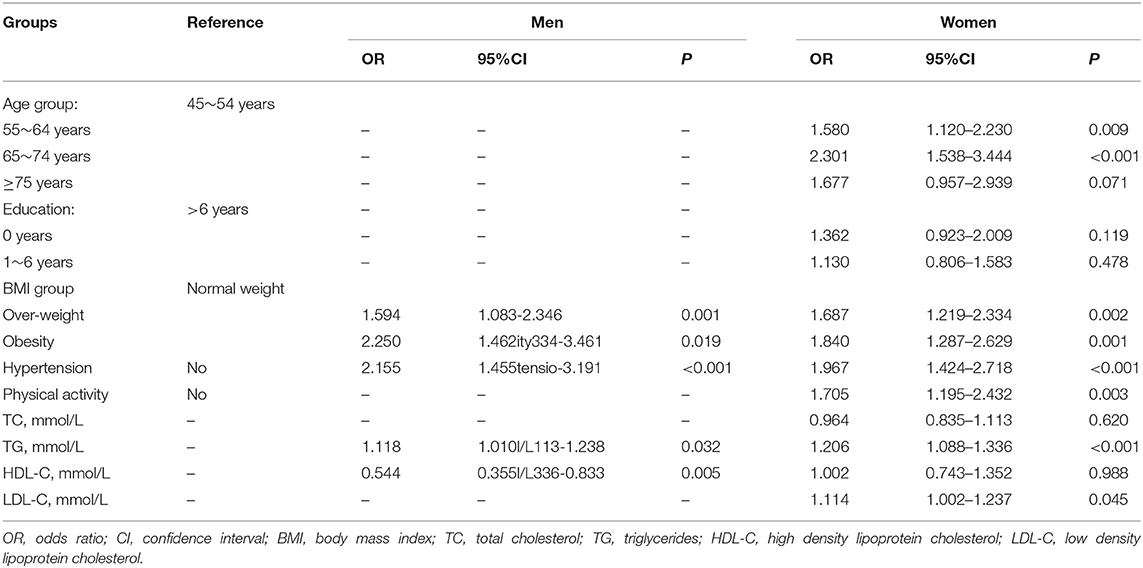
Table 4. Sex-based differences in associated factors of DM in the multivariate analyses.
Among women, old age was an independent risk factor associated with DM. Using the 45 to 54-year-old group as the reference group, there were higher prevalences of DM among those aged 55–64 years (OR, 1.580; 95% CI, 1.120–2.230; P = 0.009) and among those aged 65–74 years (OR, 2.301; 95% CI, 1.538–3.444; P < 0.001); this relationship disappeared for women ≥75 years (OR, 1.677; 95% CI, 0.957–2.939; P = 0.071). Similarly, women who were overweight (OR, 1.687; 95% CI, 1.219–2.334; P = 0.002), obese (OR, 1.840; 95% CI, 1.287–2.629; P = 0.001), had hypertension (OR, 1.967; 95% CI, 1.424–2.718; P < 0.001), or participated in physical activities (OR, 1.705; 95% CI, 1.195–2.432; P = 0.003) had elevated TG (OR, 1.206; 95% CI, 1.088–1.336; P < 0.001) and LDL-C (OR, 1.114; 95% CI, 1.002–1.237; P = 0.045) levels and demonstrated a higher DM prevalence than did their reference counterparts (Table 4).
Discussion
This is the first report describing sex-based differences in DM prevalence and its determinants in a low-income and poorly educated population in China. Overall, the observed prevalence of DM was 14.1% in men and 14.5% in women. Further, overweight, obesity, hypertension, and high TG levels were independent risk factors for DM in both sexes. Among men, a high HDL-C value was an independent protective factor for DM. Among women, advanced age, physical activity, and high LDL-C levels were additional independent risk factors of DM.
Over the last several decades, China has experienced a dramatic increase in the prevalence of DM, rising from 1% in 1980 (21) to 2.5% in 1994 (22), 2.6% in 2002 (23), 9.7% in 2008 (4), and 11.6% in 2010 (24). However, the sex-based differences in the DM prevalence have remained unknown. A recent meta-analysis showed that the pooled prevalence rates were 9.9% (95% CI, 8.8–11.0%) among men, and 11.6% (95% CI, 10.0–13.1%) among women (25). A male prevalence of DM was observed in a large nationwide survey in which the age-standardized prevalence of total DM (both previously diagnosed and undiagnosed diabetes) was 10.6% among men and 8.8% among women (4). However, other studies indicated a higher frequency of DM among women than among men when the individuals were grouped according to age, educational level, hypertension, and BMI (8). In the present study, a significant, sex-based difference in the prevalence of DM within this low-income population was not observed. Disparities in the various study designs and the criteria used to establish a DM diagnosis may partly explain these differences.
A positive association between advanced age and DM or FPG level has been confirmed in many studies (25–28). Since the 1970s, the prevalence of DM has been observed to increase rapidly with age, with an overall prevalence of 14.1% in Chinese people aged 65–74 years (25). A nationally representative, cross-sectional survey was conducted in 2013 in mainland China; 170,287 participants were included. In that study, the estimated overall prevalence of total diabetes was 10.9% (95% CI, 10.4–11.5%), including 10.2% (95% CI, 9.7–10.7%) among women and 11.7% (95% CI, 10.9–12.4%) among men (24). The prevalence of diabetes increased with age, with the prevalence in 40–49 years vs. ≥70 years of 7.7 vs. 16.7% (28), and 11.3 vs. 23.5% in China (24). Consistent with the previous studies, advanced age was independently associated with DM only among women in the present study. Compared to 45 to 54-year-old individuals, the prevalence of DM increased by 58.0% among 55 to 64-year-olds and by 130.1% among 65 to 74-year-olds. The higher risk for women and advanced age to develop DM may be attributed to sex-based differences in fat storage locations (29) and islet beta-cell dysfunction in elderly individuals (30).
Obesity is a major independent and modifiable risk factor for DM, and many epidemiological studies have suggested that the prevalence of DM is higher among obese individuals (31, 32). Further, a high BMI is a predictor of developing DM among individuals aged 65–96 years (33) and may be an important pathogenic factor associated with DM in the elderly (33–35). A prior study, involving 2,478 children and adolescents (3–18 years old), also found that a 1-standard deviation increase in BMI was associated with a 45% increase in DM risk among adults (36). In the present study, BMI was an independent risk factor associated with DM in both sexes. Compared to normal-weight individuals, the prevalence of DM increased by 59.4% among men and 68.7% among women for those who were overweight, and by 125.0 and 84%, respectively, for those who were obese. Thus, a national effort is recommended to prevent childhood obesity by improving education and social conditions in this demographic; without such interference, a significant number of these individuals will eventually develop obesity and diabetes in adulthood.
In a women's health study, the risk of developing DM was twice as high among individuals with hypertension than that among those with SBPs between 120 and 129 mmHg (4). In a cohort study, both SBP and DBP were associated with elevated risks of new-onset diabetes; the risk of developing DM increased by 58% following a 20-mmHg increase in SBP and by 52% following a 10-mmHg increase in DBP (37). However, among men, an association was not observed between baseline BP and the risk of developing DM, after adjusting for covariates (38). In the present study, hypertension was an independent risk factor for DM in both sexes, contributing to a 115.5% (men) or 96.7% (women) increase in the prevalence of DM, compared with normotensive individuals. Elevated BP may increase the risk of DM by inducing chronic inflammation and endothelial dysfunction (39–41). Thus, chronic inflammation may partly mediate the link between some risk factors (obesity and hypertension) and DM.
The relationship between hypertriglyceridemia and developing DM or an elevated FPG level was established in previous studies. Specifically, individuals with high TG, TC, and LDL-C levels and those with low HDL-C levels were more likely to develop DM (42–44). Every 10 mg/dL increase in TG level increases the risk of DM by 4% (45). In contrast, several prospective studies failed to find a relationship between TG levels and DM, after adjusting for conventional risk factors (46–48). The impact of dyslipidemia on incident DM may be mediated by the inhibition of insulin secretion or the development of insulin resistance (49, 50). In both sexes, in the present study, high TG levels were independent risk factors for DM; for each 1-mmol/L increase in the TG level, the risk of DM rose by 11.8% among men and 21.1% among women. Moreover, each 1-mmol/L increase in HDL-C level decreased the risk of DM by 46.6%, among men.
A significant inverse relationship between educational level and DM prevalence was documented in previous studies. Compared with individuals having ≥13 years of education, those with ≤6 years of education (OR, 2.10; 95% CI, 1.27–3.48) or with 7–12 years of education (OR, 1.62; 95% CI, 1.04–2.52) had higher risks of developing type 2 diabetes, after adjusting for age, sex, medical characteristics, lifestyle factors, and stress levels; the OR for women with ≤6 years of education was particularly high (OR, 10.16; 95% CI, 2.08–49.53), even after adjusting for covariates (12). However, a similar trend was not observed for men (51, 52). Similarly, an association between DM and educational level was not observed among either men or women in the current study population.
Previous studies have shown that increased physical activity and reduced calorie intake significantly decrease the incidence of type 2 DM (53–55). Physical activity, combined with dietary modifications, was recommended as an initial intervention for those with intermediate hyperglycemia and for those with type 2 DM (56). With rapid economic growth and the associated industrialization, urbanization, and lifestyle changes (high calorie, fat, sugar, and sodium diets as well as decreased physical activity), prediabetes and diabetes have reached epidemic proportions in the Chinese population. In a large, nationwide survey on the prevalence and control of DM in Chinese adults, physical activity was positively associated with a higher risk of prediabetes, but not with DM (24). Insufficient physical activity among rural people over 40 years old increases the risk of type 2 DM and metabolic syndrome (57). Inconsistent with these studies, in this cross-sectional study, physical activity was negatively associated with the risk of DM in women, but not in men. All participants in this study were from a low-income, poorly educated population; thus, poor health awareness may have reduced the physical activity initiatives before diagnosing DM. However, this is the cross-sectional study, not a cohort study; those individuals being diagnosed with DM would initiative participate in the physical activity after being diagnosed with DM. Thus, increased physical activity after diagnosed with DM may explain the negative association of physical activity with DM risk in this cross-sectional study.
Several studies have demonstrated that elevated the dietary salt intake associated with hypertension, BMI, and the risk of CVD death (58–61). However, we assessed the sex difference in association of the dietary salt intake with DM prevalence and risk factors using self-reported salt intake categories in the present study. There is no significant sex difference in DM prevalence among the different salt intake groups.
This study has several limitations. First, the study population was recruited from villages in Tianjin, China; therefore, the findings may not extend to the overall national population. Second, participants were only assessed for FPG levels; the absence of impaired glucose-tolerance testing or glycosylated hemoglobin data may have underestimated the risk of DM. Moreover, the reliance of the study on self-reported DM, in this poorly educated population, may have also underestimated the prevalence of DM. Furthermore, the self-reported salt intake in this low education population may impact the accurate evaluation of the association of salt intake with DM risk. Finally, socio-economic status and nutrition data were not collected due to the limited education of the target population, we only collected the information of dietary salt intake by categorized groups, but absence of quantitative analysis.
This report describes sex-based differences in DM prevalence and its determinants in a low-income, poorly educated population, in China. The observed prevalence of DM was 14.1% among men and 14.5% among women. Further, overweight, obesity, hypertension, and high TG levels were independent risk factors for DM in both sexes. Among men, a high HDL-C level was an independent protective factor for DM. Among women, advanced age, physical activity, and high LDL-C levels were additional independent risk factors of DM. These findings suggest a crucial need to implement individualized BP, weight, and lipid management among low-income populations, in China, to reduce the burden of DM, especially among older women.
Ethics Statement
The study was approved by the ethics committee for medical research at Tianjin Medical University General Hospital, and a written informed consent was obtained from each participant during recruitment.
Author Contributions
JW, XN, and QH were involved in conception, design, and data collection. HZ, JN, and CY were involved in manuscript drafting for this article. HZ, JN, CY, YW, JLi, JLiu, JT, XN, QH, and JW were involved in data collection and case diagnosis and confirmation for this article. JW and XN were involved in data analysis, data interpretation, and critical review for this article. All authors read and approved the final manuscript.
Conflict of Interest
The authors declare that the research was conducted in the absence of any commercial or financial relationships that could be construed as a potential conflict of interest.
Acknowledgments
We thank all participants of the Tianjin Brain Study and all local medical care professionals for their valuable contribution.
References
1. Shaw JE, Sicree RA, Zimmet PZ. Global estimates of the prevalence of diabetes for 2010 and 2030. Diabetes Res Clin Pract. (2010) 87:4–14. doi: 10.1016/j.diabres.2009.10.007
2. Whiting DR, Guariguata L, Weil C, Shaw J. IDF diabetes atlas: global estimates of the prevalence of diabetes for 2011 and 2030. Diabetes Res Clin Pract. (2011) 94:311–21. doi: 10.1016/j.diabres.2011.10.029
3. Guariguata L, Whiting DR, Hambleton I, Beagley J, Linnenkamp U, Shaw JE. Global estimates of diabetes prevalence for 2013 and projections for 2035. Diabetes Res Clin Pract. (2014) 103:137–49. doi: 10.1016/j.diabres.2013.11.002
4. Yang W, Lu J, Weng J, Jia W, Ji L, Xiao J, et al. Prevalence of diabetes among men and women in China. N Engl J Med. (2010) 362:1090–101. doi: 10.1056/NEJMoa0908292
5. Mathers CD, Loncar D. Projections of global mortality and burden of disease from 2002 to 2030. PLoS Med. (2006) 3:e442. doi: 10.1371/journal.pmed.0030442
6. World Health Organization. Preventing Chronic Diseases: A Vital Investment. Geneva: World Health Organization (2005).
7. Li S, Guo S, He F, Zhang M, He J, Yan Y, et al. Prevalence of diabetes mellitus and impaired fasting glucose, associated with risk factors in rural Kazakh adults in Xinjiang, China. Int J Environ Res Public Health. (2015) 12:554–65. doi: 10.3390/ijerph120100554
8. Duboz P, Chapuis-Lucciani N, Boëtsch G, Gueye L. Prevalence of diabetes and associated risk factors in a Senegalese urban (Dakar) population. Diabetes Metab. (2012) 38:332–6. doi: 10.1016/j.diabet.2012.02.011
9. Qi L, Feng L, Ding X, Mao D, Wang Y, Xiong H. Prevalence of diabetes and impaired fasting glucose among residents in the Three Gorges Reservoir Region, China. BMC Public Health. (2014) 14:1152. doi: 10.1186/1471-2458-14-1152
10. Weisman A, Fazli GS, Johns A, Booth GL. Evolving trends in the epidemiology, risk factors, and prevention of type 2 diabetes: a review. Can J Cardiol. (2018) 34:552–64. doi: 10.1016/j.cjca.2018.03.002
11. Arnetz L, Ekberg NR, Alvarsson M. Sex differences in type 2 diabetes: focus on disease course and outcomes. Diabetes Metab Syndr Obes. (2014) 7:409–20. doi: 10.2147/DMSO.S51301
12. Lee DS, Kim YJ, Han HR. Sex differences in the association between socio-economic status and type 2 diabetes: data from the 2005 Korean National Health and Nutritional Examination Survey (KNHANES). Public Health. (2013) 127:554–60. doi: 10.1016/j.puhe.2013.02.001
13. Mauvais-Jarvis F. Gender differences in glucose homeostasis and diabetes. Physiol Behav. (2018) 187:20–3. doi: 10.1016/j.physbeh.2017.08.016
14. Zhan C, Shi M, Yang Y, Pang H, Fei S, Bai L, et al. Prevalence and risk factors of carotid plaque among middle-aged and elderly adults in rural Tianjin, China. Sci Rep. (2016) 6:23870. doi: 10.1038/srep23870
15. Zhao W, Wu Y, Shi M, Bai L, Tu J, Guo Z, et al. Sex differences in prevalence of and risk factors for carotid plaque among adults: a population-based cross-sectional study in rural China. Sci Rep. (2016) 6:38618. doi: 10.1038/srep38618
16. Ren L, Shi M, Wu Y, Ni J, Bai L, Lu H, et al. Correlation between hypertension and common carotid artery intima-media thickness in rural China: a population based study. J Hum Hypertens. (2018) 32:548–54. doi: 10.1038/s41371-018-0074-x
17. National Bureau of Statistics of China. China Statistical Yearbook. Beijing: China Statistics Press (2015).
18. Diabetes branch of the Chinese Medical Association. China Guidelines for Type II Diabetes Mellitus. Beijing: Peking University Medical Press (2011).
19. Zhou B.F. Effect of body mass index on all-cause mortality and incidence of cardiovascular diseases–report for meta-analysis of prospective studies open optimal cut-off points of body mass index in Chinese adults. Biomed Environ Sci. (2002) 15:245–52. doi: 10.1016/S0006-3207(02)00045-9
20. The Joint Committee of Chinese Adult Dyslipidemia Prevention Guide. Guidelines on Prevention and Treatment of Dyslipidemia in Chinese Adults. Chin J Cardiol. (2007) 35:390–419. doi: 10.3760/j.issn:0253-3758.2007.05.003
21. National Diabetes Research Group. Diabetes mellitus survey of 300,000 in fourteen provinces and cities of China. Chin Med J. (1981) 20:678–81.
22. Pan XR, Yang WY, Li GW, Liu J National Diabetes Prevention and Control Cooperative Group. Prevalence of diabetes and its risk factors in China, 1994. Diabetes Care. (1997) 20:1664–9. doi: 10.2337/diacare.20.11.1664
23. Ministry of Public Health. Nutrition and Health status Among Chinese: Result from the Fourth China Nutrition and Health Survey. Beijing: Ministry of Public Health (2004).
24. Xu Y, Wang L, He J, Bi Y, Li M, Wang T, et al. Prevalence and control of diabetes in Chinese adults. JAMA. (2013) 310:948–59. doi: 10.1001/jama.2013.168118
25. Yang L, Shao J, Bian Y, Wu H, Shi L, Zeng L, et al. Prevalence of type 2 diabetes mellitus among inland residents in China (2000-2014): a meta-analysis. J Diabetes Investig. (2016) 7:845–52. doi: 10.1111/jdi.12514
26. Han C, Zhang M, Luo X, Wang C, Yin L, Pang C, et al. Secular trends in the prevalence of type 2 diabetes in adults in China from 1995 to 2014: a meta-analysis. J Diabetes. (2017) 9:450–61. doi: 10.1111/1753-0407.12440
27. Li H, Oldenburg B, Chamberlain C, O'Neil A, Xue B, Jolley D, et al. Diabetes prevalence and determinants in adults in China mainland from 2000 to 2010: a systematic review. Diabetes Res Clin Pract. (2012) 98:226–35. doi: 10.1016/j.diabres.2012.05.010
28. Zhang FL, Xing YQ, Guo ZN, Wu YH, Liu HY, Yang Y. Prevalence and risk factors for diabetes and impaired fasting glucose in Northeast China: results from the 2016 China National Stroke Screening Survey. Diabetes Res Clin Pract. (2018) 144:302–13. doi: 10.1016/j.diabres.2018.09.005
29. Logue J, Walker JJ, Colhoun HM, Leese GP, Lindsay RS, McKnight JA, et al. Do men develop type 2 diabetes at lower body mass indices than women? Diabetologia. (2011) 54:3003–6. doi: 10.1007/s00125-011-2313-3
30. Bryhni B, Arnesen E, Jenssen TG. Associations of age with serum insulin, proinsulin and the proinsulin-to-insulin ratio: a cross-sectional study. BMC Endocr Disord. (2010) 10:21. doi: 10.1186/1472-6823-10-21
31. Boffetta P, McLerran D, Chen Y, Inoue M, Sinha R, He J, et al. Body mass index and diabetes in Asia: a cross-sectional pooled analysis of 900,000 individuals in the Asia cohort consortium. PLoS ONE. (2011) 6:e19930. doi: 10.1371/journal.pone.0019930
32. Ma RC, Chan JC. Type 2 diabetes in East Asians: similarities and differences with populations in Europe and the United States. Ann NY Acad Sci. (2013) 1281:64–91. doi: 10.1111/nyas.12098
33. Olafsdottir E, Aspelund T, Sigurdsson G, Thorsson B, Benediktsson R, Harris TB, et al. Unfavourable risk factors for type 2 diabetes mellitus are already apparent more than a decade before onset in a population-based study of older persons: from the Age, Gene/Environment Susceptibility-Reykjavik Study (AGES-Reykjavik). Eur J Epidemiol. (2009) 24:307–14. doi: 10.1007/s10654-009-9343-x
34. Noale M, Maggi S, Marzari C, Limongi F, Gallina P, Bianchi D, et al. Components of the metabolic syndrome and incidence of diabetes in elderly Italians: the Italian Longitudinal Study on Aging. Atherosclerosis. (2006) 187:385–92. doi: 10.1016/j.atherosclerosis.2005.09.018
35. Nagaya T, Yoshida H, Takahashi H, Kawai M. Increases in body mass index, even within non-obese levels, raise the risk for type 2 diabetes mellitus: a follow-up study in a Japanese population. Diabet Med. (2005) 22:1107–11. doi: 10.1111/j.1464-5491.2005.01602.x
36. Sabin MA, Magnussen CG, Juonala M, Shield JP, Kähönen M, Lehtimäki T, et al. Insulin and BMI as predictors of adult type 2 diabetes mellitus. Pediatrics. (2015) 135:e144–51. doi: 10.1542/peds.2014-1534
37. Emdin CA, Anderson SG, Woodward M, Rahimi K. Usual Blood Pressure and Risk of New-Onset Diabetes: Evidence From 4.1 Million Adults and a Meta-Analysis of Prospective Studies. J Am Coll Cardiol. (2015) 66:1552–62. doi: 10.1016/j.jacc.2015.07.059
38. George KM, Selvin E, Pankow JS, Windham BG, Folsom AR. Sex differences in the association of diabetes with cardiovascular disease outcomes among African-American and White Participants in the Atherosclerosis Risk in Communities Study. Am J Epidemiol. (2017) 187:403–10. doi: 10.1093/aje/kwx324
39. Meigs JB, Hu FB, Rifai N, Manson JE. Biomarkers of endothelial dysfunction and risk of type 2 diabetes mellitus. JAMA. (2004) 291:1978–86. doi: 10.1001/jama.291.16.1978
40. Chamarthi B, Williams GH, Ricchiuti V, Srikumar N, Hopkins PN, Luther JM, et al. Inflammation and hypertension: the interplay of interleukin-6, dietary sodium, and therenin-angiotensin system in humans. Am J Hypertens. (2011) 24:1143–8. doi: 10.1038/ajh.2011.113
41. Interleukin-6 Receptor Mendelian Randomisation Analysis (IL6R MR) Consortium. The interleukin-6 receptor as a target for prevention of coronary heart disease: a mendelian randomization analysis. Lancet. (2012) 379:1214–24. doi: 10.1016/S0140-6736(12)60110-X
42. Grundy SM, Brewer HB Jr, Cleeman JI, Smith SC Jr, Lenfant C American Heart Association. Definition of metabolic syndrome: report of the National Heart, Lung, and Blood Institute/American Heart Association conference on scientific issues related to definition. Circulation. (2004) 109:433–8. doi: 10.1161/01.CIR.0000111245.75752.C6
43. Krauss RM. Lipids and lipoproteins in patients with Type 2 diabetes. Diabetes Care. (2004) 27:1496–504. doi: 10.2337/diacare.27.6.1496
44. Haffner SM, Mykkänen L, Festa A, Burke JP, Stern MP. Insulin-resistant prediabetic subjects have more atherogenic risk factors than insulin-sensitive prediabetic subjects: implications for preventing coronary heart disease during the prediabetic state. Circulation. (2000) 101:975–80. doi: 10.1161/01.CIR.101.9.975
45. Beshara A, Cohen E, Goldberg E, Lilos P, Garty M, Krause I. Triglyceride levels and risk of type 2 diabetes mellitus: a longitudinal large study. J Investig Med. (2016) 64:383–7. doi: 10.1136/jim-2015-000025
46. Von Eckardstein A, Schulte H, Assmann G. Risk for diabetes mellitus in middle aged Caucasian male participants of the PROCAM study: implications for the definition of impaired fasting glucose by the American Diabetes Association. Prospective Cardiovascular Münster. J Clin Endocrinol Metab. (2000) 85:3101–8. doi: 10.1210/jcem.85.9.6773
47. Ohlson LO, Larsson B, Björntorp P, Eriksson H, Svärdsudd K, Welin L, et al. Risk factors for type 2 diabetes mellitus. Thirteen and one half years of follow up of the participants in the study of the Swedish men born in 1913. Diabetologia. (1988) 31:798–805. doi: 10.1007/BF00277480
48. Charles MA, Fontbonne A, Thibult N, Warnet JM, Rosselin GE, Eschwege E. Risk factors for NIDDM in white population: Paris prospective study. Diabetes. (1991) 40:796–9. doi: 10.2337/diab.40.7.796
49. Simental-Mendia LE, Rodríguez-Morán M, Simental-Saucedo L, Guerrero-Romero F. Insulin secretion is increased in non-diabetic subjects with fasting hypertriglyceridemia. Diabetes Metab Res Rev. (2013) 29:214–9. doi: 10.1002/dmrr.2379
50. Svedberg J, Björntorp P, Lönnroth P, Smith U. Prevention of inhibitory effect of free fatty acids on insulin binding and action in isolated rat hepatocytes by etomoxir. Diabetes. (1991) 40:783–6. doi: 10.2337/diab.40.6.783
51. Icks A, Moebus S, Feuersenger A, Haastert B, Jöckel KH, Giani G. Type 2 diabetes prevalence and association with social status e widening of a social gradient? German national health surveys 1990-1992 and 1998. Diabetes Res Clin Pract. (2007) 78:293–7. doi: 10.1016/j.diabres.2007.04.005
52. López Suárez A, Elvira González J, Beltrán Robles M, Alwakil M, Saucedo JM, Bascuñana Quirell A, et al. Prevalence of obesity, diabetes, hypertension, hypercholesterolemia, and metabolic syndrome in over 50-year-olds in sanlúcar de barrameda, Spain. Rev Esp Cardiol. (2008) 61:1150–8. doi: 10.1157/13127846
53. Gong Q, Gregg EW, Wang J, An Y, Zhang P, Yang W, et al. Long-term effects of a randomised trial of a 6-year lifestyle intervention in impaired glucose tolerance on diabetes related microvascular complications: the China Da Qing Diabetes Prevention Outcome Study. Diabetologia. (2011) 54:300–7. doi: 10.1007/s00125-010-1948-9
54. Li G, Zhang P, Wang J, Gregg EW, Yang W, Gong Q, et al. The long-term effect of lifestyle interventions to prevent diabetes in the China Da Qing Diabetes Prevention Study: a 20-year follow-up study. Lancet. (2008) 371:1783–9. doi: 10.1016/S0140-6736(08)60766-7
55. Diabetes Prevention Program (DPP) Group. Metabolic syndrome components and their response to lifestyle and metformin interventions are associated with differences in diabetes risk in persons with impaired glucose tolerance. Diabetes Obes Metab. (2014) 16:326–33. doi: 10.1111/dom.12220
56. American Diabetes Association. Standards of medical care in diabetes— 2017: summary of revisions. Diabetes Care. (2017) 40(Suppl. 1):S4–5. doi: 10.2337/dc17-S003
57. Wang Q, Zhang X, Fang L, Guan Q, Gao L, Li Q. Physical activity patterns and risk of type 2 diabetes and metabolic syndrome in middle-agedand elderly Northern Chinese adults. J Diabetes Res. (2018) 2018:7198–274. doi: 10.1155/2018/7198274
58. Mill JG, Baldo MP, Molina MDCB, Schmidt MI, Barreto SM, Chor D, et al. Sex-specific patterns in the association between salt intake and blood pressure: the ELSA-Brasil study. J Clin Hypertens. (2019) 21:502–9. doi: 10.1111/jch.13509
59. Zhou L, Stamler J, Chan Q, Van Horn L, Daviglus ML, Dyer AR, et al. Salt intake and prevalence of overweight/obesity in Japan, China, the United Kingdom, and the United States: the INTERMAP Study. Am J Clin Nutr. (2019) 110: 34–40. doi: 10.1093/ajcn/nqz067
60. Aburto NJ, Ziolkovska A, Hooper L, Elliott P, Cappuccio FP, Meerpohl JJ. Effect of lower sodium intake on health: systematic review and meta–analyses. BMJ. (2013) 346:f1326. doi: 10.1136/bmj.f1326
61. GBD 2017 Risk Factor Collaborators. Global, regional, and national comparative risk assessment of 84 behavioural, environmental and occupational, and metabolic risks or clusters of risks for 195 countries and territories, 1990–2017: a systematic analysis for the Global Burden of Disease Study 2017. Lancet. (2018) 392:1923–94. doi: 10.1016/S0140-6736(18)32225-6
Keywords: sex differences, diabetes mellitus, prevalence, risk factors, epidemiology
Citation: Zhang H, Ni J, Yu C, Wu Y, Li J, Liu J, Tu J, Ning X, He Q and Wang J (2019) Sex-Based Differences in Diabetes Prevalence and Risk Factors: A Population-Based Cross-Sectional Study Among Low-Income Adults in China. Front. Endocrinol. 10:658. doi: 10.3389/fendo.2019.00658
Received: 15 September 2018; Accepted: 11 September 2019;
Published: 25 September 2019.
Edited by:
Mia Von Euler, Karolinska University Hospital, SwedenReviewed by:
Aaron Hanukoglu, Tel Aviv University, IsraelMargaret Udahogora, University of Maryland, United States
Copyright © 2019 Zhang, Ni, Yu, Wu, Li, Liu, Tu, Ning, He and Wang. This is an open-access article distributed under the terms of the Creative Commons Attribution License (CC BY). The use, distribution or reproduction in other forums is permitted, provided the original author(s) and the copyright owner(s) are credited and that the original publication in this journal is cited, in accordance with accepted academic practice. No use, distribution or reproduction is permitted which does not comply with these terms.
*Correspondence: Xianjia Ning, eGpuMDkwNkBnbWFpbC5jb20=; Qing He, aGVjaDY5QDE2My5jb20=; Jinghua Wang, amh3ODc5OUB5YWhvby5jb20=
†These authors have contributed equally to this work