 Tanya J. Compton1*
 Wanda Bodnar1
 Anita Koolhaas1
 Anne Dekinga1
 Sander Holthuijsen1Job ten Horn1
 Niamh McSweeney1
 Jan A. van Gils1Theunis Piersma1,2
- 1NIOZ Royal Netherlands Institute for Sea Research, Department of Coastal Systems and Utrecht University, Texel, Netherlands
- 2Conservation Ecology Group, Groningen Institute for Evolutionary Life Sciences, University of Groningen, Groningen, Netherlands
Behavior has a predictive power that is often underutilized as a tool for signaling ecological change. The burrowing behavior of the deposit feeding bivalve Macoma balthica reflects a typical food-safety trade-off. The choice to live close to the sediment surface comes at a risk of predation and is a decision made when predation danger, food intake rates or future fitness prospects are low. In parts of the Dutch Wadden Sea, Macoma populations declined by 90% in the late 1990s, in parallel with large-scale mechanical cockle-dredging activities. During this decline, the burrowing depth of Macoma became shallow and was correlated with the population decline in the following year, indicating that it forecasted population change. Recently, there has been a series of large recruitment events in Macoma. According to the food-safety trade-off, we expected that Macoma should now live deeper, and have a higher body condition. Indeed, we observed that Macoma now lives deeper and that living depth in a given year forecasted population growth in the next year, especially in individuals larger than 14 mm. As living depth and body condition were strongly correlated in individuals larger than 14 mm, larger Macoma could be living deeper to protect their reproductive assets. Our results confirmed that burrowing depth signals impending population change and, together with body condition, can provide an early warning signal of ecological change. We suggest that population recovery is being driven by improved intertidal habitat quality in the Dutch Wadden Sea, rather than by the proposed climate-change related effects. This shift in ecosystem state is suggested to include the recovery of diatom habitat in the top layer of the sediment after cockle-dredging ended.
Introduction
Terrestrial and marine environments are currently changing at unprecedented rates and scales (Vitousek et al., 1997; Halpern et al., 2008). Understanding how human induced changes affect animal populations is a continuous challenge, especially when the drivers of change follow indirect pathways and/or are undetectable (Wong and Candolin, 2014). For many animals, it is well known that behavioral changes can signal habitat alteration (Brown and Kotler, 2004; Kotler et al., 2007). This is because a change in behavior can relatively quickly improve the prospects of surviving and reproducing in changing habitats (Wong and Candolin, 2014). However, few studies have examined the capacity for behavioral indicators to forecast changes in population growth at the landscape scale (Lima and Zollner, 1996; van Gils et al., 2009).
In the Dutch Wadden Sea, as in most coastal systems of the human inhabited world, intertidal ecosystems have been affected by human induced perturbations (e.g., fisheries and climate change; Lotze et al., 2006; Eriksson et al., 2010; Wolff, 2013). One of the most dramatic changes in recent years in the Dutch Wadden Sea was the decline (~90%, from late 1990s to 2006) of the Baltic tellin, Tellinidae (Macoma balthica, Linnaeus, 1758; Piersma et al., 2001; van Gils et al., 2006; Kraan et al., 2007). Debate ensued as to why Macoma populations declined with competing ideas being: (1) negative effects of climate change on recruitment success, partially caused by climate-related changes in the temporal presence of crustacean predators of bivalve spat (Philippart et al., 2003; Beukema et al., 2009, 2014), and (2) adverse effects of large-scale mechanical cockle-dredging (Cerastoderma edule) on sediment characteristics and benthic communities (Piersma et al., 2001; Kraan et al., 2007), possibly affecting the feeding opportunities of Macoma (van Gils et al., 2009). As the debate went on, Macoma might have already signaled reasons for its decline. Specifically, Macoma lived shallow during the population crash period, but deep prior to the population decline (van Gils et al., 2009). Furthermore, population growth and living depth were correlated, which indicated that burrowing behavior could be used as a predictor of population change (van Gils et al., 2009).
Depending on its internal physiological state, an animal must decide whether to face the risk of predation and obtain a higher food intake, or evade predation risk and live on a lower food intake (Houston et al., 1993; McNamara and Houston, 1996). This is the so-called “food-safety trade-off” (Lima and Dill, 1990; Lima, 1998a,b). For burrowing bivalves, living shallow in the sediment is a “risky behavior,” as there is a greater risk of being caught by predators (Zwarts et al., 1992; Zaklan and Ydenberg, 1997). However, as shallow living is associated with a higher food intake, when body condition is low this is a risk worth taking (Zwarts, 1986; Lin and Hines, 1994; Zwarts et al., 1994). Conversely, living deeper is “safer” (Zwarts and Wanink, 1989) but comes at the cost of a lower food intake (Lin and Hines, 1994; de Goeij and Luttikhuizen, 1998). Furthermore, as the marginal value of energy for animals in a good body condition is low (Brown and Kotler, 2004), individuals with more energy stores should choose for safety and have a lower intake rate, a principle called the “asset protection principle” (Clark, 1993). Based on the asset protection principle, the collective behavior of many individuals should reflect the future prospects of the population like population growth (van Gils et al., 2009).
In recent years, Macoma has started to recover across the Dutch Wadden Sea (Compton et al., 2013). This gives us an opportunity to verify and extend the ideas presented by van Gils et al. (2009). Here we analyze 17-years of data, based on a spatially extensive and consistent sampling design over summer, to examine whether Macoma's depth of living is a trait signaling ecological change. We expected that Macoma should be living deeper compared with the period of population decline and that this should be correlated with yearly population growth estimates in all 17-years. An association between deeper living and a higher body condition would confirm that Macoma protects its future reproductive assets. We will explore whether living depth can be used to forecast ecological change.
Materials and Methods
Sampling of Macoma was carried out across 14775 ha of intertidal flats in the western Dutch Wadden Sea (53°10′–53°20′N, 4°50′–5°30′E, Figure 1) in the summer months of June-August from 1997 to 2014. Over these 17-years, sampling was conducted using a grid-based sampling design (Figure 1, 500-m distance-grid). To estimate the population parameters of Macoma balthica, the same sampling stations that were revisited annually were used (see Table 1, van Gils et al., 2009; Compton et al., 2013). A grid-based sampling design provides a high statistical power for accurately determining species abundances (van der Meer, 1997; Bijleveld et al., 2012). Sampling was conducted over a period of 3 months and sampling stations were not revisited in the same order each year.
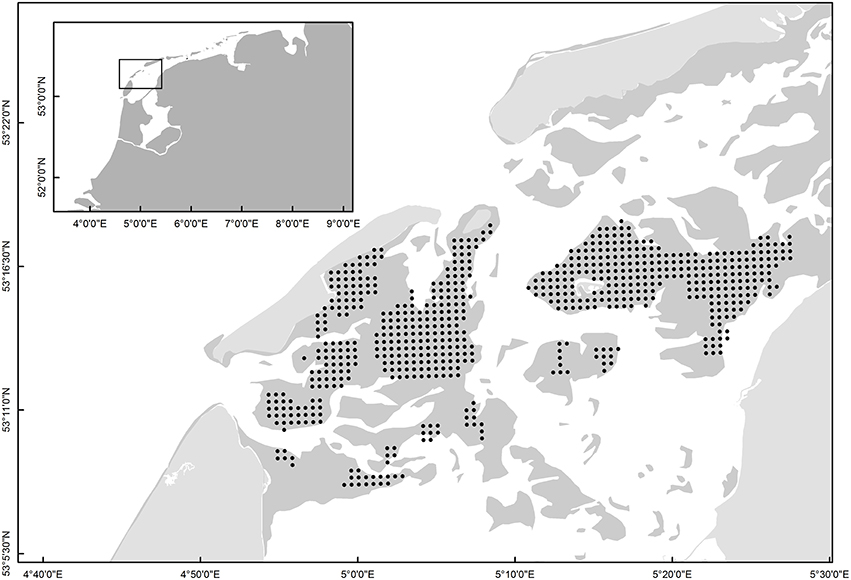
Figure 1. The grid-based sampling stations that were revisited each year from 1997 to 2014 (black dots). The dark gray shading indicates the intertidal mudflats. The inset shows the location of the sampling stations within the context of the Wadden Sea and The Netherlands.
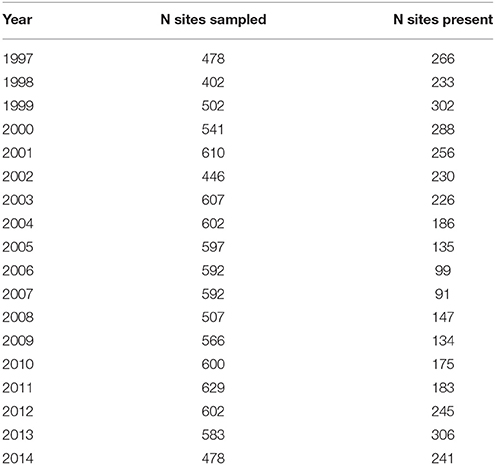
Table 1. The number of sites sampled (N sites sampled) and the occurrences of Macoma at these sites (N sites present) during the 17-years of sampling.
At each sample station, samples were taken using a benthic sediment core (total area sampled at each point: 0.0177 m2 by foot and 0.0174 m2 by boat). To estimate the living depth of Macoma, each sediment sample was partitioned into a top (4 cm) and bottom fraction (maximum depth of 30 cm) before sieving the sediments (1 mm sieve) and counting the Macoma in each fraction. The division of the core is based on the knowledge that the main shorebird predators of Macoma can only probe up to ~4 cm in depth (Zwarts and Wanink, 1989, 1991; Zwarts and Blomert, 1992). All samples were brought back to the laboratory for further analysis.
In the laboratory, Macoma were recounted, measured, and weighed. After measuring the shell length of Macoma (~0.1 mm accuracy), body condition of each individual was estimated by separating the body flesh from the shell, and placing the flesh into a crucible and drying it for 48 h. Once the flesh was dried, the crucibles with the dried flesh were placed into a desiccator to cool and then weighed to the nearest 0.1 mg. These crucibles were then placed into an incinerator where they were burnt at 560°C for 5 h. After burning, the crucibles with the ashed flesh were cooled in a desiccator and then weighed. The flesh ash-free dry mass (AFDMflesh) of an individual Macoma was determined by subtracting the flesh dry mass from the flesh ash mass. With the laboratory work for 2014 not yet finished, we used the fraction of Macoma living in the top part as assessed in the field, separately for two size classes, i.e., small (<10 mm) and large individuals (≥10 mm).
Analysis
To examine how the densities of adults and recruits changed over time, we described the stock-recruitment relationship. The shell length of the recruits was defined based on an examination of a subset of aged Macoma in this area. Macoma can be aged by counting growth rings on the shell (Lammens, 1967; Cardoso et al., 2007). Based on the subset of aged Macoma, we observed that new recruits, i.e., bivalves with no growth ring, were consistently smaller than 10 mm in length. We thus defined recruits, in yeart+1, as individuals with a shell length smaller than 10 mm. Recruits were defined based on visual inspection in 2014. Stock densities in yeart were estimated by excluding the recruits from the data (shells <10 mm), and densities of the recruits in yeart+1 were estimated by excluding the stock (shells ≥ 10 mm) from the data. In the cases when either recruits or stock were excluded and nothing was observed, these samples were included in the density calculations as absences. Also note that the stock-recruitment relationship stayed the same even when maximum recruitment sizes were 6, 8, or 10 mm.
To describe the trends in the population growth of Macoma, we examined changes in the per capita population growth rate (r), which describes the magnitude and direction of population change for a given time period, as a fraction of the initial population. It provides an integral measure of growth and mortality processes in a population (Sibly et al., 2003). For all shell lengths of Macoma, population growth rates (r) were calculated by dividing the annual average density (D) in yeart+1 by the annual average density (D) in yeart and then log-transforming this ratio:
To examine the depth of living in Macoma, the fraction in top was estimated by dividing the density of Macoma in the top 4 cm (Dtop) by the total density of Macoma (in top and bottom) at each sampling station for a specific size range of Macoma at sites where this information was recorded:
Although, it is known that Macoma larger than 10 mm and smaller than ~18–20 mm do not differ in living depth over the summer period (Zwarts and Wanink, 1991, P. de Goeij pers. comm.), we first examined how living depth changed across all shell lengths of Macoma over the course of the 17-years of data collection (see Appendix 1 in Supplementary Material). Based on the results of Appendix 1 in Supplementary Material, we opted to do our calculations on three size groups of Macoma: (1) 10–18 mm, (2) 10–14 mm, and (3) 14–18 mm. For the year 2014, we used the Macoma greater than 10 mm in all three size groupings. Macoma smaller than 10 mm were excluded, as they cannot live deep due to physical limits set by their siphon length (see Appendix 1 in Supplementary Material). As larger individuals (>18 mm) are known to have a higher incidence rate of parasite infection relative to smaller Macoma (Swennen and Ching, 1974; Pekkarinen, 1984; Edelaar et al., 2003), they often live closer to the sediment surface due to a low body condition associated with parasitism (see Appendix 1 in Supplementary Material and P. de Goeij pers. comm.). Thus, we excluded individuals above 18 mm from the analyses. For each of these size ranges, changes in living depth were described by calculating the annual average fraction of Macoma living in the top 4 cm of the sediment.
The relative body condition in Macoma was estimated by calculating the body mass index (BMI) of each individual. The body mass index (BMI) was defined as the flesh ash-free dry mass (AFDM, mg)/shell length3 (cm3).
To deal with dependencies in the data, e.g., spatial autocorrelation, we ran all of the above calculations using a bootstrap sampling approach. Bootstrap sampling uses sampling with replacement to generate a sampling distribution of an estimate (Davison and Hinkley, 1997). Here, we randomly subsampled the data, with replacement, 1000 times. From this subsample we estimated the mean annual population growth, depth of living and body condition. The 1000-bootstrap estimates were used to estimate 95% confidence intervals in the representations of the trends over time. The confidence intervals were defined based on the percentile method (Davison and Hinkley, 1997). In estimating population growth, we subsampled 200 stations per bootstrap (~50% of all stations visited). In the case of living depth, 10 stations were sampled for each bootstrap and for body condition 40 individuals were sampled per bootstrap.
To estimate whether mean annual population growth rate and mean annual depth of living were correlated in the three size groups, we ran linear regressions using (a) the raw data and (b) the bootstrapped estimates of mean population growth and mean depth of living. Regressions between the bootstrapped estimates provided a level of confidence in this fitted relationship by providing frequency distributions of the (1) slope magnitude and direction and (2) fit of the estimates, i.e., R2. The same procedure was followed for the association between mean depth of living and mean body condition in the years 1997–2013 for the three size groups. The percentage of times that the regressions were significant was calculated from the number of times the p-value fell below 0.05 in the 1000 bootstraps. The residuals of these regressions were checked, but there were no patterns suggesting dependencies or missing covariates.
All analyses were carried out in R (version 3.0.3, R Core Team, 2014) within R Studio (version 0.98.932). The package ggplot2 was used to create Appendix 1 in Supplementary Material (Wickham, 2009).
Results
Densities of Macoma in the western Wadden Sea declined from ~200 n/m2 in 1998 to 25 n/m2 in 2011 (Figure 2A). During this period, recruitment also remained low (Figure 2B). In the years 2012 to 2014, mean annual recruit densities increased up to 264 n/m2 due to an influx of recruits. Notably, these recruitment events were not associated with higher adult densities, as adult densities were low from 2011 to 2013 (Figure 2B, <30 n/m2).
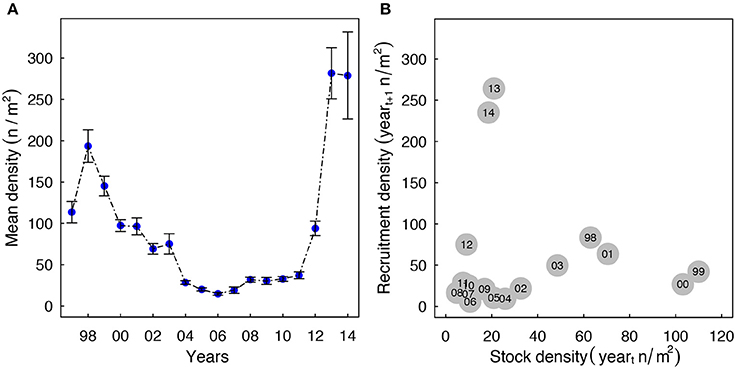
Figure 2. (A) Changes in the annual average density of Macoma over the last 17-years. The bars indicate standard errors. (B) The association between annual average recruitment density in yeart+1 (length < 10 mm) and adult density in yeart (length ≥ 10 mm). The recruitment years (yeart+1) are annotated in the circles.
The annual average estimates of population growth, and their bootstrapped confidence intervals, showed that from 1997–2005 population growth in yeart was negative or constant (r = 0, Figure 3A, see Appendix 2 in Supplementary Material for size range 10–18 mm), but that since 2006 population growth turned mainly positive (r > 0). The bootstrap confidence intervals showed that the overall changes in Macoma's population growth remained consistent even when 50% of the sampling stations were randomly selected.
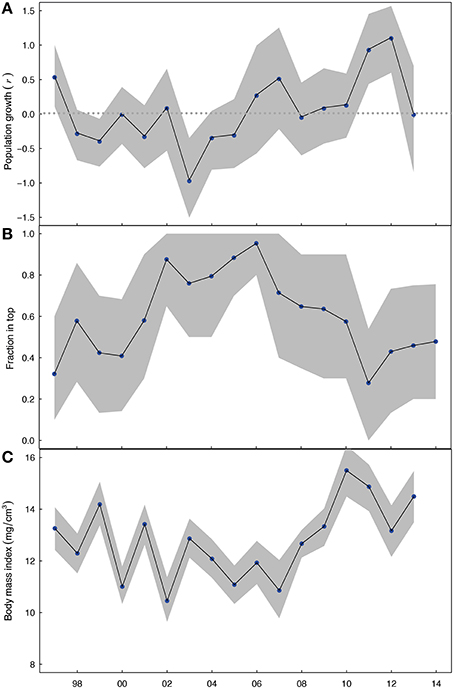
Figure 3. (A) Population growth rate r of the Macoma population from yeart to yeart+1, plotted on yeart, where the horizontal line indicates a stable population. (B) The depth of living as expressed by the fraction in top (<4 cm sediment layer, in yeart for lengths 14–18 mm), and (C) the body mass index of Macoma for the shell lengths of 14–18 mm in yeart. The dots indicate the annual average mean and the grey shading indicate standard error bars. Yeart is displayed on the x-axis.
Over the 17-years of this study, it appears that irrespective of shell length the fraction of shells in top, for shells larger than 10 mm, followed a trend over time (Appendix 1 in Supplementary Material). We observed that Macoma's living depth changed in a unimodal way over time across all three defined age groups. Specifically, the annual fraction of Macoma living in the top was initially low from 1997 to 2000 (fraction: 0.4–0.5), then became high from 2001 to 2006 (fraction: 0.8–0.9) and then started to decline after 2006 (fraction: <0.75; Figure 3B; see Appendix 2 in Supplementary Material for size range 10–18 mm). The body mass index of Macoma was variable over time, but with a trend for the body mass index to be initially high and variable from 1997 to 2000 (BMI: ~13), then variable but generally becoming lower from 2001 to 2007 (BMI: ~11) and then increasing from 2007 (BMI: >13) (Figure 3C, see Appendix 2 in Supplementary Material for size range 10–18 mm). Bootstrapped confidence intervals, estimated based on random subsamples of the data, showed that these trends in living depth and body mass index were not due to spatial dependencies in the data.
There was a negative correlation between population growth of Macoma and the fraction living in the top for all size groups not only for the raw data (Figure 4A 14–18 mm, Table 2, see Appendix 3 in Supplementary Material for size range 10–18 mm), but also for the majority of correlations based on the bootstrapped data (Table 3 all size groups). However, the fit of this relationship was weak for the raw data for all three groups (R2 < 0.2, Table 2), with low R2 values for the correlations based on the bootstrapped data (Table 3, <5% of the correlations had an R2 of 0.3). There was a weak correlation (p = 0.09) for the size group of 14–18 mm between population growth and fraction in the top, but not for the other two size groups (Table 2). The larger size group had the highest percentage of significant correlations (~13%, Table 3), whereas in the other two size groupings the correlations of the bootstrapped data were less often significant (~5% of cases, Table 3).
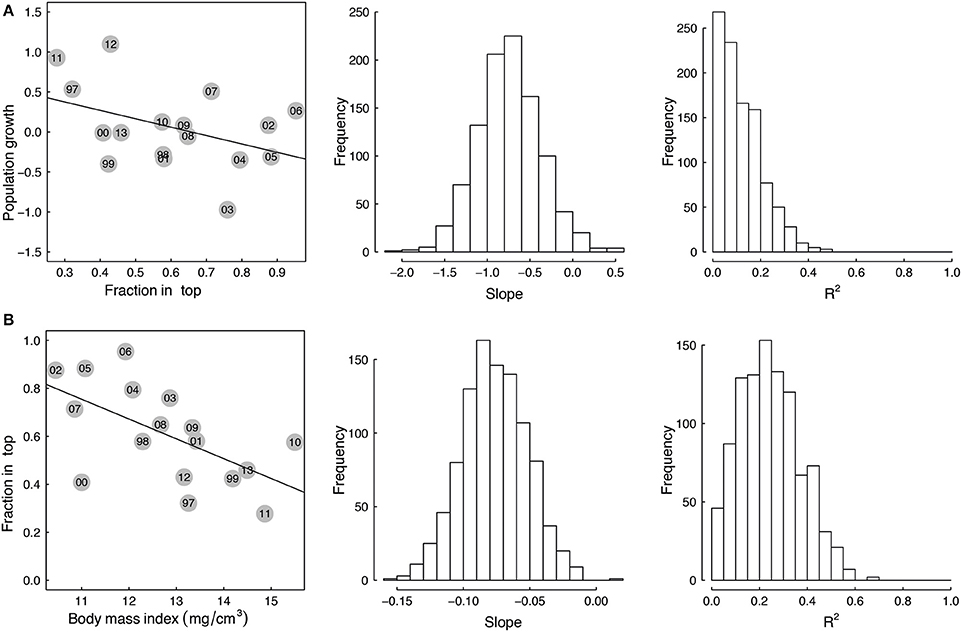
Figure 4. Correlations between (A) population growth of the Macoma population from yeart to yeart+1 and depth of living top in yeart(fraction in top) and (B) the depth of living in yeart (fraction in top) and body mass index in yeart for the shell lengths from 14 to 18 mm. Dots indicate the annual average mean. Yeart is annotated in the circles. The adjacent histograms provide the range of slope and R2 values obtained when the stations are subsampled and these correlations of (A,B) are examined 1000 times.
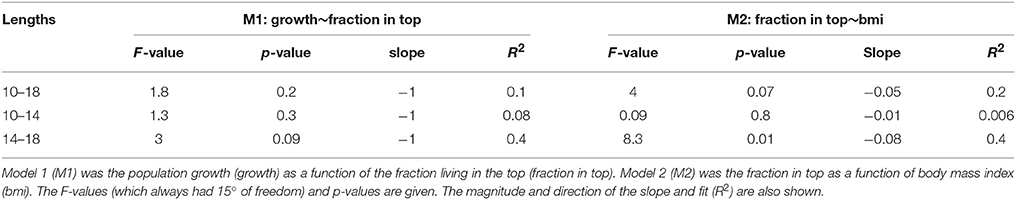
Table 2. The model results from the three size groupings (lengths in mm) of Macoma.
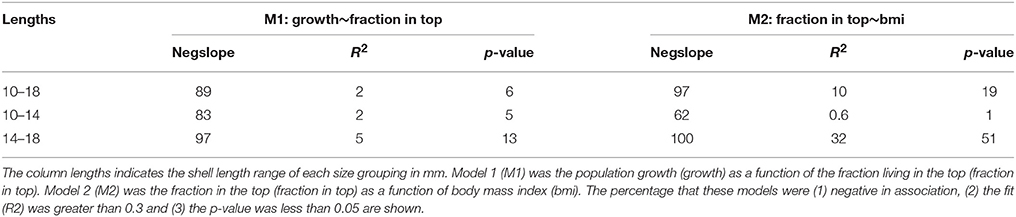
Table 3. The percentage outcomes from the bootstrapped linear regression models for the three size grouping of Macoma (n = 1000).
The correlation between the mean annual fraction of Macoma living in the top and mean annual body mass index was negatively correlated for all three size groupings for the raw data, as well as the majority of correlations based on the bootstrapped data (Figure 4B 14–18 mm, Table 2 all size groups). The fit of this relationship was best for the larger size group (14–18 mm, R2 = 0.4, Table 2), and was weak for the smaller size group (10–14 mm, R2 = 0.006, Table 2). Correlations of the bootstrapped data also showed that the R2 of the larger size group was stronger (32% with R2 < 0.3, Table 3) than for the smaller size group (0.6% with R2 < 0.3, Table 3). The correlation between the mean annual fraction of Macoma living in the top and mean annual body mass index was significant for the larger size group, and almost significant for all sizes, and not significant for the smaller size group based on the raw data (10–14 mm, Table 2). The percentage of times that this correlation was significant, based on the bootstrapped data, was also highest for the largest size group (Table 3).
Discussion
The return to positive population growth in Macoma was associated with recent large recruitment events from 2012 to 2014. Coincidentally, Philippart et al. (2014) reported an increased probability of encountering Macoma larvae in the water layer from 2011 to 2012 compared to the years of 2006 to 2010. The observation of relatively large recruitment events in a continually warming Wadden Sea (Beukema et al., 2014, Appendix 4 in Supplementary Material) contradicts the current idea that a warming Wadden Sea and the associated epibenthic predator increases are driving recruitment failure in Macoma (Philippart et al., 2003; Beukema et al., 2009, 2014). A factor known to be associated with higher recruitment in Macoma is cold winter temperatures (Beukema et al., 1998). However, average mean winter temperatures in the years of higher recruitment (2011 ~4.8°C, 2012 ~5°C, 2013 ~5°C) were no different to the years prior to this (1997–2010 of ~5°C, Appendix 4 in Supplementary Material). Higher adult densities were also not the main factor driving higher recruitment, as there was no apparent relationship between the densities of adults and recruits. The lack of a single and simple association between recruitment success and adult density has previously been observed in other studies (van der Meer et al., 2001; Andresen, 2013). A full understanding of the factors driving recruitment success in Macoma clearly needs more work.
Changes in the living depth of Macoma over the study period could not be explained by changes in the densities of Macoma's main shorebird predator, red knots Calidris canutus. Although, red knot numbers have declined (van Roomen et al., 2005; Laursen et al., 2010; Wolff et al., 2010), the densities of red knots per unit suitable foraging area remained constant at 10 knots/ha of suitable foraging area from 1996 to 2005 in our study area (Kraan et al., 2009). Flatfish are also known to affect living depth of Macoma via the foraging on siphons (de Vlas, 1981; de Goeij et al., 2001; Meyer and Byers, 2004). However, as there has been a dramatic decline in flatfish since the 1980s (van der Veer et al., 2011), and siphon nipping occurs mainly in spring (de Goeij, 2001), whereas our sampling was conducted over summer, siphon nipping is unlikely to be the cause for the living depth changes in Macoma. Increased parasitism is also unsupported as another cause for the change in living depth. Space and energy consuming macroparasites were only found in ~10% of Macoma in the Wadden Sea in 2004 (H. Andresen unpub. data), a year when Macoma was in steep population decline, and also in 2014 (D. Thieltges pers. comm.) when the densities of Macoma were highest. Finally, changes in living depth cannot be explained by spatial or temporal (monthly) autocorrelation, as we have randomized our data such that this signal would disappear if these factors were contributing to the changes in living depth each year.
In larger Macoma (>14 mm) we observed an increase in body condition over time. As body mass prior to spawning is correlated with numbers of eggs produced, and larger Macoma individuals produce more eggs than smaller individuals (Honkoop and van der Meer, 1998; Beukema et al., 2009), our results are consistent with the idea that the reproductive potential of larger Macoma has improved in recent years. Interestingly, it has also been observed that larger adult Macoma suffered lower mortalities from 2006 to 2010 in the Balgzand area (Drent et al., 2008) compared to relatively higher mortalities from 1998 to ~2005 (Beukema et al., 2009).
The significant correlation between depth of living and body condition in large Macoma, and our knowledge of the food-safety trade-off in burrowing bivalves, suggests that the observed changes in living depth over time are associated with a change in food intake by Macoma. Macoma is a facultative deposit feeder that suspension and deposit feeds (Kamermans, 1994; Rossi et al., 2004), probably in relation to its depth of living (de Goeij and Luttikhuizen, 1998). Although, the measure of average phytoplankton in the water column (chlorophyll-a) has remained constant and variable from 1977 to 2009 (Philippart et al., 2003; Beukema and Dekker, 2014), diatom or epiphytobenthos abundances on the sediment surface have not been measured over time. However, it is known that continual dredging at the same spot by fisheries disturbs the sediment surface, and thus destroys diatom mats, and increases turbidity and sediment resuspension (Mercado-Allen and Goldberg, 2011). Thus, as Macoma co-occurs with the fished cockle species in our study area (Kraan et al., 2007), and we here observed that Macoma's behavioral change overlapped closely with the end of mechanical cockle-dredging (in 2004, van Gils et al., 2006), we suspect that the benthic diatom community was negatively influenced not only in the fished areas but also the neighboring areas during the time of cockle-dredging.
The living depths of Macoma in yeart and population growth between yeart and yeart+1 were correlated over time, such that a high per capita population growth rate was associated with deeper living, a correlation that was strongest in large Macoma. These results thus build on those of van Gils et al. (2009) and showed that Macoma can now make the decision to live deeper at the cost of a lower food intake to protect its future reproductive potential. We propose that the depth of living (and the body condition) of Macoma have signaled a state change (sensu Scheffer et al., 2001) in the intertidal ecosystem of the Dutch Wadden Sea since the termination of mechanical cockle-dredging.
Conclusion
We here show that living depth in Macoma signals subsequent population changes in the western Dutch Wadden Sea, and is correlated with adult condition (enhanced reproductive output) and settlement success of the surviving juveniles. Consequently, we conclude that Macoma's burrowing behavior is an important signaling trait that is a first response when habitat conditions are altered and populations have yet to recover. We hypothesize that after the termination of cockle-dredging the intertidal ecosystem of the western Dutch Wadden Sea shifted back to a state amenable to Macoma. We propose that the messages carried by state-dependent behaviors such as burrowing depth in bivalves should receive more scrutiny as they signal ecosystem changes, whereas densities do not. We here suggest that ecosystem managers can use Macoma's burrowing behavior as an instrument to forecast ecosystem change.
Author Contributions
TC and WB ran the statistical analyses and wrote the paper with TP and JvG. AD, SH, JtH, and NM were responsible for the data collection and laboratory analysis, whereas AK was responsible for data management. All authors contributed to the content of the paper.
Conflict of Interest Statement
The authors declare that the research was conducted in the absence of any commercial or financial relationships that could be construed as a potential conflict of interest.
Acknowledgments
Sampling on such an extensive scale would have been impossible without the crew of the RV Navicula. We thank numerous volunteers and colleagues that have worked on this project. We acknowledge Casper Kraan for his involvement in the collection and organization of early data. The project Waddensleutels (funding by Waddenfonds, awarded to Han Olff and TP) made it possible for WB to contribute. JvG was funded by an NWO-VIDI grant (ALW 864.09.002) and TP and AD by the project Metawad (funding by Waddenfonds, WF 209925). Data collection started as part of the NWO-PIONIER project awarded to TP, with the continued sampling funded by NIOZ, NAM and the NWO ZKO grant. We thank Henk van der Veer, Gábor Zsolt Szabó and Micha Rijkenberg for valuable comments on previous drafts, and two anonymous reviewers for further useful comments.
Supplementary Material
The Supplementary Material for this article can be found online at: http://journal.frontiersin.org/article/10.3389/fevo.2016.00019
References
Andresen, H. (2013). Size-Dependent Predation Risk for Young Bivalves. Amsterdam: Vrije Universiteit.
Beukema, J. J., Cadée, G. C., Dekker, R., and Philippart, C. J. M. (2014). Annual and spatial variability in gains of body weight in Macoma balthica (L.): relationships with food supply and water temperature. J. Exp. Mar. Biol. Ecol. 457, 105–112. doi: 10.1016/j.jembe.2014.04.003
Beukema, J. J., and Dekker, R. (2014). Variability in predator abundance links winter temperatures and bivalve recruitment: correlative evidence from long-term data in a tidal flat. Mar. Ecol. Prog. Ser. 513, 1–15. doi: 10.3354/meps10978
Beukema, J. J., Dekker, R., and Jansen, J. M. (2009). Some like it cold: populations of the tellinid bivalve Macoma balthica (L.) suffer in various ways from a warming climate. Mar. Ecol. Prog. Ser. 384, 135–145. doi: 10.3354/meps07952
Beukema, J. J., Honkoop, P. J. C., and Dekker, R. (1998). Recruitment in Macoma balthica after mild and cold winters and its possible control by egg production and shrimp predation. Hydrobiologia 375/376, 23–34.
Bijleveld, A. I., van Gils, J. A., van der Meer, J., Dekinga, A., Kraan, C., van der Veer, H. W., et al. (2012). Designing a benthic monitoring programme with multiple conflicting objectives. Methods Ecol. Evol. 3, 526–536. doi: 10.1111/j.2041-210X.2012.00192.x
Brown, J. S., and Kotler, B. P. (2004). Hazardous duty pay and the foraging cost of predation. Ecol. Lett. 7, 999–1014. doi: 10.1111/j.1461-0248.2004.00661.x
Cardoso, J. F. M. F., Witte, J. I. J., and van der Veer, H. W. (2007). Habitat related growth and reproductive investment in estuarine waters, illustrated for the tellinid bivalve Macoma balthica (L.) in the western Dutch Wadden Sea. Mar. Biol. 152, 1271–1282. doi: 10.1007/s00227-007-0774-1
Clark, C. W. (1993). Antipredator behaviour and the asset-protection principle. Behav. Ecol. 5, 159–170.
Compton, T. J., Holthuijsen, S., Koolhaas, A., Dekinga, A., ten Horn, J., Smith, J., et al. (2013). Distinctly variable mudscapes: distribution gradients of intertidal macrofauna across the Dutch Wadden Sea. J. Sea. Res. 82, 103–116. doi: 10.1016/j.seares.2013.02.002
Davison, A. C., and Hinkley, D. V. (1997). Bootstrap Methods and their Application. New York, NY: Cambridge University Press.
de Goeij, P. (2001). Burying Depth as a Trade-Off in the Bivalve Macoma Balthica. Groningen: Rijkuniversiteit Groningen.
de Goeij, P., and Luttikhuizen, P. C. (1998). Deep-burying reduces growth in intertidal bivalves: field and mesocosm experiments with Macoma balthica. J. Exp. Mar. Biol. Ecol. 228, 327–337. doi: 10.1016/S0022-0981(98)00062-8
de Goeij, P., Luttikhuizen, P. C., van der Meer, J., and Piersma, T. (2001). Facilitation on an intertidal mudflat: the effect of siphon nipping by flatfish on burying depth of the bivalve Macoma balthica. Oecologia 126, 500–506. doi: 10.1007/s004420000526
de Vlas, J. (1981). “On cropping and being cropped: the regeneration of body parts by benthic organisms,” in Feeding and Survival Srategies of Estuarine Organisms, Vol. 15, of the Series Marine Science, eds N. V. Jones and W. J. Wolff (New York, NY: Springer), 173–177.
Drent, J., Dekker, R., and van der Meer, J. (2008). Long Term Monitoring of Macoma balthica. NIOZ Annual report.
Edelaar, P., Drent, J., and de Goeij, P. (2003). A double test of the parasite manipulation hypothesis in a burrowing bivalve. Oecologia 134, 66–71. doi: 10.1007/s00442-002-1038-x
Eriksson, B. K., van der Heide, T., van de Koppel, J., Piersma, T., van der Veer, H. W., and Olff, H. (2010). Major changes in the ecology of the Wadden Sea: human impacts, ecosystem engineering and sediment dynamics. Ecosystems 13, 752–764. doi: 10.1007/s10021-010-9352-3
Halpern, B. S., Walbridge, S., Selkoe, K. A., Kappel, C. V., Micheli, F., D'Agrosa, C., et al. (2008). A global map of human impact on marine ecosystems. Science 319, 948–952. doi: 10.1126/science.1149345
Honkoop, P. J. C., and van der Meer, J. (1998). Experimentally induced effects of water temperature and immersion time on reproductive output of bivalves in the Wadden Sea. J. Exp. Mar. Biol. Ecol. 220, 227–246. doi: 10.1016/S0022-0981(97)00107-X
Houston, A. I., McNamara, J. M., and Hutchinson, J. M. (1993). General results concerning the trade-off between gaining energy and avoiding predation. Philos Trans. R. Soc. London. 341, 375–397.
Kamermans, P. (1994). Similarity in food source and timing of feeding in deposit- and suspension-feeding bivalves. Mar. Ecol. Prog. Ser. 104, 63–75.
Kotler, B. P., Morris, D. W., and Brown, J. S. (2007). Behavioral indicators and conservation: Wielding “the biologist's tricorder. Isr. J. Ecol. Evol. 53, 237–244. doi: 10.1560/ijee.53.3.237
Kraan, C., Piersma, T., Dekinga, A., Koolhaas, A., and van der Meer, J. (2007). Dredging for edible cockles (Cerastoderma edule) on intertidal flats: short-term consequences of fisher patch-choice decisions for target and non-target benthic fauna. ICES. J. Mar. Sci. 64, 1735–1742. doi: 10.1093/icesjms/fsm153
Kraan, C., van Gils, J. A., Spaans, B., Dekinga, A., Bijleveld, A. I., van Roomen, M., et al. (2009). Landscape-scale experiment demonstrates that Wadden Sea intertidal flats are used to capacity by molluscivore migrant shorebirds. J. Anim. Ecol. 78, 1259–1268. doi: 10.1111/j.1365-2656.2009.01564.x
Lammens, J. J. (1967). Growth and reproduction in a tidal flat population of Macoma balthica (L.). Neth. J. Sea. Res. 3, 315–382.
Laursen, K., Blew, J., Günther, K., Hälterlein, B., Kleefstra, R., Lüerssen, G., et al. (2010). Migratory Waterbirds in the Wadden Sea 1987-2008. Wadden Sea Ecosystem No. 30. Wilhemshaven: Common Wadden Sea Secretariat, Joint Monitoring Group of Migratory Birds in the Wadden Sea.
Lima, S. L. (1998a). Nonlethal effects in the ecology of predator-prey interactions. Bioscience 48, 25–34.
Lima, S. L. (1998b).“Stress and decision-making under the risk of predation: recent developments from behavioral, reproductive, and ecological perspectives,” in Stress and Behavior. Advances in the Study of Behaviour. Vol. 28., eds A. P. Moller, P. J. B. Slater, and M. Milinski (London: Academic Press), 215–290.
Lima, S. L., and Dill, L. M. (1990). Behavioural decisions made under the risk of predation: a review and prospectus. Can. J. Zool. 68, 619–640.
Lima, S. L., and Zollner, P. A. (1996). Towards a behavioral ecology of ecological landscapes. Trends Ecol. Evol. 11, 131–135.
Lin, J., and Hines, A. H. (1994). Effects of suspended food availability on the feeding mode and burial depth of the Baltic clam, Macoma balthica. Oikos 69, 28–36.
Linnaeus, C. (1758). Systema Naturae, per Regna Tria Naturae, Secundum Classes, Ordines, Genera, Species, cum Characteribus, Differentiis, Synonymis, Locis. Editio Decima, Reformata. 10th Edn., Vol. 1, Regnum Animale. Stockholm: L. Salvii.
Lotze, H. K., Lenihan, H. S., Bourque, B. J., Bradbury, R. H., Cooke, R. G., Kay, M. C., et al. (2006). Depletion, degradation, and recovery potential of estuaries and coastal Seas. Science 312, 1806–1809. doi: 10.1126/science.1128035
Mercado-Allen, R., and Goldberg, R. (2011). Review of the Ecological Effects of Dredging in the Cultivation and Harvest of Molluscan Shellfish. NOAA Technical Memorandum NMFS-NE-220. Milford, MA: US Department of Commerce.
Meyer, J. J., and Byers, J. E. (2004). As good as dead? Sublethal predation facilitates lethal predation on an intertidal clam. Ecol. Lett. 8, 160–166. doi: 10.1111/j.1461-0248.2004.00700.x
Pekkarinen, M. (1984). Trematode metacercariae in the extrapallial space of Macoma balthica (Bivalvia) in brackish water (soutwestern Finland, Baltic Sea). Ann. Zool. Fennici. 21, 473–480.
Philippart, C. J. M., van Aken, H. M., Beukema, J. J., Bos, O. G., Cadée, G. C., and Dekker, R. (2003). Climate-related changes in recruitment of the bivalve Macoma balthica. Limnol. Oceangr. 48, 2171–2185. doi: 10.4319/lo.2003.48.6.2171
Philippart, C. J. M., van Bleijswijk, J. D. L., Kromkamp, J. C., Zuur, A. F., and Herman, P. M. J. (2014). Reproductive phenology of coastal marine bivalves in a seasonal environment. J. Plankton Res. 36, 1512–1527. doi: 10.1093/plankt/fbu073
Piersma, T., Koolhaas, A., Dekinga, A., Beukema, J. J., Dekker, R., and Essink, K. (2001). Long-term indirect effects of mechanical cockle-dredging on intertidal bivalve stocks in the Wadden Sea. J. Appl. Ecol. 38, 976–990. doi: 10.1046/j.1365-2664.2001.00652.x
R Core Team (2014). R: A Language and Environment for Statistical Computing. Vienna: R Foundation for Statistical Computing. Available online at: http://www.R-project.org/
Rossi, F., Herman, P. M. J., and Middelburg, J. J. (2004). Interspecific and intraspecific variation of δC and δN in deposit-and suspension-feeding bivalves (Macoma balthica and Cerastoderma edule): Evidence of ontogenetic changes in feeding mode of Macoma balthica. Limnol. Oceangr. 49, 408–414. doi: 10.4319/lo.2004.49.2.0408
Scheffer, M., Carpenter, S., Foley, J. A., Folke, C., and Walker, B. (2001). Catastrophic shifts in ecosystems. Nature 413, 591–596. doi: 10.1038/35098000
Sibly, R. M., Hone, J., and Clutton-Brock, T. H. (2003). Wildlife Population Growth Rates. Cambridge: Cambridge University Press.
Swennen, C., and Ching, H. L. (1974). Observations on the trematode Parvatrema affinis, causative agent of crawling tracks of Macoma balthica. Neth. J. Sea Res. 8, 108–115.
van der Meer, J. (1997). Sampling design of monitoring programmes for marine benthos: a comparison between the use of fixed versus randomly selected stations. Neth. J. Sea. Res. 37, 167–179.
van der Meer, J., Piersma, T., and Beukema, J. J. (2001). “Population dynamics of benthic species on tidal flats: the possible roles of shorebird predation,” in Ecological Comparison of Sedimentary Shores, ed K. Reise (Berlin: Springer), 317–335.
van der Veer, H. W., Koot, J., Aarts, G., Dekker, R., Diderich, W., Freitas, V., et al. (2011). Long-term trends in juvenile flatfish indicate a dramatic reduction in nursery function of the Balgzand intertidal, Dutch Wadden Sea. Mar. Ecol. Prog. Ser. 434, 143–154. doi: 10.3354/meps09209
van Gils, J. A., Kraan, C., Dekinga, A., Koolhaas, A., Drent, J., de Goeij, P., et al. (2009). Reversed optimality and predictive ecology: burrowing depth forecasts population change in a bivalve. Biol. Lett. 5, 5–8. doi: 10.1098/rsbl.2008.0452
van Gils, J. A., Piersma, T., Dekinga, A., Spaans, B., and Kraan, C. (2006). Shellfish dredging pushes a flexible avian top predator out of a marine protected area. PLoS. Biol. 4, 2399–2404. doi: 10.1371/journal.pbio.0040376
van Roomen, M., van Turnhout, C., van Winden, E., Koks, B., Goedhart, P., Leopold, M., et al. (2005). Trends van benthivore watervogels in de Nederlandse Waddenzee 1975-2002: grote verschillen tussen schelpdiereneters en wormeneters. Limosa 78, 21–38. Available online at: http://www.nou.nu/limosa/limosa_issue.php?volume=78&issue=1
Vitousek, P. M., Mooney, H. A., Lubchenco, J., and Melillo, J. M. (1997). Human domination of Earth's ecosystems. Science 277, 494–499.
Wolff, W. J. (2013). Ecology of the Wadden Sea: research in the past and challenges for the future. Neth. J. Sea. Res. 82, 3–9. doi: 10.1016/j.seares.2013.03.006
Wolff, W. J., Bakker, J. P., Laursen, K., and Reise, K. (2010). The Wadden Sea Quality Status Report - Synthesis Report 2010. Wadden Sea Ecosystem No. 29. Wilhelmshaven: Common Wadden Sea Secretariat.
Wong, B. B. M., and Candolin, U. (2014). Behavioral responses to changing environments. Behav. Ecol. 26, 665–673. doi: 10.1093/beheco/aru183
Zaklan, S. D., and Ydenberg, R. (1997). The body size-burial depth relationship in the infaunal clam Mya arenaria. J. Exp. Mar. Biol. Ecol. 215, 1–17.
Zwarts, L. (1986). Burying depth of the benthic bivalve Scrobicularia plana (da Costa) in relation to siphon-cropping. J. Exp. Mar. Biol. Ecol. 101, 25–39.
Zwarts, L., and Blomert, A. M. (1992). Why knot Calidris canutus take medium-sized Macoma balthica when six prey species are available. Mar. Ecol. Prog. Ser. 83, 113–128.
Zwarts, L., Blomert, A. M., Spaak, P., and de Vries, B. (1994). Feeding radius, burying depth and siphon size of Macoma balthica and Scrobicularia plana. J. Exp. Mar. Biol. Ecol. 183, 193–212. doi: 10.1016/0022-0981(94)90087-6
Zwarts, L., Blomert, A. M., and Wanink, J. H. (1992). Annual and seasonal variation in the food supply harvestable by knot Calidris canutus staging in the Wadden Sea in late summer. Mar. Ecol. Prog. Ser. 83, 129–139. doi: 10.3354/meps083129
Zwarts, L., and Wanink, J. (1989). Siphon size and burying depth in deposit-and suspension-feeding benthic bivalves. Mar. Biol. 100, 227–240.
Keywords: asset-protection principle, bivalves, ecosystem functioning, functional traits, overfishing, Tellinidae
Citation: Compton TJ, Bodnar W, Koolhaas A, Dekinga A, Holthuijsen S, ten Horn J, McSweeney N, van Gils JA and Piersma T (2016) Burrowing Behavior of a Deposit Feeding Bivalve Predicts Change in Intertidal Ecosystem State. Front. Ecol. Evol. 4:19. doi: 10.3389/fevo.2016.00019
Received: 10 November 2015; Accepted: 20 February 2016;
Published: 22 March 2016.
Edited by:
Alberto Basset, University of Salento, ItalyReviewed by:
Paolo Magni, National Research Council of Italy, ItalyChristos Dimitrios Arvanitidis, Hellenic Centre for Marine Research, Greece
Copyright © 2016 Compton, Bodnar, Koolhaas, Dekinga, Holthuijsen, ten Horn, McSweeney, van Gils and Piersma. This is an open-access article distributed under the terms of the Creative Commons Attribution License (CC BY). The use, distribution or reproduction in other forums is permitted, provided the original author(s) or licensor are credited and that the original publication in this journal is cited, in accordance with accepted academic practice. No use, distribution or reproduction is permitted which does not comply with these terms.
*Correspondence: Tanya J. Compton, tanya.compton@nioz.nl