- 1School of Software, Central South University, Changsha, China
- 2School of Computer and Data Science, Henan University of Urban Construction, Pingdingshan, China
MicroRNAs (miRNAs) have been demonstrated to play significant biological roles in many human biological processes. Inferring the functions of miRNAs is an important strategy for understanding disease pathogenesis at the molecular level. In this paper, we propose an integrated model, PmiRGO, to infer the gene ontology (GO) functions of miRNAs by integrating multiple data sources, including the expression profiles of miRNAs, miRNA-target interactions, and protein-protein interactions (PPI). PmiRGO starts by building a global network consisting of three networks. Then, it employs DeepWalk to learn latent representations as network features of the global heterogeneous network. Finally, the SVM-based models are applied to label the GO terms of miRNAs. The experimental results show that PmiRGO has a significantly better performance than existing state-of-the-art methods in terms of Fmax. A case study further demonstrates the feasibility of PmiRGO to annotate the potential functions of miRNAs.
Introduction
MicroRNAs (miRNAs) are endogenously small non-coding RNAs of about 21–25 nucleotides and play important roles in gene regulation, via base-pairing mRNA molecules with complementary sequences for cleavage or translational repression (Bartel, 2004; Huang et al., 2011; Yao et al., 2018). Some of the biological processes within which miRNAs are involved include development, differentiation, apoptosis, and viral infection (Miska, 2005). In addition to their importance in biological processes, miRNAs are also valuable biomarker candidates for specific diseases, including Alzheimer's disease (AD) (Esteller, 2011). Currently, the identification of unknown miRNA functions is an essential goal of miRNA research. Research on miRNA function focuses on the experimental determination field. miRNA function is primarily identified by the up-regulation or down-regulation of miRNA expression and its target genes (Zhu and Helliwell, 2010). However, experimental methods for the identification of miRNA functions are considerably expensive and time-consuming.
Recently, computational methods have been proposed to solve those difficulties. These methods elucidate miRNA functions by analyzing the functions of target genes or promoters, which are determined by miRNA-related expression (Pandey and Krishnamachari, 2006; Wei et al., 2012). These methods include TargetScan (Agarwal et al., 2015), Miranda (Enright et al., 2003), PITA (Kertesz et al., 2007), and DIANA-microT (Maragkakis et al., 2009). Many of the tools used are based on the sequence alignment of the miRNA seed region, which allows for the determination of the putative binding sites (Maragkakis et al., 2009). However, the prediction results of these tools are unsatisfactory for two reasons: first, the majority of the prediction data of the miRNA target are negative, and the predicted data are not sufficient enough; second, these tools only concentrate on sequence information (Ulitsky et al., 2010) and ignore other useful information, such as miRNA expression data. Therefore, the results are easily affected by negative samples leading to poor results. In a time of increasing high-throughput sequencing, a massive amount of miRNA-seq data is accumulating, however, the analysis of this data remains a significant challenge. miRNA expression determines function, which is also crucial for discovering molecular mechanisms of human gene regulation (Panwar et al., 2017). Backes et al. (2016) developed a novel miRNA annotation tool which provides rich functionality in terms of miRNA categories based on miRNA enrichment analysis. However, miEAA does not take the importance of miRNA co-expression into account. Generally, multiple miRNAs might jointly regulate a target gene, and a miRNA may regulate hundreds of different target genes (Krek et al., 2005; Friedman et al., 2009). The potential associations between miRNAs are also vital to understand the miRNA functional mechanism and to annotate functions of miRNAs. Moreover, miEAA ignores the interactions between miRNA and target gene production (e.g., protein), which provides useful information for predicting the functionalities of miRNAs.
In this paper, we take full advantage of miRNA expression profiles, miRNA-target gene interactions, which are experimentally validated, and protein-protein interactions data. Moreover, a global miRNA-protein network is constructed by integrating these three data sources. Secondly, we employ DeepWalk (Perozzi et al., 2014), an approach used for learning potential representations of nodes in a network, to extract the network features of the global heterogeneous network. Based on these features of the global network, we build an SVM-based classifier for each miRNA to annotate their GO functions. The proteins with Gene Ontology annotations in the GOA database (Huntley et al., 2009) are utilized to train SVM classifiers. Finally, we evaluate our method by applying it to an independent dataset. The results show that our method, PmiRGO, achieves a maximum F-measure of 0.310 and outperforms the other state-of-the-art method, miEAA (Backes et al., 2016).
Materials and Methods
The flowchart of PmiRGO is illustrated in Figure 1. As shown in step A, we first downloaded the miRNA co-expression profiles, miRNA-target interactions, and protein-protein interactions (PPIs) to construct the miRNA co-expression network, miRNA-target interaction network, and PPI network, respectively. Then, the three networks were integrated to build a global heterogeneous network by mapping the target genes into PPI network in step B. We employed DeepWalk to learn the potential representations of the networks as the features of the global heterogeneous network in step C. In step D, we mapped the IDs of miRNAs and proteins to the corresponding nodes in the features. After that, we trained SVM models for each miRNA and used the miRNA2GO-337 dataset to evaluate the performance of the multi-classification models in step E. In the final step F, the GO annotations of miRNAs in the miRNA2GO-337 dataset were predicted.
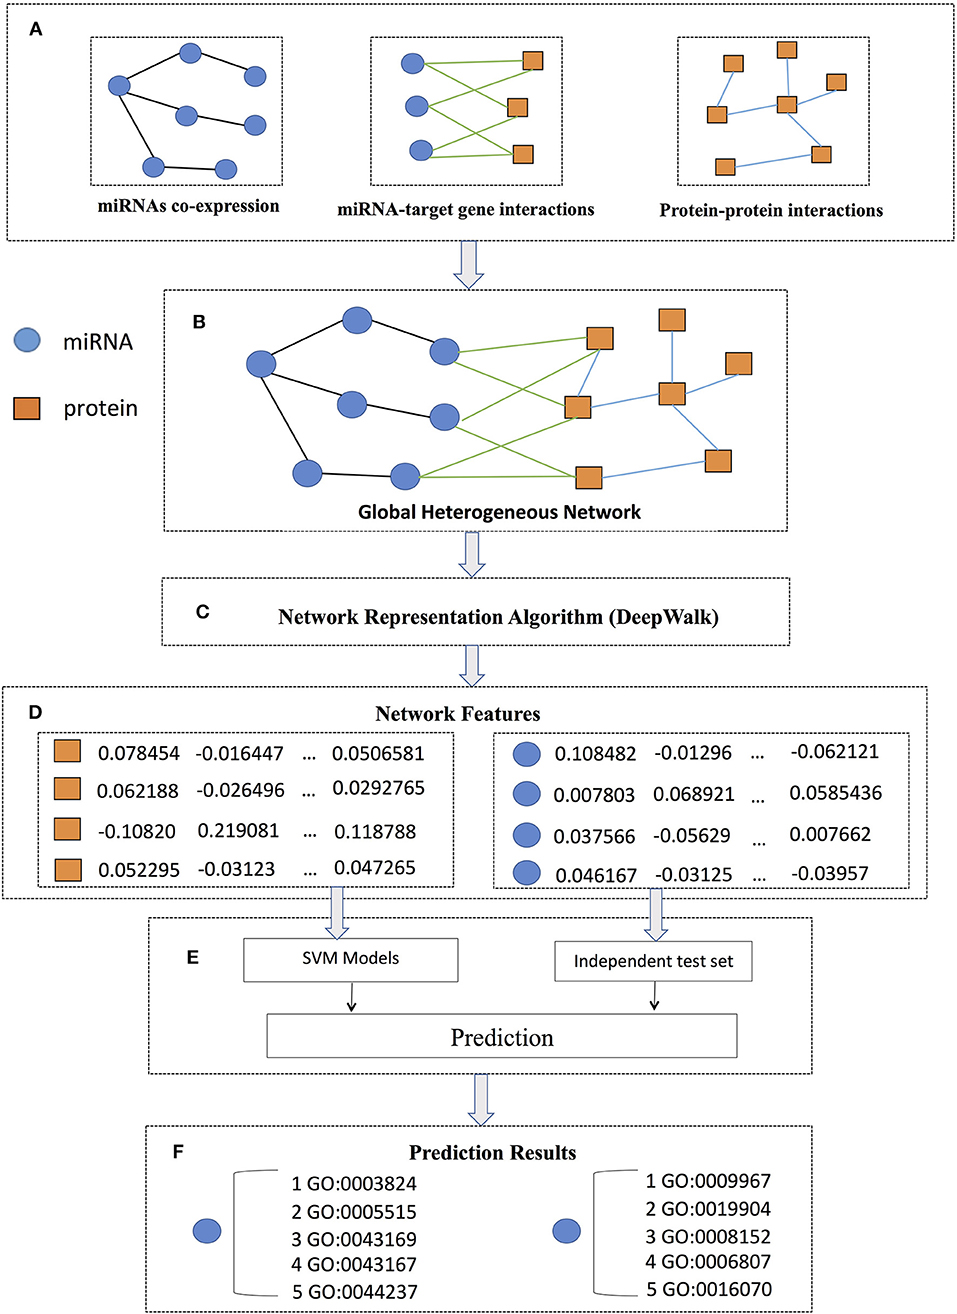
Figure 1. PmiRGO flowchart. It consists of six steps: (A) three networks (miRNA co-expression network, miRNA-target interaction network, and PPI network) were constructed according to the co-expression profiles, miRNA-target gene interactions, and protein-protein interactions, respectively. (B) By mapping the target genes into PPI network, the three networks were integrated to build a global heterogeneous network. (C) DeepWalk was employed to learn the latent representations of the network as features of the global heterogeneous network. (D) For each miRNA or protein, a feature vector was obtained. (E) SVM models were trained and the miRNA2GO-337 dataset were used to evaluate the performance. (F) The GO annotations of each miRNA in the miRNA2GO-337 dataset were predicted.
Materials
In this study, we downloaded the miRNA expression data, PPI data, and miRNA-target interactions from different databases, from which a total of 2,588 miRNAs and 18,143 proteins were retrieved. The details are as follows.
miRNA Expression
The miRNA expression data were downloaded from the miRmine database, containing expression profiles collected from several publicly available miRNA-seq datasets, as well as detailed information regarding different miRNAs (Panwar et al., 2017). This database consists of expression profiles of 2,822 precursor miRNAs, each containing a total of 135 columns of expression values from different human tissues. Note that a mature miRNA may have two or more precursor miRNAs, in our work; the expression profiles of one mature miRNA derived from different precursor miRNAs were averaged as the expression values of this mature miRNA. As a result, 2,588 miRNA expression profiles were obtained. We then calculated the Pearson's Correlation Coefficient (PCC) scores as the co-expression similarity of the expression profiles between each pair of miRNAs (Zhang J. et al., 2017). We constructed a miRNA co-expression network according to the co-expression similarity values. As the PCC scores were used as the weight of the edges in the network, the negative PCC values were removed.
Protein-Protein Interactions
The PPIs were obtained from the STRING database V10.0 (Szklarczyk et al., 2014). These interactions were collected from not only biological experiments but also text mining and computational prediction approaches. The overall scores of these interactions were obtained from single or multiple clues with high probability. The number of PPI entries retrieved from 18,143 proteins was 7,866,428, which were then used to construct a PPI network. Each entry of the PPI network consists of protein A, protein B, and corresponding predicted score. The higher the predicted score of an entry, the higher the probability that two proteins in the entry are considered to interact. In our work, we treat the predicted score as weight of the edge between two protein nodes in the entry.
miRNA-Target Interactions
We retrieved miRNA-target interactions from the miRTarBase database of release 7.0 (Hsu et al., 2010). The database provides a gold standard resource of experimentally validated microRNA-target interactions, which were manually collected. We extracted 355,684 different high quality experimentally validated miRNA-target interactions among 2,588 miRNAs and 18,143 target genes to build the miRNA-target interaction network after removing the duplicate and out-of-range entries.
Methods
Constructing the Global Network
Three heterogeneous networks, including the miRNAs co-expression network, the miRNA-target interaction network, and the PPI network, were built as described above. The construction of the miRNA co-expression network is based on the hypothesis that miRNAs with similar expression patterns also share similar functions or biological pathways (He and Hannon, 2004; Zhang Z. et al., 2017). The PCC scores were computed to represent the similarity between two miRNAs and the values represent the weights of the edges in the miRNA co-expression network. Moreover, growing evidences have revealed that miRNAs have identical or related functions to their interacting target genes with a significant probability (Bartel, 2009). Hence, the three component networks were integrated to infer the functions of miRNAs. Assuming that M, P, and MP denote the adjacency matrices of the miRNA co-expression network, PPI network, and miRNA-target interaction network, respectively, the global network can be formulated as:
Here, T in MPT represents the transpose.
Learning Latent Representations of Nodes
In order to obtain the low-dimensional topological information of the vertices of the global heterogeneous network we constructed above, DeepWalk was used to learn the potential representations of miRNAs and proteins in networks (Perozzi et al., 2014). This unsupervised method based on graph learns features that define the graph structure independently of the distribution of the labels (Bengio et al., 2013). DeepWalk uses information extracted locally from truncated random walks for the learning of potential representations by regarding walks as sentences.
We treated the global heterogeneous network as an undirected graph G = (V , E) that V denotes the set of biological entities (e.g., miRNA and protein) and E denotes the set of undirected edges. DeepWalk employs a stream of short random walks to extract potential associations between miRNAs and proteins from the global network. The series that a random walk starts with every node vi are marked as Wvi. Moreover, it is a stochastic process with random nodes , , …, , where is a node chosen randomly from the neighbors of node vk. When getting the random walk sequence for each node, it needs to measure the probability of a specific sequence. More formally, given a sequence of nodes = (w0, w1, w2, …, wn), where wi ∈V, DeepWalk maximizes the Pr(wn|w0, w1, w2, …, wn−1) over all nodes. The idea is to calculate the possibility of observing node vi given all the previous nodes traversed heretofore in the random walk:
We introduced a mapping function Φ:v ϵ V ↦ R|V| × d to stand for the potential social representation associated with each miRNA and protein in the graph. The next step involves estimating the likelihood:
However, as the walk length increases, it becomes too expensive to calculate this conditional probability. According to a recent publication (Mikolov et al., 2013), DeepWalk uses one node to predict the context, both the left and right neighbor nodes of the given node, instead of using the context to predict next node. In terms of node feature modeling, it yields the following optimization problem:
To solve the optimization problem, we then employed SkipGram, a computational language model based on neural network that maximizes the co-occurrence likelihood over the nodes that appear among the context of node vi in the random walk sequence, to approximate the conditional probability in Equation 4 based on an independence assumption, as follows:
For each of all the possible associations between biological entities in the random walk among the context of node vi, we mapped each node vj to its recent representation vector and maximized the posterior distribution probability of its neighbors in the walk. To speed up the computing time, we used the Hierarchical Softmax to approximate the probability distribution (Morin and Bengio, 2005; Mnih and Hinton, 2009):
By assigning the nodes to the leaves of a binary tree, we turned prediction of the potential association between miRNAs and proteins into maximizing the probability of a given path in the hierarchy. The path to node vj is represented as a sequence of tree nodes (b0, b1, …, b⌈log|V|⌉). Moreover, Pr(bl|Φ(vi)) can be simulated by a binary classifier as follows:
where denotes the representation traversed to tree node bl's parent.
After each node completes the random walk process γ times, a matrix Φ ϵ R|V| × d, which denotes the latent representations of the global network, is obtained. The result is that, in the matrix, each row represents a low-dimensional representation vector of a miRNA or a protein in the network. The source code and data of PmiRGO are freely available at http://denglab.org/PmiRGO/.
Training the SVM-Based Classifier
Due to the lack of manually curated GO annotations for miRNAs, it is dissatisfactory to build miRNA function predictors based on the miRNAs directly. Therefore, we built the training data sets with GO annotations of proteins downloaded from GOA database (version 201010) (Huntley et al., 2009). Proteins with lengths 50–100 aa were selected and clustered with a sequence similarity of 90 percent (Deng et al., 2018). Moreover, only one protein was chosen as a representation from each cluster. The representations without at least a non-IEA (not inferred from electronic annotation) GO term were filtered. As a result, 243,561 proteins with Gene Ontology annotations were collected.
For each GO term, we trained a classifier with samples of proteins. More specifically, we constructed a true annotation set for a GO term consisting of proteins, which had the GO annotation, and a false annotation set of proteins where these proteins did not have this GO function. As GO ontology is considered as a directed acyclic graph where each term is related to one or more other terms in the same domain or other domain (Deng and Chen, 2015; Zeng et al., 2018), the protein related to a GO term was also related to the ancestors of the term. Therefore, the false annotation data set was composed of proteins associated with other GO terms (excluding annotated terms and their child nodes). Due to the false annotation set containing more protein-GO pairs than the true annotation set, we randomly selected an equal number of negative and positive samples.
Here we employed support vector machines (SVMs) to build the binary classifier (Yong-Xin et al., 2011). SVM is widely used in bioinformatics research in the fields of miRNA target prediction, miRNA identification (Wei et al., 2014), RNA methylation prediction (Chen et al., 2017), and protein folding (Li et al., 2016), and others (Xiao et al., 2017; Dao et al., 2018; Feng et al., 2018; Pan et al., 2018; Yang et al., 2018; Zhu et al., 2019). We used the radial basis function kernel (RBF) as the kernel function, which achieved a better performance. C is the penalty coefficient of SVM, which can be considered as the weight to adjust the preference of two indexes (interval size, classification accuracy) in the optimization direction. The higher the value of C, the easier the classifier was to overfit. On the contrary, the lower the value of C, the easier the classifier was to underfit. To obtain an optimal C of the SVM and γ of the kernel, the performance for each C and γ was evaluated by carrying out a 10-fold cross-validation.
Results
Benchmarks
To accurately evaluate the performance of PmiRGO, we created an independent test based on the GOA database (Ashburner et al., 2000; The Gene Ontology Consortium, 2017). It consisted of a total of 337 mature miRNAs (named as miRNA2GO-337), each of which had at least one curated GO annotation (not inferred from electronic annotation, non-IEA). The independent test dataset appears in the Supplementary Table 1.
Evaluation Measures
In PmiRGO, the classifier predicted several probable GO terms with corresponding scores ranging from 0 to 1 for a specific miRNA. The scores denoted the degree of confidence for those GO terms. The final predictions depended on the selected threshold t. All GO terms predicted for each miRNA with scores equal to or greater than t and their ancestors in GO linked by “is a” and “has a” relationships were collected to build the set of predicted GO terms denoted as P(t) for each threshold t. We used T to denote the set of experimentally validated GO terms. We evaluated the performance of the prediction according to three widely used statistic indexes: recall, precision, and F-measure. The definitions of recall and precision are as follows:
where g denotes a specific GO term, and G denotes the set of all GO terms used in our work. The indicator function I(x) is stated as follows:
After all the miRNAs had been predicted, the average precision for each threshold t could be calculated on m(t) miRNAs, each of which had at least one predicted GO term with a score greater than the threshold t. In the same way, the average recall could be calculated from the whole benchmark set of N miRNAs. The average precision and recall are defined as follows:
Generally speaking, precision and recall are inversely related. It is not feasible to evaluate the performance of models according to a single precision or recall. To deal with this problem, the maximum F-measure over all thresholds was introduced for the overall evaluation of different models (Zhang J. et al., 2018). It combined the two metrics (precision and recall) to provide a single-score. The maximum F-measure is defined as follows:
The Effects of Feature Dimensions
As described above, the latent representations of each node in the network act as its low-dimensional topological features. The number of dimensions might have a significant effect on the functional annotations of miRNAs. To assess the influence of the hyper-parameter on the prediction performance, we performed an independent test on the miRNA2GO-337 dataset across a wide range of values for the dimensions. For simplicity, we preset the other parameters, including the number of walks started from one node (n), the walk length (t), and the window size (w), in DeepWalk. The three parameters were selected by conducting experiments of different parameter values and choosing the combination with the best performance (n = 100, t = 80, w = 16).
Figure 2 shows the Fmax values when the number of dimensions ranges from 128 to 1024. The results demonstrated that the Fmax reached the max value when the dimension increased to 512. However, as the dimension increased beyond this value, the performance decreased accordingly. Hence, 512 was chosen as the dimensions of the feature vector. It is important to note that the SkipGram model based on Hierarchical Softmax of DeepWalk algorithm is a neural network model and its output layer corresponds to a binary tree. Therefore, the dimensions of the latent representations of the model should be a power of two.
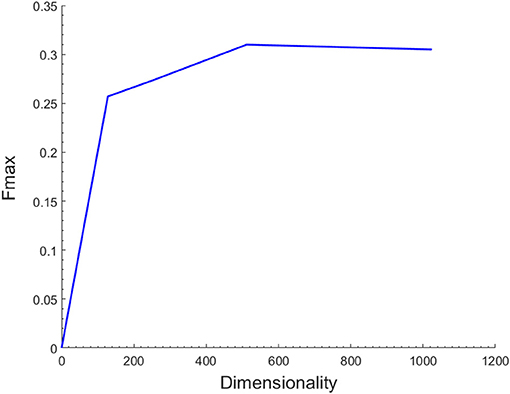
Figure 2. Effect of the number of different feature dimensions on function prediction. The maximum F-measure reaches its highest value 0.31 when the feature dimension is 512.
The Effects of PPI Data
In our method, protein interaction data was incorporated to help improve the effectiveness of the functional annotations of the miRNAs. To confirm this, PmiRGO was carried out on two different network collocations: the global network (consisting of a miRNA co-expression network, miRNA-target interaction network, and PPI network), and the network without PPIs. The comparison was performed in terms of Fmax when the parameters (n, t, w, d) were set to 100, 80, 16, and 512, respectively. The results are shown in Table 1. The Fmax value was 0.31 for the global network and 0.252 for the network without PPIs. The performance increased ~23% with the addition of PPI data. This experiment demonstrated that integrating multiple types of information about other relevant biological entities (e.g., protein) resulted in a great improvement in the performance of predicting miRNA function.
Comparison of Different Network Representation Algorithms
Recent studies have demonstrated that network representation learning is effective in machine learning, such as in tag recommendation (Tu et al., 2014), vertex classification (Sen et al., 2008), and link prediction (Lü and Zhou, 2011; Yang et al., 2015). Many methods have been proposed to address these issues, most of which investigate network structure for learning, such as DeepWalk (Perozzi et al., 2014), node2vec (Grover and Leskovec, 2016), hin2vec (Fu et al., 2017), and metapath2vec (Dong et al., 2017). DeepWalk used information extracted locally from the truncated random walks in order to learn potential representations. On the basis of DeepWalk, node2vec defined a strategy generating a sequence of bias random walk that used both BFS and DFS to retain different network structure information. Different from DeepWalk and node2vec, hin2vec, and metapath2vec have been proposed for heterogeneous information networks. They were designed to capture rich semantics by exploiting different types of relationships among nodes in forms of meta-paths.
In this paper, we compared DeepWalk, hin2vec, and metapath2vec in terms of predicting GO annotations of miRNAs. For the sake of fairness, we used the same global network constructed above, multi-classification models, and benchmarks. Figure 3 demonstrates that DeepWalk significantly outperforms hin2vec and metapath2vec in terms of precision and Fmax. Hence, DeepWalk was employed to extract the topological features of our work.
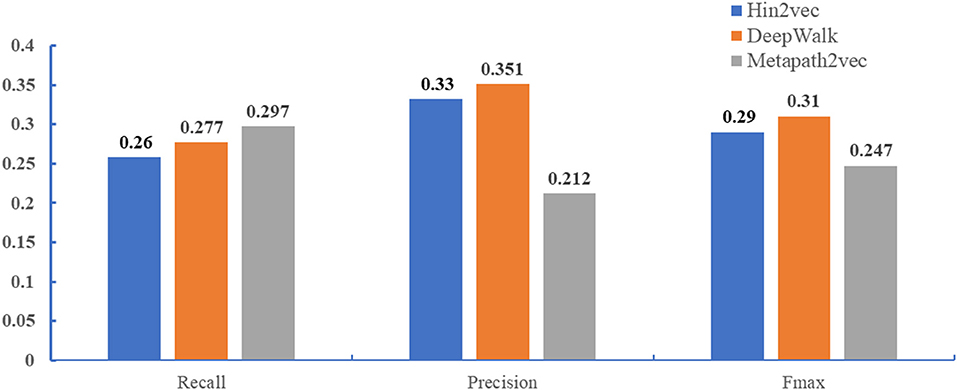
Figure 3. Performance comparison when different methods (DeepWalk, hin2vec, and metapath2vec) are employed to extract topological features. The performance of three methods were performed in the miRNA2GO independent dataset.
Performances
To evaluate the performance of PmiRGO further, we compared it with the state-of-the-art method miEAA (Backes et al., 2016). MiEAA is a tool that uses enrichment analysis to perform the functional analysis of sets of miRNAs based on GeneTrail (Backes et al., 2007). Compared to GeneTrail, miEAA was designed for human miRNA precursors and mature miRNAs. The miRNA2GO-337 dataset was utilized to assess the performance of different methods. Since 53.5% of the functional annotations of miRNAs are biological process (BP) terms, according to the statistics of Gene Ontology Consortium database (Ashburner et al., 2000), and since miRNAs are involved in the biological process when they have interactions with other entities, we only evaluated the performance in terms of BPs.
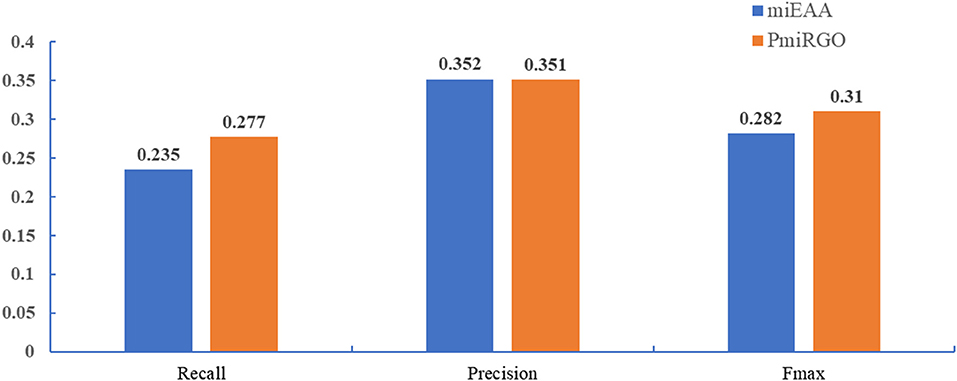
The prediction performance of the two methods is presented in Figure 4. It is quite apparent that PmiRGO outperforms miEAA. For the metric Fmax, PmiRGO achieved 0.310 Fmax on BP terms and had an increase of 0.03 Fmax, while miEAA reached 0.282 Fmax. Also, the recall of PmiRGO reached 0.277 when the Fmax achieved the highest value, and the recall of miEAA was 0.235. Figure 5 shows that the precision-recall curve of PmiRGO is entirely above the curve of miEAA, which means that our method significantly outperforms miEAA. We calculated the P-value with two-tailed, paired t-test to compare the performances of our PmiRGO method and MiEAA. For each time, we randomly selected 50 miRNAs from the miRNA2GO-337 dataset and calculated the Fmax scores for both PmiRGO and MiEAA. We repeated the procedure for 30 times and obtained 30 paired Fmax scores. We calculated the P-value using MATLAB. A P-value score of 0.05 was used to denote statistical significance. The Fmax of our PmiRGO method was higher than that of MiEAA, a difference that was statistically significant (P = 1.86e-05).
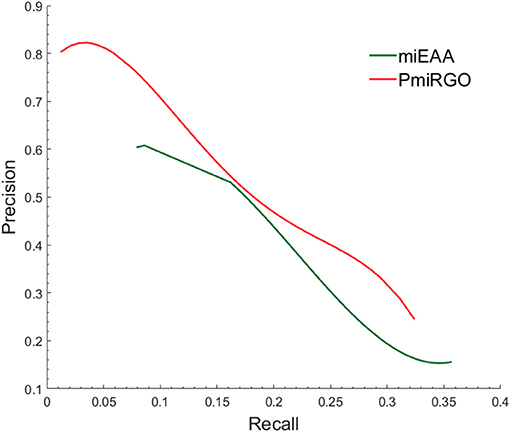
Figure 5. Precision-recall curves of PmiRGO and miEAA. The figure shows the performance comparison of PmiRGO with miEAA on the miRNA2GO-337 dataset for BP terms.
Moreover, the coverage of the two prediction methods on the miRNA2GO-337 dataset was compared. The coverage is defined as the number of miRNAs predicted correctly, a measure that reflects robustness. As presented in Figure 6, PmiRGO correctly annotated 205 miRNAs out of 337 miRNA samples, while miEAA successfully predicted 174 miRNAs, demonstrating that our method is more robust than miEAA.
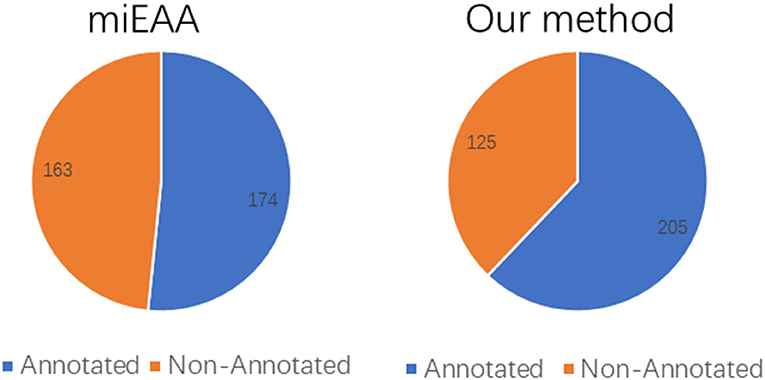
Figure 6. Performance comparison of coverage, on the independent dataset miRNA2GO-337. Among these 337 human miRNAs, 205 miRNAs were annotated by PmiRGO, while only 174 miRNAs were annotated by miEAA.
Case Study
To illustrate the performance of this prediction method in a real case study, we applied PmiRGO to predict the functions of miRNA has-miR-124-3p. miRNA has-miR-124-3p plays an essential role in mediating tumor growth and the occurrence and development of cancer with high genetic conservation. Recent studies have used high-throughput sequencing to demonstrate that hsa-miR-124-3p has differential expression in normal brain tissue and glioblastoma multiforme (GBM). Moreover, has-miR-124-3p overexpression expressively inhibits GBM cell proliferation, migration, and tumor angiogenesis, which results in cell cycle arrest and GBM apoptosis putatively via the activation of the NRP-1-mediated PI3K/Akt/NFκB pathway in GBM cells, as well as suppressing tumor growth and reducing tumor angiogenesis (Zhang G. et al., 2018). Moreover, hsa-miR-124-3p regulates the expression of the CD151 protein by inosculation with the 5′UTR to take part in the development of gastric cancer (Sheng et al., 2009).
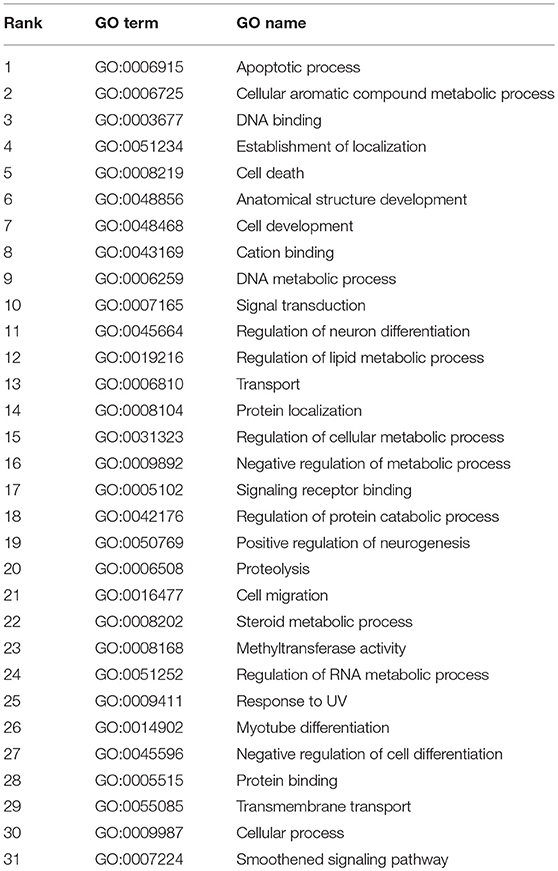
As a result, has-miR-124-3p annotated 250 GO terms in total, the top 31 of which had a probability score >0.9, as shown in Table 2. Of the four most probable GO Terms, GO:0006915 (apoptotic process), responsible for the process of programmed cell death when a cell receives an internal or external signal, and GO:0006725 (cellular aromatic compound metabolic process), the chemical reactions and pathways involving aromatic compounds, were indirectly related with the occurrence and development of diseases, particularly cancer and tumors. In addition, the predicted GO Terms GO:0008219 (cell death) (ranked 5th), GO:0048468 (cell development) (ranked 7th), and GO:0009987 (cellular process) (ranked 30th) were associated with adenocarcinoma of the lung, breast neoplasms, and colonic neoplasms. Moreover, those GO terms related to metabolic processes, such as GO:0006259 (DNA metabolic process) (ranked 9th), GO:0019216 (regulation of lipid metabolic process) (ranked 12th), and GO:0031323 (regulation of cellular metabolic process) (ranked 15th), were associated with the production of the gene products TCEAL7 and TNFRSF1A, which may promote the occurrence of prostatic neoplasms, lung diseases, and gastric cancer.
Discussion
Computational function prediction of miRNAs by integrating varieties of miRNA-related biological information is emerging as a tool to elucidate the role of miRNAs in development and for inferring the biological functions of miRNAs. In our work, we proposed a novel approach, PmiRGO, to predict their function. Specifically, we constructed a global heterogeneous network by integrating expression profiles, miRNA-target interactions, and PPI data. Then, DeepWalk, an approach used for learning online social representations, was employed to learn the latent network features of the global network. Finally, we employed SVM to build multi-classification models for predicting the GO annotations.
In terms of the performance, PmiRGO was used to evaluate the independent dataset miRNA2GO-337. In terms of Fmax and coverage, PmiRGO outperformed miEAA. Moreover, the results demonstrate that the protein interaction data contributes to the improvement of prediction performance for miRNAs. The great performance of our method can be attributed to several factors. At first, the experimentally validated miRNA-target gene interactions, manually curated from reporter assay, blot, and microarray experiments were utilized. More reliable and positive information significantly improves the performance of PmiRGO. Then, we used the miRNA expression profiles to construct a miRNA co-expression network, which is useful for predicting the miRNAs involved in co-regulating one target gene. Finally, the PPI network was introduced to the global network, allowing the performance of function prediction to benefit from the variety of biological entities.
However, there are still further improvements to be made to our method. Firstly, the experimentally validated miRNA-target gene interactions were sparse. A greater number of validated interactions could enhance the effect of PmiRGO further. Secondly, the expression profiles we used covered only a part of human miRNAs, and the coverage of the expression information was not enough. As such, more reliable miRNA expression profiles need to be collected. Thirdly, more types of biological entities could also be introduced to the global network. Others works, including miRNA family information (Zou et al., 2014) and miRNA-disease networks (Zou et al., 2016; Liao et al., 2018; Zeng X. et al., 2018), would also be useful in this study. This should be the focus of future works.
Author Contributions
LD, JW, and JZ conceived this work and designed the experiments. LD and JW carried out the experiments. LD, JW, and JZ collected the data and analyzed the results. LD, JW, and JZ wrote, revised, and approved the manuscript.
Funding
This work was supported by the National Natural Science Foundation of China [grant number 61672541] and the Natural Science Foundation of Hunan Province [grant number 2017JJ3412].
Conflict of Interest Statement
The authors declare that the research was conducted in the absence of any commercial or financial relationships that could be construed as a potential conflict of interest.
Acknowledgments
We would like to thank the Experimental Center of School of Software of Central South University, for providing computing resources.
Supplementary Material
The Supplementary Material for this article can be found online at: https://www.frontiersin.org/articles/10.3389/fgene.2019.00003/full#supplementary-material
Supplementary Table 1. The miRNA2GO-337 dataset.
References
Agarwal, V., Bell, G. W., Nam, J.-W., and Bartel, D. P. (2015). Predicting effective microRNA target sites in mammalian mRNAs. Elife 4:e05005. doi: 10.7554/eLife.05005
Ashburner, M., Ball, C. A., Blake, J. A., Botstein, D., Butler, H., Cherry, J. M., et al. (2000). Gene ontology: tool for the unification of biology. Nat. Genet. 25:25. doi: 10.1038/75556
Backes, C., Keller, A., Kuentzer, J., Kneissl, B., Comtesse, N., Elnakady, Y. A., et al. (2007). GeneTrail—advanced gene set enrichment analysis. Nucleic Acids Res. 35, W186–W192. doi: 10.1093/nar/gkm323
Backes, C., Khaleeq, Q. T., Meese, E., and Keller, A. (2016). miEAA: microRNA enrichment analysis and annotation. Nucleic Acids Res. 44, W110–W116. doi: 10.1093/nar/gkw345
Bartel, D. P. (2004). MicroRNAs: genomics, biogenesis, mechanism, and function. Cell 116, 281–297. doi: 10.1016/S0092-8674(04)00045-5
Bartel, D. P. (2009). MicroRNAs: target recognition and regulatory functions. Cell 136, 215–233. doi: 10.1016/j.cell.2009.01.002
Bengio, Y., Courville, A., and Vincent, P. (2013). Representation learning: a review and new perspectives. IEEE Trans. Pattern Anal. Mach. Intell. 35, 1798–1828. doi: 10.1109/TPAMI.2013.50
Chen, W., Xing, P., and Zou, Q. (2017). Detecting N-6-methyladenosine sites from RNA transcriptomes using ensemble support vector machines. Sci. Rep. 7:40242. doi: 10.1038/srep40242
Dao, F. Y., Lv, H., Wang, F., Feng, C. Q., Ding, H., Chen, W., et al. (2018). Identify origin of replication in Saccharomyces cerevisiae using two-step feature selection technique. Bioinformatics doi: 10.1093/bioinformatics/bty943. [Epub ahead of print].
Deng, L., and Chen, Z. (2015). An integrated framework for functional annotation of protein structural domains. IEEE/ACM Trans. Comput. Biol. Bioinformatics 12, 902–913. doi: 10.1109/TCBB.2015.2389213
Deng, L., Wu, H., Liu, C., Zhan, W., and Zhang, J. (2018). Probing the functions of long non-coding RNAs by exploiting the topology of global association and interaction network. Comput. Biol. Chem. 74, 360–367. doi: 10.1016/j.compbiolchem.2018.03.017
Dong, Y., Chawla, N. V., and Swami, A. (2017). “metapath2vec: scalable representation learning for heterogeneous networks,” in Proceedings of the 23rd ACM SIGKDD International Conference on Knowledge Discovery and Data Mining (Halifax, NS: ACM).
Enright, A. J., John, B., Gaul, U., Tuschl, T., Sander, C., and Marks, D. S. (2003). MicroRNA targets in Drosophila. Genome Biol. 5:R1. doi: 10.1186/gb-2003-5-1-r1
Esteller, M. (2011). Non-coding RNAs in human disease. Nat. Rev. Genet. 12:861. doi: 10.1038/nrg3074
Feng, C. Q., Zhang, Z. Y., Zhu, X. J., Lin, Y., Chen, W., Tang, H., et al. (2018). iTerm-PseKNC: a sequence-based tool for predicting bacterial transcriptional terminators. Bioinformatics doi: 10.1093/bioinformatics/bty827. [Epub ahead of print].
Friedman, R. C., Farh, K. K.-H., Burge, C. B., and Bartel, D. P. (2009). Most mammalian mRNAs are conserved targets of microRNAs. Genome Res. 19, 92–105. doi: 10.1101/gr.082701.108
Fu, T.-Y., Lee, W.-C., and Lei, Z. (2017). “HIN2Vec: explore meta-paths in heterogeneous information networks for representation learning,” in Proceedings of the 2017 ACM on Conference on Information and Knowledge Management (Singapore: ACM).
Grover, A., and Leskovec, J. (2016). “node2vec: scalable feature learning for networks,” in Proceedings of the 22nd ACM SIGKDD International Conference on Knowledge Discovery and Data Mining (San Francisco, CA: ACM).
He, L., and Hannon, G. J. (2004). MicroRNAs: small RNAs with a big role in gene regulation. Nat. Rev. Genet. 5:522. doi: 10.1038/nrg1379
Hsu, S.-D., Lin, F.-M., Wu, W.-Y., Liang, C., Huang, W.-C., Chan, W.-L., et al. (2010). miRTarBase: a database curates experimentally validated microRNA–target interactions. Nucleic Acids Res. 39, D163–D169. doi: 10.1093/nar/gkq1107
Huang, Y., Shen, X. J., Zou, Q., Wang, S. P., Tang, S. M., and Zhang, G. Z. (2011). Biological functions of microRNAs: a review. J. Physiol. Biochem. 67, 129–139. doi: 10.1007/s13105-010-0050-6
Huntley, R., Dimmer, E., Barrell, D., Binns, D., and Apweiler, R. (2009). The gene ontology annotation (goa) database. Nat. Proc. 10, 429–438. doi: 10.1038/npre.2009.3154.1
Kertesz, M., Iovino, N., Unnerstall, U., Gaul, U., and Segal, E. (2007). The role of site accessibility in microRNA target recognition. Nat. Genet. 39:1278. doi: 10.1038/ng2135
Krek, A., Grün, D., Poy, M. N., Wolf, R., Rosenberg, L., Epstein, E. J., et al. (2005). Combinatorial microRNA target predictions. Nat. Genet. 37:495. doi: 10.1038/ng1536
Li, D., Ju, Y., and Zou, Q. (2016). Protein folds prediction with hierarchical structured SVM. Curr. Proteomics 13, 79–85. doi: 10.2174/157016461302160514000940
Liao, Z. J., Li, D. P., Wang, X. R., Li, L. S., and Zou, Q. (2018). Cancer diagnosis through isomiR expression with machine learning method. Curr. Bioinform. 13, 57–63. doi: 10.2174/1574893611666160609081155
Lü, L., and Zhou, T. (2011). Link prediction in complex networks: a survey. Physica A Stat. Mech. Appl. 390, 1150–1170. doi: 10.1016/j.physa.2010.11.027
Maragkakis, M., Reczko, M., Simossis, V. A., Alexiou, P., Papadopoulos, G. L., Dalamagas, T., et al. (2009). DIANA-microT web server: elucidating microRNA functions through target prediction. Nucleic Acids Res. 37, W273–W276. doi: 10.1093/nar/gkp292
Mikolov, T., Chen, K., Corrado, G., and Dean, J. (2013). Efficient Estimation of Word Representations in Vector Space. Amsterdam: Elsevier.
Miska, E. A. (2005). How microRNAs control cell division, differentiation and death. Curr. Opin. Genet. Dev. 15, 563–568. doi: 10.1016/j.gde.2005.08.005
Mnih, A., and Hinton, G. E. (2009). “A scalable hierarchical distributed language model,” in Advances in Neural Information Processing Systems, eds D. Koller, D. Schuurmans, Y. Bengio, and L. Bottou (Vancouver, BC: Curran Associates Inc.), 1081–1088.
Morin, F., and Bengio, Y. (2005). “Hierarchical probabilistic neural network language model,” in Aistats, eds R. G. Cowell and Z. Ghahramani (Bridgetown: Citeseer), 246–252.
Pan, Y., Wang, Z., Zhan, W., and Deng, L. (2018). Computational identification of binding energy hot spots in protein-rna complexes using an ensemble approach. Bioinformatics 34, 1473–1480. doi: 10.1093/bioinformatics/btx822
Pandey, S., and Krishnamachari, A. (2006). Computational analysis of plant RNA Pol-II promoters. Biosystems 83, 38–50. doi: 10.1016/j.biosystems.2005.09.001
Panwar, B., Omenn, G. S., and Guan, Y. (2017). miRmine: a database of human miRNA expression profiles. Bioinformatics 33, 1554–1560. doi: 10.1093/bioinformatics/btx019
Perozzi, B., Al-Rfou, R., and Skiena, S. (2014). “Deepwalk: online learning of social representations,” in Proceedings of the 20th ACM SIGKDD International Conference on Knowledge Discovery and Data Mining: ACM (New York, NY) 701–710.
Sen, P., Namata, G., Bilgic, M., Getoor, L., Galligher, B., and Eliassi-Rad, T. (2008). Collective classification in network data. AI Magz. 29:93. doi: 10.1609/aimag.v29i3.2157
Sheng, X., Zhang, L., Cai, R.-X., and Shen, J.-Y. (2009). Expression of CD151 and its clinical significance in colorectal carcinoma. Chin. J. Clin. Exp. Pathol. 3:030. doi: 10.3969/j.issn.1001-7399.2009.03.019
Szklarczyk, D., Franceschini, A., Wyder, S., Forslund, K., Heller, D., Huerta-Cepas, J., et al. (2014). STRING v10: protein–protein interaction networks, integrated over the tree of life. Nucleic Acids Res. 43, D447–D452. doi: 10.1093/nar/gku1003
The Gene Ontology Consortium (2017). Expansion of the gene ontology knowledgebase and resources. Nucleic Acids Res. 45, D331–D338. doi: 10.1093/nar/gkw1108
Tu, C., Liu, Z., and Sun, M. (2014). Inferring Correspondences From Multiple Sources for Microblog User Tags. Beijing; Berlin; Heidelberg: Springer, 1–12.
Ulitsky, I., Laurent, L. C., and Shamir, R. (2010). Towards computational prediction of microRNA function and activity. Nucleic Acids Res. 38:e160. doi: 10.1093/nar/gkq570
Wei, L., Huang, Y., Qu, Y., Jiang, Y., and Zou, Q. (2012). Computational analysis of miRNA target identification. Curr. Bioinform. 7, 512–525. doi: 10.2174/157489312803900974
Wei, L., Liao, M., Gao, Y., Ji, R., He, Z., and Zou, Q. (2014). Improved and promising identification of human microRNAs by incorporating a high-quality negative set. IEEE/ACM Trans. Comput. Biol. Bioinform. 11, 192–201. doi: 10.1109/TCBB.2013.146
Xiao, Y., Zhang, J., and Deng, L. (2017). Prediction of lncrna-protein interactions using hetesim scores based on heterogeneous networks. Sci. Rep. 7:3664. doi: 10.1038/s41598-017-03986-1
Yang, C., Liu, Z., Zhao, D., Sun, M., and Chang, E. Y. (2015). “Network representation learning with rich text information,” in IJCAI, eds Q. Yang and M. Wooldridge (Buenos Aires: AAAI Press), 2111–2117.
Yang, H., Lv, H., Ding, H., Chen, W., and Lin, H. (2018). iRNA-2OM: a sequence-based predictor for identifying 2′-O-methylation sites in homo sapiens. J. Comput. Biol. 25, 1266–1277. doi: 10.1089/cmb.2018.0004
Yao, Y. H., Li, X. H., Geng, L. L., Nan, X. Y., Qi, Z. H., and Liao, B. (2018). Recent progress in long noncoding RNAs prediction. Curr. Bioinform. 13, 344–351. doi: 10.2174/1574893612666170905153933
Yong-Xin, L., Wei, C., Ying-Peng, H., Quan, Z., Mao-Zu, G., and Wen-Bin, L. (2011). In silico detection of novel microRNAs genes in soybean genome. Agric. Sci. China 10, 1336–1345. doi: 10.1016/S1671-2927(11)60126-0
Zeng, C., Zhan, W., and Deng, L. (2018). SDADB: a functional annotation database of protein structural domains. Database 2018:bay064. doi: 10.1093/database/bay064
Zeng, X., Liu, L., Lü, L., and Zou, Q. (2018). Prediction of potential disease-associated microRNAs using structural perturbation method. Bioinformatics 34, 2425–2432. doi: 10.1093/bioinformatics/bty112
Zhang, G., Chen, L., Khan, A. A., Li, B., Gu, B., Lin, F., et al. (2018). miRNA-124-3p/neuropilin-1 (NRP-1) axis plays an important role in mediating glioblastoma growth and angiogenesis. Int. J. Cancer 143, 635–644. doi: 10.1002/ijc.31329
Zhang, J., Zhang, Z., Chen, Z., and Deng, L. (2017). Integrating multiple heterogeneous networks for novel LncRNA-disease association inference. IEEE/ACM Trans. Comput. Biol. Bioinform. doi: 10.1109/TCBB.2017.2701379. [Epub ahead of print].
Zhang, J., Zhang, Z., Wang, Z., Liu, Y., and Deng, L. (2018). Ontological function annotation of long non-coding RNAs through hierarchical multi-label classification. Bioinformatics 34, 1750–1757. doi: 10.1093/bioinformatics/btx833
Zhang, Z., Zhang, J., Fan, C., Tang, Y., and and, L. D (2017). KATZLGO: large-scale prediction of LncRNA functions by using the KATZ measure based on multiple networks. IEEE/ACM Trans. Comput. Biol. Bioinform. doi: 10.1109/TCBB.2017.2704587. [Epub ahead of print].
Zhu, Q.-H., and Helliwell, C. A. (2010). Regulation of flowering time and floral patterning by miR172. J. Exp. Bot. 62, 487–495. doi: 10.1093/jxb/erq295
Zhu, X. J., Feng, C. Q., Lai, H. Y., Chen, W., and Lin, H. (2019). Predicting protein structural classes for low-similarity sequences by evaluating different features. Knowl. Based Syst. 163, 787–793. doi: 10.1016/j.knosys.2018.10.007
Zou, Q., Li, J., Song, L., Zeng, X., and Wang, G. (2016). Similarity computation strategies in the microRNA-disease network: a survey. Brief. Funct. Genomics 15, 55–64. doi: 10.1093/bfgp/elv024
Keywords: miRNA function annotation, miRNA co-expression, global heterogeneous network, latent representations, multi-classification
Citation: Deng L, Wang J and Zhang J (2019) Predicting Gene Ontology Function of Human MicroRNAs by Integrating Multiple Networks. Front. Genet. 10:3. doi: 10.3389/fgene.2019.00003
Received: 02 November 2018; Accepted: 07 January 2019;
Published: 29 January 2019.
Edited by:
Quan Zou, University of Electronic Science and Technology of China, ChinaReviewed by:
Wuritu Yang, Inner Mongolia University, ChinaWenji Ma, Columbia University, United States
Zizhang Sheng, Columbia University Irving Medical Center, United States
Copyright © 2019 Deng, Wang and Zhang. This is an open-access article distributed under the terms of the Creative Commons Attribution License (CC BY). The use, distribution or reproduction in other forums is permitted, provided the original author(s) and the copyright owner(s) are credited and that the original publication in this journal is cited, in accordance with accepted academic practice. No use, distribution or reproduction is permitted which does not comply with these terms.
*Correspondence: Jingpu Zhang, zhangjp@csu.edu.cn
 Lei Deng
 Jiacheng Wang
 Jingpu Zhang
