Abstract
This study aims at investigating genomic diversity of several turkey populations using Copy Number Variants (CNVs). A total of 115 individuals from six Italian breeds (Colle Euganei, Bronzato Comune Italiano, Parma e Piacenza, Brianzolo, Nero d’Italia, and Ermellinato di Rovigo), seven Narragansett, 38 commercial hybrids, and 30 Mexican turkeys, were genotyped with the Affymetrix 600K single nucleotide polymorphism (SNP) turkey array. The CNV calling was performed with the Hidden Markov Model of PennCNV software and with the Copy Number Analysis Module of SVS 8.4 by Golden Helix®. CNV were summarized into CNV regions (CNVRs) at population level using BEDTools. Variability among populations has been addressed by hierarchical clustering (pvclust R package) and by principal component analysis (PCA). A total of 2,987 CNVs were identified covering 4.65% of the autosomes of the Turkey_5.0/melGal5 assembly. The CNVRs identified in at least two individuals were 362—189 gains, 116 losses, and 57 complexes. Among these regions the 51% contain annotated genes. This study is the first CNV mapping of turkey population using 600K chip. CNVs clustered the individuals according to population and their geographical origin. CNVs are known to be indicators also of adaptation, as some researches in different species are suggesting.
Introduction
The domestication of the wild turkey appears to occur in Mexico between 200 B.C. and 700 A.D. (Crawford, 1992). The domesticated turkey has been introduced in Europe from Mexico and Central America starting in late 15th century (Schorger, 1996) by the Spanish conquerors. The diffusion of the turkey population in the European territory was very fast, close to 50 km per year as indicated by Crawford (1992). The rapid diffusion in Europe was possibly facilitated because of their farming, as turkey was appreciated for its meat (Schorger, 1996). Then, since the 15th century, the populations of European and Mexican turkey evolved independently for more than 500 years.
At present in Europe there is a clear differentiation in several turkey breeds, indicating that farmers and breeders have selected the turkey populations according to a directional goal for more than 5 centuries. Additionally, in the last 40 years, companies developed a structured breeding plan to produce commercial hybrids selected to maximize meat production1.
In this study six Italian autochthonous breeds [Colle Euganei (CoEu); Bronzato Comune Italiano (BrCI); Parma e Piacenza (PrPc); Brianzolo (BR); Nero d’Italia (NI) Ermellinato di Rovigo (ErRo)], the Narragansett, the Mexican turkey, and a hybrid population were considered to disclose genome structural variations in a wide dataset of individuals from differently evolved populations.
The selection operated by farmers in the past 5 centuries in the Italian populations determined the appearance of strong variation in plumage colors, in body size and weight, differentiating the populations in breeds (Cavalchini, 1983). This differentiation was possibly also facilitated by the geopolitical structure of Italy in middle ages, structured in a large number of small states with very limited exchange of goods and populations, making each turkey population genetically isolated from the others. Plumage of these breeds spans from totally black (Nero d’Italia) to white with black streaks (Ermellinato di Rovigo), while it is generally bronze like or with bronze reflection in all the other Italian populations. Body size is also showing a considerable difference among the Italian breeds with male weight spanning from 4.5 to 6.5 kg in the Brianzolo and reaching 12 kg in the Ermellinato di Rovigo (Table 1). Due to the fact that local farming occurred for centuries, it is expected that genetic bottleneck occurred in the Italian populations. The Mexican turkey population has historically been farmed as a backyard population without any directional selection for centuries, with a plumage very variable in its color and a weight close to 6 kg in males. In fact, in this population, there is not any structured selection program, while its genetic peculiarity is a strong argument in favor of its conservation (Utrera et al., 2016). In the farming system birds are free to migrate, facilitating the exchange of genetics across the country, favoring the genetic variability occurring in the population thus contributing to its morphological homogeneity irrespectively from the geographical location. The Narragansett breed (NARR) originated in Rhode Island and was recognized as a breed at the end of the 19th century. The NARR was originally developed in Rhode Island by colonies returning to America from Europe in 16th century, bringing back turkeys of the Norfolk Black breed and crossing them with the native American ones (Ekarius, 2007).
Table 1
| Brianzolo (BR)* | Bronzato Comune Italiano (BrCI)* | Colle Euganei (CoEu)** | Ermellinato di Rovigo (ErRo)** |
|---|---|---|---|
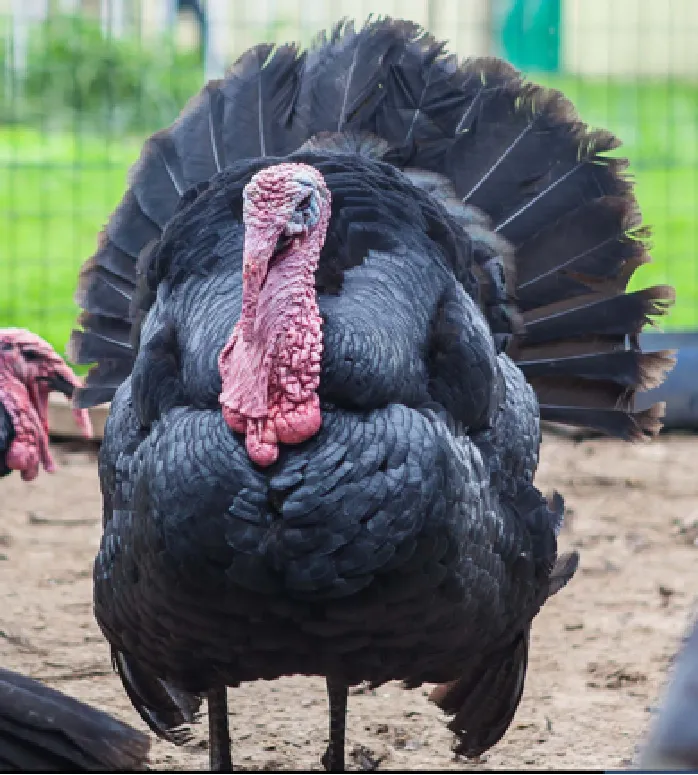
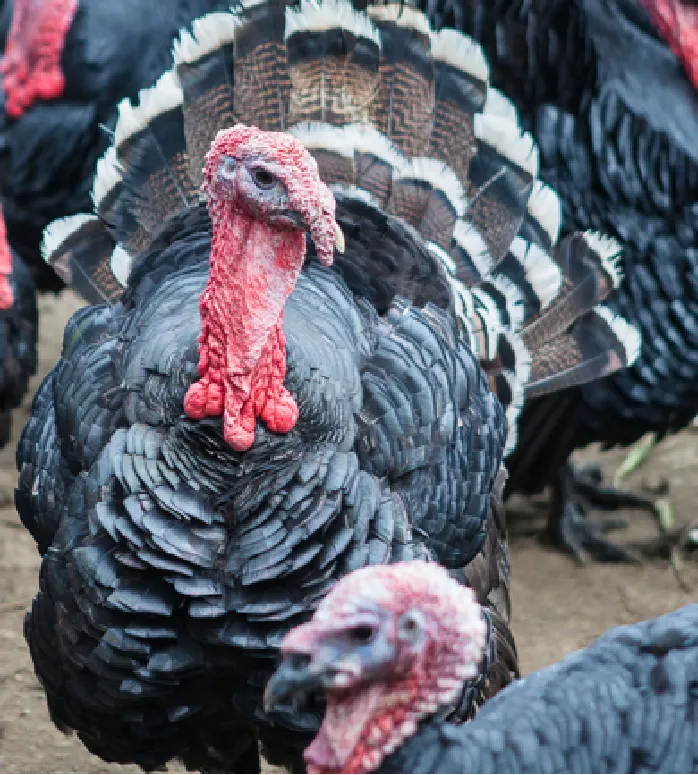 Origin Area: North Italy (Lombardia) Origin Area: North Italy (Lombardia)Weight (kg): F:2.1-3.2; M: 4.5-6.4 N. eggs/year: 47 Fertility: 77-78% Plumage: Black, bronzed, reticulated gray (common), bronzed with white wings. Description: Early and disease-resistant bird. Rural breeding, numerical consistency extremely small. | 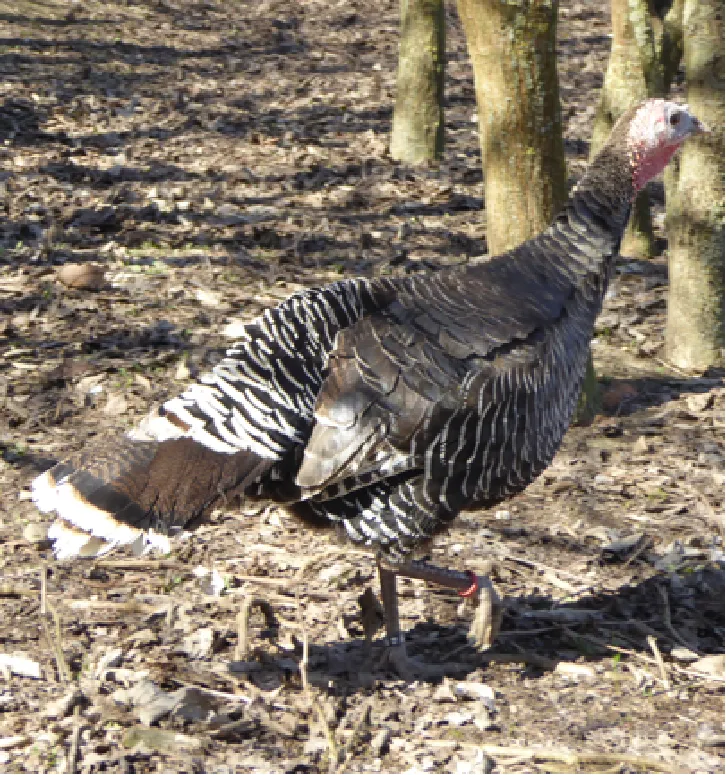 Origin Area: North-East Italy (Veneto) Origin Area: North-East Italy (Veneto)Weight (kg): F:3-3.5; M: 6-7 N. eggs/year: 70-100 Fertility: 92-93% Plumage: brilliant black with intense bronze reflections. Description: Rustic breed with a strong hatching attitude. Breeding in local areas. | 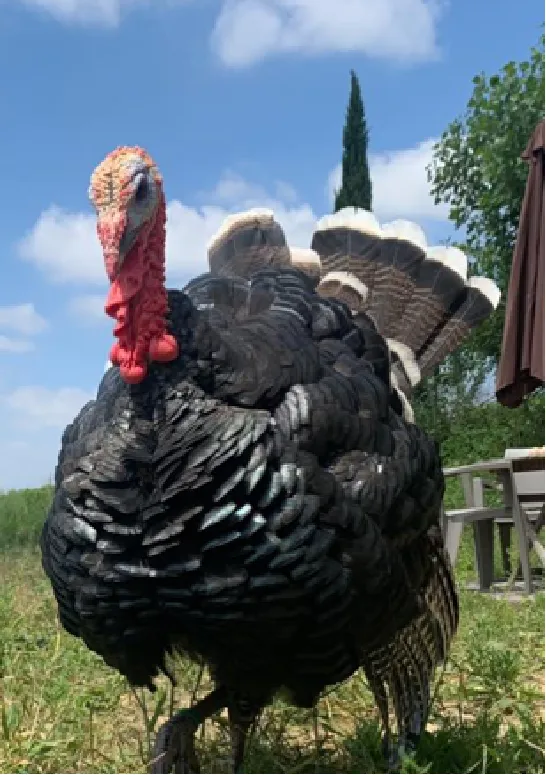 Origin Area: North-East Italy (Veneto) Origin Area: North-East Italy (Veneto)Weight (kg): F:3; M: 5 N. eggs/year: N/A Fertility: N/A Plumage: bronzed with metallic reflections. Description: Rustic breed with a strong hatching attitude. Local breeding, numerical consistency extremely small. | 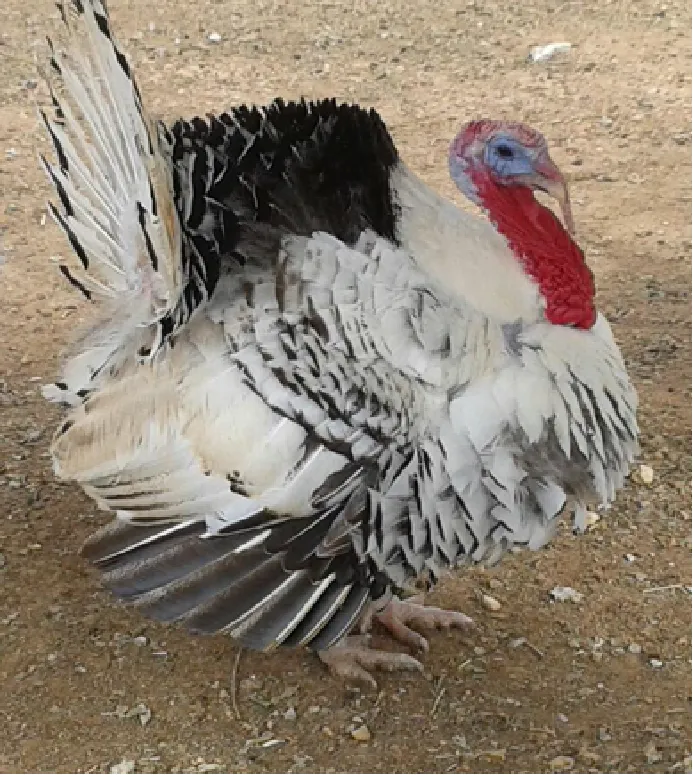 Origin Area: North-East Italy (Veneto) Origin Area: North-East Italy (Veneto)Weight (kg): F:4-6; M: 10-12 N. eggs/year: 70-80 Fertility: 86-92% Plumage: white with black streaks. Description: Rustic breed with slow growing excellent grazers. Breeding in local areas. |
| Nero Italiano (NI)* | Parma e Piacenza (PrPc)** | Mexican (MEX)*** | Narragansett (NARR)**; § |
 Origin Area: North Italy (Lombardia) Origin Area: North Italy (Lombardia)Weight (kg): F:2.1-3-9; M: 4.9-7.1 N. eggs/year: 41 Fertility: 84-85% Plumage: Black. Description: Rustic breed with a strong hatching attitude Breeding in local areas. | 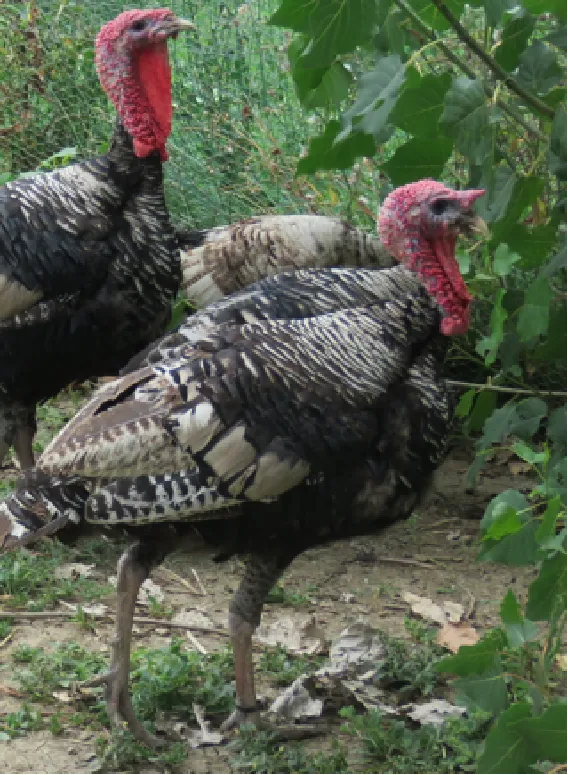 Origin Area: North Italy (Emilia Romagna) Origin Area: North Italy (Emilia Romagna)Weight (kg): F:6.5; M: 12 N. eggs/year: N/A Fertility: N/A Plumage: Steel gray with white streaks. Description: Local breeding, numerical consistency extremely small. | 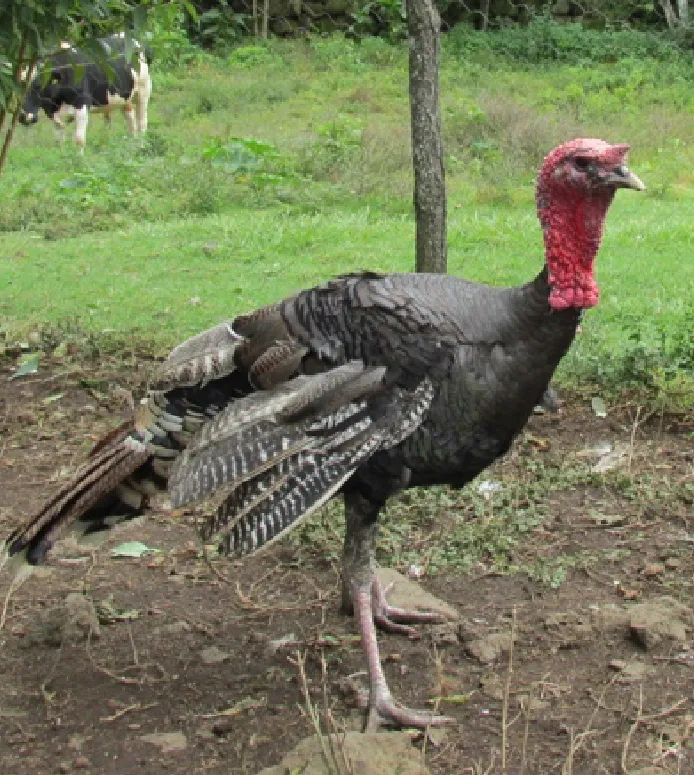 Origin Area: Mexico Origin Area: MexicoWeight (kg): F: 3.2; M: 5.7 kg N. eggs/year: N/A Fertility: N/A Plumage: Different colors. Description: Backyard birds. Unselected extremely variable in term of phenotype and production. | 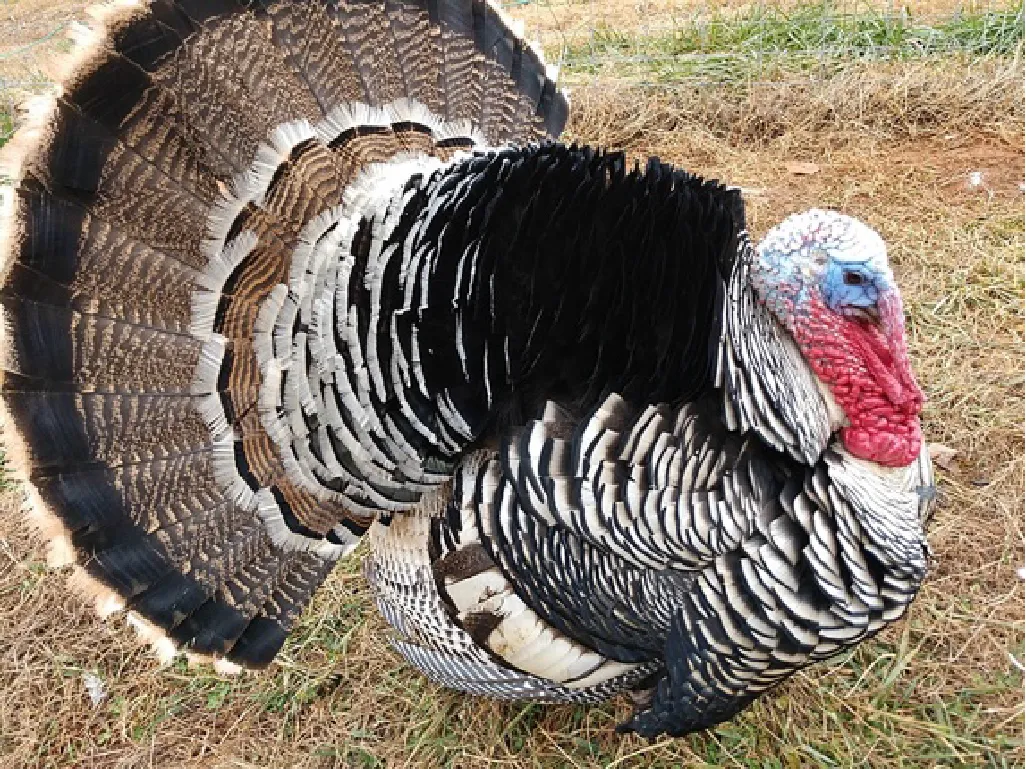 Origin Area: Rhode Island (USA) Origin Area: Rhode Island (USA)Weight (kg): F: 8.2; M: 15 kg N. eggs/year: N/A Fertility: N/A Plumage: Steel gray color. Description: Breeding in Europe and locally in Italy. |
Population name, sampling area, weight (kg) and plumage color of the turkey populations considered in the study.
*Data from: https://www.pollitaliani.it/portfolio-articoli/razze/; **Data from: http://www.agraria.org/tacchini/neroitalia.htm; *** Data from: Utrera et al. (2016); §Picture from: https://commons.wikimedia.org/wiki/File:Narragansett_Turkey,_male.jpg
In the last 40 years the intensive selection in turkey produced a fast-growing meat bird, a commercial hybrid (HYB). The selection for heavy turkey started presumably in North America and preferred the white pigmentation to other plumage colors (Christman and Hawes, 1999; Ekarius, 2007). Birds are selected according to a strong directional mating system to improve weight at slaughter and feed conversion efficiency. The hybrid population here used is a common commercial line of selected heavy turkey (white plumage) that reaches a weight of 20 kg or more in males.
Even though the directional selection occurring in European populations for more than 500 years determined that breeds differentiated in morphology and in performances, the European and central American populations share a common genetic background, because their common ancestral origin. This holds true also for commercial turkey line where, nevertheless, the intense directional selection performed in the last 40 years, affected dramatically the physiology, the adult weight, the growth rate, the behavior and the bird’s sociality respect to the wild type1.
The Copy Number Variants (CNVs) are genomic structural variants recognized to have an active role in gene regulation (Redon et al., 2006; Gamazon and Stranger, 2015) and capable to identify genomic variation among populations. Their use in identifying genomic variation among populations is particularly relevant as several authors found a large proportion (up to 60% in chicken) of mapped CNVs Regions (CNVRs) harboring annotated genes related to expressed phenotypes caused by the specific evolution occurred in the populations (Gorla et al., 2017; Drobik-Czwarno et al., 2018; Strillacci et al., 2018).
The goal of this study is to produce the first CNV map in the Turkey species (Meleagris gallopavo) using high-density SNP chip information in several populations—the Mexican turkey, the Narragansett, six Italian breeds—and a commercial hybrid, and to produce a GO analysis of annotated genes in the mapped CNVRs. The strong directional selection occurring in high-producing hybrids, the one that occurred in the differentiation of the Narragansett and the Italian Turkey breeds, and the adaptive selection in the Mexican turkey population is then discussed according to the genes harbored in the CNVRs. The second goal of this study is to identify the existing variability among the breeds and populations using the mapped CNV, since knowledge of their genomic variation can be used to interpret the phenotypic variability.
Materials and Methods
Sampling and SNP Chip Processing
A total of 115 biological samples from individuals belonging to six Italian breeds (Colle Euganei: CoEu – 22; Bronzato Comune Italiano: BrCI – 5; Parma e Piacenza: PrPc – 15; Brianzolo: BR – 32; Nero d’Italia: NI – 31; Ermellinato di Rovigo: ErRo – 10), 7 Narragansett turkeys, 38 commercial hybrids (HYB), 30 Mexican turkeys (MEX) were available from previous collections or deriving from other research projects and part of the University of Milan repository of animal samples. The University of Milan permit for the use of collected samples in existing bio-banks was released with n. OPBA-56-2016. The Mexican sample collection is part of the institutional Project “Identificación de los recursos genéticos pecuarios para su evaluación, conservación y utilización sustentable en México. Aves y cerdos. SIGI NUMBER 10551832012” coordinated with the activities of the Centro Nacional of Recursos Genéticos (CNRG) at Tepatitlán, Jalisco (México)2. Original owners of sampled individuals gave consent for re-use for research purposes. The study did not require any ethical approval according to national rules, according to EU regulation, as it does not foresee sampling from live animals.
The samples of the Italian breeds belong to individuals originally collected in different areas of North Italy (Veneto, Lombardia and Emilia Romagna), in nine small farms dedicated to the breeding of one or two breeds each. The MEX individuals were originally sampled across 12 different states of Mexico, characterized by various climatic and geographical environments. The individuals belong to backyard small groups, spread over many small farms. These birds, to the best of our knowledge, did not undergo any selection by the owners, who let them reproduce according to a naturally occurring random mating as they are raised as a backyard population. The Narragansett individuals were originally sampled from two family farms in North Italy. A brief description of each turkey population including a picture, the sampling geographical area, the plumage color, the adult body weight, and the fertility performance are reported in Table 1. The commercial hybrid comes from a unique farm in the Lombardia region in north Italy from the same batch of birds.
DNA extraction from feathers (Mexican samples) and blood (all others) samples were performed using ZR Genomic DNA™ Tissue MiniPrep (Zymo, Irvine, CA, USA) according to the procedures relative to different tissues. DNA was quantified using NanoQuant Infinite®m200 (Tecan, Männedorf, Switzerland) and diluted to 50 ng/μl. Samples were processed on the Axiom® Turkey Genotyping Array (Affimetrix) containing 634,067 SNPs. The Turkey_5.0 (GCA_000146605.1) genome assembly was used in this study as reference genome.
A quality control of raw intensity files using the standard protocol in the Affymetrix Power Tools package (www.affimetrix.com) was performed in order to guarantee high quality of obtained data. Default quality control settings, according to the manual (www.affimetrix.com), were applied to filter for low-quality samples, i.e. genotyping call rate <98% and Dish Quality Control <0.82.
CNVs Detection and Subsequent Analysis
The Log R Ratio (LRR) and the B allele frequency (BAF) values were obtained using the Axiom® CNV Summary Tool software. Outlier samples for LRR were identified using the SVS 8.4 software (Golden Helix Inc., Bozeman, MT, USA) through: i) the overall distribution of Derivative Log Ratio Spread (DLRS) values; and ii) screened according to GC content, which is correlated to a long-range waviness of LRR values by the wave detection factor algorithm as in Diskin et al. (2008).
The CNV detection was performed on the data of birds passing quality controls on 30 autosomes, using two different calling algorithms: i) the Copy Number Analysis Module of SVS3, and ii) the Hidden Markov Model of PennCNV software4. In order to reduce the false-positive calls a consensus map of CNV obtained by the two algorithms was produced.
The CNV calling performed with SVS has been obtained using the univariate analysis based on LRR values, with the following options: univariate outlier removal, a limit of not more than 100 segments per 10,000 markers with a minimum of three markers per segment, and 2,000 permutations per pair with a P-value cut off of 0.005, according to the SVS 8.4 user manual.
The PennCNV calling (Wang et al., 2007) was based on LRR and BAF values using the default parameters: standard deviation of LRR <0.30, BAF drift as 0.01 and waviness factor at 0.05, and a minimum of three SNPs required to define a CNV. In addition, as to reduce the false calling rate function of the hmm parameter file proper of PennCNV, the CNV call was obtained using three different “hmm” files (agre.hmm, affygw6.hmm, hh550.hmm). The online PennCNV manual describes that the agre.hmm file produces an excess of false-positive calls respect to the default affygw6.hmm file (both specific for Affymetrix SNP array), which instead is known to produce a low number of CNV calls (i.e. excess of false negative) with respect to other calling software and algorithms. The hh550.hmm file (specifically developed for Illumina SNP arrays) has been considered in the calling process, because is based on a SNPs chip density closest to the one used in this study.
After the four CNVs detections (i.e. one for each hmm file and the one from SVS8.4), the outputs were compared, at individual level and within each population, using the -intersectBed command of Bedtools software (Quinlan and Hall, 2010). For each individual, the consensus_CNVs were defined as the length of the DNA tract full overlapping across at least two detections. CNVs were classified in loss (0 and 1 from the PennCNV output) and in gain (3 and 4 from PennCNV output) and were constant across the different callings.
CNV regions (CNVRs) at population level were obtained by merging consensus_CNVs that overlap by at least 1 bp using the -megeBed command of Bedtools (Quinlan and Hall 2010) in at least two birds. The identified CNVRs were classified as “breed_CNVRs” and “shared_CNVRs”, when occurring in only one breed (i.e. BR, BrCl, CoEu, ErRo, NI and PrPc) or population (i.e. NARR MEX and HYB), or in at least two ones, respectively. CNVRs were classified within population in gain (all consensus_CNVs gain), loss (all consensus_CNV loss), and complex (consensus_CNVs both gain and loss). Singleton CNVs were considered also to be singleton CNVRs.
Genes were annotated within the CNVRs using the NCBI Turkey_5.0 gene dataset (annotation Release 102), and the Bedtools “-intersectBed” command was used to catalogue these genes to the corresponding regions. Gene Ontology terms (GO) and Kyoto Encyclopedia of Genes and Genomes (KEGG) pathway analyses were performed using the DAVID Bioinformatic Database5. Only LOC genes catalogued in NCBI Database as protein genes were considered.
Different approaches were used to disclose population structure and diversification of all turkey population. In order to provide the required input for different analyses two different matrices were built using CNV data: i) the first matrix (matrix_1) was built by assigning a value of “1” (presence of CNV), or “0” (normal state) to each sample-CNV for each CNVR, without considering the CNV state; ii) the second matrix (matrix_2) was built assigning the sample-CNV genotypes: “0” homozygous deletion, “1” heterozygous deletion, “2” normal state (absence of CNV in that region), “3” heterozygous duplication and “4” homozygous duplication. For details see Strillacci et al. (2018).
The Past software (Hammer et al., 2001) was employed to perform and visualize two principal component analyses (PCAs), the first based on the matrix_1 as input data, and the second based on matrix_2. In addition, two 3D PCAs were performed with the “rgl” package of R6 on PCAs results. The pvclust R package was utilized using the same matrixes to carry out two Hierarchical Clustering Analyses (HCA) applying 10,000 bootstraps (Suzuki and Shimodaira, 2006).
The STRUCTURE Software v.2.3.4 (Pritchard et al., 2000; Falush et al., 2003) was used to represent the population structure of the populations studied, on the basis of matrix_1. We used the STRUCTURE admixture model without the LocPrior option and setting 5,000 as burning period and 10,000 as iterations, performing five replicates for each K value from 2 to 20 and assuming nine different populations. Structure Harvester software (Dent and vonHoldt, 2012) was used to obtain the best K values, on the basis of STRUCTURE results, providing the DeltaK values according to the heuristic method reported by Evanno et al. (2005). The STRUCTURE PLOT software (Ramasamy et al., 2014) was employed to graphically visualize each cluster assignment of the K obtained.
Results
CNVs and CNVRs Maps
A total of 13 samples (5 NI, 2 PrPc, 4 MEX, 1 ErRo and 1 BR) were excluded during quality assurance: three because of high DLRS values, seven because of wave factor values, and three for their exceptionally high number of called CNVs. Consequently, the final CNV dataset was used for genomic variation analyses comprised a total of 177 turkeys.
The total number of CNVs called was 2,987 (Supplementary Table 1) and varied in terms of number and size among the individuals of each population, as reported in Table 2. CNVs ranged from 819 bp to 453.5 kb in size with an average length of 115.2 kb, covering a total length of about 41 Mb (4.65%) of the turkey genome (chromosomes 1–30). The BrCl and the HYB showed shorter average CNVs with respect to other populations, while in the MEX one the longest average CNVs length was found. The HYB birds are also the most homogeneous for the average length of CNVs (Figure 1). The MEX breed is the one with the largest number of CNVs per individual (i.e. 28) while the HYB is the one with the lowest (i.e. 10).
Table 2
| Breed | N. of samples | N. CNVs | CNV per sample Min-Max (average) | Loss (0/1)* | Gain (3/4)* | Min length | Max length | Mean length | Coverage | Total Coverage (%) |
|---|---|---|---|---|---|---|---|---|---|---|
| BR | 31 | 412 | 4-34 (13) | 185 | 227 | 1,221 | 214,517 | 15,715 | 6,474,485 | 0.73 |
| BrCl | 5 | 63 | 6-24 (12) | 38 | 25 | 1,271 | 25,586 | 7,357 | 463,483 | 0.05 |
| CoEu | 22 | 354 | 8-37 (16) | 191 | 163 | 1,096 | 184,966 | 11,762 | 4,163,692 | 0.47 |
| ErRo | 9 | 135 | 8-30 (10) | 53 | 82 | 1,221 | 362,781 | 11,569 | 1,561,859 | 0.18 |
| NI | 26 | 567 | 6-69 (22) | 192 | 375 | 1,096 | 283,259 | 12,436 | 7,038,934 | 0.8 |
| PrPc | 13 | 232 | 7-42 (18) | 85 | 147 | 1,328 | 230,199 | 16,307 | 3,783,129 | 0.43 |
| NARR | 7 | 96 | 10-22 (14) | 51 | 45 | 1,301 | 83,743 | 13,105 | 1,258,113 | 0.14 |
| MEX | 26 | 734 | 12-49 (28) | 245 | 489 | 819 | 453,485 | 16,979 | 12,462,363 | 1.41 |
| HYB | 38 | 394 | 4-20 (10) | 128 | 266 | 1,070 | 62,316 | 9,964 | 3,935,744 | 0.45 |
| Total | 177 | 2,987 | 4-69 (17) | 1,168 | 1,819 | 819 | 453,485 | 115,194 | 41,141,802 | 4.65 |
Summary of CNVs identified in each population.
*0 = homozygous deletion, 1 = heterozygous deletion, 3 = heterozygous duplication, and 4 = homozygous duplication.
Figure 1
Duplications were higher than deletions in the majority of populations except for BrCI, CoEu, and NARR breeds, where the ratio gain/loss (losses are the sum of the total copy numbers 0 and 1; gains are the sum of the total copy numbers 3 and 4) are inverted as shown in Figure 1. The gain/loss ratio is similar in HYB, MEX, NI, and PrPc populations (about 65% vs. 35%), but the proportion of duplication and deletion are differently represented in the other populations. The CNVRs including at least 2 individuals were 362 counting 189 gains, 116 losses, and 57 complexes and their distribution on the chromosomes is shown in Figure 1.
Statistics of CNVRs for each population are reported in Table 3. A total of 1,659 CNVRs (OverAll) were obtained across all populations with 412 Loss, 1,190 Gain, and 57 Complex.
Table 3
| Breed | CNVR | Loss | Gain | Complex | Min length | Max length | Mean length | Coverage | Total Coverage (%) |
|---|---|---|---|---|---|---|---|---|---|
| BR | 223 | 53 | 168 | 2 | 1,221 | 214,517 | 12,293 | 2,741,386 | 0.31 |
| BrCl | 47 | 24 | 23 | 0 | 1,383 | 25,586 | 7,063 | 331,977 | 0.04 |
| CoEu | 195 | 56 | 138 | 1 | 1,096 | 186,030 | 10,542 | 2,055,612 | 0.23 |
| ErRo | 108 | 79 | 29 | 0 | 1,221 | 362,781 | 12,634 | 1,364,494 | 0.15 |
| NI | 358 | 58 | 293 | 7 | 1,096 | 283,259 | 15,186 | 5,436,564 | 0.62 |
| PrPc | 186 | 59 | 126 | 1 | 1,328 | 230,199 | 14,029 | 2,609,445 | 0.30 |
| NARR | 77 | 39 | 38 | 0 | 1,301 | 83,743 | 11,494 | 885,013 | 0.10 |
| MEX | 575 | 185 | 385 | 5 | 843 | 453,485 | 15,864 | 9,122,023 | 1.03 |
| HYB | 243 | 59 | 181 | 3 | 1,070 | 62,316 | 8,830 | 2,145,688 | 0.24 |
| OverAll | 1,659 | 412 | 1190 | 57 | 843 | 453,485 | 13,612 | 22,581,871 | 2.55 |
Summary of CNVRs identified for each turkey’s population.
Details on CNVRs are reported in Supplementary Table 2 for those including at least two individuals and detected across breeds, i.e. shared_CNVRs. The 1,297 singleton CNVRs, representing 64% of all detected ones are listed in the Supplementary Table 3. Supplementary Figure 1 shows the distribution of singleton among breeds/populations and the distribution of loss and gain across all populations and by breed/population. The largest proportion of CNVRs resulted in gain, i.e. 77% across all breeds/populations, with a proportion of singletons of 64%. This result is consistent with the proportion of singleton identified in chickens by others (Yi et al., 2014; Gorla et al., 2017).
The Venn diagram (Heberle et al., 2015) shown in Figure 2 represents the amount of CNVRs shared among the populations, grouping them as ITA (all Italian breeds), NARR (the Narragansett), MEX (the Mexican turkey population), and HYB (the commercial cross). The reason of this grouping resides in the type of evolution of the populations: the Italian breeds are all highly selected for breed standard phenotypes and possibly highly inbred; the Mexican population has been under an outbreeding mating system, with no directional selection undertaken for centuries; the NARR is a cross between the wild American turkey and the US domestic Bronze turkey; the HYB is a commercial population obtained by a strong directionally selection for heavy body weight. Three CNVRs resulted as common to all populations and a large proportion of ITA CNVRs are shared with MEX and HYB—65 and 42 CNVRs, respectively.
Figure 2
In Table 4 the details of the 32 CNVRs detected in at least 10 samples and the genes lying in the same regions are reported. Among those, the three regions in common to all turkey populations, as shown also in Figure 2, are located on chr3 at 92,889,953–92,936,492 (CNVR_1126, gain), on chr4 at 26,993–164,704 (CNVR_1240, gain), and on chr4 at 68,446,449–68,522,752 (CNVR_1371, complex). In the CNVR_1371, the one also found in the largest number of individuals from all breeds, the CD8A gene that is related to immune and inflammatory response is annotated (Li et al., 1999). In the other two common regions, CNVR_1126 and the CNVR_1240, the FK1L and the TLR2A gene are annotated, respectively, and involved in immune and inflammatory response and in feather keratin multigene family with implication in feather evolution (Li et al., 2013; Velová et al., 2018).
Table 4
| N_CNVR | Chr | CNVR start | CNVR end | CNVR length | ITA | NARR | MEX | HYB | Total Samples | CNVR state | Genes | Trait by gene: (species) | References | |||||
|---|---|---|---|---|---|---|---|---|---|---|---|---|---|---|---|---|---|---|
| BR | BrCl | CoEu | ErRo | NI | PrPc | |||||||||||||
| CNVR_113 | 1 | 46402671 | 46430314 | 27643 | 1 | 17 | 18 | gain | ||||||||||
| CNVR_126 | 1 | 52847470 | 52853786 | 6316 | 9 | 4 | 13 | loss | ||||||||||
| CNVR_163 | 1 | 76320966 | 76430128 | 109162 | 6 | 8 | 7 | 2 | 23 | gain | OVSTL, TCRb1 | OVSTL: eggshell calcified layer (quail) | Mann and Mann, 2015 | |||||
| CNVR_206 | 1 | 98886764 | 98931838 | 45074 | 2 | 17 | 19 | loss | ||||||||||
| CNVR_210 | 1 | 99904908 | 99927304 | 22396 | 9 | 1 | 1 | 1 | 12 | loss | ||||||||
| CNVR_307 | 1 | 145466178 | 145680695 | 214517 | 9 | 1 | 1 | 11 | complex | |||||||||
| CNVR_757 | 2 | 30461083 | 30521978 | 60895 | 9 | 4 | 13 | complex | ||||||||||
| CNVR_780 | 2 | 42604981 | 42606860 | 1879 | 9 | 1 | 2 | 1 | 13 | loss | ||||||||
| CNVR_809 | 2 | 57899261 | 57923296 | 24035 | 1 | 5 | 4 | 10 | complex | |||||||||
| CNVR_843 | 2 | 72167387 | 72173022 | 5635 | 10 | 4 | 4 | 18 | loss | |||||||||
| CNVR_920 | 2 | 101084671 | 101088748 | 4077 | 1 | 2 | 6 | 1 | 4 | 14 | loss | |||||||
| CNVR_1088 | 3 | 20396386 | 20399251 | 2865 | 10 | 18 | 11 | 39 | loss | |||||||||
| CNVR_1152 | 3 | 54655570 | 54693060 | 37490 | 1 | 2 | 10 | 13 | complex | OPN5L1 | ||||||||
| CNVR_1226 | 3 | 92889953 | 92936492 | 46539 | 1 | 1 | 1 | 1 | 1 | 6 | 4 | 15 | gain | FK1L | ||||
| CNVR_1240 | 4 | 26993 | 164704 | 137711 | 2 | 1 | 3 | 2 | 2 | 5 | 3 | 18 | gain | TLR2A | host immune response (Birds) | Velová et al., 2018 | ||
| CNVR_1243 | 4 | 1581791 | 1620844 | 39053 | 2 | 9 | 11 | gain | GRIA2 | |||||||||
| CNVR_1246 | 4 | 3011587 | 3071312 | 59725 | 5 | 2 | 1 | 4 | 12 | complex | FSTL5 | |||||||
| CNVR_1259 | 4 | 8948522 | 8954649 | 6127 | 12 | 5 | 17 | loss | ||||||||||
| CNVR_1357 | 4 | 63830569 | 63837531 | 6962 | 21 | 19 | 24 | 1 | 65 | loss | ||||||||
| CNVR_1358 | 4 | 63850913 | 63854111 | 3198 | 19 | 19 | 23 | 1 | 62 | loss | ||||||||
| CNVR_1371 | 4 | 68446449 | 68522752 | 76303 | 4 | 4 | 13 | 7 | 13 | 2 | 2 | 7 | 16 | 68 | complex | CD8A | host immune and inflammatory response (Poultry) | Yi et al., 2014 |
| CNVR_1408 | 5 | 15840153 | 15842835 | 2682 | 3 | 10 | 1 | 4 | 18 | loss | ||||||||
| CNVR_1586 | 7 | 28038559 | 28062433 | 23874 | 2 | 1 | 1 | 2 | 2 | 5 | 2 | 15 | gain | |||||
| CNVR_1598 | 8 | 3846585 | 3850061 | 3476 | 1 | 8 | 1 | 2 | 2 | 14 | loss | PRKG1 | feeding efficiency (bovine) | Taye et al., 2017 | ||||
| CNVR_465 | 1.1.32 11 | 1.1.33 1004126 | 1.1.34 1053713 | 1.1.35 49587 | 1.1.36 1 | 2 | 1 | 2 | 6 | 12 | gain | HNRNPL | ||||||
| CNVR_488 | 11 | 18985991 | 19015763 | 29772 | 6 | 1 | 1 | 3 | 1 | 12 | complex | LMAN1, CPLX4 | LMAN1: feed efficiency and feeding behavior (pig) | Reyer et al., 2017 | ||||
| CNVR_644 | 16 | 4206442 | 4209316 | 2874 | 12 | 11 | 1 | 24 | loss | GRIN2A | ||||||||
| CNVR_970 | 21 | 5878926 | 5903943 | 25017 | 5 | 3 | 2 | 10 | loss | |||||||||
| CNVR_987 | 22 | 5386977 | 5429908 | 42931 | 2 | 1 | 1 | 2 | 4 | 10 | gain | SLC52A3, RSPO4, SRXN1 | ||||||
| TCF15 | growth (bovine) | Paredes-Sánchez et al., 2015 | ||||||||||||||||
| FAM110A | growth (human, bovine) | Espigolan et al. (2015) | ||||||||||||||||
| ANGPT4 | birth weight (human) | Turan et al. (2012) | ||||||||||||||||
| SCRT2 | self- reported helping behavior (human) | Primes and Fieder (2018) | ||||||||||||||||
| CNVR_1003 | 24 | 2359444 | 2545474 | 186030 | 1 | 12 | 13 | gain | TACC1, PLEKHA2, TM2D2, ADAM9, IDO2, C24H8orf, ZMAT4 | (all genes) residual feed intake (bovine) | Hardie et al. (2017) | |||||||
| CNVR_1024 | 26 | 6388747 | 6431016 | 42269 | 1 | 2 | 19 | 22 | gain | |||||||||
| CNVR_1025 | 27 | 157671 | 192870 | 35199 | 1 | 5 | 10 | 16 | gain | VPS45, NUPL2 | ||||||||
List of the CNVRs mapped in at least 10 birds with chromosome, start bp, end bp, CNVR length and CNVR state. For each of the CNVRs the count of birds for each population (ITA, NARR, MEX, HYB) is reported together with their total. The genes annotated in the each region are listed with the trait of interest and the reference.
The other two regions are shared by a large number of individuals of ITA breeds and have been detected on chr4 at 63,830,569–63,854,111 in CNVR_1357 (62 birds from ITA breeds) and CNVR_1358 (65 birds from ITA breeds). These two regions are both a loss, are very close on the genome being 13,382 bp apart, and have been detected in almost the same samples of the same ITA breeds. No genes are annotated within these two CNVRs. Ten CNVRs in Table 4 are common to ITA and MEX, five common to ITA and HYB, and only one in common between ITA and NARR. Among these regions, nine of them include genes (CNVR_163, CNVR_1243, CNVR_1246, CNVR_1598, CNVR_488, CNVR_644, CNVR_987, CNVR_1025). There are no regions shared only among HYB, NARR, and MEX.
The Venn diagram in Figure 2 shows in detail the distribution of CNVRs among the six Italian breeds. It is worthy to mention that the gene CD8A is in a CNVR common to all the Italian breeds (in the red circle).
Among the 362 CNVRs a total of 140 were mapped only in one specific population, the breed_CNVRs, as reported in Supplementary Table 4. The mapped genes in any species and the corresponding references for each association studies, the associated phenotypes and the organism involved, are also indicated.
The largest number of breed_CNVRs occurred in the MEX turkey population with 45 regions followed by the NI with 33. The lowest number of breed_CNVRs was found in the BrCI and in the NARR with one and four breed_CNVRs respectively. The number of genes annotated in the breed_CNVRs was 26 and 21 in MEX and NI, while the number of genes in breed_CNVR in other populations was between one and eight. The gene IMMPL2 is harbored by two breed_CNVRs, one in the BI (CNVR_69) and one in the NI (CNVR_70). The two regions are very close even if they do not overlap.
The results of the GO TERM and KEGG pathway analyses obtained using DAVID considering the genes found in the 362 shared_CNVRs are reported in the Supplementary Table 5 into clustered and not clustered groups of genes.
Supplementary Table 6 contains the information generated from the KEGG and GO Term analyses using DAVID from breed_CNVRs. The information was obtained using Meleagris gallopavo as background species and integrated and confirmed using the Gallus gallus as background, in case of absence of complete information for the Meleagris gallopavo species.
Genetic Variability Across Turkey Populations
Two clustering analysis were performed based on two different matrices (matrix_1 and matrix_2) described herein before. Both the cluster dendrograms, Figure 3 based on matrix_1 and Figure 4 based on matrix_2, showed distinct clades grouping animals belonging to the same populations. It is interesting to note that MEX and NARR always clustered very close. Also, Italian breeds and the Hybrid group form well distinct clusters according to their origin.
Figure 3
Figure 4
In all the PCAs graphs in Figures 3B, C and 4B, C the clustering results show two main clades: NARR, MEX, and HYB were grouping closer, while the ITA breeds clustered in a separate one.
The STRUCTURE software was employed to infer population structure and gene flow of the individuals of the nine populations studied. We calculate a number of K from K = 2 to K = 20 to identify the true number of possible clusters (subpopulation) in which it is possible to divide the populations. The estimated likelihood [LnP (D)] values were used to find the ΔK to distinguish the break in slope of the distribution of LnP (D) values at the true K. The analyses identify K = 13 as the best likely K value, suggesting that the population could be divided into 13 genetic groups.
Even though K = 5 shows the second higher value (Supplementary Figure 2) it is not possible to well differentiate the populations as in K = 13. In fact, for K = 2 to K = 12 it is not possible to assign each population to a clear distinct cluster, while for K = 14 to K = 20 the high level of admixture in each of the population results in nonsignificant successive clustering.
Discussions
The results from this study are likely reflecting the human action on turkey populations, i.e., its migration to Europe and then back to America, and the directional selection occurring in the last 40 years to produce a fast-growing heavy bird.
The study considers three main groups of birds that reproduce and adapt according to different constraints and environmental conditions. The MEX population developed in a natural environment, with no (or very little) intervention by humans in mating and with no (or very little) supplement of feed and harsh rearing conditions. The Italian populations are the result of a phenotypic selection operated by individual farmers in their small group of individuals and operated to obtain birds that best perform in the semi-extensive farming system (backyard with recovery availability and feeding supplement) that characterized the middle ages poultry system of Italy and Europe. The HYB population, in the last 40 years, has been heavily directionally selected, through very well-structured genetic improvement and breeding plans to improve weight and growing performances and to best perform in an artificially controlled environment with unlimited feed supplement.
Our study is the first CNV mapping in a worldwide turkey sampling, from populations collected across different continents, and disclosed similarities and variation in CNVs and CNVRs across the populations studied. Because of the diversity in their breeding history and actual farming environmental conditions the MEX, ITA, and HYB populations provide an interesting model to investigate CNV variation, and their relation to gene expression and rearing conditions. The CNVs, in fact, are widely recognized to be a non-neutral genomic structural variation related to positive and directional selection. The CNV has been recently successfully used in poultry to differentiate breeds and populations with different genetic background (Gorla et al., 2017; Strillacci et al., 2017; Sohrabi et al, 2018), as well as in other species (Xu et al., 2016; Strillacci et al., 2018). Interestingly in chicken Sohrabi et al. (2018) discuss long-term adaptation of animals to rural and hard rearing conditions in relation to a specific expressed trait linked to a CNV identified in the Creeper indigenous chicken local population that is adapted to the harsh environmental condition of southeastern Iran. Additionally, a recent study on a eukaryotic model (Hull et al., 2017) showed that environmental changes are accelerating adaptation through the stimulation of copy number variation and that this is not a random effect but has a cause-effect relationship. Perry et al. (2007) also demonstrated that directional selection due to starch diet (i.e. environmental factor) is increasing specific copies of the genes involved in starch metabolism producing as such CNV gains. The CNV difference among populations here is shown in particular by the variation in the number of CNV per bird that is the lowest in the HYB (10 on average) and the largest in the MEX (28 CNV) and by the CNV length that in the HYB is much less variable than in the other two group (ITA and MEX) of birds. These findings support the hypothesis that the variability in CNV (size and number), as in the MEX vs. the HYB, is possibly related to the different breeding and selection underwent in these populations and to the environmental conditions where they were farmed: MEX very harsh rearing, HYB controlled artificial environment and ad libitum feeding. The same holds true for the ITA vs. MEX and HYB.
Most of the genes found do not show previous associations with any specific function or pathway in turkey, since association studies in turkey are only few, but most of those genes have been previously studied and linked to functions in other species such as chicken, pig, bovine, birds, mice, zebrafish and human, as reported in Supplementary Table 4.
Thirty-two regions were detected in at least 10 individuals, and 14 of them include 29 genes that are known to be involved in different traits in different species (Table 4), such as immune response (TLR2A and CD8A), feather evolution (FK1L), feed efficiency (PRKG1 and LMAN1), growth traits (TCF15, FAM110A), and residual feed intake (TACC1, PLEKHA2, TM2D2, ADAM9, IDO2, C24H8orf4, ZMAT4), as reported in Table 4.
There are three CNVRs in common among all the populations; one of them harbors the CD8A gene, which is known to have a role in the host immune and inflammatory response in chicken (Li et al., 1999). The polymorphism of the CD8A gene has been studied in five lines of turkey populations by Li et al. (1999) who found a loss of this gene in one half of the turkey of a studied line. This loss can be related to the CNVR_1371 found in this study where 34 CNVRs were loss and 34, gain. All the ErRo resulted to have a loss—CoEu had 12 loss (over 13 birds), BrCI 4 loss (over five birds), while other populations have a more balanced representation between loss and gain CNVs.
The TLR2A gene has been shown to be involved in the bird’s evolution with a strong driving of TLR due to positive selection (Velová et al., 2018). It is interesting to note that our results show that CNVR_1240 include the TLR2A gene with only normal and gain state. Even if the question of the adaptive value of the TLR genetic variation is still unresolved, the results found here are supporting the hypothesis that positive selection is driving the evolution of the gene towards duplication of copies as proposed recently by Velová et al. (2018).
Other genes in the CNVRs found here (Supplementary Table 4) are associated with immunity and inflammatory response in mice (TCF7, ARHGEF5), chicken (VMO1, GUCY1A2, NBN), bovine (NEK11), and in all species (PARP15) as reported in previous studies (Wang et al., 2009; Daugherty et al., 2014; Strillacci et al., 2014; Jang et al., 2015; Lim and Song 2015; Zhu et al., 2015; Saelao et al., 2018; Velová et al., 2018). Among the genes reported in the Supplementary Table 4, the IMMP2L gene lies in CNVR_69 which is common to NI and BR. This gene was associated with fertility in mice (Bharadwaj et al., 2014) and with collective behavior in zebrafish (Tang et al., 2018). The presence of this gene in a gain CNVR may have some link with the typical collective behavior of the turkey.
Conclusions
This study represents the first CNV mapping using high-density SNP chip on turkey. It provides first insights into the genomic architecture of the turkey population, laying the groundwork for future structural variation investigation in turkey species. In this study we have focused on the CNV, a structural variation linked to phenotypic expression regulation, in order to identify similarities across populations of the structural genome covered by this large variation.
The turkey populations are a unique resource to identify evolutionary processes affecting the structural genome since it is possible to access to populations under positive selection only and, on the other extreme, under heavy artificial selection. The most complete isolation of the MEX turkey population and the European ones together to the HYB provide a unique model to disclose the effect of the adaptation to environment and directional artificial selection performed by humans on the structural genome.
Funding
This research was co-funded by projects M01678 and 2016-PGR00206 - Ministries of Foreign Affairs of Italy and Mexico. Internal funding of the Università degli Studi di Milano
Statements
Data availability statement
The raw data supporting the conclusions of this manuscript are included in the Supplementary Materials.
Ethics statement
The animal study was reviewed and approved by Università degli Studi di Milano - OPBA-56-216.
Author contributions
MS, AB, and SR-P conceptualized and designed the work. SC, SR-P, MS, AR-U, and MM-B collected the sample and data. MS and EG analyzed and interpreted the data. MS and AB wrote the manuscript. AG-R, MM-B, SR-P and VV-M made a critical revision of the manuscript. All authors have approved the final version of manuscript to be published.
Acknowledgments
The authors gratefully acknowledge the original owners of the studied turkey samples. Allevamento ColleGallo is gratefully acknowledged for providing the picture of the Colli Euganei breed.
Conflict of interest
The authors declare that the research was conducted in the absence of any commercial or financial relationships that could be construed as a potential conflict of interest.
Supplementary material
The Supplementary Material for this article can be found online at: https://www.frontiersin.org/articles/10.3389/fgene.2019.00982/full#supplementary-material
Supplementary Figure S1Statistics of Singleton regions (A) Singleton % according to populations; (B) Singleton % according to state; (C) Graphical representation of Singleton % according to state and populations.
Supplementary Figure S2(A) Plot representing the number of K groups that best fit the data; (B) Structure plot representing the degree of admixture among all the individuals of the nine populations considered for the two best K (K = 13 and K = 5).
Supplementary Table S1CNVs identified in each Turkey population.
Supplementary Table S2CNVRs with at least 2 individuals and detected in more than one turkey population.
Supplementary Table S3Singleton CNVRs.
Supplementary Table S4CNVRs with at least 2 individuals and detected only in one population (breed_CNVRs) (sheet1); References related to sheet1 (sheet2).
Supplementary Table S5Gene annotation performed using DAVID Database. Sheet1 = clustered genes; Sheet2: non-clustered genes.
Supplementary Table S6Annotation of all genes mapping within the breed_CNVRs.
Footnotes
1.^https://www.coe.int/t/e/legal_affairs/legal_co-operation/biological_safety_and_use_of_animals/farming/Rec%20Turkeys.asp
2.^http://www.inifap.gob.mx/SitePages/centros/cnrg.aspx
4.^http://penncnv.openbioinformatics.org/en/latest/
References
1
BharadwajM. S.ZhouY.MolinaA. J.CriswellT.LuB. (2014). Examination of bioenergetic function in the inner mitochondrial membrane peptidase 2-like (Immp2l) mutant mice. Redox Biol.2, 1008–1015. doi: 10.1016/j.redox.2014.08.006
2
BoijeH.Harun-Or-RashidM.LeeY. J.ImslandF.BruneauN.VieaudA.et al. (2012). Sonic Hedgehog-signalling patterns the developing chicken comb as revealed by exploration of the pea-comb mutation. PLoS One.7 (12), e50890. doi: 10.1371/journal.pone.0050890
3
CavalchiniL. G. (1983). IL TACCHINO allevamento, incubazione, patologia Vol. 1 Edition. Edagricole, Italy. 304 pages.
4
ChristmanC. J.HawesR. O. (1999). Birds of a Feather: Saving Rare Turkeys from Extinction. ALBC, Pittsboro, NC, USA.
5
CondroM. C.WhiteS. A. (2014). Recent advances in the genetics of vocal learning. Comp. Cogn. Behav. Rev.9, 75–98. doi: 10.3819/ccbr.2014.90003
6
CrawfordR. D. (1992). Introduction to Europe and diffusion of domesticated turkey from the America. Arch. Zootec.41, 307–314. doi: 10.1007/978-1-4615-3426-6_27
7
DaughertyM. D.YoungJ. M.KernsJ. A.MalikH. S. (2014). Rapid evolution of PARP genes suggests a broad role for ADP-ribosylation in host-virus conflicts. PLoS Genet.10 (5), e1004403. doi: 10.1371/journal.pgen.1004403
8
DayA. E.QuilterC. R.SargentC. A.MilehamA. J. (2002). Characterization of the porcine sperm adhesion molecule gene SPAM1–expression analysis, genomic structure, and chromosomal mapping. Anim Genet.33 (3), 211–214. doi: 10.1046/j.1365-2052.2002.00830.x
9
DentE. A.von HoldtB. M. (2012). STRUCTURE HARVESTER: a website and program for visualizing STRUCTURE output and implementing the Evanno method. Cons. Genet. Res.4 (2), 359–361. doi: 10.1007/s12686-011-9548-7
10
DiskinS. J.LiM.HouC.YangS.GlessnerJ.HakonarsonH.et al. (2008). Adjustment of genomic waves in signal intensities from whole-genome SNP genotyping platforms. Nucleic. Acids. Res.36, e126. doi: 10.1093/nar/gkn556
11
Drobik-CzwarnoW.WolcA.FultonJ.DekkersJ. C. (2018). Detection of copy number variations in brown and white layers based on genotyping panels with different densities. Genet. Sel. Evol.50 (1), 54. doi: 10.1186/s12711-018-0428-4
12
EkariusC. (2007). “Storey's Illustrated Guide to Poultry Breeds,” in Carol Ekarius, vol. 1 edition. (LLC: Storey Publishing).
13
EspigolanR.BaldiF.BoligonA. A.SouzaF. R.Fernandes JúniorG. A.GordoD. G.et al. (2015). Associations between single nucleotide polymorphisms and carcass traits in Nellore cattle using high-density panels. Genet. Mol. Res.14 (3), 11133–11144. doi: 10.4238/2015.September.22.7
14
EvannoG.RegnautS.GoudetJ. (2005). Detecting the number of clusters of individuals using the software STRUCTURE: A simulation study. Mol. Ecol.14 (8), 2611–2620. doi: 10.1111/j.1365-294X.2005.02553.x
15
FangM.DuH.HuY.ZhouX.OuyangH.ZhangW.et al. (2011). Identification and characterization of the pig ABIN-1 gene and investigation of its association with reproduction traits. J. Genet.90 (1), e10–e20. doi: 10.1007/s12041-011-0025-6
16
FalushD.StephensM.PritchardJ. K. (2003). Inference of population structure using multilocus genotype data: linked loci and correlated allele frequencies. Genetics164 (4), 1567–1587
17
GorlaE.CozziM. C.Román-PonceS. I.Ruiz LópezF. J.Vega-MurilloV. E.CeroliniS.et al. (2017). Genomic variability in Mexican chicken population using copy number variants. BMC Genetics18 (1), 61. doi: 10.1186/s12863-017-0524-4
18
GamazonE. R.StrangerB. E. (2015). The impact of human copy number variation on gene expression. Brief. Funct. Genomics14 (5), 352–357. doi: 10.1093/bfgp/elv017
19
HammerØ.HarperD. A. T.RyanP. D. (2001). PAST: Paleontological statistics software package for education and data analysis. Palaeontol. Electronica4 (1), 9.
20
HardieL. C.VandeHaarM. J.TempelmanR. J.WeigelK. A.ArmentanoL. E.WiggansG. R.et al. (2017). The genetic and biological basis of feed efficiency in mid-lactation Holstein dairy cows. J. Dairy. Sci.100 (11), 9061–9075. doi: 10.3168/jds.2017-12604
21
HeberleH.MeirellesG. V.da SilvaF. R.TellesG. P.MinghimR. (2015). InteractiVenn: a web-based tool for the analysis of sets through Venn diagrams. BMC Bioinf.16, 169. doi: 10.1186/s12859-015-0611-3
22
HullR. M.CruzC.JackC. V.Houseley.J. (2017). Environmental change drives accelerated adaptation through stimulated copy number variation. PLoS Biol.15 (6), e2001333. doi: 10.1371/journal.pbio.2001333
23
JangH. J.LeeH. J.KangK. S.SongK. D.KimT. H.SongC. S.et al. (2015). Molecular responses to the influenza A virus in chicken trachea-derived cells. Poult. Sci.94 (6), 1190–1201. doi: 10.3382/ps/pev033
24
LetunicI.BprkP. (2016). Interactive tree of life (iTOL) v3: an online tool for the display and annotation of phylogenetic and other trees. Nucleic Acids Res.44 (W1), W242–W245. doi: 10.1093/nar/gkw290
25
LiY. I.KongL.PontingC. P.HaertyW. (2013). Rapid evolution of Beta-keratin genes contribute to phenotypic differences that distinguish turtles and birds from other reptiles. Genome Biol. Evol.5 (5), 923–933. doi: 10.1093/gbe/evt060
26
LiZ.NestorK. E.SaifY. M.FanZ.LuhtalaM.VainioO. (1999). Cross-reactive anti-chicken CD4 and CD8 monoclonal antibodies suggest polymorphism of the turkey CD8alpha molecule. Poult. Sci.78 (11), 1526–1531. doi: 10.1093/ps/78.11.1526
27
LimW.SongG. (2015). Differential expression of vitelline membrane outer layer protein 1: hormonal regulation of expression in the oviduct and in ovarian carcinomas from laying hens. Mol. Cell Endocrinol.399, 250–258. doi: 10.1016/j.mce.2014.10.015
28
LovellP. V.CarletonJ. B.MelloC. V. (2013). Genomics analysis of potassium channel genes in songbirds reveals molecular specializations of brain circuits for the maintenance and production of learned vocalizations. BMC Genomics14, 470. doi: 10.1186/1471-2164-14-47.
29
MannK.MannM. (2015). Proteomic analysis of quail calcified eggshell matrix: a comparison to chicken and turkey eggshell proteomes. Proteome Sci.13, 22. doi: 10.1186/s12953-015-0078-1
30
Paredes-SánchezF. A.Sifuentes-RincónA. M.CabreraA. S.PérezC. A. G.BracamonteG. M. P.MoralesP. A. (2015). Associations of SNPs located at candidate genes to bovine growth traits, prioritized with an interaction networks construction approach. BMC Genetics16, 91. doi: 10.1186/s12863-015-0247-3
31
PelzL.PurfürstB.RathjenF. G. (2017). The cell adhesion molecule BT-IgSF is essential for a functional blood–testis barrier and male fertility in mice. J. Biol. Chem.292 (52), 21490–21503. doi: 10.1074/jbc.RA117.000113
32
PerryG. H.DominyN. J.ClawK. G.LeeA. S.FieglerH.RedonR.et al. (2007). Diet and the evolution of human amylase gene copy number variation. Nat. Genet.39 (10), 1256–1260. doi: 10.1038/ng2123
33
PickrellJ. K.PritchardJ. K. (2012). Inference of population splits and mixtures from genome-wide allele frequency data. PLoS Genet.8 (11), e1002967. doi: 10.1371/journal.pgen.1002967
34
PintoD.DarvishiK.ShiX.RajanD.RiglerD.FitzgeraldT.et al. (2011). Comprehensive assessment of array-based platforms and calling algorithms for detection of copy number variants. Nat Biotechnol.29 (6), 512–520. doi: 10.1038/nbt.1852
35
PrimesG.FiederM. (2018). Real-life helping behaviours in North America: a genome-wide association approach. PLoS One.13 (1), e0190950. doi: 10.1371/journal.pone.0190950
36
PritchardJ. K.StephensM.DonnellyP. (2000). Inference of population structure using multilocus genotype data. Genetics.155 (2), 945–959.
37
RamasamyR. K.RamasamyS.BindrooB. B.NaikV. G. (2014). STRUCTURE PLOT: a program for drawing elegant STRUCTURE bar plots in user friendly interface Vol. 3. Springerplus, 431. doi: 10.1186/2193-1801-3-431.
38
RedonR.IshikawaS.FitchK. R.FeukL.PerryG. H.AndrewsT. D.et al. (2006). Global variation in copy number in the human genome. Nature.444 (7118), 444–454. doi: 10.1038/nature05329
39
ReichD.ThangarajK.PattersonN.PriceA. L.SinghL. (2009). Reconstructing Indian population history. Nature.461 (7263), 489–494. doi: 10.1038/nature08365
40
ReyerH.ShiraliM.PonsuksiliS.MuraniE.VarleyP. F.JensenJ.et al. (2017). Exploring the genetics of feed efficiency and feeding behaviour traits in a pig line highly selected for performance characteristics. Mol. Genet. Genomics.292 (5), 1001–1011. doi: 10.1007/s00438-017-1325-1
41
QuinlanA. R.HallI. M. (2010). BEDTools: a flexible suite of utilities for comparing genomic features. Bioinformatics.26 (6), 841–842. doi: 10.1093/bioinformatics/btq033
42
SaelaoP.WangY.GallardoR. A.LamontS. J.DekkersJ. M.KellyT.et al. (2018). Novel insights into the host immune response of chicken Harderian gland tissue during Newcastle disease virus infection and heat treatment. BMC Vet. Res.14 (1), 280. doi: 10.1186/s12917-018-1583-0
43
SchorgerA. W. (1996). The Wild Turkey. Its History and Domestication. University of Oklahoma Press, Norman.
44
StrillacciM. G.CozziM. C.GorlaE.MoscaF.SchiaviniF.Román-PonceS. I.et al. (2017). Genomic and genetic variability of six chicken populations using single nucleotide polymorphism and copy number variants as markers. Animal.11 (5), 737–745. doi: 10.1017/S1751731116002135.
45
StrillacciM. G.FrigoE.SchiaviniF.SamoréA. B.CanavesiF.VeveyM.et al. (2014). Genome-wide association study for somatic cell score in Valdostana Red Pied cattle breed using pooled DNA. BMC Genetics15, 106. doi: 10.1186/s12863-014-0106-7
46
StrillacciM. G.GorlaE.CozziM. C.VeveyM.GenovaF.ScienskiK.et al. (2018). A copy number variant scan in the autochthonous Valdostana Red Pied cattle breed and comparison with specialized dairy populations. PLoS One13 (9), e0204669. doi: 10.1371/journal.pone.0204669.
47
SuzukiR.ShimodairaH. (2006). Pvclust: an R package for assessing the uncertainty in hierarchical clustering. Bioinformatics.22 (12), 1540–1542. doi: 10.1093/bioinformatics/btl117
48
SohrabiS. S.MohammadabadiM.WuD. D.EsmailizadehA. (2018). Detection of breed-specific copy number variations in domestic chicken genome. Genome.61 (1), 7–14. doi: 10.1139/gen-2017-0016.
49
TangW.ZhangG.SerlucaF.LiJ.XiongX.CobleM.et al. (2018). Genetic architecture of collective behaviors in zebrafish. bioRxiv.1, 350314. doi: 10.1101/350314
50
TardifS.AkrofiA. S.DassB.HardyD. M.MacDonaldC. C. (2010). Infertility with impaired zona pellucida adhesion of spermatozoa from mice lacking TauCstF-64. Biol Reprod.83 (3), 464–472. doi: 10.1095/biolreprod.109.083238
51
TayeM.KimJ.YoonS. H.LeeW.HanotteO.DessieT.et al. (2017). Whole genome scan reveals the genetic signature of African Ankole cattle breed and potential for higher quality beef. BMC Genetics18 (1), 11. doi: 10.1186/s12863-016-0467-1
52
TuranN.GhalwashM. F.KatariS.CoutifarisC.ObradovicZ.SapienzaC. (2012). DNA methylation differences at growth related genes correlate with birth weight: a molecular signature linked to developmental origins of adult disease. BMC Med. Genomics5, 10. doi: 10.1186/1755-8794-5-10
53
UtreraA. R.PonceS. I. R.IzquierdoA. V.TorresE. C.CovarrubiasA. C.La Cruz ColínL.et al. (2016). Analysis of morphological variables in Mexican backyard turkeys (Meleagris gallopavo gallopavo). Rev. Mex. Cienc. Pecuarias.7 (3), 377–389.
54
VelováH.Gutowska-DingM. W.BurtD. W.VinklerM. (2018). Toll-like receptor evolution in birds: gene duplication, pseudogenization, and diversifying selection. Mol. Biol. Evol.35 (9), 2170–2184. doi: 10.1093/molbev/msy119
55
WangK.LiM.HadleyD.LiuR.GlessnerJ.GrantS. F.et al. (2007). PennCNV: an integrated hidden Markov model designed for high-resolution copy number variation detection in whole-genome SNP genotyping data. Genome Res.17 (11), 1665–1674. doi: 10.1101/gr.6861907
56
WangZ.KumamotoY.WangP.GanX.LehmannD.SmrckaA. V.et al. (2009). Regulation of immature dendritic cell migration by RhoA guanine nucleotide exchange factor Arhgef5. J. Biol. Chem.284 (42), 28599–28606. doi: 10.1074/jbc.M109.047282
57
XuL.HouY.BickhartD. M.YangZ.Hay elH. A.SongJ.et al. (2016). Population-genetic properties of differentiated copy number variations in cattle. Sci. Rep.6, 23161. doi: 10.1038/srep23161
58
YiG.QuL.LiuJ.YanY.XuG.YangN. (2014). Genome-wide patterns of copy number variation in the diversified chicken genomes using next-generation sequencing. BMC Genomics15, 962. doi: 10.1186/1471-2164-15-962
59
ZhuY.WangW.WangX. (2015). Roles of transcriptional factor 7 in production of inflammatory factors for lung diseases. J. Transl. Med.13, 273. doi: 10.1186/s12967-015-0617-7
Summary
Keywords
Meleagris gallopavo, structural variation, copy number variant, genetic diversity, biodiversity
Citation
Strillacci MG, Gorla E, Ríos-Utrera A, Vega-Murillo VE, Montaño-Bermudez M, Garcia-Ruiz A, Cerolini S, Román-Ponce SI and Bagnato A (2019) Copy Number Variation Mapping and Genomic Variation of Autochthonous and Commercial Turkey Populations. Front. Genet. 10:982. doi: 10.3389/fgene.2019.00982
Received
31 May 2019
Accepted
13 September 2019
Published
29 October 2019
Volume
10 - 2019
Edited by
Fabyano Fonseca Silva, Universidade Federal de Viçosa, Brazil
Reviewed by
Xiaofei Wang, Tennessee State University, United States; Arele Arlindo Calderano, Universidade Federal de Viçosa, Brazil
Updates
Copyright
© 2019 Strillacci, Gorla, Ríos-Utrera, Vega-Murillo, Montaño-Bermudez, Garcia-Ruiz, Cerolini, Román-Ponce and Bagnato.
This is an open-access article distributed under the terms of the Creative Commons Attribution License (CC BY). The use, distribution or reproduction in other forums is permitted, provided the original author(s) and the copyright owner(s) are credited and that the original publication in this journal is cited, in accordance with accepted academic practice. No use, distribution or reproduction is permitted which does not comply with these terms.
*Correspondence: Maria G. Strillacci, maria.strillacci@unimi.it; Sergio I. Román-Ponce, roman.sergio@inifap.gob.mx
This article was submitted to Livestock Genomics, a section of the journal Frontiers in Genetics
Disclaimer
All claims expressed in this article are solely those of the authors and do not necessarily represent those of their affiliated organizations, or those of the publisher, the editors and the reviewers. Any product that may be evaluated in this article or claim that may be made by its manufacturer is not guaranteed or endorsed by the publisher.