 Lauren Stern1,2,3†
 Helen McGuire1,2,4,5†
 Selmir Avdic1,2,3†
 Simone Rizzetto6†
 Barbara Fazekas de St Groth1,2,4,5†
 Fabio Luciani7†
 Barry Slobedman1,2,3†
 Emily Blyth1,8,9,10*†
- 1University of Sydney, Sydney, NSW, Australia
- 2Charles Perkins Centre, University of Sydney, Sydney, NSW, Australia
- 3Discipline of Infectious Diseases and Immunology, Sydney Medical School, University of Sydney, Sydney, NSW, Australia
- 4Ramaciotti Facility for Human Systems Biology, University of Sydney, Sydney, NSW, Australia
- 5Discipline of Pathology, School of Medical Sciences, University of Sydney, Sydney, NSW, Australia
- 6University of New South Wales, Sydney, NSW, Australia
- 7Kirby Institute, University of New South Wales, Sydney, NSW, Australia
- 8Westmead Institute for Medical Research, University of Sydney, Sydney, NSW, Australia
- 9Blood and Marrow Transplant Unit, Westmead Hospital, Sydney, NSW, Australia
- 10Sydney Cellular Therapies Laboratory, Westmead, Sydney, NSW, Australia
Mass cytometry, or Cytometry by Time-Of-Flight, is a powerful new platform for high-dimensional single-cell analysis of the immune system. It enables the simultaneous measurement of over 40 markers on individual cells through the use of monoclonal antibodies conjugated to rare-earth heavy-metal isotopes. In contrast to the fluorochromes used in conventional flow cytometry, metal isotopes display minimal signal overlap when resolved by single-cell mass spectrometry. This review focuses on the potential of mass cytometry as a novel technology for studying immune reconstitution in allogeneic hematopoietic stem cell transplant (HSCT) recipients. Reconstitution of a healthy donor-derived immune system after HSCT involves the coordinated regeneration of innate and adaptive immune cell subsets in the recipient. Mass cytometry presents an opportunity to investigate immune reconstitution post-HSCT from a systems-level perspective, by allowing the phenotypic and functional features of multiple cell populations to be assessed simultaneously. This review explores the current knowledge of immune reconstitution in HSCT recipients and highlights recent mass cytometry studies contributing to the field.
Introduction
Allogeneic hematopoietic stem cell transplantation (HSCT) is a key therapeutic strategy for a number of hematological malignancies and non-malignant disorders of the hematopoietic system (1). Effective immune reconstitution after HSCT is critical in promoting overall survival of transplant patients, restoring immune protection from opportunistic infections (2), and mediating an alloreactive graft-versus-tumor effect against residual malignant disease (3).
Modern single-cell technologies, such as molecular profiling using single-cell transcriptomics and single-cell sorting using flow cytometry, have been integral in facilitating our understanding of how the immune system reconstitutes following HSCT. The capacity to efficiently profile the phenotypes and functions of individual cells, based on their differential expression of cell-surface and intracellular proteins, has made flow cytometry a central tool for studying immune reconstitution after HSCT. Since the first flow cytometric studies investigating immune reconstitution in HSCT patients were published over 30 years ago (4–9), expansion of the number of available fluorophores and improvements in flow cytometric platforms (10) have enabled a more in-depth investigation of the reconstitution patterns of individual immune cell subsets. There is now an increased appreciation of immunological reconstitution after HSCT as a complex biological phenomenon involving a continuously evolving interplay between multiple immune cell populations (11). An association between the pattern of immune reconstitution and the risk of post-transplant complications, such as relapse, rejection (12), viral infections (13), and graft-versus-host disease (GvHD) (14), has also been recognized, along with the powerful influence of these events in shaping distinct patterns of immune reconstitution after HSCT (15–18).
Retaining the single-cell resolution of flow cytometry, mass cytometry (also known as Cytometry by Time-Of-Flight) is a novel immune analysis platform which utilizes the precision of mass spectrometry to allow for the simultaneous assessment of over 40 cellular markers. By overcoming the limitations of conventional fluorescence flow cytometry, mass cytometry offers the possibility for high-dimensional analysis of immune reconstitution after HSCT and thus holds promise for identifying prognostic immune biomarkers, informing the development of new therapies and advancing our understanding of the biology of immune reconstitution post-HSCT. In this review, we survey the existing knowledge of immune reconstitution in HSCT recipients and evaluate the potential of mass cytometry for the assessment of immune reconstitution after HSCT.
Immune Reconstitution after HSCT
The human immune system is comprised of a network of diverse immune cell populations that together protect against disease. Allogeneic HSCT provides a form of “immune rescue” for individuals with defects in their hematopoietic system, by enabling the regeneration of a healthy, donor-derived immune system following pretransplant radiochemotherapy conditioning regimens that partially or fully ablate the existing immune system.
Assessment of immunological recovery after transplantation is performed to identify successful engraftment, detect adverse events such as graft failure or rejection, monitor infection risk, and guide corresponding interventions (19, 20). The absolute numbers of circulating lymphocytes, monocytes, and granulocytes are routinely quantified at serial intervals post-HSCT using an automated full blood count analyzer and provide a rapid indication of immune recovery (21, 22). In particular, measurement of the absolute lymphocyte count in the first 3 months after HSCT has been shown to hold prognostic value regarding non-relapse mortality and overall survival (23–25). In conjunction with complete blood counts, enumeration of major peripheral blood lymphocyte populations [CD4+ T cells, CD8+ T cells, B cells, and natural killer (NK) cells] by 3–4 color flow cytometry, functional assays (cytokine production, proliferative responses), measurement of antibody titers and molecular analysis of T cell, and B cell repertoires have been performed to define prognostic factors in the post-HSCT period (26–28).
Influence of Clinical Factors on Immunological Recovery
Immunological outcomes after HSCT are influenced by clinical variables including patient factors (age, indication for transplant, prior treatment, comorbidities), donor type (29, 30), stem cell source (31–33), conditioning regimen (34, 35), the use of T cell depletion strategies (36), and post-transplant pharmacological immunosuppression. Each of these factors has a distinct impact on the post-transplant course and can determine the pace and pattern of immune recovery (Figure 1).
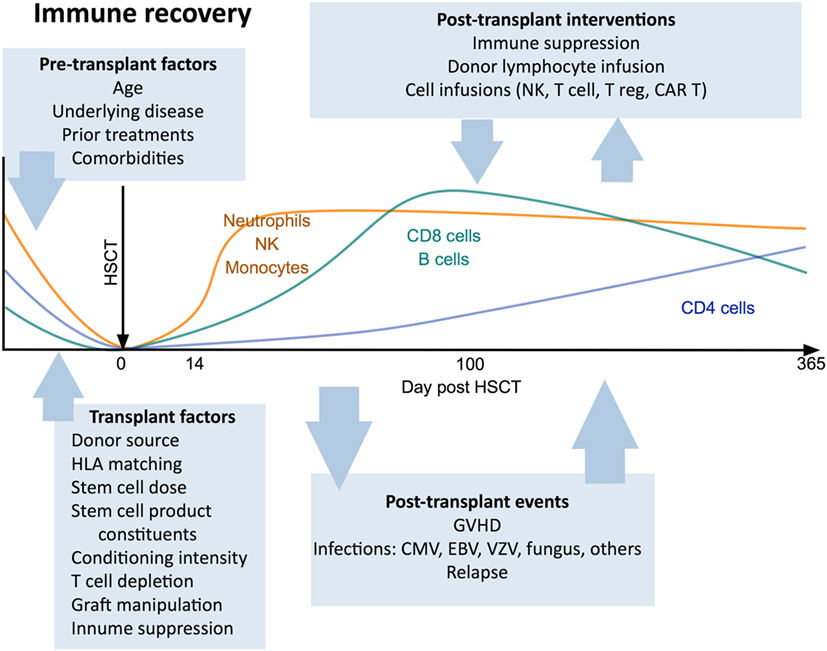
Figure 1. Canonical view of immune reconstitution. In the first 12 months after allogeneic hematopoietic stem cell transplantation the major cell subsets follow a predictable pattern of recovery under the influence of a large number of factors including patient baseline characteristics, transplant factors, post-transplant events, and therapeutic interventions. Abbreviations: CAR T, chimeric antigen receptor T cells; GvHD, graft-versus-host disease; CMV, cytomegalovirus; VZV, varicella zoster virus; EBV, Epstein–Barr virus.
Hematopoietic stem cell transplant patients receiving grafts derived from umbilical-cord blood, which contain fewer CD34+ hematopoietic stem cells than bone marrow or granulocyte-colony stimulating factor-mobilized peripheral blood stem cell (PBSC) grafts, display slower engraftment kinetics, delayed T cell reconstitution, and a more prolonged period of overall immune recovery (37–39). Mobilized PBSC grafts generally contain the highest numbers of committed progenitors and mature lymphocytes (26), and recipients of these transplants exhibit the fastest rates of immune reconstitution (23, 40), alongside an elevated risk of GvHD (15, 41).
More recent technological advances have enabled manipulation of the stem cell graft and other cellular components that are administered at the time of stem cell infusion or later in the post-transplant period. New strategies under investigation including graft manipulation (such as αβTCR/CD19 depletion of the graft) (42, 43) and adoptive immunotherapy with T cells, NK cells (44) or regulatory T cells (Tregs) (45) have complex effects and nuanced biomarker readout is needed to understand their biological impact on transplant recipients.
While the many clinical variables associated with HSCT can together contribute to great inter-patient heterogeneity in immunological recovery, a consistent pattern of cellular reconstitution following HSCT is observed in most recipients (46). Reconstitution rates reflect the normal turnover kinetics of hematopoietic cells. Thus, reconstitution of innate immune cell subsets is rapid, occurring within weeks to months post-transplant. The recovery of adaptive immune cell subsets is more prolonged and may take years (2), particularly in adults, in whom lymphocyte output and peripheral turnover are relatively low compared with children (47).
Reconstitution of Innate Immune Cell Subsets
Granulocytes, Monocytes, and Dendritic Cells (DCs)
As a consequence of transplant conditioning regimens, HSCT recipients experience a period of neutropenia that persists for approximately 2 weeks after transplantation (48, 49). Neutrophils are the first immune cell type to reconstitute following engraftment of donor CD34+ stem cells (37, 48). By contrast, less is known about the reconstitution pattern of other granulocyte populations post-HSCT (50). Monocyte and DC numbers typically normalize after the first month post-transplant; however, it is unclear whether monocyte function is quickly restored or remains compromised for up to a year (26, 51–53). Myeloid (CD11c+) DCs have been observed to recover more rapidly than plasmacytoid (CD123+) DCs (54, 55) and the proportion of circulating DCs which are of donor origin may be as high as 80% at 2 weeks post-transplant (56).
NK Cells
Natural killer cells are the first lymphoid lineage cell type to reconstitute after HSCT, and they remain the dominant circulating lymphocyte population in the first 3 months post-transplant (57). While CD56dimCD16bright NK cells account for the majority (up to 90%) of peripheral blood NK cells in healthy adults, early reconstituting NK cells after HSCT predominantly display an immature CD56brightCD16low/− phenotype (54, 58, 59). Quantitative NK cell reconstitution usually occurs by one month post-transplant, but proportional skewing of the NK cell compartment in favor of CD56bright NK cells may continue for up to a year (58). The functional recovery of NK cells following HSCT is also delayed, with ex vivo studies demonstrating that the ability of NK cell subsets to degranulate and produce immunoregulatory cytokines may be diminished for several months after transplantation (54, 60).
Despite this, a role for NK cells in promoting engraftment, reducing relapse of malignant disease and protecting from GvHD is apparent from comparisons of recipients of human leukocyte antigen (HLA)-haploidentical transplants with and without mismatches in donor-recipient killer-cell immunoglobulin-like receptor (KIR) ligands (61–63). NK cells are also believed to be important responders to viral infections in the early post-transplant period, prior to the recovery of the adaptive immune response. Human cytomegalovirus (HCMV) reactivation is a leading infectious cause of morbidity and mortality in HSCT recipients (64) and HCMV reactivation can drive NK cell maturation (65) and promote the expansion of NKG2C+CD57+ NK cells in HSCT patients (66).
Reconstitution of Adaptive Immune Cell Subsets
B Cells
While some recipient plasma cells may survive pretransplant conditioning regimens (67), B cells largely will not. Reconstitution of the B cell compartment after HSCT occurs primarily through de novo regeneration from bone marrow progenitors, with the peripheral expansion of donor-derived mature B cells thought to be less significant (1, 68). The first B cells to emerge in the peripheral blood display a transitional (CD19+CD24highCD38high) phenotype, but the percentage of cells in this population decreases in the first 12 months after engraftment as the proportion of circulating mature B cells increases (69). The bone marrow microenvironment which supports B cell lymphopoiesis is highly vulnerable to disruption by myeloablative conditioning regimens and GvHD, and the corticosteroids employed in the treatment of GvHD can have a deleterious impact on B cell precursors in the bone marrow (70–73). B cell counts thus remain low during the first 100 days post-transplant and the reconstitution of memory (CD19+CD27+) B cells is additionally hindered by the slow recovery of CD4+ T helper cells (1, 74, 75). Additionally, HSCT patients experience impairments in antibody isotype switching (76) and somatic hypermutation (77) after transplantation which further contribute to defective humoral immunity and a limited antibody repertoire in the first year post-HSCT (78–80).
T Cells
T cells are the last arm of the hematopoietic system to fully reconstitute after HSCT, with a quantitative and functional T cell deficiency persisting throughout the first 2 years post-transplant. In contrast to B cells, early T cell reconstitution predominantly occurs via the peripheral expansion of cells transferred in the graft (81). This T cell proliferation arises in response to the lymphopenic environment early post-transplant and is driven by a number of factors, including elevated levels of the cytokines interleukin (IL)-7 and IL-15 (82–84) and a relative deficit in the number of Tregs in relation to DCs (85). Treg deficits have recently been shown to result in rapid oligoclonal CD4+ T cell proliferation leading to GvHD, while cytokines such as IL-7 support slower, polyclonal “homeostatic” proliferation of transferred cells. In standard HSCT the unmanipulated stem cell graft does not contain significant numbers of Tregs and rapid oligoclonal CD8+ T cell proliferation supresses the homeostatic response and generates the majority of T cells in the first 6 months after transplant. Reconstitution of a broader T cell repertoire, however, depends on the de novo generation of naïve T cells through the thymus after the engraftment and differentiation of hematopoietic stem cells in the bone marrow (86–88). Expression of the surface marker CD31 and quantification of T-cell receptor rearrangement excision DNA circles (TRECs) in circulating naïve T cells can be used to identify T cells that have recently emigrated from the thymus (88–90). Myeloablative conditioning regimens are associated with markedly reduced thymopoiesis in the first 6 months post-transplant and significantly delayed T cell reconstitution is observed in older HSCT recipients and those with GvHD (presumably due to age-associated involution of the thymus and alloreactive thymic damage, respectively) (89–92).
CD8+ T cells expand relatively rapidly after HSCT and may transiently exceed normal levels within 1 year (Figure 1), a process commonly driven by exposure to alloantigens or viral infections (17, 52). In contrast, CD4+ T cells display a more prolonged recovery, resulting in an inverted CD4:CD8 T cell ratio that may persist for many years (93–96). The inefficient recovery of CD4+ T cells relative to CD8+ T cells post-HSCT has been attributed to a heavier reliance by CD4+ T cells for regeneration via the thymic-dependent pathway (94), a consequence of the greater propensity of CD8+ T cells to undergo lymphopenia-dependent oligoclonal expansion, compared with CD4+ T cells. The reconstitution pattern of Tregs after HSCT may differ from that of conventional CD4+ T cells and is influenced by the extent of CD4+ T cell lymphopenia as well as the incidence and severity of GvHD (97–99).
Immune dysregulation after HSCT can manifest in abnormal increases in some cell types. Persistent T cell or NK cell large granular lymphocytosis is seen in up to 20% of patients and is associated with improved survival (100, 101); however, the mechanisms of this effect are not well understood.
Comprehensive Immune Assessment after HSCT: Limitations of Current Approaches
Our current understanding of immune reconstitution post-HSCT has largely been informed by research focused on characterizing the reconstitution pattern of individual immune cell subsets, with a bias toward major peripheral blood lymphocyte populations (T, B, or NK cells) that can be characterized with the limited number of parameters achievable through conventional flow cytometry (19, 102). However, reconstitution of the immune system after HSCT involves the quantitative and qualitative reconstitution of heterogenous cell populations, dynamic changes in peripheral blood immune cell subset composition and the transient appearance of cell populations with non-canonical phenotypes (58). The dissociation between quantitative and functional immune recovery after HSCT further emphasizes the need for more comprehensive assessments of immune reconstitution than are currently achievable by conventional flow cytometry.
The advent of mass cytometry holds the potential to meet this need. With the ability to simultaneously profile the expression of over 40 cellular markers, including surface proteins, intracellular signaling targets, transcription factors, and cytokines, mass cytometry provides an unprecedented opportunity for multiparametric analysis of immune reconstitution post-HSCT.
The Platform of Mass Cytometry
Mass cytometry shares with flow cytometry the same fundamental method to examine protein expression on individual cells, whereby single-cell suspensions are stained with cocktails of target-specific monoclonal antibodies that are labeled with unique reporter tags. While in traditional flow cytometry these tags are fluorescent compounds (fluorophores), mass cytometry uses antibodies conjugated to stable heavy-metal isotopes to detect cellular antigens by inductively coupled plasma (ICP) time-of-flight (TOF) mass spectrometry (103, 104). When introduced into the mass cytometer, the pre-stained suspension of single cells is nebulized into single-cell droplets, which are heated to extremely high temperatures (~7,000 K) in an argon plasma stream (Figure 2). This causes the cells to become vaporized, atomized, and ionized, resulting in the formation of a cloud of elemental ions associated with each cell. The ion cloud then passes through a quadrupole filter that removes abundant low mass elements such as carbon and oxygen and allows only ions of higher atomic mass (above 80 Da) to proceed to the TOF chamber. Here, the abundance of each heavy-metal isotope reporter per cell (correlating with antigen expression) is quantified by TOF mass spectrometry, where each metal isotope is separated according to its mass-to-charge ratio (Figure 2). This information is formulated into a flow cytometry standard (FCS) file which can be analyzed in conventional flow cytometry software, such as FlowJo (FlowJo, LLC).
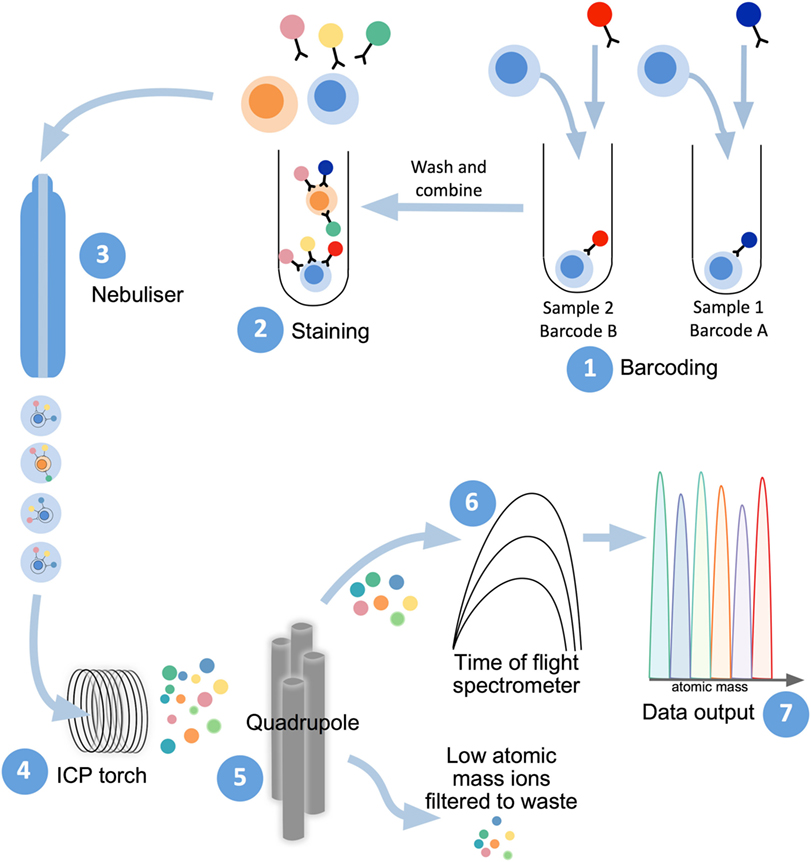
Figure 2. Mass cytometry workflow. Sample preparation consists of labeling with lanthanide-conjugated antibodies, first by differentially metal-labeled CD45 antibodies (so each sample has a different “barcode”) (1), which will then allow for mixing of multiple samples for DNA and immunophenotyping antibody staining (2). For acquisition of prepared samples, the following steps take place: cells are separated into individual droplets containing one cell each in the nebulizer (3). Each cell-containing droplet is passed through an inductively coupled plasma (ICP) torch to superheat, vaporize, atomize, and ionize each cell (4). Ions below 80 Da are filtered out with a series of radio frequency quadrupoles (5) with the remaining, high-atomic mass metal ions analyzed with time-of-flight mass spectrometry (6). Resultant signals are attributed to single cells and read out as .flow cytometry standard files (7) to allow for downstream analysis.
The heavy-metal reporters used in mass cytometry are stable isotopes of fixed mass, meaning that they produce discrete peaks with minimal cross-channel signal spillover (typically less than 1%) (105). In addition to the high degree of resolution between adjacent channels, the heavy-metal isotopes used in mass cytometry are commonly rare-earth elements of the lanthanide series, which are not usually present in biological systems (105). Mass cytometry is, therefore, not confounded by compensation issues arising from spectral overlap, or signal contamination from endogenous background sources equivalent to cellular autofluorescence as in flow cytometry. These factors allow for the potential of highly multiparametric single-cell analysis by mass cytometry. Currently, over 40 different heavy-metal isotope reporters (of sufficient isotopic purity) may be used concurrently within a single mass cytometry antibody panel, vastly exceeding the number of spectrally resolvable fluorophores available for use in flow cytometry.
The great potential of mass cytometry for analysis of the human immune system was first exemplified in a study by Bendall et al. (106), which used mass cytometry to profile cell-surface phenotypes and intracellular signaling responses across the diverse range of hematopoietic cell populations in healthy human bone marrow. From early progenitors to mature, lineage-committed cells, this study highlighted the phenotypic spectrum of immune cell subsets in the bone marrow and was able to reveal cell populations with transitional phenotypes that had not previously been described (106). Since then, single-cell mass cytometry has been applied to a range of studies (Table 1), including B cell lymphopoiesis (107), cell-cycle analysis (108), investigations of virus-specific CD8+ T cell phenotypes and cytokine responses (109), and in-depth immunophenotypic profiling of NK cell, T cell and myeloid cell compartments in healthy individuals (110–113).
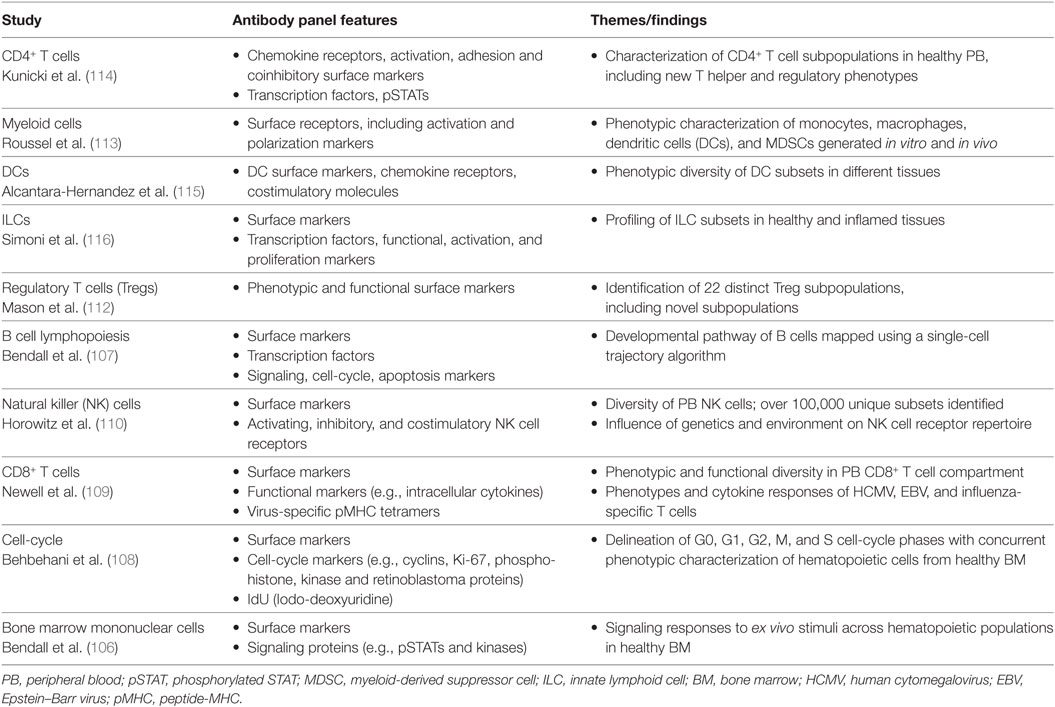
Table 1. Examples of studies using mass cytometry for human immunology research.
In the setting of disease, mass cytometry was recently used to track the phenotypic evolution of persistent leukemia cells in acute myeloid leukemia patients during induction chemotherapy and in refractory disease (117). Studies in autoimmune disease (118, 119), infection (120–122), recovery from surgery (123), transplantation (124) (see below), and cancer (125–127) have demonstrated the utility of mass cytometry for the assessment of complex immune environments.
Recent systems-level flow and mass cytometry investigations have described incredible variation in circulating immune cell composition between healthy individuals (128–131). In light of this heterogeneity, comprehensive analyzes capable of surveying many immune system components will be particularly important for understanding and characterizing reconstitution of the immune system in the context of HSCT.
Applications of Mass Cytometry to Study HSCT
In the last 3 years, the advantages of mass cytometry for studying immune reconstitution in HSCT recipients have been realized through several studies (Table 2).
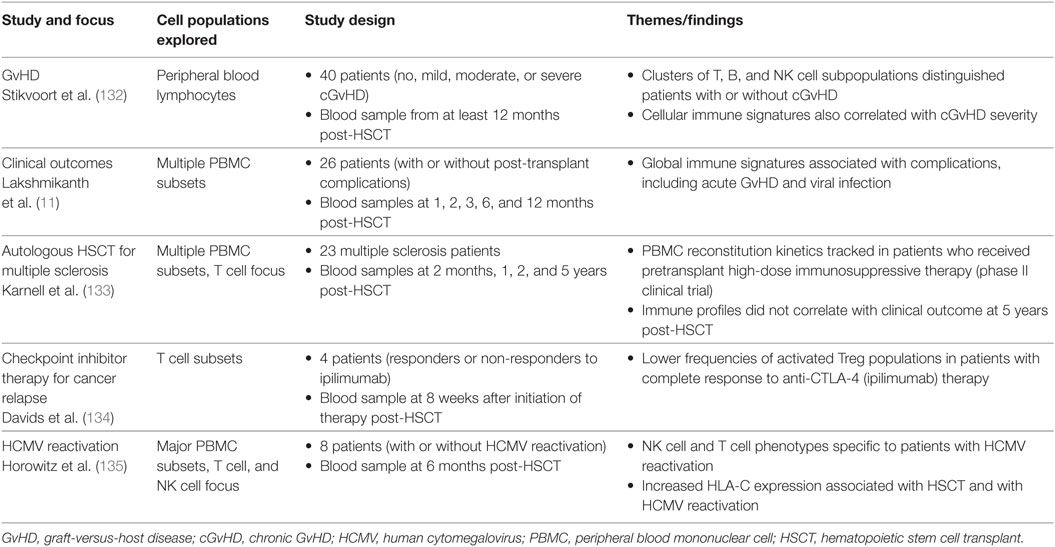
Table 2. Selected studies using mass cytometry to analyze immune reconstitution after HSCT.
Lakshmikanth and colleagues (11) performed a longitudinal study using mass cytometry to explore associations between global peripheral blood immune reconstitution and clinical outcomes in the first 12 months after allogeneic HSCT. Simultaneous analysis of the reconstitution of 89 immune cell populations in healthy HSCT patients and those with major post-transplant complications revealed that perturbations in frequency and phenotype across multiple cell subsets correlated with complications such as HCMV reactivation and acute GvHD. Central memory CD4+ T cells, naive and transitional B cell subsets and CD161-expressing NK cells and T cells were identified as features of healthy immune reconstitution, while divergent profiles of immune regeneration were observed in patients suffering multiple post-transplant complications (11). The findings of this study highlight the power of high-dimensional mass cytometry analysis to capture a global perspective of immune reconstitution after HSCT and identify immune signatures associated with clinical outcome. Future prospective studies are needed to evaluate the predictive value of these findings in a larger, independent patient cohort.
Chronic GvHD (cGvHD) is a common and often life-threatening immune-mediated complication following allogeneic HSCT. Identifying peripheral blood biomarkers for cGvHD has been the focus of a number of studies (136–139). Stikvoort et al. (132) recently used mass cytometry to investigate the cellular immune profiles associated with cGvHD in HSCT patients, detecting clusters of T, B, and NK cell subsets that were present at lower abundance in patients with mild cGvHD, compared to those without cGvHD. An activated B cell population and NKT-like subset were also discovered to distinguish patients with severe cGvHD from those with moderate cGvHD (132). The diagnostic or prognostic potential of these immune cell clusters remains to be tested in a broader patient cohort, but Stikvoort et al. (132) show the feasibility of targeting these subsets using condensed, clinically viable flow cytometry panels.
The influence of post-transplant HCMV reactivation on immune reconstitution after HSCT was also explored using mass cytometry by Horowitz and colleagues (135). A comprehensive analysis of 40 peripheral blood mononuclear cell (PBMC) surface markers at 6 months post-transplant uncovered that HSCT patients who experienced HCMV reactivation displayed elevated levels of HLA-C and a distinct repertoire of NK cells and T cells compared to uninfected patients (135). Specifically, the authors observed a bias for KIR2DL2/3 expression on NKG2C+CD57+ NK cells, which are present at higher frequency in HSCT patients with HCMV reactivation (66, 135). Higher frequencies of T cells expressing inhibitory KIRs were also found in patients with HCMV reactivation. Interestingly, expression of the KIR ligand HLA-C on immune cells was increased in HSCT patients relative to healthy individuals, and was further enhanced on myeloid subsets, CD56–CD16+ NK cells and CD4+CD8+ T cells in patients with HCMV reactivation (135). The authors speculate that interactions between HLA-C and KIRs might regulate NK cell education and T cell function during immune reconstitution after HSCT.
The potential for high-dimensional immune analysis by mass cytometry to aid in the evaluation of emerging therapies for HSCT recipients has also recently been demonstrated. Mass cytometry was used to explore the association between clinical outcome and immune responses to checkpoint inhibitor therapy for the treatment of relapsed cancer after HSCT (134). HSCT patients who exhibited complete response to ipilimumab (anti-CTLA-4) therapy were found to have markedly reduced frequencies of activated circulating Tregs compared to patients with disease progression (134). Mass cytometry analysis has also been applied to assess global PBMC reconstitution kinetics and functional profiles of T cells in a longitudinal study of autologous HSCT patients who received pretransplant high-dose immunosuppressive therapy as part of a phase II clinical trial for multiple sclerosis (133).
These studies illustrate the ability of high-dimensional mass cytometry analysis to provide new insights into immune reconstitution after HSCT, and we envisage the comprehensive immune assessment possible with this technology will greatly benefit future studies aimed at dissecting the immunological features associated with clinical outcomes following HSCT.
Mass Cytometry Workflow
Antibody Panel Design
Mass cytometry antibody panels typically incorporate a suite of core immunophenotyping surface markers to distinguish the cell subsets of interest, alongside additional phenotypic markers or functional parameters such as intracellular cytokines, transcription factors, phosphorylated targets, or peptide-major histocompatibility complex tetramers (105, 109, 140). While the design of antibody panels in mass cytometry should be informed by the clinical focus or research question being addressed, the expanded number of markers that can be included can facilitate the construction of more open, exploratory panels compared to conventional flow cytometry. The same antibody clones used in flow cytometry are able to be used for mass cytometry and validation experiments between platforms have shown comparable results (106, 141), although some heavy-metal tagged antibodies may display lower sensitivity than their fluorescent counterparts (105, 109), particular to certain antibody clones, due in part to their compatibility with metal conjugation chemistry. A metal-chelating polymer is used to attach the heavy-metal isotope to the antibody molecule (142), and pre-conjugated antibodies can be obtained commercially or antibodies can be conjugated in-house. While lanthanide-series metals are often used for these antibody tags, further reagent development has capitalized on the detectable mass window to utilize additional labels such as platinum, bismuth, palladium, and silver (143–146).
Metal isotopes which demonstrate the greatest signal sensitivity in mass cytometry are concentrated in the middle of the mass window (around 155–165 Da) (147) and are useful for the placement of low abundance antigens within antibody panels. However, across the entire mass range measured by current mass cytometers (approximately 89–209 Da), the metal isotope reporters display a relatively consistent level of sensitivity, with differences between probes in the range of twofold to threefold (105). This contrasts to the wide variation in sensitivity exhibited by different fluorescent reporters in flow cytometry (up to 10- to 50-fold) and provides flexibility when designing mass cytometry antibody panels as markers can be easily moved or substituted between channels without compromising panel integrity.
Sample Processing and Acquisition
The preparation of samples for mass cytometry is similar to that of conventional flow cytometry, although there are some notable differences. Current mass cytometers do not contain lasers or light detectors, so cellular forward and side scatter profiles for cell size discrimination and granularity are not measured. To detect cells in mass cytometry, cells must be labeled with at least one heavy-metal isotope. An iridium- or rhodium-based nucleic acid intercalator is commonly used for this purpose and provides the capacity to differentiate single cells from doublets and debris on the basis of DNA content (148). Discrimination of live and dead cells in mass cytometry similarly relies on use of heavy-metal based viability reagents. Brief (1–5 min) pulsing with the chemotherapeutic agent cisplatin (platinum-based) is often used to assess cell viability in mass cytometry as it binds covalently to cells with compromised membranes (149).
Multiplexed staining and acquisition of samples in mass cytometry is possible by barcoding individual samples with different metal isotopes, via techniques such as maleimido-mono-amide-DOTA (mDOTA) (150) or anti-CD45 antibody labeling (143). A more recent iteration of this idea has incorporated cisplatin as potential barcodes (151). Barcoding enables multiple samples to be stained in the same tube and acquired simultaneously, thus increasing throughput, reducing inter-sample variability and minimizing cell loss from each sample. The recent introduction of palladium isotopes for cellular barcoding in mass cytometry has expanded the number of barcoding channels available (152). Once mass cytometry samples have been stained, the cells must be fixed and washed in pure water prior to acquisition. The speed of sample acquisition in mass cytometry is slower than flow cytometry (see Challenges With Mass Cytometry) and subsequent data analysis may require newer high-dimensional approaches (see Analysis and Visualization of High-Dimensional Mass Cytometry Data).
Challenges with Mass Cytometry
Mass cytometry holds many advantages over traditional immune monitoring techniques through its ability to extract high-dimensional single-cell information from clinical samples which may be precious and limited in volume (153). There are, however, a number of challenges faced by users of this novel platform, including limitations in sensitivity, sampling efficiency and acquisition speed, as well as accessibility (instrument expense and running costs are higher compared to conventional flow cytometry).
As noted previously, the level of sensitivity that can currently be achieved with mass cytometry is lower than that permitted by the brightest fluorophores in flow cytometry. This restriction is due in part to both reagents and instrument detection. Specifically, the metal-loaded polymer conjugation chemistry employed limits the total number of metal atoms that can be attached to an antibody molecule via the metal-chelating polymer (105). Conversely, instrument limitations in ion transmission efficiency mean that only 1 of every 10,000 ions reach the detector and get counted. Current mass cytometers also have a propensity for signal drift over time, which may be due to the accretion of cellular debris, fluctuations in plasma ionization efficiency, and manual handling during cleaning and tuning (154). Polystyrene beads embedded with fixed amounts of four elements can be spiked into each sample immediately prior to acquisition, providing an internal standard from which to normalize changes in machine signal intensity across the mass window over time (154). Normalization of mass cytometry data in this manner is important because the speed of sample acquisition is relatively slow and may be particularly beneficial for longitudinal studies where data are acquired over multiple days.
In conventional flow cytometry, data can be acquired for thousands of cells per second with high sampling efficiency, such that around 95% of cells introduced into the instrument are able to be measured. By contrast, each cell takes about 300 µs to be measured in the TOF chamber in mass cytometry (155) which results in a recommended acquisition rate of no greater than 400 events per second (for PBMCs) to maximize data quality and limit doublets. In addition, inefficient nebulization of single-cell droplets into the ICP stream means that around only 30–50% of cells introduced into the mass cytometer ultimately reach the TOF chamber (105); however, improved detection efficiency is readily observed with the Helios version updates. The detection of rare cell populations by mass cytometry may, therefore, be time-consuming and require a sufficiently large initial quantity of cells (~2.0 × 10⁶) per sample. This can impact the feasibility of detecting rare cell subsets in blood samples from HSCT patients during the first 2-weeks post-transplant, where the numbers of circulating immune cells may be very low and peripheral blood draw volume limited. In studies where particular mass cytometric analysis of rare populations is paramount, implementation of dual conjugated antibodies (metal and fluorescent tagged) can facilitate bead-free enrichment by fluorescent cell sorting prior to mass analysis (156). An additional limitation in mass cytometry is that samples are completely ablated by the plasma torch prior to acquisition, precluding the possibility of cell sorting and the recovery of viable cells for further assays.
While mass cytometry is not hampered by background signal contamination from autofluorescence or fluorescent spillover, potential sources of “noise” in mass cytometry are metal impurities, oxidation products, and environmental contaminants (147). The highly purified metal isotopes used to label antibodies may contain natural isotopic impurities, which can lead to signal interference (normally less than 1%) in adjacent mass (M) channels (M +1, M −1). Such crosstalk between neighboring channels is an important consideration in mass cytometry antibody panel design, as placement of co-expressed markers in channels with the potential for signal interference can be avoided. Signal spillover into the M +16 channel can also arise due to the formation of metal oxide products in the argon plasma and can be minimized through daily instrument calibration and tuning prior to sample running (147, 157). Importantly, given these signal spillover factors occur in a predictable fashion, such influences can be counteracted using recently developed algorithmic compensation tools (158). Mass-minus-one (MMO) controls, whereby cells are stained with a full mass cytometry panel without the inclusion of one particular antibody, can be used to identify the contribution of signal interference in a given channel, although MMOs are not routinely performed in the optimization of mass cytometry panels.
It is important to appreciate the technical challenges associated with mass cytometry in its current form and how these may be mitigated through careful panel design, experiment optimization, and routine instrument calibration. Beyond these considerations, the analysis and interpretation of high-dimensional data sets generated in mass cytometry requires time and expertise and is an inherent challenge which should not be overlooked.
Analysis and Visualization of High-Dimensional Mass Cytometry Data
The increased capacity for multiparametric single-cell measurements through mass cytometry has inspired the development and application of new analysis approaches to visualize and interpret high-dimensional mass cytometry data sets. In traditional flow cytometry analysis, cell populations are manually identified by the user based on patterns of cellular marker expression, using sequential gating between multiple biaxial dot plots that display the expression of up to two parameters at once. This bivariate gating approach remains important for mass cytometry data analysis, yet becomes practically challenging and complex when applied to a typical 40-parameter mass cytometry experiment, owing to the large number of biaxial plots involved. Additionally, manual gating is subjective and relies on prior knowledge about the cell subsets of interest, thus unanticipated cell populations or unusual patterns of marker expression may easily be overlooked.
Computational tools to facilitate the analysis of high-dimensional single-cell data such as mass cytometry have, therefore, emerged, including clustering approaches [SPADE (106, 159), Citrus (160), PhenoGraph (125), FlowSOM (161)], dimensionality reduction methods [principal component analysis (PCA), viSNE (162)], automatic gating and complex statistical learning approaches (163, 164). These computational tools offer the capacity to discern multiparametric single-cell relationships, such as subtle differences in the expression patterns of multiple markers, identify clusters of cells and analyze the differential expression of markers among cell subsets. A number of recent reviews have summarized the methodology adopted so far, as well as outlining future directions (165–168). Current approaches include supervised and unsupervised methods, and within these, classical multivariate parametric models as well as machine learning methods. The need for less supervised analysis strategies is particularly important when studying profound disturbances in immune homeostasis, such as those that follow HSCT, where previously unidentified immune profiles and peculiar cellular phenotypes may arise as the immune system reconstitutes.
SPADE and viSNE were among the first computational methods used to visualize multiparametric mass cytometry data in two-dimensional (2D) space (Figure 3). Free and open-source packages are now available to enhance the efficiency and reproducibility of mass cytometry analysis by automating data pre-processing steps [Premessa (https://github.com/ParkerICI/premessa), CATALYST (158)] and combining data visualization, cell subset identification and statistical analysis in automated workflows (169–171). Below, we describe some popular analysis tools which allow for the exploration and discovery of new insights from high-dimensional mass cytometry data.
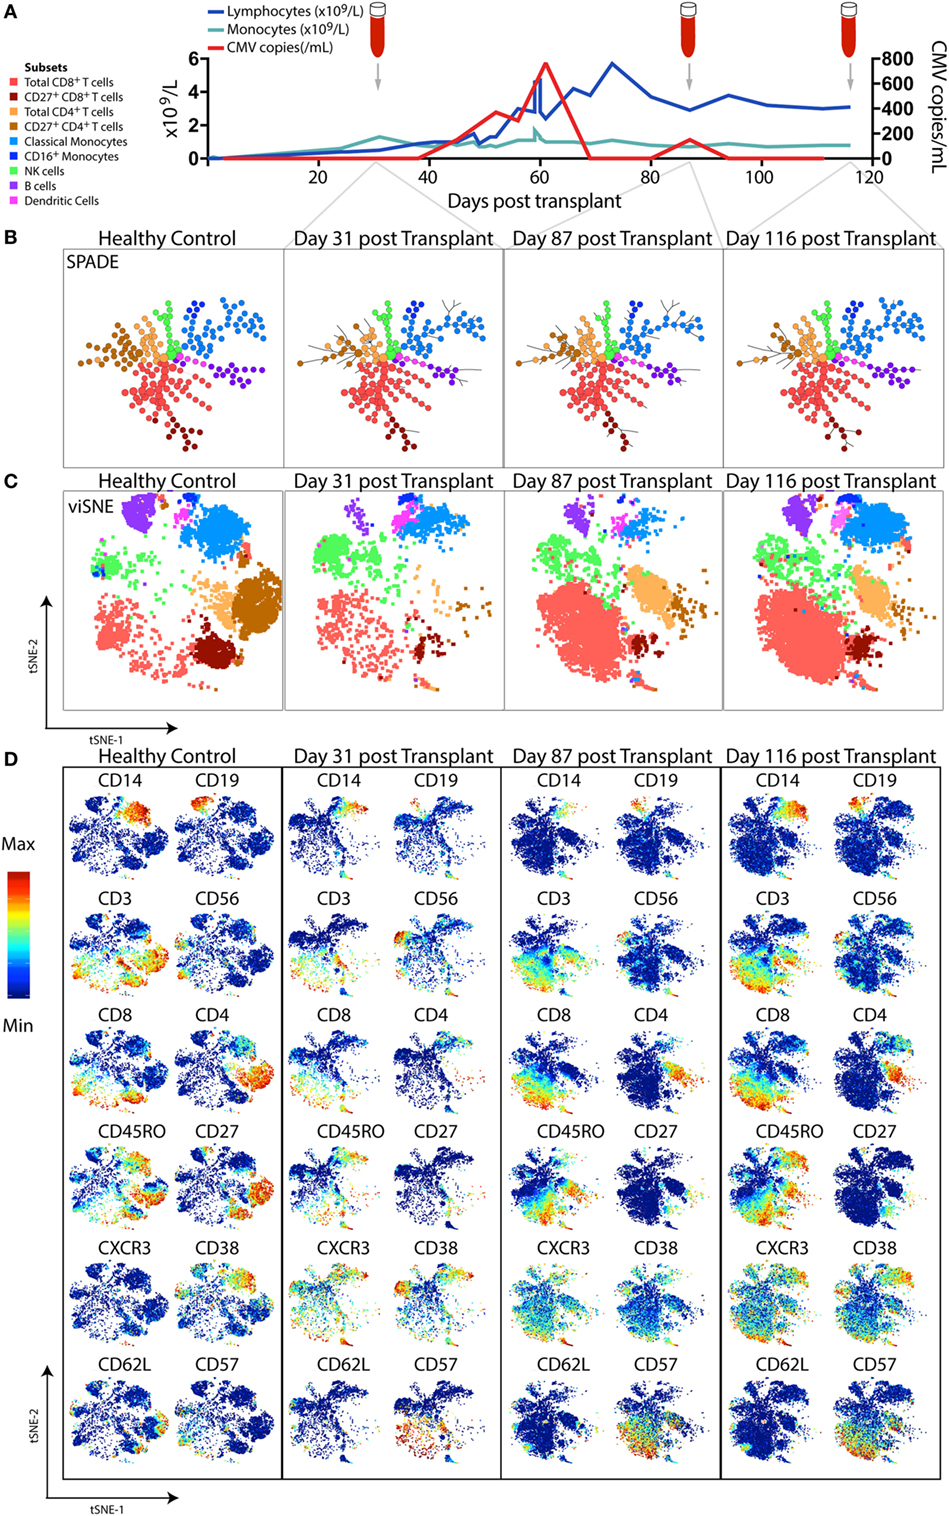
Figure 3. High-dimensional mass cytometric analysis. A representative hematopoietic stem cell transplant (HSCT) recipient was longitudinally monitored up to 120 days post-transplant. (A) Blood lymphocyte and monocyte counts, as well as CMV genome copies in the plasma, were tracked, illustrating the dynamic changes that occurred over time. Cryopreserved peripheral blood mononuclear cell samples from a healthy control and 3 time-points following transplant from the HSCT patient were thawed, rested, and subsequently differentially stained with a CD45 barcode, before combining for further staining with a panel of 35 antibodies and acquisition by mass cytometry. To perform high-dimensional analysis, acquired flow cytometry standard files were normalized (using concurrently run EQ beads), “debarcoded” using the distinct CD45 antibody staining, gated for live DNA positive events and exported for further analysis steps. The lymphocyte and monocyte counts at each time-point were used to inform relative down-sampling of files for high-dimensional analysis and assigned an additional sample identifying keyword in FlowJo prior to combining, with 50,000 cells used for this illustrative analysis. (B) SPADE, with node size indicative of number of cells in each population cluster, and (C) viSNE (1,000 iteration, 30 perplexity, 200 eta, 0.5 theta settings) was performed using phenotyping markers. Explorative gating for known subsets was used to color plots in panels (B,C), whereas (D) shows the same viSNE plots colored by relative expression of markers labeled. Abbreviation: CMV, cytomegalovirus.
Clustering Approaches
SPADE
SPADE (spanning tree progression of density-normalized events) (159) is an unsupervised clustering algorithm which enables multiparametric single-cell cytometry data to be visualized as a 2D minimum spanning tree of interconnected nodes. Each node on the SPADE tree contains a cluster of phenotypically similar cells that group together via hierarchical agglomerative clustering in higher-dimensional space. The user selects the clustering parameters used to build the SPADE tree, which are typically core lineage and phenotypic cell-surface markers that would normally be used in manual gating to distinguish cell subsets of interest. Prior to clustering, density-dependent down-sampling is performed to ensure that rarer cell phenotypes in the sample remain represented while reducing the total number of cells to be analyzed. Finally, an up-sampling step assigns every cell in the original data set to the relevant node on the spanning tree that best reflects its phenotype. The size of each node corresponds to the number of cells contained within that cluster. Using prior knowledge of expected cell phenotypes, the identity of the subset clustered into each node can be determined by iteratively exploring median expression of measured parameters (for example, CD3), the range of which can be displayed over the SPADE figure using a color gradient.
The ability of SPADE to provide a system-wide view of differential expression of phenotypic and functional markers across multiple cell populations was first used to study the intracellular signaling responses of human bone marrow hematopoietic cells following ex vivo stimulation (106). If data files from a number of samples are pooled together before clustering is performed, a SPADE tree can be generated in which the layout of nodes reflects the structure of all the samples combined. Each sample can then individually be mapped onto the SPADE tree, highlighting variations in the particular nodes or branches of the tree that are occupied by different samples (as in Figure 3B). Fold changes in marker expression between various samples can also be compared for each cluster of cells.
There is a degree of bias introduced in clustering approaches such as SPADE where the user is required to pre-specify the number of distinct cell clusters that will be derived from the data (172, 173). Further, the identities of individual nodes are not always easy to interpret and an underlying phenotypic hierarchy or developmental relationship between nodes on the SPADE tree cannot necessarily be inferred.
FlowSOM
FlowSOM (161) is a clustering tool that assigns phenotypically similar cells into nodes which assemble via a self-organizing map (SOM) into a 2D grid. The marker expression characteristics of the cells contained in each node can be visualized by star charts, and pie charts show the percentage of cells within a node that were captured by manual gating attempts. A minimum spanning tree also provides topological information on the multidimensional similarities between nodes. Finally, “meta-clustering” can be performed, which uses consensus hierarchical clustering to group phenotypically similar nodes into larger clusters, helping the user to define the cellular identity of each node. High computational speeds are achieved in FlowSOM without the requirement for down-sampling, contributing to FlowSOM’s ability to detect phenotypically rare cell populations hidden in large data sets (174). A recent study that benchmarked the performance of 18 unsupervised clustering methods for high-dimensional cytometry analysis (174) identified FlowSOM as the fastest and most accurate clustering tool that could reproduce multiple cell populations detected through manual gating.
Dimensionality Reduction Approaches
viSNE
viSNE is a non-linear dimensionality reduction technique based on the Barnes-Hut implementation (175) of the t-Distributed Stochastic Neighbor Embedding (t-SNE) algorithm (176) which enables the higher-order structure of multiparametric mass cytometry data to be visualized in two dimensions (162). Unlike the clustering methods described above, viSNE maintains the single-cell resolution of mass cytometry data by representing individual cells as dots on a 2D scatter plot (Figure 3C). The expression profile of 30+ markers on each cell can be considered in a simultaneous and unsupervised manner to generate a viSNE scatter plot in which the proximity of cells to one another reflects their phenotypic relationship in high-dimensional space. Thus, phenotypically similar cells are located close to one another on the viSNE plot, while dissimilar cells are positioned further apart.
Color can be overlaid on the viSNE plot to show the relative expression of a particular marker on each cell (Figure 3D). With this global view of the sample, it is possible to manually identify known cell populations, discern phenotypic diversity within these populations, and uncover rare or unexpected subsets which may have previously remained hidden using traditional manual gating. viSNE is considered a more appropriate tool for single-cell mass cytometry analysis than PCA because the linear transformation employed in PCA is not well-suited to portraying non-linear relationships present in biological data sets (162).
viSNE analysis of mass cytometry data was originally applied to visualize the phenotypic heterogeneity of leukemia (162), revealing inconsistent and abnormal shapes that formed from leukemia samples which were distinct from healthy human bone marrow. viSNE was also used to compare bone marrow samples from a leukemia patient before chemotherapy and after relapse and has shown promise in its ability to identify rare cells reminiscent of minimal residual disease (162, 177).
The development of hierarchical stochastic neighbor embedding (HSNE) (178), which is applied through the Cytosplore+HSNE program (179), overcomes a previous limitation of viSNE that necessitated random down-sampling of cells from each sample to avoid visual overcrowding of populations on the 2D scatter plot. Through Cytosplore+HSNE, millions of cells can now be analyzed simultaneously and phenotypically rare subsets identified by interactively exploring different levels of the hierarchical 2D embeddings generated in the HSNE algorithm.
ACCENSE
As an alternative to manually annotating cells on a viSNE plot into discrete phenotypic subsets, the open-source application ACCENSE (Automatic Classification of Cellular Expression by Nonlinear Stochastic Embedding) (180) removes this subjectivity by offering an automatic method to stratify subpopulations after t-SNE is performed. ACCENSE uses a density-based peak-finding algorithm to partition cells on the 2D t-SNE map into clusters. Importantly, the number of clusters derived is driven by the data and not directly specified by the user. Human expertise is required to interpret and define the cellular identity of each cluster, although a computational method to objectively characterize cell population identity through marker enrichment modeling was recently described (181).
Machine Learning and Statistical Analysis Approaches
Clustering and dimensionality reduction and tools such as SPADE and viSNE have been successfully applied to identify clusters of cells and annotate these into biologically relevant subpopulations based on the representation of each subset within the total cell pool. These methods, however, do not allow for more complex analyses, such as quantification of the differences between biological settings, or experimental bias and batch effects. For example, in the case of HSCT, multiple time-points may be analyzed and compared for each patient, with significant changes in the volume and cellularity of blood samples and relative proportions of monocytes to lymphocytes during immune reconstitution.
Packages such as SPADEVizR (182) enable the cell clusters generated in automated clustering tools like SPADE to be further interrogated and statistically analyzed to identify biologically significant clusters that are differentially abundant between conditions or that correlate with additional biological variables. A number of integrated tools to analyze “differential expression” between conditions have also been proposed, largely relying on preliminary clustering steps. These include Citrus, ImmunoClust, and SWIFT (160, 171, 183, 184).
Citrus
Citrus (cluster identification, characterization, and regression) (160) is a machine learning tool which automatically identifies high-dimensional cell clusters that correlate with a defined experimental end-point, such as patient outcome, disease state, or survival time. Cells from all samples are combined in an aggregate data set and hierarchical clustering performed to find clusters of phenotypically similar cells. A regularized regression model then identifies clusters that differ significantly in abundance or median marker expression between experimental groups and that can predict the end-point of interest. In their investigation of cGvHD immune profiles in HSCT patients, Stikvoort and co-workers (132) used Citrus to detect six immune cell clusters, including B cell, NKT-like cell and CD4+ T cell subsets, that were differentially regulated in patients with mild cGVHD and those without cGVHD.
Emerging Machine Learning Methods
More recently, machine learning methods that do not rely on dimensionality reduction as a prior step have emerged, such as CYDAR (185). This approach is based on identifying cells with differential protein abundance using hyperspheres in high-dimensional space. A statistical test based on negative binomial generalized linear models (previously utilized for single-cell RNAseq) is performed to test for variation in the average counts in each hypersphere, followed by a multiple correction test to estimate the false discovery rate.
A classical machine learning method for feature selection (elastic net) was recently applied to mass cytometry performed on B cell precursor acute lymphoblastic leukemia (BCP-ALL) samples at diagnosis (186). In this work, 36 phenotypic and functional cellular markers were sufficient to identify distinct developmental trajectories of B cells in children with BCP-ALL. The analysis identified six features of expanded leukemic populations at the time of diagnosis that were sufficient to predict patient relapse (186).
Conclusion and Future Perspectives
Reconstitution of a donor-derived immune system is critical in achieving favorable clinical outcomes for transplant recipients. The development of mass cytometry promises to expand our ability to interrogate the diverse changes in immune cell subset frequencies, phenotypes and functions that occur across the hematopoietic system as it reconstitutes after HSCT. From comprehensive immunophenotypic profiling of specific immune cell populations to broader investigations of the global pattern of cellular immune reconstitution, the increased breadth of markers that can be assessed simultaneously by single-cell mass cytometry opens new possibilities for the discovery of informative immune signatures connected with post-transplant outcomes such as infection, relapse, GvHD and overall survival. Knowledge of such immune parameters could ultimately be used to predict the post-transplant course of individual patients or be harnessed to enhance immune reconstitution through the development of novel immunotherapies and graft manipulation strategies.
For mass cytometry to become a viable clinical monitoring tool beyond the research laboratory, future improvements in technology accessibility, efficiency and the speed of data acquisition and analysis pipelines will be necessary. Applying the insights gained from high-dimensional mass cytometry studies to inform the design of smaller flow cytometry panels for rapid use in the clinic is a current approach with much potential (132). It is anticipated that advances in conjugation chemistry and metal isotope purification methods in coming years will lead to increases in the sensitivity of mass cytometry and will potentially extend its multiparametric capabilities beyond 100 concurrent single-cell markers. Already, the core technology of mass cytometry has been adapted to facilitate highly multiplexed imaging of tissue sections through the development of the Hyperion™ imaging mass cytometry system (187, 188). The challenges of navigating such complex data sets remain and collaborations between clinical researchers, cytometry facilities and bioinformatic experts will be key to realizing the productive potential of mass cytometry for biological research across a range of contexts. For the assessment of immune reconstitution after HSCT in particular, integrating single-cell mass cytometry with existing immune monitoring techniques will likely lead to a better understanding of immune regulation in HSCT recipients and opportunities to improve patient outcome.
Author Contributions
All authors contributed expertise, wrote, and reviewed the manuscript.
Conflict of Interest Statement
The authors declare that the research was conducted in the absence of any commercial or financial relationships that could be construed as a potential conflict of interest.
Acknowledgments
The authors would like to thank Thomas Ashhurst, Caryn van Vreden, and Felix Marsh-Wakefield for sharing valuable insights on mass cytometry.
Funding
This work was supported by the Australian National Health and Medical Research Council (NHMRC), the Leukaemia Foundation of Australia, Cancer Council of New South Wales, NSW Cancer Institute, and the Royal Australasian College of Pathologists. FL and EB are NHMRC post-doctoral fellows. LS was supported by an Australian Government Research Training Program Scholarship.
References
1. Mackall C, Fry T, Gress R, Peggs K, Storek J, Toubert A. Background to hematopoietic cell transplantation, including post transplant immune recovery. Bone Marrow Transplant (2009) 44(8):457–62. doi:10.1038/bmt.2009.255
2. Geddes M, Storek J. Immune reconstitution following hematopoietic stem-cell transplantation. Best Pract Res Clin Haematol (2007) 20(2):329–48. doi:10.1016/j.beha.2006.09.009
3. Mathé G, Amiel JL, Schwarzenberg L, Cattan A, Schneider M, De Vries MJ, et al. Successful allogenic bone marrow transplantation in man: chimerism, induced specific tolerance and possible anti-leukemic effects. Blood (1965) 25(2):179–96.
4. Ault KA, Antin JH, Ginsburg D, Orkin SH, Rappeport JM, Keohan ML, et al. Phenotype of recovering lymphoid cell populations after marrow transplantation. J Exp Med (1985) 161(6):1483–502. doi:10.1084/jem.161.6.1483
5. Atkinson K. T cell subpopulations defined by monoclonal antibodies after HLA-identical sibling marrow transplantation. II. Activated and functional subsets of helper-inducer and cytotoxic-suppressor subpopulations defined by two-colour fluorescence flow cytometry. Bone Marrow Transplant (1986) 1(2):121–32.
6. Janossy G, Prentice HG, Grob JP, Ivory K, Tidman N, Grundy J, et al. T lymphocyte regeneration after transplantation of T cell depleted allogeneic bone marrow. Clin Exp Immunol (1986) 63(3):577–86.
7. Parra C, Roldan E, Rodriguez C, Perez de Oteyza J, Otheo E, Lopez J, et al. Immunologic reconstitution of peripheral blood lymphocytes in patients treated by bone marrow transplantation. Med Clin (Barc) (1996) 106(5):169–73.
8. Parrado A, Casares S, Prieto J, Carmona M, Vaquero A, Rodriguez-Fernandez JM. Repopulation of circulating T, B and NK lymphocytes following bone marrow and blood stem cell transplantation. Hematol Cell Ther (1997) 39(6):301–6. doi:10.1007/s00282-997-0301-3
9. Voltarelli JC. Applications of flow cytometry to hematopoietic stem cell transplantation. Mem Inst Oswaldo Cruz (2000) 95:403–14. doi:10.1590/S0074-02762000000300018
10. O’Donnell EA, Ernst DN, Hingorani R. Multiparameter flow cytometry: advances in high resolution analysis. Immune Netw (2013) 13(2):43–54. doi:10.4110/in.2013.13.2.43
11. Lakshmikanth T, Olin A, Chen Y, Mikes J, Fredlund E, Remberger M, et al. Mass cytometry and topological data analysis reveal immune parameters associated with complications after allogeneic stem cell transplantation. Cell Rep (2017) 20(9):2238–50. doi:10.1016/j.celrep.2017.08.021
12. Baron F, Baker JE, Storb R, Gooley TA, Sandmaier BM, Maris MB, et al. Kinetics of engraftment in patients with hematologic malignancies given allogeneic hematopoietic cell transplantation after nonmyeloablative conditioning. Blood (2004) 104(8):2254–62. doi:10.1182/blood-2004-04-1506
13. Servais S, Lengline E, Porcher R, Carmagnat M, Peffault de Latour R, Robin M, et al. Long-term immune reconstitution and infection burden after mismatched hematopoietic stem cell transplantation. Biol Blood Marrow Transplant (2014) 20(4):507–17. doi:10.1016/j.bbmt.2014.01.001
14. Podgorny PJ, Liu Y, Dharmani-Khan P, Pratt LM, Jamani K, Luider J, et al. Immune cell subset counts associated with graft-versus-host disease. Biol Blood Marrow Transplant (2014) 20(4):450–62. doi:10.1016/j.bbmt.2014.01.002
15. Abrahamsen IW, Somme S, Heldal D, Egeland T, Kvale D, Tjonnfjord GE. Immune reconstitution after allogeneic stem cell transplantation: the impact of stem cell source and graft-versus-host disease. Haematologica (2005) 90(1):86–93.
16. Kheav VD, Busson M, Scieux C, Peffault de Latour R, Maki G, Haas P, et al. Favorable impact of natural killer cell reconstitution on chronic graft-versus-host disease and cytomegalovirus reactivation after allogeneic hematopoietic stem cell transplantation. Haematologica (2014) 99(12):1860–7. doi:10.3324/haematol.2014.108407
17. Lugthart G, van Ostaijen-Ten Dam MM, Jol-van der Zijde CM, van Holten TC, Kester MG, Heemskerk MH, et al. Early cytomegalovirus reactivation leaves a specific and dynamic imprint on the reconstituting T cell compartment long-term after hematopoietic stem cell transplantation. Biol Blood Marrow Transplant (2014) 20(5):655–61. doi:10.1016/j.bbmt.2014.01.018
18. Itzykson R, Robin M, Moins-Teisserenc H, Delord M, Busson M, Xhaard A, et al. Cytomegalovirus shapes long-term immune reconstitution after allogeneic stem cell transplantation. Haematologica (2015) 100(1):114–23. doi:10.3324/haematol.2014.113415
19. Kim DH, Sohn SK, Won DI, Lee NY, Suh JS, Lee KB. Rapid helper T-cell recovery above 200 x 10 6/l at 3 months correlates to successful transplant outcomes after allogeneic stem cell transplantation. Bone Marrow Transplant (2006) 37(12):1119–28. doi:10.1038/sj.bmt.1705381
20. Savani BN, Rezvani K, Mielke S, Montero A, Kurlander R, Carter CS, et al. Factors associated with early molecular remission after T cell-depleted allogeneic stem cell transplantation for chronic myelogenous leukemia. Blood (2006) 107(4):1688–95. doi:10.1182/blood-2005-05-1897
21. Thoma MD, Huneke TJ, DeCook LJ, Johnson ND, Wiegand RA, Litzow MR, et al. Peripheral blood lymphocyte and monocyte recovery and survival in acute leukemia postmyeloablative allogeneic hematopoietic stem cell transplant. Biol Blood Marrow Transplant (2012) 18(4):600–7. doi:10.1016/j.bbmt.2011.08.007
22. Green R, Wachsmann-Hogiu S. Development, history, and future of automated cell counters. Clin Lab Med (2015) 35(1):1–10. doi:10.1016/j.cll.2014.11.003
23. Kim DH, Kim JG, Sohn SK, Sung WJ, Suh JS, Lee KS, et al. Clinical impact of early absolute lymphocyte count after allogeneic stem cell transplantation. Br J Haematol (2004) 125(2):217–24. doi:10.1111/j.1365-2141.2004.04891.x
24. Savani BN, Mielke S, Rezvani K, Montero A, Yong AS, Wish L, et al. Absolute lymphocyte count on day 30 is a surrogate for robust hematopoietic recovery and strongly predicts outcome after T-cell depleted allogeneic stem cell transplantation. Biol Blood Marrow Transplant (2007) 13(10):1216–23. doi:10.1016/j.bbmt.2007.07.005
25. Le Blanc K, Barrett AJ, Schaffer M, Hagglund H, Ljungman P, Ringden O, et al. Lymphocyte recovery is a major determinant of outcome after matched unrelated myeloablative transplantation for myelogenous malignancies. Biol Blood Marrow Transplant (2009) 15(9):1108–15. doi:10.1016/j.bbmt.2009.05.015
26. Storek J, Dawson MA, Storer B, Stevens-Ayers T, Maloney DG, Marr KA, et al. Immune reconstitution after allogeneic marrow transplantation compared with blood stem cell transplantation. Blood (2001) 97(11):3380–9. doi:10.1182/blood.V97.11.3380
27. Peggs KS, Mackinnon S. Immune reconstitution following haematopoietic stem cell transplantation. Br J Haematol (2004) 124(4):407–20. doi:10.1046/j.1365-2141.2003.04767.x
28. Dudakov JA, Perales M-A, van den Brink MRM. Chapter 15: Immune reconstitution following hematopoietic cell transplantation. In: Forman SJ, Negrin RS, Antin JH, Appelbaum FR, editors. Thomas’ Hematopoietic Cell Transplantation: Stem Cell Transplantation. 5th Ed (Vol I). Registered Office: West Sussex, UK; Editorial Offices: Oxford, UK; West Sussex, UK; Hoboken, NJ, USA; Printed in Singapore (2016). p. 160–9.
29. Anasetti C, Amos D, Beatty PG, Appelbaum FR, Bensinger W, Buckner CD, et al. Effect of HLA compatibility on engraftment of bone marrow transplants in patients with leukemia or lymphoma. N Engl J Med (1989) 320(4):197–204. doi:10.1056/NEJM198901263200401
30. Kollman C, Howe CW, Anasetti C, Antin JH, Davies SM, Filipovich AH, et al. Donor characteristics as risk factors in recipients after transplantation of bone marrow from unrelated donors: the effect of donor age. Blood (2001) 98(7):2043–51. doi:10.1182/blood.V98.7.2043
31. Korbling M, Anderlini P. Peripheral blood stem cell versus bone marrow allotransplantation: does the source of hematopoietic stem cells matter? Blood (2001) 98(10):2900–8. doi:10.1182/blood.V98.10.2900
32. Heining C, Spyridonidis A, Bernhardt E, Schulte-Monting J, Behringer D, Grullich C, et al. Lymphocyte reconstitution following allogeneic hematopoietic stem cell transplantation: a retrospective study including 148 patients. Bone Marrow Transplant (2007) 39(10):613–22. doi:10.1038/sj.bmt.1705648
33. Fedele R, Martino M, Garreffa C, Messina G, Console G, Princi D, et al. The impact of early CD4+ lymphocyte recovery on the outcome of patients who undergo allogeneic bone marrow or peripheral blood stem cell transplantation. Blood Transfus (2012) 10(2):174–80. doi:10.2450/2012.0034-11
34. Baron F, Storer B, Maris MB, Storek J, Piette F, Metcalf M, et al. Unrelated donor status and high donor age independently affect immunologic recovery after nonmyeloablative conditioning. Biol Blood Marrow Transplant (2006) 12(11):1176–87. doi:10.1016/j.bbmt.2006.07.004
35. Gyurkocza B, Sandmaier BM. Conditioning regimens for hematopoietic cell transplantation: one size does not fit all. Blood (2014) 124(3):344–53. doi:10.1182/blood-2014-02-514778
36. Vadakekolathu J, Rutella S. T-cell manipulation strategies to prevent graft-versus-host disease in haploidentical stem cell transplantation. Biomedicines (2017) 5(2):E33. doi:10.3390/biomedicines5020033
37. Wagner JE, Barker JN, DeFor TE, Baker KS, Blazar BR, Eide C, et al. Transplantation of unrelated donor umbilical cord blood in 102 patients with malignant and nonmalignant diseases: influence of CD34 cell dose and HLA disparity on treatment-related mortality and survival. Blood (2002) 100(5):1611–8. doi:10.1182/blood-2002-01-0294
38. Rocha V, Labopin M, Sanz G, Arcese W, Schwerdtfeger R, Bosi A, et al. Transplants of umbilical-cord blood or bone marrow from unrelated donors in adults with acute leukemia. N Engl J Med (2004) 351(22):2276–85. doi:10.1056/NEJMoa041469
39. Komanduri KV, St. John LS, de Lima M, McMannis J, Rosinski S, McNiece I, et al. Delayed immune reconstitution after cord blood transplantation is characterized by impaired thymopoiesis and late memory T-cell skewing. Blood (2007) 110(13):4543–51. doi:10.1182/blood-2007-05-092130
40. Ottinger HD, Beelen DW, Scheulen B, Schaefer UW, Grosse-Wilde H. Improved immune reconstitution after allotransplantation of peripheral blood stem cells instead of bone marrow. Blood (1996) 88(7):2775–9.
41. Cutler C, Giri S, Jeyapalan S, Paniagua D, Viswanathan A, Antin JH. Acute and chronic graft-versus-host disease after allogeneic peripheral-blood stem-cell and bone marrow transplantation: a meta-analysis. J Clin Oncol (2001) 19(16):3685–91. doi:10.1200/jco.2001.19.16.3685
42. Bertaina A, Merli P, Rutella S, Pagliara D, Bernardo ME, Masetti R, et al. HLA-haploidentical stem cell transplantation after removal of alphabeta+ T and B cells in children with nonmalignant disorders. Blood (2014) 124(5):822–6. doi:10.1182/blood-2014-03-563817
43. Lang P, Feuchtinger T, Teltschik HM, Schwinger W, Schlegel P, Pfeiffer M, et al. Improved immune recovery after transplantation of TCRalphabeta/CD19-depleted allografts from haploidentical donors in pediatric patients. Bone Marrow Transplant (2015) 50(Suppl 2):S6–10. doi:10.1038/bmt.2015.87
44. Cruz CR, Bollard CM. T-cell and natural killer cell therapies for hematologic malignancies after hematopoietic stem cell transplantation: enhancing the graft-versus-leukemia effect. Haematologica (2015) 100(6):709–19. doi:10.3324/haematol.2014.113860
45. Di Ianni M, Falzetti F, Carotti A, Terenzi A, Castellino F, Bonifacio E, et al. Tregs prevent GVHD and promote immune reconstitution in HLA-haploidentical transplantation. Blood (2011) 117(14):3921–8. doi:10.1182/blood-2010-10-311894
46. Bosch M, Khan FM, Storek J. Immune reconstitution after hematopoietic cell transplantation. Curr Opin Hematol (2012) 19(4):324–35. doi:10.1097/MOH.0b013e328353bc7d
47. Douek DC, McFarland RD, Keiser PH, Gage EA, Massey JM, Haynes BF, et al. Changes in thymic function with age and during the treatment of HIV infection. Nature (1998) 396(6712):690–5. doi:10.1038/25374
48. Goncalves TL, Benvegnu DM, Bonfanti G. Specific factors influence the success of autologous and allogeneic hematopoietic stem cell transplantation. Oxid Med Cell Longev (2009) 2(2):82–7. doi:10.4161/oxim.2.2.8355
49. Seggewiss R, Einsele H. Immune reconstitution after allogeneic transplantation and expanding options for immunomodulation: an update. Blood (2010) 115(19):3861–8. doi:10.1182/blood-2009-12-234096
50. Sato T, Kobayashi R, Nakajima M, Iguchi A, Ariga T. Significance of eosinophilia after stem cell transplantation as a possible prognostic marker for favorable outcome. Bone Marrow Transplant (2005) 36(11):985–91. doi:10.1038/sj.bmt.1705168
51. Pechumer H, Leinisch E, Bender-Gotze C, Ziegler-Heitbrock HW. Recovery of monocytes after bone marrow transplantation-rapid reappearance of tumor necrosis factor alpha and interleukin 6 production. Transplantation (1991) 52(4):698–704. doi:10.1097/00007890-199110000-00022
52. Storek J. Immunological reconstitution after hematopoietic cell transplantation – its relation to the contents of the graft. Expert Opin Biol Ther (2008) 8(5):583–97. doi:10.1517/14712598.8.5.583
53. Rommeley M, Spies-Weisshart B, Schilling K, Hochhaus A, Sayer HG, Scholl S. Reconstitution and functional analyses of neutrophils and distinct subsets of monocytes after allogeneic stem cell transplantation. J Cancer Res Clin Oncol (2011) 137(9):1293–300. doi:10.1007/s00432-011-0989-x
54. Chklovskaia E, Nowbakht P, Nissen C, Gratwohl A, Bargetzi M, Wodnar-Filipowicz A. Reconstitution of dendritic and natural killer-cell subsets after allogeneic stem cell transplantation: effects of endogenous flt3 ligand. Blood (2004) 103(10):3860–8. doi:10.1182/blood-2003-04-1200
55. Porta MD, Rigolin GM, Alessandrino EP, Maiocchi M, Malcovati L, Vanelli L, et al. Dendritic cell recovery after allogeneic stem-cell transplantation in acute leukemia: correlations with clinical and transplant characteristics. Eur J Haematol (2004) 72(1):18–25. doi:10.1046/j.0902-4441.2004.00172.x
56. Auffermann-Gretzinger S, Lossos IS, Vayntrub TA, Leong W, Grumet FC, Blume KG, et al. Rapid establishment of dendritic cell chimerism in allogeneic hematopoietic cell transplant recipients. Blood (2002) 99(4):1442–8. doi:10.1182/blood.V99.4.1442
57. Ullah MA, Hill GR, Tey S-K. Functional reconstitution of natural killer cells in allogeneic hematopoietic stem cell transplantation. Front Immunol (2016) 7:144. doi:10.3389/fimmu.2016.00144
58. Dulphy N, Haas P, Busson M, Belhadj S, Peffault de Latour R, Robin M, et al. An unusual CD56bright CD16low NK cell subset dominates the early posttransplant period following HLA-matched hematopoietic stem cell transplantation. J Immunol (2008) 181(3):2227–37. doi:10.4049/jimmunol.181.3.2227
59. Huenecke S, Cappel C, Esser R, Pfirrmann V, Salzmann-Manrique E, Betz S, et al. Development of three different NK cell subpopulations during immune reconstitution after pediatric allogeneic hematopoietic stem cell transplantation: prognostic markers in GvHD and viral infections. Front Immunol (2017) 8:109. doi:10.3389/fimmu.2017.00109
60. Foley B, Cooley S, Verneris MR, Curtsinger J, Luo X, Waller EK, et al. NK cell education after allogeneic transplantation: dissociation between recovery of cytokine-producing and cytotoxic functions. Blood (2011) 118(10):2784–92. doi:10.1182/blood-2011-04-347070
61. Ruggeri L, Capanni M, Casucci M, Volpi I, Tosti A, Perruccio K, et al. Role of natural killer cell alloreactivity in HLA-mismatched hematopoietic stem cell transplantation. Blood (1999) 94(1):333–9.
62. Ruggeri L, Capanni M, Urbani E, Perruccio K, Shlomchik WD, Tosti A, et al. Effectiveness of donor natural killer cell alloreactivity in mismatched hematopoietic transplants. Science (2002) 295(5562):2097–100. doi:10.1126/science.1068440
63. Savani BN, Mielke S, Adams S, Uribe M, Rezvani K, Yong AS, et al. Rapid natural killer cell recovery determines outcome after T-cell-depleted HLA-identical stem cell transplantation in patients with myeloid leukemias but not with acute lymphoblastic leukemia. Leukemia (2007) 21(10):2145–52. doi:10.1038/sj.leu.2404892
64. Ljungman P, Hakki M, Boeckh M. Cytomegalovirus in hematopoietic stem cell transplant recipients. Hematol Oncol Clin North Am (2011) 25(1):151–69. doi:10.1016/j.hoc.2010.11.011
65. Della Chiesa M, Falco M, Podesta M, Locatelli F, Moretta L, Frassoni F, et al. Phenotypic and functional heterogeneity of human NK cells developing after umbilical cord blood transplantation: a role for human cytomegalovirus? Blood (2012) 119(2):399–410. doi:10.1182/blood-2011-08-372003
66. Foley B, Cooley S, Verneris MR, Pitt M, Curtsinger J, Luo X, et al. Cytomegalovirus reactivation after allogeneic transplantation promotes a lasting increase in educated NKG2C+ natural killer cells with potent function. Blood (2012) 119(11):2665–74. doi:10.1182/blood-2011-10-386995
67. Kroger N, Zagrivnaja M, Schwartz S, Badbaran A, Zabelina T, Lioznov M, et al. Kinetics of plasma-cell chimerism after allogeneic stem cell transplantation by highly sensitive real-time PCR based on sequence polymorphism and its value to quantify minimal residual disease in patients with multiple myeloma. Exp Hematol (2006) 34(5):688–94. doi:10.1016/j.exphem.2006.01.011
68. Small TN, Keever CA, Weiner-Fedus S, Heller G, O’Reilly RJ, Flomenberg N. B-cell differentiation following autologous, conventional, or T-cell depleted bone marrow transplantation: a recapitulation of normal B-cell ontogeny. Blood (1990) 76(8):1647–56.
69. Marie-Cardine A, Divay F, Dutot I, Green A, Perdrix A, Boyer O, et al. Transitional B cells in humans: characterization and insight from B lymphocyte reconstitution after hematopoietic stem cell transplantation. Clin Immunol (2008) 127(1):14–25. doi:10.1016/j.clim.2007.11.013
70. Storek J, Witherspoon RP, Webb D, Storb R. Lack of B cells precursors in marrow transplant recipients with chronic graft-versus-host disease. Am J Hematol (1996) 52(2):82–9. doi:10.1002/(SICI)1096-8652(199606)52:2<82:AID-AJH3>3.0.CO;2-1
71. D’Costa S, Slobod KS, Benaim E, Bowman L, Cunningham J, Holladay M, et al. Effect of extended immunosuppressive drug treatment on B cell vs T cell reconstitution in pediatric bone marrow transplant recipients. Bone Marrow Transplant (2001) 28(6):573–80. doi:10.1038/sj.bmt.1703185
72. Storek J, Wells D, Dawson MA, Storer B, Maloney DG. Factors influencing B lymphopoiesis after allogeneic hematopoietic cell transplantation. Blood (2001) 98(2):489–91. doi:10.1182/blood.V98.2.489
73. Mensen A, Johrens K, Anagnostopoulos I, Demski S, Oey M, Stroux A, et al. Bone marrow T-cell infiltration during acute GVHD is associated with delayed B-cell recovery and function after HSCT. Blood (2014) 124(6):963–72. doi:10.1182/blood-2013-11-539031
74. Avanzini MA, Locatelli F, Dos Santos C, Maccario R, Lenta E, Oliveri M, et al. B lymphocyte reconstitution after hematopoietic stem cell transplantation: functional immaturity and slow recovery of memory CD27+ B cells. Exp Hematol (2005) 33(4):480–6. doi:10.1016/j.exphem.2005.01.005
75. Corre E, Carmagnat M, Busson M, de Latour RP, Robin M, Ribaud P, et al. Long-term immune deficiency after allogeneic stem cell transplantation: B-cell deficiency is associated with late infections. Haematologica (2010) 95(6):1025–9. doi:10.3324/haematol.2009.018853
76. D’Orsogna LJ, Wright MP, Krueger RG, McKinnon EJ, Buffery SI, Witt CS, et al. Allogeneic hematopoietic stem cell transplantation recipients have defects of both switched and IgM memory B cells. Biol Blood Marrow Transplant (2009) 15(7):795–803. doi:10.1016/j.bbmt.2008.11.024
77. Suzuki I, Milner EC, Glas AM, Hufnagle WO, Rao SP, Pfister L, et al. Immunoglobulin heavy chain variable region gene usage in bone marrow transplant recipients: lack of somatic mutation indicates a maturational arrest. Blood (1996) 87(5):1873–80.
78. Storek J, King L, Ferrara S, Marcelo D, Saxon A, Braun J. Abundance of a restricted fetal B cell repertoire in marrow transplant recipients. Bone Marrow Transplant (1994) 14(5):783–90.
79. Nasman-Bjork I, Lundkvist I. Oligoclonal dominance of immunoglobulin VH3 rearrangements following allogeneic bone marrow transplantation. Bone Marrow Transplant (1998) 21(12):1223–30. doi:10.1038/sj.bmt.1701261
80. Omazic B, Lundkvist I, Mattsson J, Permert J, Nasman-Bjork I. Memory B lymphocytes determine repertoire oligoclonality early after haematopoietic stem cell transplantation. Clin Exp Immunol (2003) 134(1):159–66. doi:10.1046/j.1365-2249.2003.02260.x
81. Fry TJ, Mackall CL. Immune reconstitution following hematopoietic progenitor cell transplantation: challenges for the future. Bone Marrow Transplant (2005) 35(Suppl 1):S53–7. doi:10.1038/sj.bmt.1704848
82. Bolotin E, Annett G, Parkman R, Weinberg K. Serum levels of IL-7 in bone marrow transplant recipients: relationship to clinical characteristics and lymphocyte count. Bone Marrow Transplant (1999) 23(8):783–8. doi:10.1038/sj.bmt.1701655
83. Mackall CL, Fry TJ, Bare C, Morgan P, Galbraith A, Gress RE. IL-7 increases both thymic-dependent and thymic-independent T-cell regeneration after bone marrow transplantation. Blood (2001) 97(5):1491–7. doi:10.1182/blood.V97.5.1491
84. Williams KM, Gress RE. Immune reconstitution and implications for immunotherapy following haematopoietic stem cell transplantation. Best Pract Res Clin Haematol (2008) 21(3):579–96. doi:10.1016/j.beha.2008.06.003
85. Bolton HA, Zhu E, Terry AM, Guy TV, Koh W-P, Tan S-Y, et al. Selective Treg reconstitution during lymphopenia normalizes DC costimulation and prevents graft-versus-host disease. J Clin Invest (2015) 125(9):3627–41. doi:10.1172/JCI76031
86. Heitger A, Neu N, Kern H, Panzer-Grumayer ER, Greinix H, Nachbaur D, et al. Essential role of the thymus to reconstitute naive (CD45RA+) T-helper cells after human allogeneic bone marrow transplantation. Blood (1997) 90(2):850–7.
87. Dumont-Girard F, Roux E, van Lier RA, Hale G, Helg C, Chapuis B, et al. Reconstitution of the T-cell compartment after bone marrow transplantation: restoration of the repertoire by thymic emigrants. Blood (1998) 92(11):4464–71.
88. Douek DC, Vescio RA, Betts MR, Brenchley JM, Hill BJ, Zhang L, et al. Assessment of thymic output in adults after haematopoietic stem-cell transplantation and prediction of T-cell reconstitution. Lancet (2000) 355(9218):1875–81. doi:10.1016/S0140-6736(00)02293-5
89. Weinberg K, Blazar BR, Wagner JE, Agura E, Hill BJ, Smogorzewska M, et al. Factors affecting thymic function after allogeneic hematopoietic stem cell transplantation. Blood (2001) 97(5):1458–66. doi:10.1182/blood.V97.5.1458
90. Storek J, Joseph A, Dawson MA, Douek DC, Storer B, Maloney DG. Factors influencing T-lymphopoiesis after allogeneic hematopoietic cell transplantation. Transplantation (2002) 73(7):1154–8. doi:10.1097/00007890-200204150-00026
91. Hakim FT, Memon SA, Cepeda R, Jones EC, Chow CK, Kasten-Sportes C, et al. Age-dependent incidence, time course, and consequences of thymic renewal in adults. J Clin Invest (2005) 115(4):930–9. doi:10.1172/JCI22492
92. Clave E, Busson M, Douay C, Peffault de Latour R, Berrou J, Rabian C, et al. Acute graft-versus-host disease transiently impairs thymic output in young patients after allogeneic hematopoietic stem cell transplantation. Blood (2009) 113(25):6477–84. doi:10.1182/blood-2008-09-176594
93. Sale GE, Alavaikko M, Schaefers KM, Mahan CT. Abnormal CD4:CD8 ratios and delayed germinal center reconstitution in lymph nodes of human graft recipients with graft-versus-host disease (GVHD): an immunohistological study. Exp Hematol (1992) 20(8):1017–21.
94. Mackall CL, Fleisher TA, Brown MR, Andrich MP, Chen CC, Feuerstein IM, et al. Distinctions between CD8+ and CD4+ T-cell regenerative pathways result in prolonged T-cell subset imbalance after intensive chemotherapy. Blood (1997) 89(10):3700–7.
95. Storek J, Joseph A, Espino G, Dawson MA, Douek DC, Sullivan KM, et al. Immunity of patients surviving 20 to 30 years after allogeneic or syngeneic bone marrow transplantation. Blood (2001) 98(13):3505–12. doi:10.1182/blood.V98.13.3505
96. Alho AC, Kim HT, Chammas MJ, Reynolds CG, Matos TR, Forcade E, et al. Unbalanced recovery of regulatory and effector T cells after allogeneic stem cell transplantation contributes to chronic GVHD. Blood (2016) 127(5):646–57. doi:10.1182/blood-2015-10-672345
97. Zorn E, Kim HT, Lee SJ, Floyd BH, Litsa D, Arumugarajah S, et al. Reduced frequency of FOXP3+ CD4+CD25+ regulatory T cells in patients with chronic graft-versus-host disease. Blood (2005) 106(8):2903–11. doi:10.1182/blood-2005-03-1257
98. Li Q, Zhai Z, Xu X, Shen Y, Zhang A, Sun Z, et al. Decrease of CD4(+)CD25(+) regulatory T cells and TGF-beta at early immune reconstitution is associated to the onset and severity of graft-versus-host disease following allogeneic haematogenesis stem cell transplantation. Leuk Res (2010) 34(9):1158–68. doi:10.1016/j.leukres.2010.03.017
99. Matsuoka K, Kim HT, McDonough S, Bascug G, Warshauer B, Koreth J, et al. Altered regulatory T cell homeostasis in patients with CD4+ lymphopenia following allogeneic hematopoietic stem cell transplantation. J Clin Invest (2010) 120(5):1479–93. doi:10.1172/JCI41072
100. Kim D, Al-Dawsari G, Chang H, Panzarella T, Gupta V, Kuruvilla J, et al. Large granular lymphocytosis and its impact on long-term clinical outcomes following allo-SCT. Bone Marrow Transplant (2013) 48(8):1104–11. doi:10.1038/bmt.2013.5
101. Poch Martell M, Hamad N, Shin E, Moon JH, Sohn SK, Uhm J, et al. Distinctive clinical characteristics and favorable outcomes in patients with large granular lymphocytosis after allo-HCT: 12-year follow-up data. Eur J Haematol (2017) 99(2):160–8. doi:10.1111/ejh.12899
102. Buhlmann L, Buser AS, Cantoni N, Gerull S, Tichelli A, Gratwohl A, et al. Lymphocyte subset recovery and outcome after T-cell replete allogeneic hematopoietic SCT. Bone Marrow Transplant (2011) 46(10):1357–62. doi:10.1038/bmt.2010.306
103. Ornatsky O, Baranov VI, Bandura DR, Tanner SD, Dick J. Multiple cellular antigen detection by ICP-MS. J Immunol Methods (2006) 308(1):68–76. doi:10.1016/j.jim.2005.09.020
104. Bandura DR, Baranov VI, Ornatsky OI, Antonov A, Kinach R, Lou X, et al. Mass cytometry: technique for real time single cell multitarget immunoassay based on inductively coupled plasma time-of-flight mass spectrometry. Anal Chem (2009) 81(16):6813–22. doi:10.1021/ac901049w
105. Bendall SC, Nolan GP, Roederer M, Chattopadhyay PK. A deep profiler’s guide to cytometry. Trends Immunol (2012) 33(7):323–32. doi:10.1016/j.it.2012.02.010
106. Bendall SC, Simonds EF, Qiu P, Amir el- AD, Krutzik PO, Finck R, et al. Single-cell mass cytometry of differential immune and drug responses across a human hematopoietic continuum. Science (2011) 332(6030):687–96. doi:10.1126/science.1198704
107. Bendall SC, Davis KL, Amir el- AD, Tadmor MD, Simonds EF, Chen TJ, et al. Single-cell trajectory detection uncovers progression and regulatory coordination in human B cell development. Cell (2014) 157(3):714–25. doi:10.1016/j.cell.2014.04.005
108. Behbehani GK, Bendall SC, Clutter MR, Fantl WJ, Nolan GP. Single-cell mass cytometry adapted to measurements of the cell cycle. Cytometry A (2012) 81(7):552–66. doi:10.1002/cyto.a.22075
109. Newell EW, Sigal N, Bendall SC, Nolan GP, Davis MM. Cytometry by time-of-flight shows combinatorial cytokine expression and virus-specific cell niches within a continuum of CD8(+) T cell phenotypes. Immunity (2012) 36(1):142–52. doi:10.1016/j.immuni.2012.01.002
110. Horowitz A, Strauss-Albee DM, Leipold M, Kubo J, Nemat-Gorgani N, Dogan OC, et al. Genetic and environmental determinants of human NK cell diversity revealed by mass cytometry. Sci Transl Med (2013) 5(208):208ra145. doi:10.1126/scitranslmed.3006702
111. Strauss-Albee DM, Horowitz A, Parham P, Blish CA. Coordinated regulation of NK receptor expression in the maturing human immune system. J Immunol (2014) 193(10):4871–9. doi:10.4049/jimmunol.1401821
112. Mason GM, Lowe K, Melchiotti R, Ellis R, de Rinaldis E, Peakman M, et al. Phenotypic complexity of the human regulatory T cell compartment revealed by mass cytometry. J Immunol (2015) 195(5):2030–7. doi:10.4049/jimmunol.1500703
113. Roussel M, Ferrell PB Jr, Greenplate AR, Lhomme F, Le Gallou S, Diggins KE, et al. Mass cytometry deep phenotyping of human mononuclear phagocytes and myeloid-derived suppressor cells from human blood and bone marrow. J Leukoc Biol (2017) 102(2):437–47. doi:10.1189/jlb.5MA1116-457R
114. Kunicki MA, Amaya Hernandez LC, Davis KL, Bacchetta R, Roncarolo MG. Identity and diversity of human peripheral Th and T regulatory cells defined by single-cell mass cytometry. J Immunol (2018) 200(1):336–46. doi:10.4049/jimmunol.1701025
115. Alcantara-Hernandez M, Leylek R, Wagar LE, Engleman EG, Keler T, Marinkovich MP, et al. High-dimensional phenotypic mapping of human dendritic cells reveals interindividual variation and tissue specialization. Immunity (2017) 47(6):1037–50.e1036. doi:10.1016/j.immuni.2017.11.001
116. Simoni Y, Fehlings M, Kloverpris HN, McGovern N, Koo SL, Loh CY, et al. Human innate lymphoid cell subsets possess tissue-type based heterogeneity in phenotype and frequency. Immunity (2017) 46(1):148–61. doi:10.1016/j.immuni.2016.11.005
117. Ferrell PB Jr, Diggins KE, Polikowsky HG, Mohan SR, Seegmiller AC, Irish JM. High-dimensional analysis of acute myeloid leukemia reveals phenotypic changes in persistent cells during induction therapy. PLoS One (2016) 11(4):e0153207. doi:10.1371/journal.pone.0153207
118. O’Gorman WE, Kong DS, Balboni IM, Rudra P, Bolen CR, Ghosh D, et al. Mass cytometry identifies a distinct monocyte cytokine signature shared by clinically heterogeneous pediatric SLE patients. J Autoimmun (2017) 81:74–89. doi:10.1016/j.jaut.2017.03.010
119. Rao DA, Gurish MF, Marshall JL, Slowikowski K, Fonseka CY, Liu Y, et al. Pathologically expanded peripheral T helper cell subset drives B cells in rheumatoid arthritis. Nature (2017) 542(7639):110–4. doi:10.1038/nature20810
120. Sen N, Mukherjee G, Arvin AM. Single cell mass cytometry reveals remodeling of human T cell phenotypes by varicella zoster virus. Methods (2015) 90:85–94. doi:10.1016/j.ymeth.2015.07.008
121. Corneau A, Cosma A, Even S, Katlama C, Le Grand R, Frachet V, et al. Comprehensive mass cytometry analysis of cell cycle, activation, and coinhibitory receptors expression in CD4 T cells from healthy and HIV-infected individuals. Cytometry B Clin Cytom (2017) 92(1):21–32. doi:10.1002/cyto.b.21502
122. Hamlin RE, Rahman A, Pak TR, Maringer K, Mena I, Bernal-Rubio D, et al. High-dimensional CyTOF analysis of dengue virus-infected human DCs reveals distinct viral signatures. JCI Insight (2017) 2(13):92424. doi:10.1172/jci.insight.92424
123. Gaudilliere B, Fragiadakis GK, Bruggner RV, Nicolau M, Finck R, Tingle M, et al. Clinical recovery from surgery correlates with single-cell immune signatures. Sci Transl Med (2014) 6(255):255ra131. doi:10.1126/scitranslmed.3009701
124. Lau AH, Vitalone MJ, Haas K, Shawler T, Esquivel CO, Berquist WE, et al. Mass cytometry reveals a distinct immunoprofile of operational tolerance in pediatric liver transplantation. Pediatr Transplant (2016) 20(8):1072–80. doi:10.1111/petr.12795
125. Levine JH, Simonds EF, Bendall SC, Davis KL, Amir el- AD, Tadmor MD, et al. Data-driven phenotypic dissection of AML reveals progenitor-like cells that correlate with prognosis. Cell (2015) 162(1):184–97. doi:10.1016/j.cell.2015.05.047
126. Krieg C, Nowicka M, Guglietta S, Schindler S, Hartmann FJ, Weber LM, et al. High-dimensional single-cell analysis predicts response to anti-PD-1 immunotherapy. Nat Med (2018) 24(2):144–53. doi:10.1038/nm.4466
127. Welters MJP, Ma W, Santegoets S, Goedemans R, Ehsan I, Jordanova ES, et al. Intratumoral HPV16-specific T cells constitute a type I-oriented tumor microenvironment to improve survival in HPV16-driven oropharyngeal cancer. Clin Cancer Res (2018) 24(3):634–47. doi:10.1158/1078-0432.CCR-17-2140
128. Tsang JS, Schwartzberg PL, Kotliarov Y, Biancotto A, Xie Z, Germain RN, et al. Global analyses of human immune variation reveal baseline predictors of post-vaccination responses. Cell (2014) 157(2):499–513. doi:10.1016/j.cell.2014.03.031
129. Brodin P, Jojic V, Gao T, Bhattacharya S, Angel CJL, Furman D, et al. Variation in the human immune system is largely driven by non-heritable influences. Cell (2015) 160(1–2):37–47. doi:10.1016/j.cell.2014.12.020
130. Carr EJ, Dooley J, Garcia-Perez JE, Lagou V, Lee JC, Wouters C, et al. The cellular composition of the human immune system is shaped by age and cohabitation. Nat Immunol (2016) 17(4):461–8. doi:10.1038/ni.3371
131. Brodin P, Davis MM. Human immune system variation. Nat Rev Immunol (2017) 17(1):21–9. doi:10.1038/nri.2016.125
132. Stikvoort A, Chen Y, Radestad E, Torlen J, Lakshmikanth T, Bjorklund A, et al. Combining flow and mass cytometry in the search for biomarkers in chronic graft-versus-host disease. Front Immunol (2017) 8:717. doi:10.3389/fimmu.2017.00717
133. Karnell FG, Lin D, Motley S, Duhen T, Lim N, Campbell DJ, et al. Reconstitution of immune cell populations in multiple sclerosis patients after autologous stem cell transplantation. Clin Exp Immunol (2017) 189(3):268–78. doi:10.1111/cei.12985
134. Davids MS, Kim HT, Bachireddy P, Costello C, Liguori R, Savell A, et al. Ipilimumab for patients with relapse after allogeneic transplantation. N Engl J Med (2016) 375(2):143–53. doi:10.1056/NEJMoa1601202
135. Horowitz A, Guethlein LA, Nemat-Gorgani N, Norman PJ, Cooley S, Miller JS, et al. Regulation of adaptive NK cells and CD8 T cells by HLA-C correlates with allogeneic hematopoietic cell transplantation and with CMV reactivation. J Immunol (2015) 195(9):4524–36. doi:10.4049/jimmunol.1401990
136. Skert C, Damiani D, Michelutti A, Patriarca F, Arpinati M, Fili C, et al. Kinetics of Th1/Th2 cytokines and lymphocyte subsets to predict chronic GVHD after allo-SCT: results of a prospective study. Bone Marrow Transplant (2009) 44(11):729–37. doi:10.1038/bmt.2009.80
137. Rozmus J, Schultz KR. Biomarkers in chronic graft-versus-host disease. Expert Rev Hematol (2011) 4(3):329–42. doi:10.1586/ehm.11.27
138. Pidala J, Sarwal M, Roedder S, Lee SJ. Biologic markers of chronic graft vs. host disease. Bone Marrow Transplant (2014) 49(3):324–31. doi:10.1038/bmt.2013.97
139. Yu J, Storer BE, Kushekhar K, Abu Zaid M, Zhang Q, Gafken PR, et al. Biomarker panel for chronic graft-versus-host disease. J Clin Oncol (2016) 34(22):2583–90. doi:10.1200/JCO.2015.65.9615
140. Leong ML, Newell EW. Multiplexed peptide-MHC tetramer staining with mass cytometry. Methods Mol Biol (2015) 1346:115–31. doi:10.1007/978-1-4939-2987-0_9
141. Nicholas KJ, Greenplate AR, Flaherty DK, Matlock BK, Juan JS, Smith RM, et al. Multiparameter analysis of stimulated human peripheral blood mononuclear cells: a comparison of mass and fluorescence cytometry. Cytometry A (2016) 89(3):271–80. doi:10.1002/cyto.a.22799
142. Lou X, Zhang G, Herrera I, Kinach R, Ornatsky O, Baranov V, et al. Polymer-based elemental tags for sensitive bioassays. Angew Chem Int Ed Engl (2007) 46(32):6111–4. doi:10.1002/anie.200700796
143. Mei HE, Leipold MD, Schulz AR, Chester C, Maecker HT. Barcoding of live human peripheral blood mononuclear cells for multiplexed mass cytometry. J Immunol (2015) 194(4):2022–31. doi:10.4049/jimmunol.1402661
144. Mei HE, Leipold MD, Maecker HT. Platinum-conjugated antibodies for application in mass cytometry. Cytometry A (2016) 89(3):292–300. doi:10.1002/cyto.a.22778
145. Han G, Chen SY, Gonzalez VD, Zunder ER, Fantl WJ, Nolan GP. Atomic mass tag of bismuth-209 for increasing the immunoassay multiplexing capacity of mass cytometry. Cytometry A (2017) 91(12):1150–63. doi:10.1002/cyto.a.23283
146. Schulz AR, Stanislawiak S, Baumgart S, Grutzkau A, Mei HE. Silver nanoparticles for the detection of cell surface antigens in mass cytometry. Cytometry A (2017) 91(1):25–33. doi:10.1002/cyto.a.22904
147. Leipold MD, Newell EW, Maecker HT. Multiparameter phenotyping of human PBMCs using mass cytometry. Methods Mol Biol (2015) 1343:81–95. doi:10.1007/978-1-4939-2963-4_7
148. Ornatsky OI, Lou X, Nitz M, Schafer S, Sheldrick WS, Baranov VI, et al. Study of cell antigens and intracellular DNA by identification of element-containing labels and metallointercalators using inductively coupled plasma mass spectrometry. Anal Chem (2008) 80(7):2539–47. doi:10.1021/ac702128m
149. Fienberg HG, Simonds EF, Fantl WJ, Nolan GP, Bodenmiller B. A platinum-based covalent viability reagent for single-cell mass cytometry. Cytometry A (2012) 81(6):467–75. doi:10.1002/cyto.a.22067
150. Bodenmiller B, Zunder ER, Finck R, Chen TJ, Savig ES, Bruggner RV, et al. Multiplexed mass cytometry profiling of cellular states perturbed by small-molecule regulators. Nat Biotechnol (2012) 30(9):858–67. doi:10.1038/nbt.2317
151. McCarthy RL, Mak DH, Burks JK, Barton MC. Rapid monoisotopic cisplatin based barcoding for multiplexed mass cytometry. Sci Rep (2017) 7(1):3779. doi:10.1038/s41598-017-03610-2
152. Zunder ER, Finck R, Behbehani GK, Amir el- AD, Krishnaswamy S, Gonzalez VD, et al. Palladium-based mass tag cell barcoding with a doublet-filtering scheme and single-cell deconvolution algorithm. Nat Protoc (2015) 10(2):316–33. doi:10.1038/nprot.2015.020
153. Yao Y, Liu R, Shin MS, Trentalange M, Allore H, Nassar A, et al. CyTOF supports efficient detection of immune cell subsets from small samples. J Immunol Methods (2014) 415:1–5. doi:10.1016/j.jim.2014.10.010
154. Finck R, Simonds EF, Jager A, Krishnaswamy S, Sachs K, Fantl W, et al. Normalization of mass cytometry data with bead standards. Cytometry A (2013) 83(5):483–94. doi:10.1002/cyto.a.22271
155. Bjornson ZB, Nolan GP, Fantl WJ. Single-cell mass cytometry for analysis of immune system functional states. Curr Opin Immunol (2013) 25(4):484–94. doi:10.1016/j.coi.2013.07.004
156. Baumgart S, Schulz AR, Peddinghaus A, Stanislawiak S, Gillert S, Hirseland H, et al. Dual-labelled antibodies for flow and mass cytometry: a new tool for cross-platform comparison and enrichment of target cells for mass cytometry. Eur J Immunol (2017) 47(8):1377–85. doi:10.1002/eji.201747031
157. Takahashi C, Au-Yeung A, Fuh F, Ramirez-Montagut T, Bolen C, Mathews W, et al. Mass cytometry panel optimization through the designed distribution of signal interference. Cytometry A (2017) 91(1):39–47. doi:10.1002/cyto.a.22977
158. Chevrier S, Crowell HL, Zanotelli VRT, Engler S, Robinson MD, Bodenmiller B. Compensation of signal spillover in suspension and imaging mass cytometry. Cell Syst (2018) 6(5):612–20.e615. doi:10.1016/j.cels.2018.02.010
159. Qiu P, Simonds EF, Bendall SC, Gibbs KD Jr, Bruggner RV, Linderman MD, et al. Extracting a cellular hierarchy from high-dimensional cytometry data with SPADE. Nat Biotechnol (2011) 29(10):886–91. doi:10.1038/nbt.1991
160. Bruggner RV, Bodenmiller B, Dill DL, Tibshirani RJ, Nolan GP. Automated identification of stratifying signatures in cellular subpopulations. Proc Natl Acad Sci U S A (2014) 111(26):E2770–7. doi:10.1073/pnas.1408792111
161. Van Gassen S, Callebaut B, Van Helden MJ, Lambrecht BN, Demeester P, Dhaene T, et al. FlowSOM: using self-organizing maps for visualization and interpretation of cytometry data. Cytometry A (2015) 87(7):636–45. doi:10.1002/cyto.a.22625
162. Amir el- AD, Davis KL, Tadmor MD, Simonds EF, Levine JH, Bendall SC, et al. viSNE enables visualization of high dimensional single-cell data and reveals phenotypic heterogeneity of leukemia. Nat Biotechnol (2013) 31(6):545–52. doi:10.1038/nbt.2594
163. Aghaeepour N, Finak G; FlowCAP Consortium, DREAM Consortium, Hoos H, Mosmann TR, et al. Critical assessment of automated flow cytometry data analysis techniques. Nat Methods (2013) 10(3):228–38. doi:10.1038/nmeth.2365
164. Li H, Shaham U, Stanton KP, Yao Y, Montgomery RR, Kluger Y. Gating mass cytometry data by deep learning. Bioinformatics (2017) 33(21):3423–30. doi:10.1093/bioinformatics/btx448
165. Mair F, Hartmann FJ, Mrdjen D, Tosevski V, Krieg C, Becher B. The end of gating? An introduction to automated analysis of high dimensional cytometry data. Eur J Immunol (2016) 46(1):34–43. doi:10.1002/eji.201545774
166. Newell EW, Cheng Y. Mass cytometry: blessed with the curse of dimensionality. Nat Immunol (2016) 17:890. doi:10.1038/ni.3485
167. Saeys Y, Van Gassen S, Lambrecht BN. Computational flow cytometry: helping to make sense of high-dimensional immunology data. Nat Rev Immunol (2016) 16(7):449–62. doi:10.1038/nri.2016.56
168. Kimball AK, Oko LM, Bullock BL, Nemenoff RA, van Dyk LF, Clambey ET. A beginner’s guide to analyzing and visualizing mass cytometry data. J Immunol (2018) 200(1):3–22. doi:10.4049/jimmunol.1701494
169. Finak G, Frelinger J, Jiang W, Newell EW, Ramey J, Davis MM, et al. OpenCyto: an open source infrastructure for scalable, robust, reproducible, and automated, end-to-end flow cytometry data analysis. PLoS Comput Biol (2014) 10(8):e1003806. doi:10.1371/journal.pcbi.1003806
170. Diggins KE, Ferrell PB Jr, Irish JM. Methods for discovery and characterization of cell subsets in high dimensional mass cytometry data. Methods (2015) 82:55–63. doi:10.1016/j.ymeth.2015.05.008
171. Nowicka M, Krieg C, Weber LM, Hartmann FJ, Guglietta S, Becher B, et al. CyTOF workflow: differential discovery in high-throughput high-dimensional cytometry datasets. F1000Res (2017) 6:748. doi:10.12688/f1000research.11622.2
172. Anchang B, Hart TD, Bendall SC, Qiu P, Bjornson Z, Linderman M, et al. Visualization and cellular hierarchy inference of single-cell data using SPADE. Nat Protoc (2016) 11(7):1264–79. doi:10.1038/nprot.2016.066
173. Pouyan MB, Jindal V, Birjandtalab J, Nourani M. Single and multi-subject clustering of flow cytometry data for cell-type identification and anomaly detection. BMC Med Genomics (2016) 9(Suppl 2):41. doi:10.1186/s12920-016-0201-x
174. Weber LM, Robinson MD. Comparison of clustering methods for high-dimensional single-cell flow and mass cytometry data. Cytometry A (2016) 89(12):1084–96. doi:10.1002/cyto.a.23030
175. van der Maaten L. Accelerating t-SNE using tree-based algorithms. J Mach Learn Res (2014) 15(1):3221–45.
177. DiGiuseppe JA, Tadmor MD, Pe’er D. Detection of minimal residual disease in B lymphoblastic leukemia using viSNE. Cytometry B Clin Cytom (2015) 88(5):294–304. doi:10.1002/cyto.b.21252
178. Pezzotti N, Höllt T, Lelieveldt B, Eisemann E, Vilanova A. Hierarchical stochastic neighbor embedding. Comput Graphics Forum (2016) 35(3):21–30. doi:10.1111/cgf.12878
179. van Unen V, Hollt T, Pezzotti N, Li N, Reinders MJT, Eisemann E, et al. Visual analysis of mass cytometry data by hierarchical stochastic neighbour embedding reveals rare cell types. Nat Commun (2017) 8(1):1740. doi:10.1038/s41467-017-01689-9
180. Shekhar K, Brodin P, Davis MM, Chakraborty AK. Automatic classification of cellular expression by nonlinear stochastic embedding (ACCENSE). Proc Natl Acad Sci U S A (2014) 111(1):202–7. doi:10.1073/pnas.1321405111
181. Diggins KE, Greenplate AR, Leelatian N, Wogsland CE, Irish JM. Characterizing cell subsets in heterogeneous tissues using marker enrichment modeling. Nat Methods (2017) 14(3):275–8. doi:10.1038/nmeth.4149
182. Gautreau G, Pejoski D, Le Grand R, Cosma A, Beignon A-S, Tchitchek N. SPADEVizR: an R package for visualization, analysis and integration of SPADE results. Bioinformatics (2017) 33(5):779–81. doi:10.1093/bioinformatics/btw708
183. Mosmann TR, Naim I, Rebhahn J, Datta S, Cavenaugh JS, Weaver JM, et al. SWIFT-scalable clustering for automated identification of rare cell populations in large, high-dimensional flow cytometry datasets, part 2: biological evaluation. Cytometry A (2014) 85(5):422–33. doi:10.1002/cyto.a.22445
184. Sorensen T, Baumgart S, Durek P, Grutzkau A, Haupl T. immunoClust-an automated analysis pipeline for the identification of immunophenotypic signatures in high-dimensional cytometric datasets. Cytometry A (2015) 87(7):603–15. doi:10.1002/cyto.a.22626
185. Lun ATL, Richard AC, Marioni JC. Testing for differential abundance in mass cytometry data. Nat Methods (2017) 14(7):707–9. doi:10.1038/nmeth.4295
186. Good Z, Sarno J, Jager A, Samusik N, Aghaeepour N, Simonds EF, et al. Single-cell developmental classification of B cell precursor acute lymphoblastic leukemia at diagnosis reveals predictors of relapse. Nat Med (2018) 24(4):474–83. doi:10.1038/nm.4505
187. Giesen C, Wang HA, Schapiro D, Zivanovic N, Jacobs A, Hattendorf B, et al. Highly multiplexed imaging of tumor tissues with subcellular resolution by mass cytometry. Nat Methods (2014) 11(4):417–22. doi:10.1038/nmeth.2869
Keywords: mass cytometry, cytometry by time-of-flight, hematopoietic stem cell transplantation, immune reconstitution, CyTOF, HSCT
Citation: Stern L, McGuire H, Avdic S, Rizzetto S, Fazekas de St Groth B, Luciani F, Slobedman B and Blyth E (2018) Mass Cytometry for the Assessment of Immune Reconstitution After Hematopoietic Stem Cell Transplantation. Front. Immunol. 9:1672. doi: 10.3389/fimmu.2018.01672
Received: 01 April 2018; Accepted: 05 July 2018;
Published: 26 July 2018
Edited by:
Vladimir Brusic, The University of Nottingham Ningbo China, ChinaReviewed by:
Henrik Mei, Deutsches Rheuma-Forschungszentrum (DRFZ), GermanyPetter Brodin, Karolinska Institutet (KI), Sweden
Copyright: © 2018 Stern, McGuire, Avdic, Rizzetto, Fazekas de St Groth, Luciani, Slobedman and Blyth. This is an open-access article distributed under the terms of the Creative Commons Attribution License (CC BY). The use, distribution or reproduction in other forums is permitted, provided the original author(s) and the copyright owner(s) are credited and that the original publication in this journal is cited, in accordance with accepted academic practice. No use, distribution or reproduction is permitted which does not comply with these terms.
*Correspondence: Emily Blyth, ZW1pbHkuYmx5dGhAc3lkbmV5LmVkdS5hdQ==
†These authors have contributed equally to this work.