 Khalil Eslamloo
 Atefeh Ghorbani
 Xi Xue
 Sabrina M. Inkpen
 Mani Larijani
 Matthew L. Rise
- 1Department of Ocean Sciences, Memorial University of Newfoundland, St. John's, NL, Canada
- 2Division of Biomedical Sciences, Faculty of Medicine, Memorial University of Newfoundland, St. John's, NL, Canada
Viperin is a key antiviral effector in immune responses of vertebrates including the Atlantic cod (Gadus morhua). Using cloning, sequencing and gene expression analyses, we characterized the Atlantic cod viperin at the nucleotide and hypothetical amino acid levels, and its regulating factors were investigated. Atlantic cod viperin cDNA is 1,342 bp long, and its predicted protein contains 347 amino acids. Using in silico analyses, we showed that Atlantic cod viperin is composed of 5 exons, as in other vertebrate orthologs. In addition, the radical SAM domain and C-terminal sequences of the predicted Viperin protein are highly conserved among various species. As expected, Atlantic cod Viperin was most closely related to other teleost orthologs. Using computational modeling, we show that the Atlantic cod Viperin forms similar overall protein architecture compared to mammalian Viperins. qPCR revealed that viperin is a weakly expressed transcript during embryonic development of Atlantic cod. In adults, the highest constitutive expression of viperin transcript was found in blood compared with 18 other tissues. Using isolated macrophages and synthetic dsRNA (pIC) stimulation, we tested various immune inhibitors to determine the possible regulating pathways of Atlantic cod viperin. Atlantic cod viperin showed a comparable pIC induction to other well-known antiviral genes (e.g., interferon gamma and interferon-stimulated gene 15-1) in response to various immune inhibitors. The pIC induction of Atlantic cod viperin was significantly inhibited with 2-Aminopurine, Chloroquine, SB202190, and Ruxolitinib. Therefore, endosomal-TLR-mediated pIC recognition and signal transducers (i.e., PKR and p38 MAPK) downstream of the TLR-dependent pathway may activate the gene expression response of Atlantic cod viperin. Also, these results suggest that antiviral responses of Atlantic cod viperin may be transcriptionally regulated through the interferon-activated pathway.
Introduction
Interferon-stimulated genes (ISGs) play crucial roles as immune effectors and regulators in antiviral immune responses of fishes and other vertebrates (1, 2). As in mammals (3–5), the antiviral response of teleosts is triggered by recognizing viruses or “viral mimics” [e.g., synthetic double-stranded RNA (dsRNA): polyriboinosinic polyribocytidylic acid (pIC)] through intracellular Toll-like receptors (TLRs) or RIG-I-like receptors (RLRs), thereby activating transcription factors and enhancing the production of type I and II Interferons (IFNs) (6–9). Secreted IFNs initiate the Janus kinase-Signal transduction and activator of transcription (JAK-STAT) signaling pathway that enhances the transcription of ISGs (e.g., viperin and isg15) containing IFN gamma (IFNG)-activated sequences (GAS) and/or IFN-sensitive response elements (ISRE) in their promoters (2, 7, 10).
Virus inhibitory protein, endoplasmic reticulum (ER)-associated, IFN-inducible (Viperin), also known as Radical S-adenosyl methionine (SAM) domain-containing 2 (RSAD2) or Virus-induced gene 1 (VIG1), is an antiviral protein, highly inducible by pIC, lipopolysaccharide (LPS), viruses, and bacteria (11, 12). The expression of mammalian viperin is induced via IFN-dependent and independent pathways, both of which may be activated by detection of viruses or dsRNA through a member of the RLR family and activation of transcription factors (e.g., IFN regulatory factor 3, IRF3) (12–14). Mammalian Viperin localizes in the ER-derived lipid droplets and inhibits viral replication [e.g., hepatitis C virus (HCV) and influenza] (12–14). Viperin expression enhances the TLR-mediated production of type I IFN via forming a signaling complex consisting of Interleukin-1 receptor-associated kinase (IRAK1) and Tumor necrosis factor receptor-associated factor 6 (TRAF6) on lipid bodies and facilitating the nuclear translocation of IRF7 (15).
In addition to mammals, antiviral responsiveness of viperin was also observed in teleosts [reviewed by (16)] and an invertebrate species, i.e., Pacific oyster (Crassostrea gigas) (17, 18). Teleost viperin has been characterized and shown to be a pIC and LPS-induced gene in various species, i.e., tilapia (Oreochromis niloticus), annual fish (Nothobranchius guentheri), and red drum (Sciaenops ocellatus) (2, 16, 19–21). In addition, Atlantic salmon (Salmo salar) and crucian carp (Carassius auratus) viperin gene expression was induced in response to infectious salmon anemia virus (ISAV) (22) and grass carp reovirus (GCRV) (23), respectively, and Viperin exhibited antiviral activity against megalocytivirus in rock bream (Oplegnathus fasciatus) (24). As in mammals, viperin was shown to be an IFN-induced gene in zebrafish (Danio rerio) (25), and crucian carp viperin was suggested to be transcriptionally regulated via the RLR-activated IFN pathway (23). Although fish Viperins share some characteristics with their mammalian counterparts, the mechanisms involved in Viperin responses to immunogenic stimuli are not well-understood in fishes. Additionally, this gene/protein is not fully characterized in several teleost models.
In addition to its importance in Atlantic fisheries (26), Atlantic cod (Gadus morhua) exhibits a unique immune system among teleosts (27). Genomic studies have indicated that the Gadiformes lineage, including Atlantic cod, lack Major histocompatibility complex II (MHC II), CD4, Mx, and TLR5 genes, and show a unique expansion of genes including MHC I and TLR22 (28–30). Using transcriptome profiling of antiviral responses, several ISGs including viperin were previously identified in Atlantic cod. viperin displayed a strong induction in the brain of nodavirus carrier fish, the spleen and brain of pIC-injected fish, and macrophages stimulated with pIC, but not LPS (31–35). However, the full sequence, developmental and tissue expression profiles, and regulating factors of Atlantic cod viperin remained unknown. In this study, we aimed to fully characterize Atlantic cod viperin, at the nucleotide and hypothetical amino acid (AA) levels, and determine its tissue distribution, developmental expression, and signaling pathways underlying its gene expression regulation during antiviral response.
Materials and Methods
Gene Cloning, Sequencing, and Sequence Assembly
Gene-specific primers (GSPs) for rapid amplification of cDNA ends (RACE) were designed (see Table 1) using Primer3web v4.0.0 (http://primer3.ut.ee/) and the partial sequence of Atlantic cod viperin (obtained from NCBI GenBank). A pool of column-purified RNA samples from the spleens of 10 Atlantic cod injected with pIC and sampled at 24 h post-injection (HPI) (5 μg RNA per sample) was used as RNA template for the RACE cDNA synthesis [see Inkpen et al. (36) and Hori et al. (33) for experimental design].
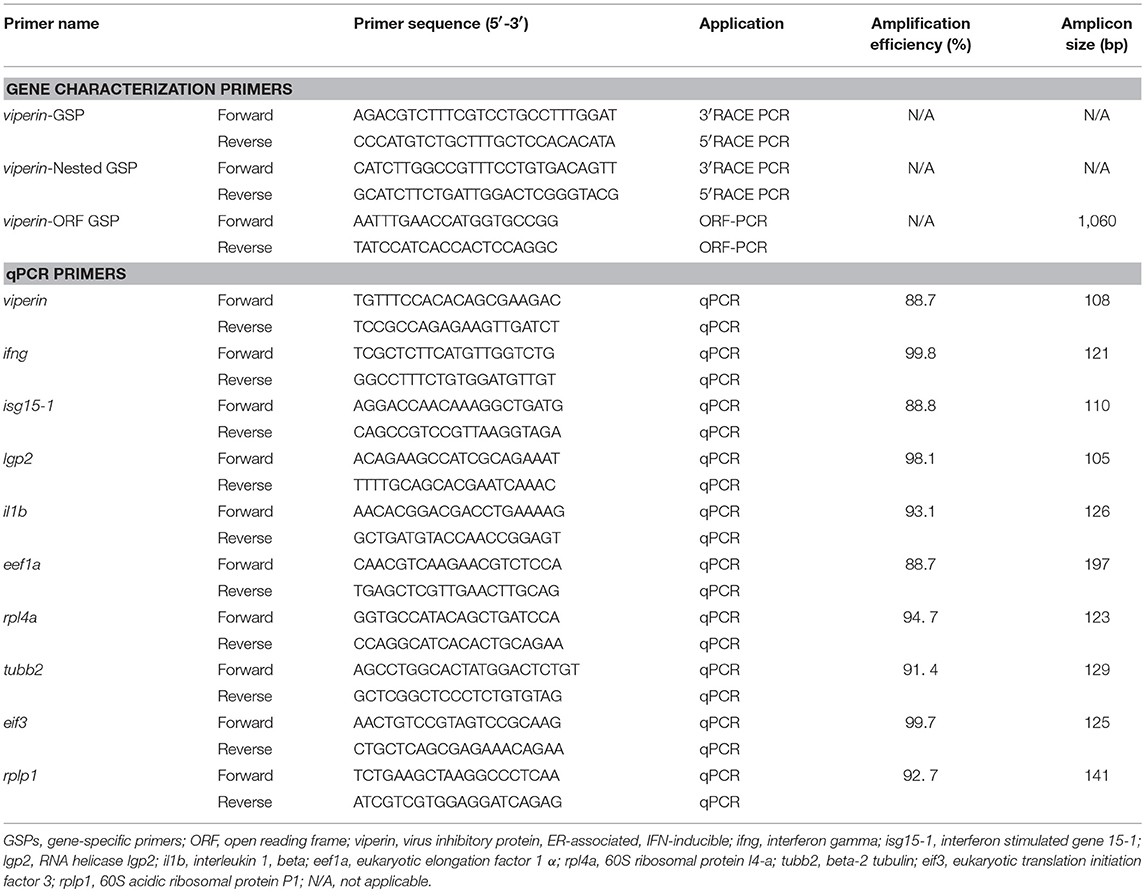
Table 1. Primers used for the gene characterization and expression studies.
All PCR reactions in the present study were conducted on a Bio-Rad Tetrad 2 Thermal Cycler (Bio-Rad, Hercules, CA). Full-length 5′ and 3′ RACE cDNAs were synthesized using 1 μg total RNA and the SMARTer RACE cDNA Amplification Kit according to the manufacturer's instructions (Clontech, Mountain View, CA). The resulting 5′ and 3′ RACE cDNAs (i.e., 10 μl reaction) were diluted by adding 100 μl of Tricine-EDTA buffer and used for RACE PCR. A touch-down PCR [cycling program: 1 min at 95°C; 5 cycles of (94°C for 30 s, 72°C for 3 min); 5 cycles of (94°C for 30 s, 70°C for 30 s, 72°C for 3 min); 25 cycles of (94°C for 30 s, 68°C for 30 s, 72°C for 3 min); and 1 final extension cycle of 72°C for 10 min] was conducted in 50 μl reactions using the Advantage 2 Polymerase, Advantage 2 PCR buffer, dNTP Mix (Clontech), and GSPs (i.e., viperin-GSP; Table 1) as well as Universal Primer Mix provided by the kit (Clontech), following the manufacturer's instructions. Thereafter, 5 μl of the amplified 5′ and 3′ RACE products were diluted 50 times using Tricine-EDTA buffer and used for nested PCR. The nested PCR was performed in 50 μl reactions, using Nested GSPs (i.e., viperin-Nested GSP; Table 1) and Nested Universal Primer provided by the kit (Clontech), following the manufacturer's instructions. The cycling parameters for nested RACE PCR consisted of 1 min at 95°C, followed by 20 cycles of (94°C for 30 s, 68°C for 30 s, 72°C for 3 min), and 1 final extension cycle at 72°C for 10 min.
PCR products were examined on 1.2% agarose gel, and then were extracted using the QIAquick Gel Extraction kit (Qiagen) according to the manufacturer's recommendations. TA cloning of gel-extracted PCR products was performed using pGEM-T-Easy vector (Promega, Madison, WI) at 4°C overnight, using the manufacturer's instructions. Recombinant plasmids were transformed into Subcloning Efficiency DH5α Competent Cells (i.e., chemically-competent cells) (Invitrogen, Burlington, Ontario) following the manufacturer's instructions. The transformed cells were incubated in 300 μl of SOC medium (Invitrogen) for 1 h at 37°C with shaking (~225 rpm), and then cultured on Luria broth (LB)/agar plates containing 100 μg m1−1 ampicillin and 40 μl plate−1 of 40 mg ml−1 X-gal (Sigma, St. Louis, MO) for 16 h at 37°C. Thereafter, colonies were taken using blue/white selection and cultured in LB supplemented with ampicillin (100 μg ml−1) at 37°C overnight. Plasmid DNA was extracted using QIAprep Spin Miniprep Kit (Qiagen), following the manufacturer's instructions. The insert sizes of recombinant plasmids were checked using EcoRI (Invitrogen) digestion and agarose gel (1%) electrophoresis. Four colonies from each 5′ and 3′ RACE products were used for sequencing performed at the Genomics and Proteomics (GaP) facility, Core Research Equipment and Instrument Training (CREAIT) network, Memorial University of Newfoundland. Sequencing was conducted using an ABI 3730 DNA Analyzer with BigDye Terminator v3.1 Cycle Sequencing Kit (Applied Biosystems, Foster City, CA).
Lasergene 7.20 software (DNASTAR, Madison, WI) was used to acquire overlapping sequence from 5′ and 3′ RACE products and assemble the full-length viperin cDNA. GSPs amplifying the open reading frame (ORF) were designed (see Table 1) to verify the sequence assembly of full-length viperin. The ORF PCR was performed using the TopTaq polymerase kit (Qiagen, Mississauga, Ontario) and cDNA of pIC-stimulated Atlantic cod macrophages (i.e., pIC sub-group of no-inhibitor treatment in the macrophage stimulation experiment; see section Macrophage Isolation and Stimulation) in a 50 μl reaction. The PCR reaction was composed of 2 μl of cDNA (representing ~10 ng of input RNA; see section qPCR Assays for the cDNA synthesis method), 0.5 μM each of forward and reverse GSP, 5 μl of 10X TopTaq PCR buffer, 1.25 U of TopTaq DNA Polymerase, and 200 μM of each dNTP, with the following PCR program: initial denaturation of 3 min at 94°C, followed by 30 cycles of (94°C for 30 s, 60°C for 30 s, 72°C for 2 min), and 1 final extension cycle at 72°C for 10 min. The size of the resulting PCR product was determined by gel electrophoresis (1.2% agarose) alongside a 1 kb Plus Ladder (Invitrogen).
Sequence Characterization and in silico Analyses
The AA sequence of Atlantic cod Viperin was predicted based upon assembled cDNA sequence using the SeqBuilder software of the Lasergene package (DNASTAR). To map the gene structure and determine intronic regions and genomic location, the cDNA sequence of viperin was aligned with genomic DNA sequence of Atlantic cod obtained from the Ensembl (http://www.ensembl.org) and Centre for Ecological and Evolutionary Synthesis (CEES: http://cees-genomes.hpc.uio.no) Genome Browsers. The AA sequences of Viperin of other fish species, as well as other vertebrate and invertebrate species (see Supplemental Table S1), were collected from the NCBI GenBank non-redundant (nr) AA database, and used for multiple sequence alignment (MSA) and phylogenetic tree construction. MSA analysis of predicted AA sequences of Atlantic cod Viperin with orthologous sequences in other species was implemented in MEGA6 software using the MUSCLE feature (37, 38). The Radical SAM domain of Atlantic cod Viperin was predicted using the PFAM database (http://pfam.xfam.org/) (39). The deduced AA sequences of Viperin homologs were aligned and used to generate a phylogenetic tree using the Neighbor-joining method in MEGA6 software (bootstrapped 10,000 times).
The neighboring genes of Atlantic cod viperin and its conserved synteny with other species were mapped using the Genomicus database (http://www.genomicus.biologie.ens.fr), powered by the Ensembl database. The neighboring genes and genomic location of Atlantic cod viperin were also confirmed using CEES Genome Browser (http://cees-genomes.hpc.uio.no).
To gain insight into transcriptional regulation of Atlantic cod viperin, putative transcription factor binding sites (TFBSs) were predicted in the proximal promoter region of this gene. The 1,000 bp 5′-upstream of the transcription start site of Atlantic cod viperin were taken from genomic DNA sequence, available at CEES Genome Browser (http://cees-genomes.hpc.uio.no/). Putative TFBSs were identified using the vertebrates' profile of the TRANSFAC database (http://genexplain.com/transfac/). This prediction was performed using the default parameters (i.e., Minimize False Positives) suggested by the TRANSFAC database, and the predicted TFBSs (core score > 0.8) with putative functions in immune responses were selected and presented herein.
Prediction of Viperin Protein Structure
The recently-described partial mouse (Mus musculus) Viperin crystal structures were used as templates for homology modeling (40–43). The templates were retrieved from the Research Collaboratory for Structural Bioinformatics—Protein Data Bank (RCSB-PDB) (https://www.rcsb.org/; PDB ID: 5VSL and 5VSM). PyMOL v1.7.6 (http://www.pymol.org/) was used to visualize templates and models. Atlantic cod Viperin was computationally modeled using default parameters of I-TASSER (http://zhanglab.ccmb.med.umich.edu/I-TASSER/) (41–43). Twenty models were generated of which four models with the highest C-score (>–1.8) were further analyzed. C-score (range −5 to 2), which indicates the confidence of the quality of the predicted model, was estimated by I-TASSER. The majority of the Atlantic cod Viperin was homology-modeled based on the mouse partial Viperin crystal structure with the exception of the first 56 N-terminal AAs and the last 23 C-terminal AAs which were missing from crystal structure and, therefore, were modeled ab initio by I-TASSER. The same approach was used to model the full-length mouse Viperin as well as zebrafish, Atlantic salmon, and human (Homo sapiens) Viperins. Both [4Fe-4S] cluster and Radical SAM analog (S-adenosylhomocysteine; SAH) were manually placed in the catalytic pocket of the Atlantic cod Viperin. The surface charge and the isoelectric point of Atlantic cod and full-length mouse Viperin were estimated using the PDB2PQR server (http://nbcr-222.ucsd.edu/pdb2pqr_2.0.0/). Prediction of natively disordered regions of Viperin was conducted using the default parameters of the Protein disorder prediction server (PrDOS) website (http://prdos.hgc.jp/cgi-bin/top.cgi).
Animals
The Atlantic cod used in this experiment were kept in two 21 m3 flow-through tanks (one tank for broodstock fish and one tank for fish used for tissue sampling and macrophage isolation) with optimal conditions (5.2–6.4°C, 95–110% oxygen saturation and under an ambient photoperiod) in the Dr. Joe Brown Aquatic Research Building (JBARB) of the Ocean Sciences Centre (OSC). The fish [2.29 ± 0.42 kg (mean ± SE)] used for tissue sampling and macrophage isolation were fed 3 days weekly (i.e., 1% body weight per feeding time) with a commercial diet (Skretting, BC, Canada; crude protein 50%, crude fat 18% and crude fiber 1.5%). The broodstock fish were fed mackerel, herring and squid supplemented with vitamins 2 days per week before and during spawning season. Fish (i.e., for tissue sampling and macrophage isolation experiments) were fasted 24 h and euthanized with an overdose of MS222 (400 mg L−1; Syndel Laboratories, Vancouver, BC) prior to the sampling. All procedures applied in the current investigation were approved by the Memorial University of Newfoundland's Institutional Animal Care Committee, according to the guidelines of the Canadian Council on Animal Care.
Tissue Sampling
To evaluate the constitutive transcript expression of viperin in various tissues of adult Atlantic cod, four individuals (i.e., 2 male and 2 female) were used. Following euthanasia and dissection, samples were collected from 19 different tissues (i.e., blood, eye, brain, gill, heart, head kidney, posterior kidney, spleen, liver, gonad, stomach, pyloric caecum, midgut, hindgut, dorsal skin, ventral skin, dorsal muscle, ventral muscle, and fin) of each individual; the samples were immediately flash-frozen using liquid nitrogen and kept at −80°C until RNA extraction.
Sampling for Developmental Series
The floating fertilized eggs were automatically collected after overnight communal spawning. Then, 1.4 L of fertilized eggs (i.e., 2-cell to ~64-cell embryos) [henceforth referred to as the zero days post-fertilization (DPF), or Day 0] were distributed into three 50 L conical incubator tanks (350 ml of eggs per tank) with 25 L h−1 flow rate and gentle aeration. The fertilized eggs were incubated and kept in these tanks until yolk-sac absorption stage (i.e., 20 DPF; before active feeding) at 5.5–6.1°C and under an ambient photoperiod. The developmental stage of embryos was determined daily (44). The embryos were in blastula/gastrula stages from 1 to 6 DPF (34.4 degree-days). The segmentation period began at 7 DPF (40.2 degree-days), and the golden eye stage was observed at 12 DPF (68.5 degree-days). Hatching started at 15 DPF (86.2 degree-days), and 100% of the embryos were hatched by 18 DPF (103.9 degree-days). To study viperin expression during early developmental stages, embryos (~0.5 ml) or larvae (~0.4 ml) were sampled daily (i.e., 0–20 DPF) from each incubator tank (i.e., one pooled sample from each replicate tank per day; n = 3), using 500 μm Nitex. The collected (~180 embryos or larvae per sample) samples from each tank were then flash-frozen using liquid nitrogen and kept at −80°C until RNA extraction.
Macrophage Isolation and Stimulation
Atlantic cod macrophages were isolated from the head kidneys of 5 individuals as described in Eslamloo et al. (34, 45). All reagents (e.g., culture medium) and equipment used in this experiment were identical to Eslamloo et al. (34). Briefly, following fish dissection, the macrophage-like cells isolated from each fish were seeded into 6-well plates (Corning, Corning, NY) at an equal density of 3 × 10⁷ cells (in 2 ml L-15+) per well (16 wells per fish). The cells were cultured in Leibovitz's L-15+ [i.e., L-15 (Gibco, Carlsbad, CA) culture medium supplemented with 2 mM L-glutamine, 4.2 mM NaHCO3, 25 mM HEPES, 1.8 mM glucose, 100 U ml−1 penicillin, 100 μg ml−1 streptomycin (Gibco) and 1% fetal bovine serum (FBS; Gibco)] overnight at 10°C. The non-adherent cells were then removed by washing the culture dishes 3 times with L-15+.
The immune inhibitors used in this study were purchased from InvivoGen (San Diego, CA), and the stock solutions were prepared using the manufacturer's instructions. The effective doses of different immune inhibitors used in this experiment were obtained from previously published in vitro-based studies in fish (46–49), except for Ruxolitinib (RUX) for which dose was based on an in vitro study on mammalian cells (50). 2-Aminopurine (2-AP), dissolved in phosphate-buffered saline (PBS): glacial acetic acid (AcOH) (200:1) was used at 5 mM as an inhibitor of double-stranded RNA-activated protein kinase (PKR) (48). Chloroquine (CHQ), dissolved in water, was used at 80 μM as an inhibitor of endosomal TLR (49). In addition, Dimethyl sulfoxide (DMSO)-dissolved Resveratrol (RESV) and SB202190 (S90) were utilized at 50 μM for inhibiting Nuclear factor kappa-B (NFKB) and p38 Mitogen-activated protein kinase (p38 MAPK) pathways, respectively (46, 47). To inhibit JAK1/JAK2, DMSO-dissolved RUX was used at 5 μM (50). The pIC (Sigma-Aldrich) was dissolved in PBS at 10 mg ml−1 and used as a stock solution in the present experiment. Starting 24 h after seeding, Atlantic cod macrophages isolated from each fish were exposed to 5 inhibitors (i.e., 2 wells per inhibitor for each fish). Moreover, macrophages from each individual were subjected to PBS, DMSO (0.57 μl ml−1 of L-15+), or AcOH (0.17 μl ml−1 of L-15+) as control conditions (i.e., a total of 8 experimental groups; 2 wells per condition for each fish). The cells were incubated with inhibitors for 1 h. Afterward, macrophages from each fish under different inhibitor treatments or controls (2 wells per group) were exposed to either 50 μg ml−1 pIC (34) or PBS (5 μl of pIC solution or PBS ml−1 of L-15+). The culture medium of all groups in this study contained an identical level of PBS (i.e., 38.8 μl ml−1 of L-15+). The macrophages from each individual were incorporated into all experimental groups (i.e., 16 conditions in total; 5 biological replicates per group). Our previous study determined the time-dependent pIC responses of Atlantic cod macrophages (34), and based on these results the 24 h post-stimulation time point was selected for assessment of gene expression responses of macrophages in the current study. The samples were collected 24 h after pIC stimulation by removing the media and adding 800 μl TRIzol (Invitrogen, Burlington, ON) into each culture well plate. TRIzol-lysed samples were kept at −80°C until RNA extraction.
RNA Extraction and Purification
Total RNA was extracted using TRIzol (Invitrogen) following the manufacturer's instructions. RNase-free (i.e., baked at 220°C for 7 h) ceramic mortars and pestles were used to homogenize the firm tissues (i.e., eye, gill, heart, stomach, pyloric caecum, midgut, hindgut, dorsal skin, ventral skin, dorsal muscle, ventral muscle, and fin), whereas other tissue and developmental samples were TRIzol-lysed using RNase-Free Disposable Pellet Pestles (Fisherbrand). Then, the homogenates of tissue and developmental samples were passed through QIAshredder (Qiagen) spin columns and used for RNA extraction following the manufacturer's instructions. The TRIzol-lysed macrophage samples were also processed for RNA extraction according to the manufacturer's recommendations.
Prior to purification, RNA samples (≤50 μg) in all experiments were treated with 6.8 Kunitz units of DNaseI (Qiagen) with the manufacturer's buffer (1X final concentration) for 10 min at room temperature to remove residual genomic DNA. RNA purification of adult tissue and developmental series samples (see sections Tissue Sampling and Sampling for Developmental Series) was performed using the RNeasy Mini Kit (Qiagen), whereas macrophage samples were purified using the RNeasy MinElute Cleanup Kit (Qiagen) according to the manufacturer's instructions. RNA concentration and quality were assessed using NanoDrop spectrophotometry (ND-1000), and RNA integrity was assessed by agarose gel electrophoresis (1% agarose). All column-purified RNA samples subjected to gene expression analyses in this study showed acceptable purity (i.e., A260/230 and A260/280 ratios>1.8) and integrity (i.e., tight 18S and 28S ribosomal RNA bands).
qPCR Assays
cDNA synthesis was performed using RNA of each sample (i.e., 1 μg total RNA for macrophage samples or 5 μg total RNA for adult tissue and developmental samples), random primers (250 ng; Invitrogen), 1 μl of dNTPs (10 mM each; Invitrogen) and M-MLV reverse transcriptase (200U; Invitrogen) in the manufacturer's first-strand buffer (1X final concentration) and DTT (10 mM final concentration) at 37°C for 50 min following the manufacturer's instructions.
The qPCR assays in the current study were designed and performed on the basis of the Minimum Information for Publication of qPCR Experiments (MIQE) guidelines (51). The qPCR analyses (including an inter-plate linker and no-template controls) were conducted using a ViiA7 Real-Time PCR system (Applied Biosystems, Burlington, Ontario) in the 384-well format and a qPCR program consisting of one cycle of 50°C for 2 min, one cycle of 95°C for 10 min, and 40 cycles of (95°C for 15 s and 60°C for 1 min), followed by a dissociation curve analysis (1 cycle at 60–95°C in increments of 0.05°C per second). Fluorescence data detection occurred at the end of each cycle. qPCR assays (13 μl) were comprised of 6.5 μl Power SYBR Green Master Mix (Applied Biosystems), 50 nM of each forward and reverse primer (0.52 μl of forward and 0.52 μl of reverse primers per reaction), 1.46 μl nuclease-free water (Gibco) and 4 μl cDNA (corresponding to 4 ng of input total RNA for macrophage samples or 10 ng of input total RNA for adult tissue and developmental samples).
The primer sequences in this study were obtained from our previous study (34) (see Table 1). Prior to the qPCR assays, the primer quality tests were conducted in triplicate using a 5-point, 3-fold serial dilution of the given cDNA template [starting with cDNA representing 10 ng (macrophage experiment) or 20 ng (adult tissue and developmental experiments) of input total RNA] as well as a no-template control. The cDNA template used for primer quality tests in the macrophage experiment was a pool of 3 individual pIC-stimulated samples, whereas the template used for primer quality tests in the adult tissue and developmental studies was a pool of different adult tissues and developmental samples. Each primer pair selected for qPCR assays showed an absence of amplification in the no-template controls, an amplicon with a single melting peak (i.e., no evidence of primer dimers or non-specific products in the dissociation curve), and amplification efficiency (52) ranging from 88 to 100% (Table 1).
To identify suitable normalizer genes for qPCR assays, the expression of candidate normalizers in adult tissue [i.e., cyclophilin a (cypa), 60S acidic ribosomal protein P1(rplp1), 60S ribosomal protein l4-a (rpl4a), beta-2 tubulin (tubb2), heat shock cognate 70 kDa (hsc70), eukaryotic translation initiation factor 3 (eif3), and eukaryotic elongation factor 1 α (eef1a)], embryonic and early larval stages (cypa, eif3, eef1a, tubb2, and beta-actin) and macrophage stimulation [protein phosphatase 1, catalytic subunit, gamma isozyme (ppp1cc), cypa, rplp1, rpl4a, tubb2, eif3, and eef1a] experiments was assessed in duplicate using 50% of the samples from each experiment. The expression results were subjected to geNorm analysis using qBase software as in Eslamloo et al. (34). The normalizers expressed comparably (i.e., with lowest M-value, a measure of transcript expression stability) in samples were selected for qPCR assays of adult tissue (eef1a, rpl4a, and rplp1), embryonic and early larval development (eif3 and tubb2), and macrophage stimulation (rplp1 and eef1a) experiments. In addition to viperin, the expression levels of Atlantic cod ifng, interferon stimulated gene 15-1 (isg15-1), RNA helicase lgp2 (lgp2; alias dhx58) and interleukin 1 beta (il1b) were measured in macrophage samples. Since ifng, isg15-1 and lgp2 play important roles in antiviral responses (2, 16), and they showed a strong pIC induction in Atlantic cod macrophages (34), we included them in qPCR assays as positive biomarkers of antiviral responses. On the other hand, since il1b is an antibacterial and pro-inflammatory biomarker in fish macrophages (53), this gene was added to qPCR assays in the macrophage experiment as a negative biomarker for the inhibition of targeted pathways.
The qPCR assays for samples of each experiment were performed in triplicate using 4 ng (macrophage samples) or 10 ng (adult tissue and embryonic and early larval development samples) of input total RNA per reaction. The performance of assays between qPCR plates used in a given experiment was tested using an inter-plate linker sample [CT (threshold cycle) value variations < 0.5] as well as no-template controls. ViiA7 software v1.2.2 (Applied Biosystems) was applied to calculate the relative quantity (RQ) values, relative to a calibrator sample (i.e., sample with the lowest normalized expression within each experiment) for the gene of interest, using the CT values (i.e., gene of interest and normalizers) and the amplification efficiency of each primer pair (see Table 1).
The qPCR results (RQ values) of tissue and macrophage experiments were statistically analyzed using the Prism package v6.0 (GraphPad Software Inc., La Jolla, CA). The Kolmogorov-Smirnov test was performed to check the normality of the data. The transcript expression data in the macrophage experiment were analyzed using a repeated measures two-way ANOVA test designed for randomized-block experiments, whereas the transcript tissue expression data were analyzed by a one-way ANOVA test. These analyses were followed by Sidak multiple comparisons post hoc tests to determine the significant differences (p ≤ 0.05) between adult tissues as well as between and within the groups in the macrophage experiment. The qPCR results from the developmental study were not subjected to statistical analyses.
Results
Characterization of Atlantic Cod Viperin Sequence
Assembly of RACE sequencing reads for viperin, validated by ORF PCR, generated a 1342 bp cDNA sequence (excluding poly-A tail) (GenBank accession: MH279971; Figure 1). As predicted using SeqBuilder, the Atlantic cod viperin cDNA consisted of a 55 bp 5′-UTR, 1044 bp (347 AA) ORF and a 243 bp 3′-UTR. Also, three polyadenylation signal (AAUAAA) sequences were found in the 3′-UTR (Figure 1). As determined by CEES and Ensembl databases, Atlantic cod viperin contained 6 exons (i.e., 1: 359 bp, 2: 162 bp, 3: 230 bp, 4: 150 bp, 5: 33 bp, and 6: 408 bp). This gene is located on Linkage Group (LG) 5 of the Atlantic cod genome (CEES, LG05:12624935-12621299). Atlantic cod viperin is located downstream of cytidine monophosphate (UMP CMP) kinase 2 (cmpk2) and upstream of ring finger protein 144 (rnf144) and shows synteny similarity to zebrafish and human. Figure 2 illustrates the genomic organization of the Atlantic cod viperin gene and its syntenic comparison with the viperin loci of zebrafish and human.
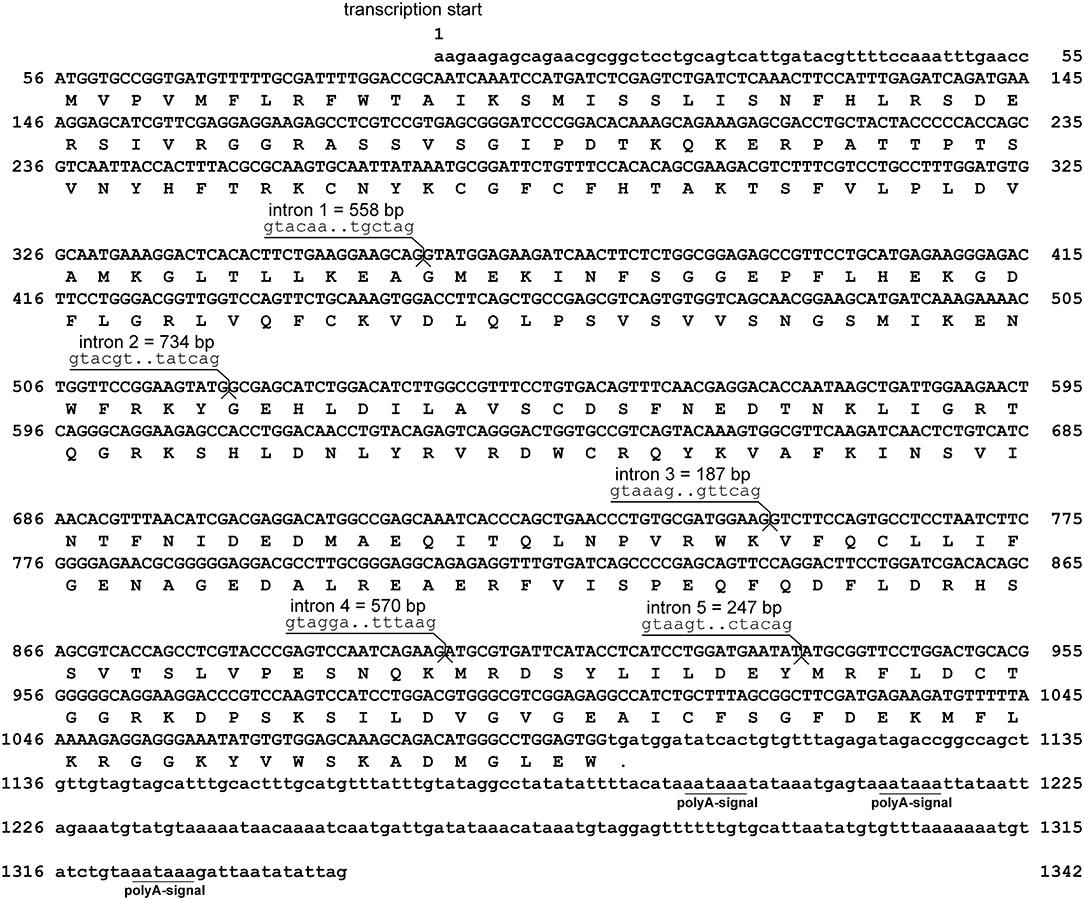
Figure 1. Sequence and the predicted structure of Atlantic cod viperin. Nucleic acid sequence (excluding poly-A tail) of viperin (GenBank accession: MH279971) and inferred amino acid translation. The nucleotide sequences are numbered on both sides and the inferred amino acids are shown below the coding sequence. The period shows the predicted stop codon. The lower-case letters indicate the non-coding nucleotide sequence, whereas the protein coding sequence of viperin is shown in upper-case letters. The intronic sequences were determined using the Ensembl (http://www.ensembl.org) and Centre for Ecological and Evolutionary Synthesis (CEES: http://cees-genomes.hpc.uio.no) Genome Browsers. Three polyadenylation signals (polyA-signal: AAUAAA) were found in the 3′UTR.
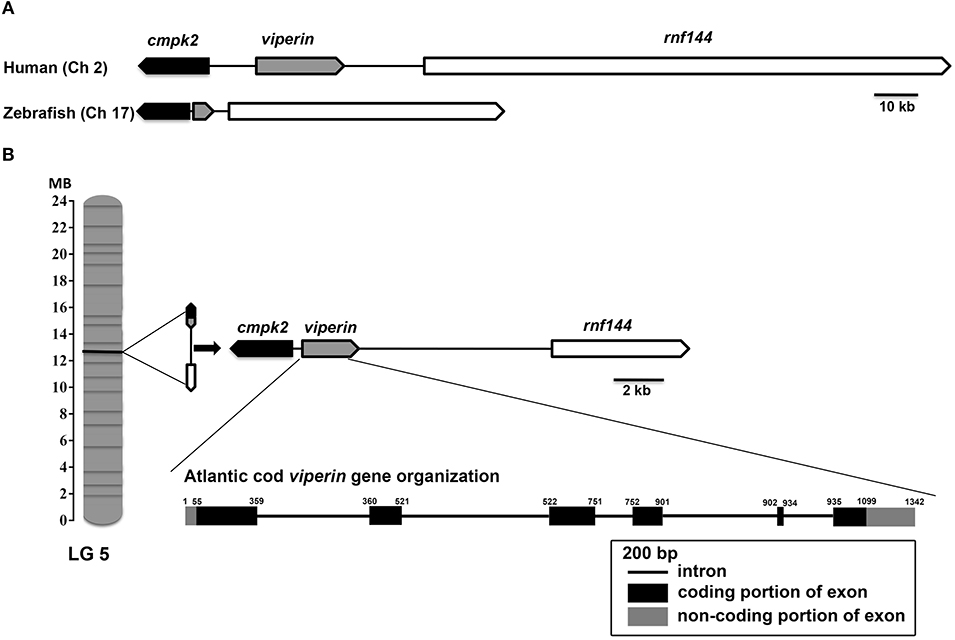
Figure 2. Genome organization and syntenic correspondence of Atlantic cod viperin. (A) Syntenic relationship between zebrafish and human viperin. (B) Location of viperin and its neighboring genes in the Atlantic cod genome, and the gene organization of Atlantic cod introns and exons. Black and gray boxes show coding (56–1099) and non-coding [5′UTR: 1-55 and 3′UTR: 1100–1342 (excluding poly-A tail)] portions of exons, respectively, and the lines connecting the exons represent introns. The synteny was determined using the Genomicus database (http://www.genomicus.biologie.ens.fr); viperin was found to be flanked by cmpk2 and rnf144 in the genomes of Atlantic cod, zebrafish and human. Arrows indicate the transcription direction of genes. Linkage Group (LG).
The multiple alignment of putative AA sequences of Atlantic cod Viperin and orthologous sequences from other eukaryotic species is shown in Figure 3. This comparison revealed considerable identity (i.e., 61–82%), notably in the radical SAM domain, between Viperin of Atlantic cod and representatives of different invertebrate phyla [Ciliophora: (i.e., Tetrahymena thermophila) and Mollusca: (i.e., C. gigas)] or vertebrate classes (e.g., Actinopteri, Amphibia, Reptilia, and Mammalia). Also, the radical SAM domain of Atlantic cod Viperin contained a conserved SAM binding motif (CXXXCXXC) (see Figure 3). However, no discernible conservation in AA sequence was noted in the N-terminus of Viperin putative orthologs. The lowest percentage of similarity (i.e., 61%) was found between Viperin of Atlantic cod and the ciliated protozoan, T. thermophila (see Supplemental Table S1), whereas Atlantic cod Viperin showed the highest percentage of similarity to its putative orthologs in teleosts, i.e., rainbow trout (Oncorhynchus mykiss) (82%) and Orange-spotted grouper (Epinephelus coioides) (79%). The phylogenetic tree of Viperin was constructed using a MSA of putative orthologous sequences from various species (i.e., ciliated protozoan, amphioxus, mollusc, fishes, amphibian, reptiles, bird, and mammals) (Figure 4). As expected, putative orthologous sequences were grouped and sub-grouped based upon the associated phyla and classes. For example, some fish species within a given order [e.g., Salmoniformes (O. mykiss and S. salar) and Cypriniformes (Cyprinus carpio, C. auratus, and D. rerio)] were clustered together (Figure 4). Moreover, species (O. mykiss, S. salar, and Esox lucius) within the Protacanthopterygii superorder were clustered together. The Viperin of the ciliated protozoan, T. thermophila, formed a separate branch from the other species in the phylogenetic tree. Interestingly, Viperin of amphioxus (Branchiostoma japonicum) and Pacific oyster (C. gigas) were clustered together and separated from other species.
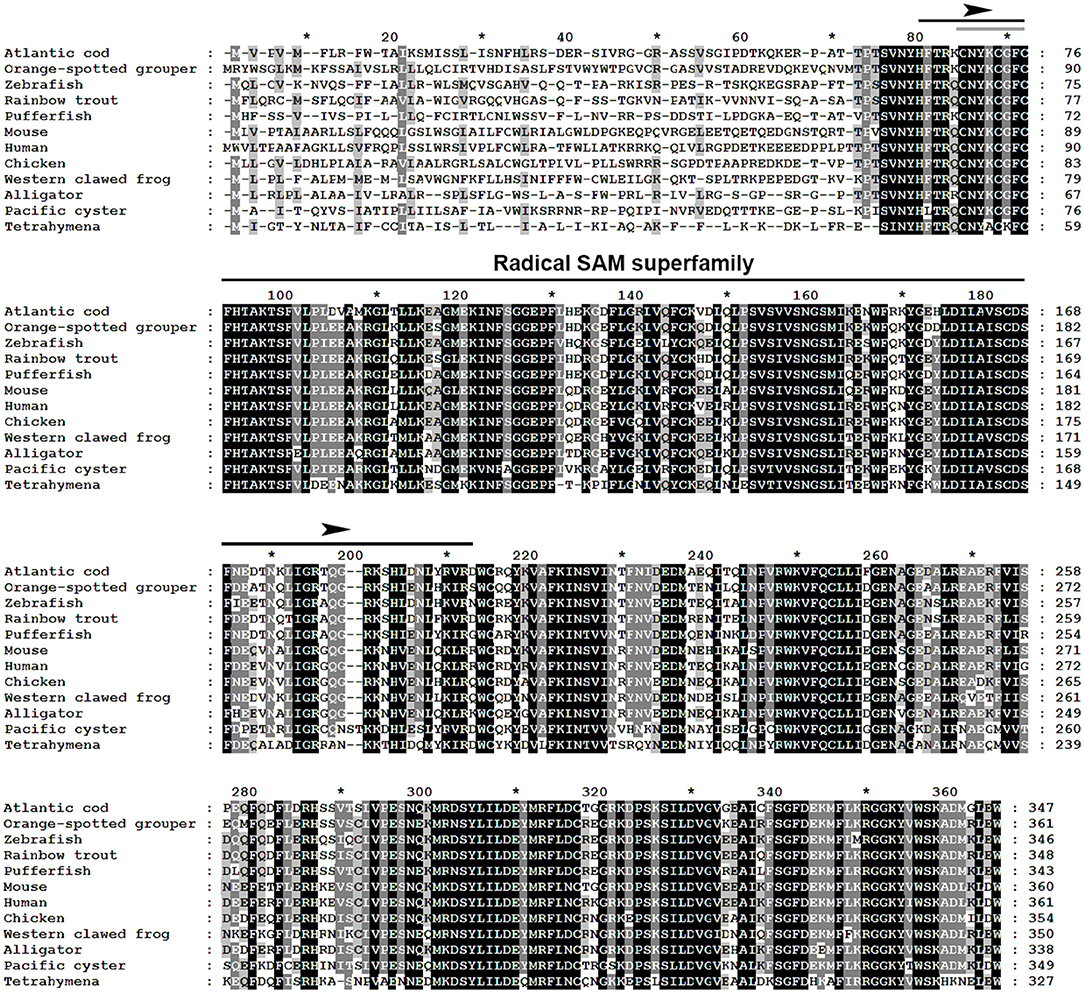
Figure 3. Multiple alignment of Atlantic cod Viperin deduced protein sequence with putative orthologous sequences obtained from the NCBI protein database. As identified by GeneDoc, black shading with white font shows the 100% conserved residues among the putative orthologous sequences. Dark gray shading with white font and light gray with black font denote 80 and 60% conservation among the residues, respectively. The numbers show the relative positions of the amino acid residues of Viperin putative orthologs. The Radical SAM domain of Viperin was predicted using the PFAM database (http://pfam.xfam.org/), and it includes a conserved SAM binding motif (CXXXCXXC) (i.e., marked with a gray line within the Radical SAM domain). Atlantic cod (Gadus morhua), Orange-spotted grouper (Epinephelus coioides), zebrafish (Danio rerio), Rainbow trout (Oncorhynchus mykiss), Pufferfish (Takifugu rubripes), Mouse (Mus musculus), Human (Homo sapiens), Chicken (Gallus gallus), Western clawed frog (Xenopus tropicalis), Alligator (Alligator mississippiensis), Pacific oyster (Crassostrea gigas), Tetrahymena (Tetrahymena thermophila). See Supplemental Table S1 for GenBank accession numbers and the percentage of sequence similarity to Atlantic cod Viperin.
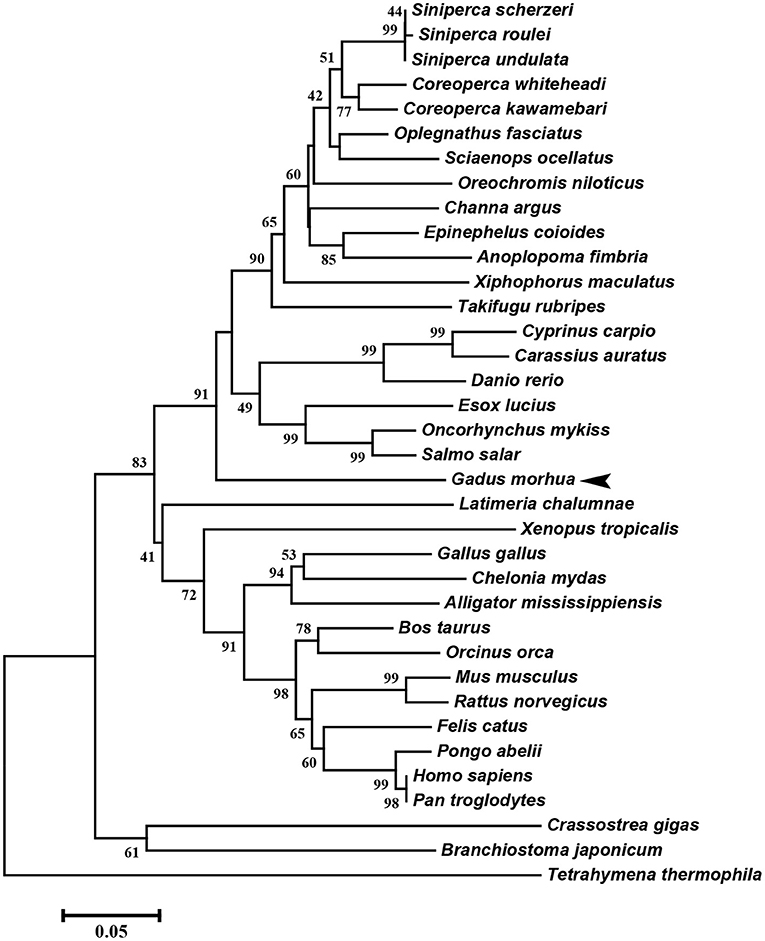
Figure 4. Molecular phylogenetic analysis of Viperin in various species. Putative Viperin amino acid sequence of Atlantic cod and the Viperin sequences from other species obtained from NCBI protein database were used to infer the evolutionary relationship among Viperin orthologs (see Supplemental Table S1 for GenBank accession numbers and the percentage of sequence similarity to Atlantic cod Viperin). The phylogenetic tree was generated by Neighbor-joining method and bootstrapped 10,000 times using MEGA6 software. The numbers at the branch points represent the bootstrap values. Branch lengths are proportional to calculated evolutionary distances. The scale represents number of substitutions per site. Arrowhead shows the Atlantic cod Viperin sequence.
In silico analysis of the 5′-upstream region was used to predict the immune-related putative TFBSs that may play roles in regulating the expression of Atlantic cod viperin. As shown in Figure 5, this analysis predicted IRF3/9, STAT and Activating transcription factor (ATF) motifs located in the proximal promoter of Atlantic cod viperin. Moreover, GAS and ISRE, which are the binding motifs for IFNG activation factor (GAF; STAT1 homodimer) and IFN-stimulated gene factor 3 (ISGF3), respectively, were identified in the proximal promoter region of Atlantic cod viperin.
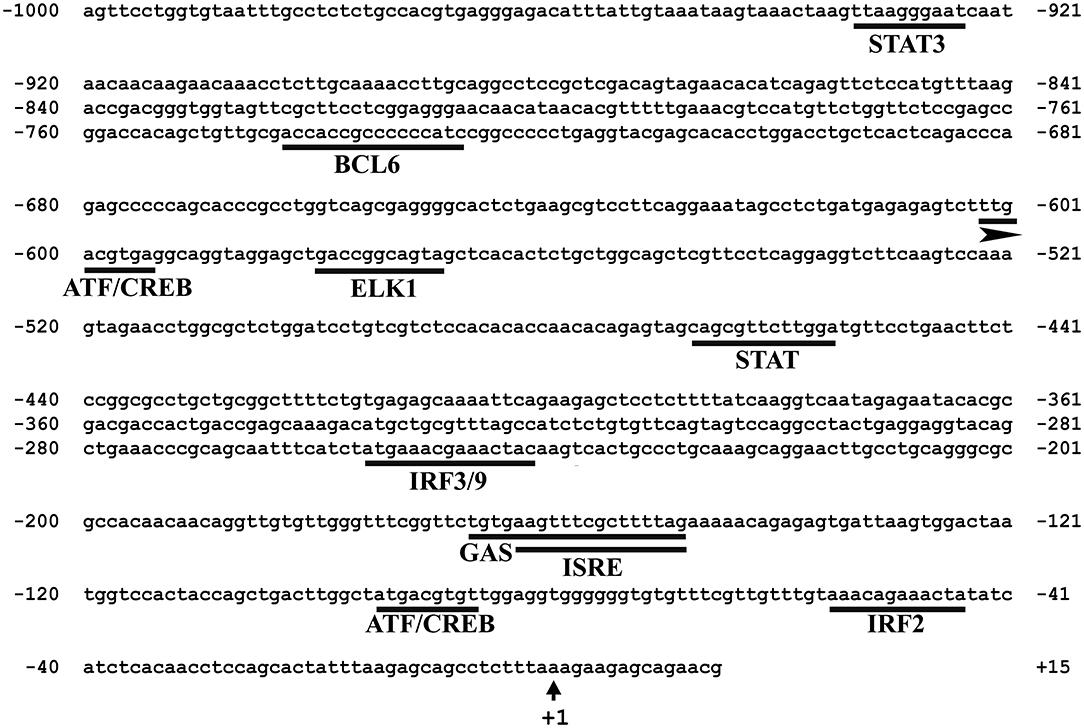
Figure 5. Putative immune-related transcription factor binding sites (TFBSs) predicted in the 5′-upstream region of Atlantic cod viperin. The proximal promoter region sequence (i.e., 1,000 bp 5′ of the transcription start site) of Atlantic cod viperin was taken from Centre for Ecological and Evolutionary Synthesis (CEES: http://cees-genomes.hpc.uio.no) Genome Browser, and TFBSs were predicted using the TRANSFAC database (http://genexplain.com/transfac/). STAT (Signal Transducer and Activator of Transcription), BCL6 (B-cell lymphoma 6), ATF (Activating Transcription Factor), CREB (cAMP Response Element-Binding protein), ELK1 (ELK1, ETS transcription factor), IRF (Interferon Regulatory Factor), GAS (IFNG-Activated Sequence), ISRE (IFN-Sensitive Response Element). +1 indicates the transcription start site of Atlantic cod viperin.
Structure Prediction of Viperin Protein
The recently-described partial mouse Viperin crystal structures (PDB: 5VSL, 5VSM) were used as templates for homology modeling prediction of full-length Atlantic cod and mouse Viperins (Figure 6). Comparison of the predicted structure of Atlantic cod Viperin to the partial crystal structure of mouse Viperin revealed a nearly identical overall architecture, namely a partial (βα)6-barrel folding (Figure 6A). The CXXXCXXC or the radical SAM binding motif within which the cysteine residues ligate three iron atoms of the [4Fe-4S] cluster, and the GEE motif as well as a serine and an arginine which were shown to form hydrogen bonds with SAH, are also found to be conserved in Atlantic cod Viperin (G125G126E127 and S180 and R194 in mouse Viperin; G110G111E112 and S165 and R179 in Atlantic cod Viperin; Figure 6B) (40). Further, the aromatic residues adjacent to the third cysteine in the CXXXCXXC motif were also conserved in the Atlantic cod Viperin (F90 and F92 in mouse Viperin; F75 and F77 in Atlantic cod Viperin; Figure 3). To generate a soluble derivative of mouse Viperin for crystallization, the N-terminus region containing a suggested α-helix (residues 1 to 71) was truncated (40). Our computational modeling also suggested the conservation of this N-terminus α-helix in the Viperin of Atlantic cod, zebrafish, Atlantic salmon and human (Supplementary Figure S1). As is the case for the mouse protein (40), the Viperins of the Atlantic cod as well as the aforementioned other species were also predicted to have an intrinsically disordered N-terminal region (Supplementary Figure S2), thus allowing for a lower degree of confidence for prediction of this region.
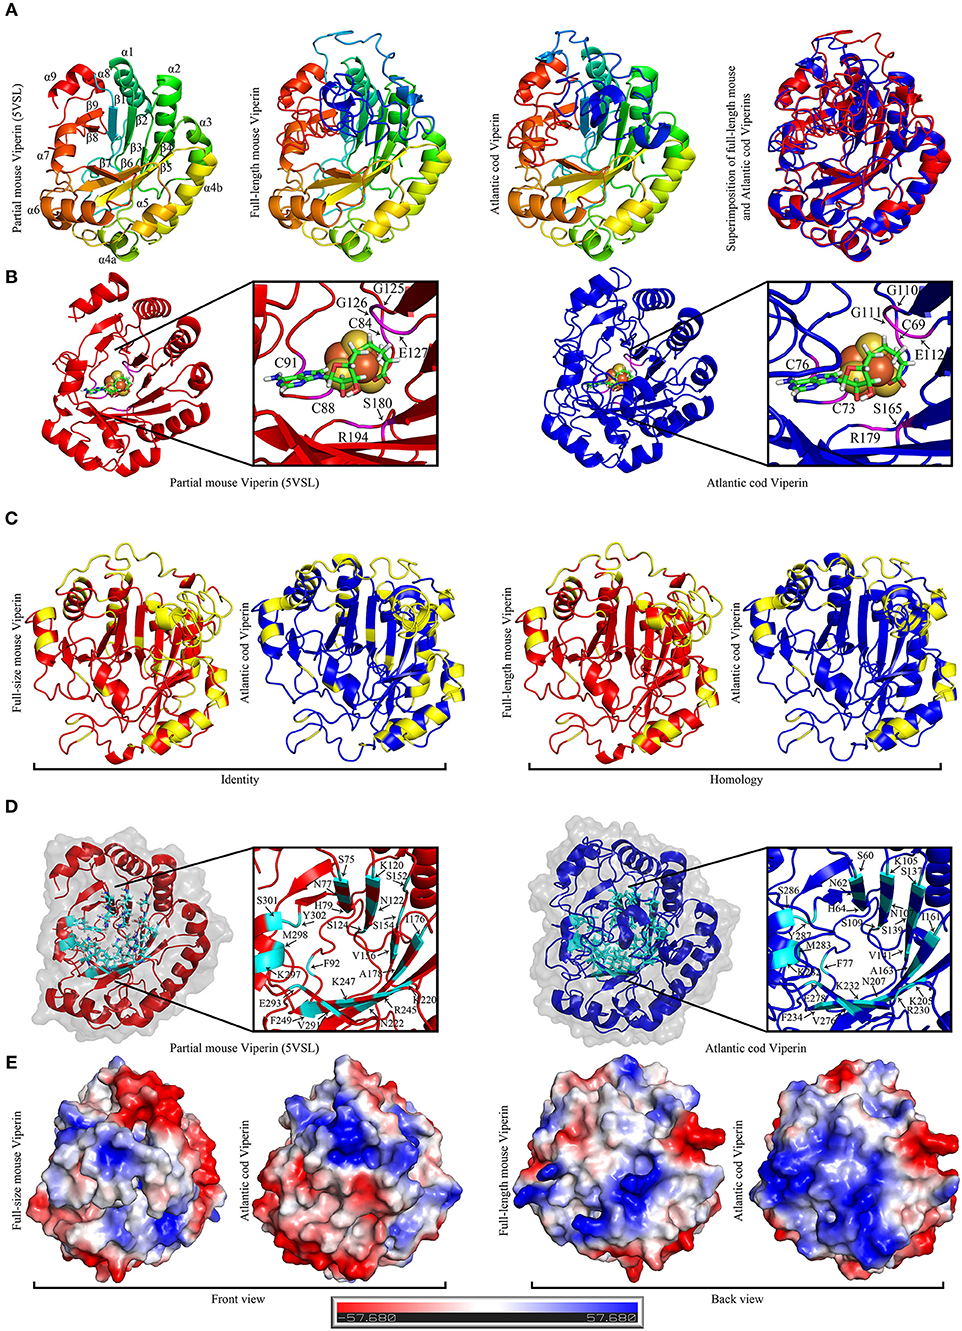
Figure 6. The Predicted structure of mouse and Atlantic cod Viperin. (A) From left to right: Representative ribbon structures of crystallized mouse Viperin (PDB ID: 5VSL); full-length mouse Viperin modeled with the additional α-helix missing from the crystal structure; predicated Atlantic cod Viperin structure; and superimposition of modeled full-length mouse (red) and Atlantic cod (blue) Viperins. In first three models, blue to red color change indicates N to C terminus progression. Loops, β-strands, and α-helices are labeled in mouse crystal structure. (B) Ribbon model of crystal structure of mouse Viperin (left panel) and predicted structure of Atlantic cod Viperin (right panel) showing the SAH and [4Fe-4S] cluster coordinating residues in magenta. (C) Comparison between the identity and homology of the mouse and Atlantic cod Viperin. Non-identical/homologous residues are shown in yellow. (D) Ribbon model of crystal structure of mouse Viperin (left panel) and predicted structure of Atlantic cod Viperin (right panel) showing the amino acid residues forming the catalytic cavity in cyan. (E) Predicted surface topology of full-length mouse and Atlantic cod Viperins. The positive, neutral, and negative residues are colored blue, white, and red, respectively.
The majority of the AA differences between the Atlantic cod and mouse Viperins are located in the α-helices and loops forming the surface of the protein, while the core of the protein forming the potential catalytic pocket cavity remained remarkably conserved (Identity = 65.1%; homology = 77.7%; Figures 6C,D). Strikingly, surface charge analysis of cod Viperin revealed that most AA differences between Atlantic cod and mouse Viperin were replacing negative/neutral AAs with more positively-charged residues, thus increasing the isoelectric point (pI) of the Atlantic cod Viperin compared to its mouse counterpart (mouse Viperin: charge at pH 7 = −5.61, pI = 5.89; Atlantic cod Viperin: charge at pH 7 = +3.78, pI = 8.61; Figure 6E).
Constitutive Expression of Atlantic Cod Viperin During Early and Late Life Stages
qPCR revealed viperin to be a low-expressing gene (i.e., CT values above 30) during early developmental stages of Atlantic cod. The expression of the normalizer genes was slightly lower (Figure 7) during very early Atlantic cod embryonic development (days 0–3), and this appeared to influence the RQ values of viperin for these developmental time points. Therefore, we did not subject these results to statistical analyses. However, as illustrated in Figure 7, the expression of Atlantic cod viperin was relatively higher from mixed cleavage until the mid-blastula stages (i.e., 0–2 DPF). Thereupon, viperin levels dropped to a non-detectable level during gastrula and early segmentation stages (days 4–7). In other words, Atlantic cod viperin was not detected at the onset of zygotic gene expression, suggesting that viperin is a maternal transcript. Atlantic cod viperin expression increased during the segmentation stage, and then appeared to decrease after hatching.
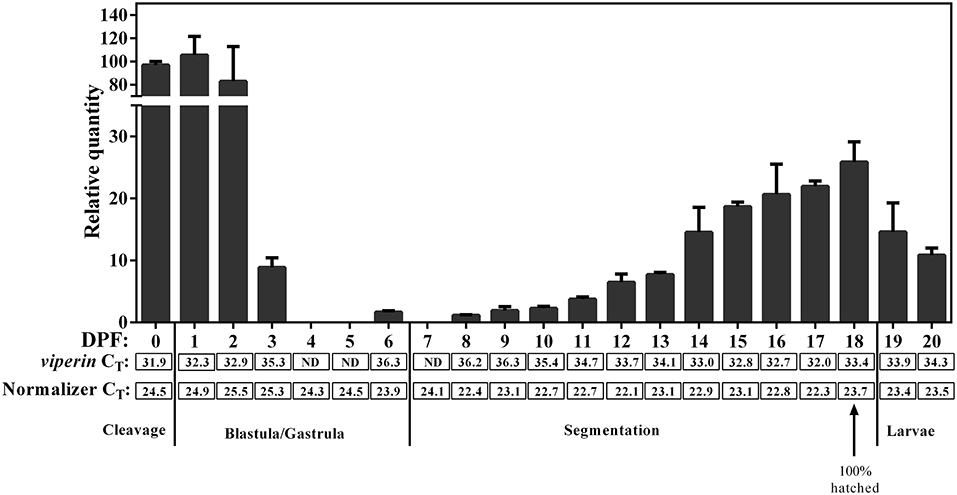
Figure 7. qPCR results of constitutive expression of Atlantic cod viperin during embryonic and early larval development. Relative quantity (RQ) data are presented as mean ± SE. The numbers below each bar show the sampling time (i.e., day post-fertilization, DPF), and 0 DPF are samples taken < 12 h after fertilization (see section Tissue Sampling). Cleavage, Blastula/Gastrula, Segmentation and Larvae describe the developmental stage at which samples were collected (44). CT (Cycle threshold) values for viperin below each bar represent the average CT of 3 pooled samples at the given time point, and ND are “not detectable” samples. Normalizer CT values are the average of the geometric mean value of 2 normalizers in 3 pooled samples (see section Materials and Methods for details). These results were not statistically analyzed since the CT-values of the normalizers in the first 4 sampling time points were slightly higher compared with most other sampling time points.
The constitutive expression of Atlantic cod viperin was assessed in 19 different adult tissues. As shown in Figure 8, the highest expression of viperin transcript was seen in Atlantic cod blood, which was significantly higher than all other tissues. Interestingly, the levels of viperin transcript in immune-related tissues, notably head kidney and spleen, were significantly lower than that in blood. Additionally, viperin transcript had significantly higher expression in gill and pyloric caecum compared to the dorsal skin and liver. The transcript expression of viperin was relatively, but not significantly, lower in the skin, muscle and fin tissues compared with some digestive tissues (e.g., midgut).
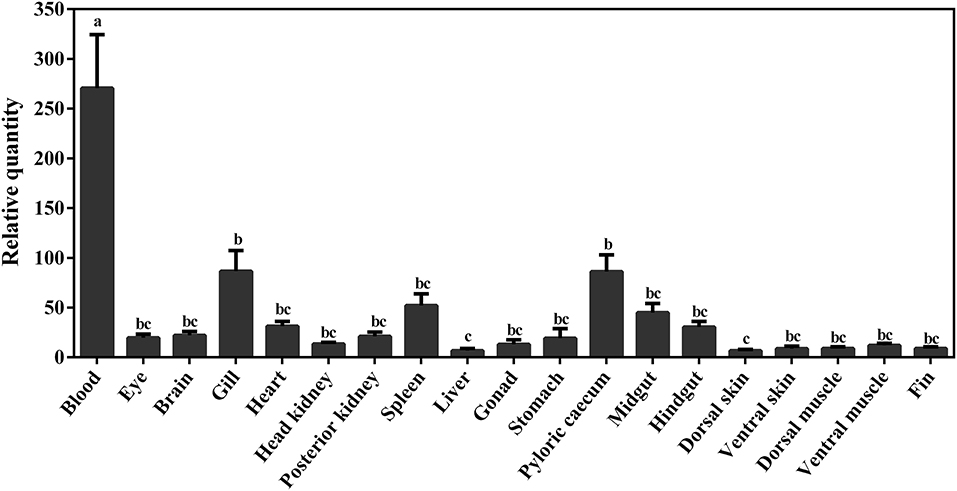
Figure 8. qPCR results of constitutive expression of viperin in different tissues of adult Atlantic cod. Relative quantity (RQ) data are presented as mean ± SE (n = 4). Different letters represent significant differences (p < 0.05) in viperin transcript expression between various tissues.
Pathway Inhibition and Viperin Induction
We used different inhibitors to gain a better understanding of the signaling pathways activating the antiviral response of Atlantic cod viperin. As shown in Figure 9A, 2-AP, an inhibitor of the PKR-dependent pathway, significantly repressed the pIC induction of Atlantic cod viperin compared to the AcOH-matched control. There was no significant difference between group-matched PBS and AcOH controls, showing that viperin suppression in the 2-AP group was not influenced by the AcOH in which 2-AP was dissolved. CHQ also inhibited the viperin transcript expression in the pIC-stimulated Atlantic cod macrophages compared to the DMSO-matched vehicle control, indicating that TLR-activated pathways play an important role in the Atlantic cod viperin antiviral response. The expression of viperin transcript in pIC-treated macrophages was likewise significantly reduced in the S90 group compared to its pIC-treated DMSO vehicle control, suggesting that inhibition of the MAPK pathway strongly affects Atlantic cod viperin induction. Finally, our results revealed that Atlantic cod viperin may be a JAK1/JAK2-activated gene downstream of the IFN pathway, as there was a strong repression in the RUX-exposed pIC group compared to the pIC-treated DMSO vehicle control. On the other hand, there was no significant difference between the RESV (i.e., NFKB inhibitor) group and its DMSO-matched control. Also, with respect to the role of ifng in innate immune responses and viperin induction, the expression levels of ifng as well as two important IFN-induced genes, i.e., isg15-1 and lgp2, were assessed in the macrophage samples (Figures 9B–D). The expression profiles of isg15-1 and lgp2 (Figures 9C,D) in response to various immune inhibitors were similar to viperin. Although there was a significant increase in the level of isg15-1 and lgp2 in the pIC sub-group of RESV treatment compared to its PBS control, the pIC induction of these genes in the RESV-treated samples was significantly attenuated compared to the pIC-stimulated DMSO vehicle control (Figures 9C,D). Further, Atlantic cod ifng showed a largely comparable expression pattern to viperin, and its pIC induction was significantly suppressed by 2-AP, CHQ, S90 and RUX. However, in contrast to viperin and similar to isg15-1 and lgp2, the pIC induction of ifng was significantly decreased by RESV (i.e., 5.1-fold pIC induction) compared to the DMSO control group (13.5-fold pIC induction). Unlike isg15-1 and lgp2, though, there was no significant difference between the PBS control and pIC sub-groups of RESV treatment for ifng, indicating the suppressed induction of this gene by RESV. These findings suggest that, while the expression of all genes studied herein is regulated through PKR, TLR, MAPK and IFN pathways, only ifng shows a significant NFKB-dependent transcriptional activation. None of the inhibitors used in this study influenced viperin, ifng, isg15-1, or lgp2 expression in non-stimulated macrophages, and the inhibitors only suppressed the expression of these antiviral genes in the pIC group compared with pIC-stimulated controls (PBS, DMSO, or AcOH). This suggests that the constitutive expression of these antiviral biomarkers in Atlantic cod macrophages is regulated independent of the inhibited pathways. The expression of il1b was measured as an antibacterial and pro-inflammatory biomarker to examine the specificity of the immune inhibitors used in the current study. The transcription of il1b was not induced by pIC stimulation in any of the treatments (Figure 9E). The expression of il1b remained unchanged in the RESV group compared to the DMSO-matched control. Unlike the antiviral biomarkers, the constitutive expression of il1b was suppressed by 2-AP and S90 (Figure 9E), suggesting that PKR and MAPK pathways may have roles in regulation of il1b basal expression in Atlantic cod macrophages. Interestingly, il1b expression increased in the RUX-exposed group compared to the DMSO-matched control. Also, the expression of il1b was higher in PBS group of CHQ treatment compared to its PBS-matched control group. These results show that the expression profile of il1b is different from those of the antiviral biomarkers subjected to qPCR assays, suggesting that the inhibitors in the present study influenced their specific targets in immune pathways. In the present study, there were no significant differences between DMSO, PBS and AcOH control groups within pIC or PBS treatment, showing that the DMSO vehicle and AcOH used herein did not change the basal or pIC-induced expression of Atlantic cod viperin, ifng, isg15-1, lgp2, and il1b. Figure 10 summarizes the pathway characterization results of the current study and illustrates inhibitors, the target molecules, and their effects on the antiviral immune responses of Atlantic cod macrophages.
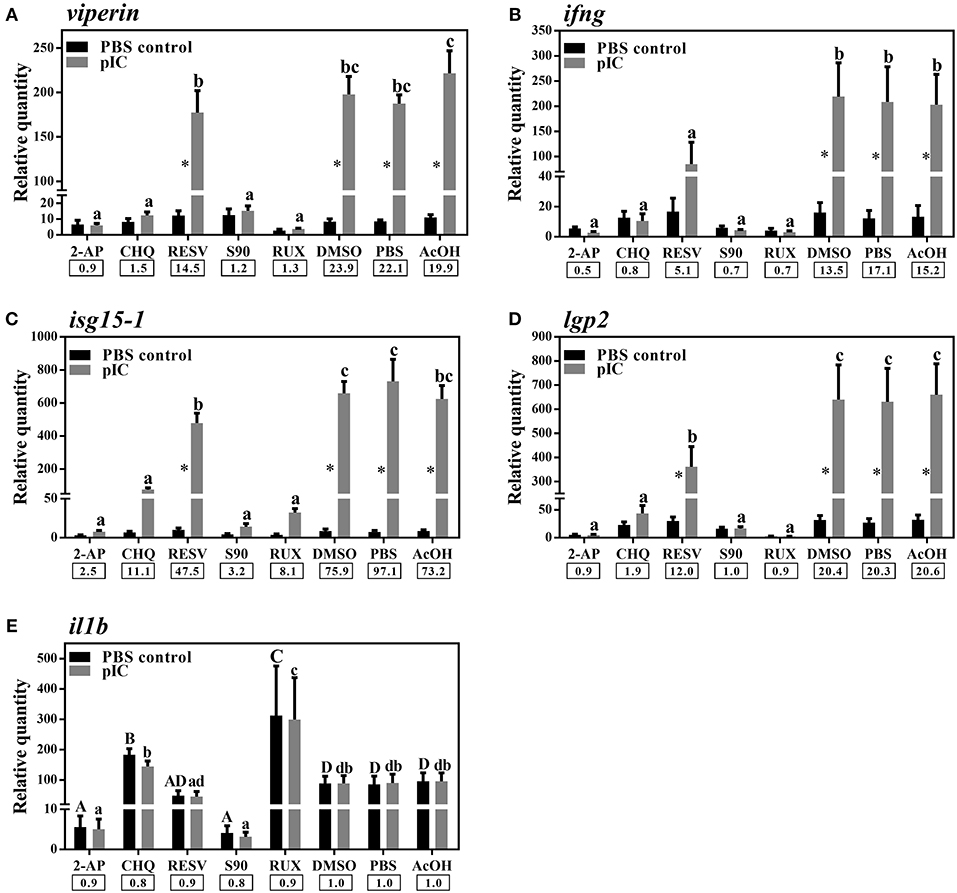
Figure 9. qPCR results of effects of different inhibitors on pIC induction of Atlantic cod viperin (A), ifng (B), isg15-1 (C), lgp2 (D), and il1b (E). Atlantic cod macrophages were exposed to different inhibitors [i.e., 2-Aminopurine (2-AP), Chloroquine (CHQ), Resveratrol (RESV), SB202190 (S90) and Ruxolitinib (RUX) groups] or control groups [i.e., Dimethyl sulfoxide (DMSO)-, phosphate-buffered saline (PBS) and glacial acetic acid (AcOH) controls] for 1 h, and then subjected to pIC or PBS sub-groups for 24 h. DMSO group is considered as vehicle control for RESV, S90, and RUX treatments, whereas PBS and AcOH groups are considered as the control groups of 2-AP and CHQ treatments, respectively. RQ data are presented as mean ± SE. An asterisk shows significant difference (p < 0.05) between treatment-matched pIC and control (PBS) groups. Different letters (upper-case for PBS and lower-case for pIC) represent significant differences among PBS- or pIC-exposed inhibitor and control treatment groups. The pIC induction fold-change (pIC/control) within each treatment (i.e., inhibitors or control groups) is shown below the bars.
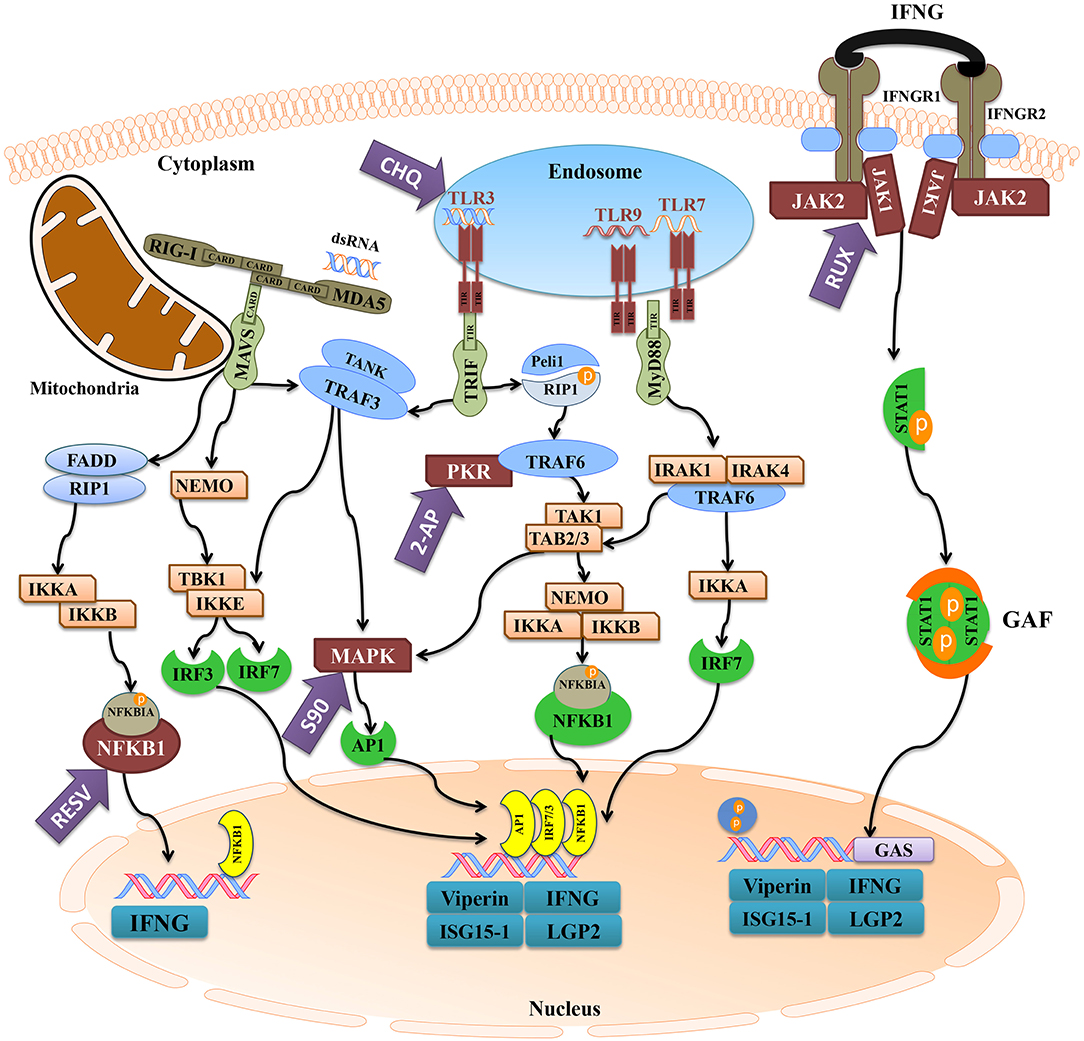
Figure 10. The activation of antiviral pathways in Atlantic cod. This figure was adapted from known mammalian pathways (3–5), and illustrates the effects of immune inhibitors used herein on the antiviral immune response of Atlantic cod viperin, ifng, isg15-1, and lgp2. The purple arrows represent the immune inhibitors used in this study, and the targets of inhibitors are shown in maroon. The turquoise boxes downstream of each pathway indicate the studied pIC-responsive genes that were influenced by the inhibitors. 2-AP (2-Aminopurine), CHQ (Chloroquine), RESV (Resveratrol), S90 (SB202190), RUX (Ruxolitinib), MDA5 (melanoma differentiation-associated protein 5), RIG-I (retinoic acid-inducible gene), MAVS (mitochondrial antiviral-signaling protein), FADD (FAS-associated death domain), RIP1 (receptor-interacting protein 1), IKK (NFKBIA kinase), NFKBIA (NF-kappa-B inhibitor alpha), NFKB1 (nuclear factor kappa-B 1), IFN (interferon), NEMO (NFKB1 essential modulator or IKKG), TLR (Toll-like receptor), TRIF (TIR domain-containing adaptor protein inducing IFNB), TRAF (TNF receptor-associated factor), TANK (TRAF family member-associated NFKB activator), TBK (tank-binding kinase), IRF (IFN regulatory factor), MAPK (mitogen-activated protein kinase), AP1 (transcription factor AP1), Peli1 (pellino E3 ubiquitin protein ligase 1), PKR (IFN-induced, double-stranded RNA-activated protein kinase), TAK1 [transforming growth factor beta (TGFB)-activated kinase 1], TAB (TAK1-binding protein), MyD88 (myeloid differentiation primary response gene 88), IRAK (interleukin-1 receptor-associated kinase), IFNGR (IFN-gamma receptor), JAK (Janus kinase), STAT1 (signal transducer and activator of transcription 1), GAF (IFNG-activated factor), GAS (IFNG-activated sequence), ISG15-1 (IFN-stimulated gene 15-1), LGP2 (RNA helicase LGP2).
Discussion
The sequencing results showed that the Atlantic cod viperin transcript is 1,342-bp long (excluding poly-A tail) and consists of 6 exons. Exon 5 of Atlantic cod viperin is the shortest, whereas exons 1 and 6 are relatively longer compared to the other exons. The transcript size of Atlantic cod viperin is comparable with other fish species such as red drum (21), mandarin fish (Siniperca chuatsi) (54), Chinese perch (S. chuatsi), and Ara (Niphon spinosus) (55). As in Atlantic cod, viperin transcripts of red drum (21) and human (56) were reported to include short 5′-UTRs. Similar to Atlantic cod, viperin genes of various vertebrates, e.g., mandarin fish (54, 55), chicken (Gallus gallus) (57), and mouse (M. musculus) (58), include 6 exons. The viperin exons in these species show a comparable size distribution to exons of Atlantic cod viperin, suggesting an evolutionarily-conserved exon/intron organization for viperin in vertebrates. The present study found viperin to be flanked by rnf144 and cmpk2 in the genome of Atlantic cod, which showed a conserved synteny to human and zebrafish. Previously published studies established the same gene order for viperin and adjacent genes of various fish (i.e., Elephant shark and tilapia), avians [i.e., chicken and zebra finch (Taeniopygia guttata)] and mammals [i.e., mouse and chimpanzee (Pan troglodytes)] (57, 59). Taken together, it seems that the genomic arrangement of viperin and its flanking genes, notably the opposite orientation of viperin and cmpk2, is conserved in vertebrate evolution.
As expected, the phylogenetic tree showed that the relatedness of Viperin putative orthologs appears to agree with taxonomic classification. Previous studies conducting MSAs and molecular phylogenetic analyses of Viperin in different species obtained comparable results to the current study (21, 24, 54, 59–61). Our MSA analyses revealed high levels of diversity in N-terminal AA sequences of putative orthologous Viperins among the representative species of different phyla and classes; in contrast, the radical SAM domain and the C-terminus are highly conserved.
This is the first study predicting protein structure of a teleost Viperin using crystal structure of a mammalian Viperin, and it suggests an overall structural similarity between Viperin of Atlantic cod and mouse. Specifically, the AA residues involved in coordinating the radical SAM domain as well as the [4Fe-4S] cluster of Atlantic cod were shown to be highly conserved compared to its mammalian ortholog. As in duck (Anas platyrhynchos) (60) and red drum (21), a conserved SAM binding motif (CXXXCXXC) was observed (see Figure 3) in the Atlantic cod Viperin. The conserved aromatic residues adjacent to the third cysteine in the CXXXCXXC motif were suggested to modulate the oxidation–reduction midpoint of the [4Fe-4S] cluster (62). The conservation of these residues in Atlantic cod Viperin seen herein suggests that the [4Fe-4S] cluster is likely used for the same function in both species. Moreover, our computational modeling revealed a catalytic cavity that is conserved between the Atlantic cod Viperin and its mammalian ortholog. Also, consistent with Viperin of human, duck, and crucian carp (60, 63, 64), our computational modeling analyses predicted the formation of an α-helix in the N-terminal region of Atlantic cod Viperin, though the N-terminus of all Viperins modeled herein are predicted to be a disordered region. Taken together, these results indicate that Atlantic cod Viperin exhibit the overall conserved structure observed/predicted in other Viperin orthologs, highly suggestive of a comparable functional role.
The radical SAM Superfamily domain is found in hundreds of proteins that play a wide range of roles (65). Viperin has been well-documented to exhibit antiviral activities against human viruses [e.g., Zika, HCV and human cytomegalovirus (HCMV)] (56, 66–68). The radical SAM domain of Viperin is a pivotal factor in the antiviral roles of this protein (67, 69). The antiviral properties of mammalian Viperin chiefly rely on the interaction of its C-terminus with viruses [HCV and Dengue Virus Type-2 (DENV-2)] (70, 71). Similar to the mammalian Viperin, the overexpression of this protein by intramuscular injection of Viperin plasmid enhanced the resistance of rock bream against megalocytivirus (24). Accordingly, the conserved antiviral activity of mammalian and teleost Viperin may be attributed to conserved SAM domains (e.g., near-identical structures of SAM domains of Atlantic cod and mouse reported herein). While N-terminal residues of mammalian Viperin were not necessary for antiviral activity of this protein, they may modulate Viperin antiviral activity (67). The N-terminal amphipathic α-helix anchors Viperin into the ER membrane and is needed for protein localization in lipid droplets (63, 72); correspondingly, the mammalian Viperin N-terminus assists the inhibition of lipid droplet-dependent viral replication [reviewed by (13)]. ER localization of the teleost Viperin was previously shown in rock bream (24) and crucian carp (64). The evolution of fish Viperin involved the positive selection of N-terminal residues (73); therefore, the positively-selected N-terminus and the conserved C-terminus of Viperin may reflect the species-dependent and ancestral functions, respectively, of this protein in antiviral responses (73). The present protein structure findings suggest that the molecular ability of teleost Viperin for binding to ER-associated lipid droplets, most likely, remained conserved, despite a large diversity between N-terminal residues of Viperin orthologs. Further studies are needed to test the correlation between diversity of N-terminal amphipathic α-helix and lipid binding and antiviral functions of teleost Viperin.
Atlantic cod viperin was found as a weakly-expressed gene during embryonic development. However, the expression of viperin was higher in mixed cleavage stage until mid-blastula (i.e., day 0–2) compared with subsequent embryonic stages (e.g., gastrula, early segmentation), showing the existence of viperin transcript prior to the onset of zygotic gene expression. This embryonic expression profile of viperin alongside its presence in adult fish gonads suggests that viperin is a maternal transcript in Atlantic cod. Maternal molecules (e.g., transcripts and proteins) play an important role in defense responses of fish during early life stages (74, 75). Some maternal (i.e., pre-mid-blastula expression) transcripts (e.g., irf7, ifngr1, and cathelicidin) involved in innate immune responses were previously identified in Atlantic cod (76–78). There was a considerable decrease in level of Atlantic cod viperin transcript after mid-blastula stage (i.e., in gastrula to early segmentation stages, 4–8 dpf). The transition from maternal to zygotic gene expression occurs at mid-blastula stage (i.e., maternal-embryo transition) (76, 79, 80). Therefore, with respect to the expression and degradation patterns of maternal transcripts (79), the non-detectable levels of Atlantic cod viperin immediately following mid-blastula stage may be attributed to degradation of maternal transcripts. It remains unknown if Viperin has any function in oogenesis or early embryogenesis. Nonetheless, viral hemorrhagic septicemia virus (VHSV)-induced viperin transcript was reported in eyed eggs and hatching fry of rainbow trout (81). Additionally, levels of viperin transcript increased in 48-h post-fertilization (hpf) larvae of zebrafish and 24-hpf D-veliger larvae of oyster infected with herpes simplex virus 1 (HSV-1) and Ostreid herpesvirus (OsHV-1), respectively (18, 82). We observed a steady increase in expression of Atlantic cod viperin transcript from early segmentation until hatch, and a somewhat decreased viperin expression after the hatch event. Therefore, if viperin function is conserved in teleost fish larvae, then its increasing constitutive expression in later stages of Atlantic cod embryonic development may provide information on the ontogeny of antiviral defense in this species. Further investigations are needed to determine whether viperin is a virus-responsive transcript in Atlantic cod larvae. However, similar to the viperin results seen herein, some immune-relevant transcripts (cxc chemokine, interleukin 8, atf3, and gaduscidin-1) of Atlantic cod were reported to increase during hatching; it was suggested that this induction may be involved in preparing cod embryos at the defensome level to combat environmental pathogens that may be encountered post-hatch (76).
This study showed that the constitutive expression of Atlantic cod viperin varied among different tissues. Atlantic cod viperin was strongly expressed in blood and, interestingly, viperin levels in immune-related tissues (i.e., head kidney and spleen) were significantly lower than in blood. Likewise, the expression of viperin in the blood of red drum (21), large yellow croaker (Larimichthys crocea) (83) and duck (60) was higher than other tissues, including the immune-related and hematopoietic tissues (i.e., kidney of red drum and bursa of Fabricius of duck). Head kidney is the hematopoietic site in teleost species (84), and it contains a large number of differentiating cells (e.g., myeloid progenitor cells). The tissue-dependent expression of viperin in vertebrates may be associated with the differentiation of immune cells, as its expression is lower in hematopoietic tissues than that in the blood. The expression of Atlantic cod viperin transcript in an intestinal tissue (i.e., pyloric caecum) was higher than some tissues (e.g., fin, skin, and muscle). The intestinal expression of viperin was previously reported in different species (Rock bream, amphioxus, and duck) (24, 59, 60). As in other vertebrates (85), the teleost intestine contains various immune cells (e.g., granulocytes and macrophages) (86), and viperin expression in the digestive system of Atlantic cod may be attributed to the mucosal immunity of this species. Collectively, the results suggest that some aspects of cell- and tissue-dependent expression of viperin may be conserved among vertebrates. However, the function of Viperin in uninfected cells and tissues remains undescribed (13), and further studies are needed to determine if the constitutive expression of viperin is related to its immune or potential non-immune roles.
The present study examined if different pathway inhibitors may change the pIC response of Atlantic cod viperin and other well-known antiviral genes (i.e., ifng, isg15-1, and lgp2). In addition to these genes, the expression of il1b was assessed, as a pro-inflammatory and antibacterial biomarker, to check if the inhibitors used in this study have gene-specific effects. Previous studies have documented the induction of Atlantic cod viperin in pIC-exposed macrophages or larval cell line (ACL cells) as well as the spleen of pIC-injected fish (31, 33, 34, 87). Similarly, pIC-triggered expression of viperin has been confirmed by several in vivo- or in vitro-based studies in Pacific oyster (17), crucian carp (23), red drum (21), tilapia (19), large yellow croaker (83), annual fish (20), amphioxus (59), duck (60), and mice (11). Previous studies showed no induction of Atlantic cod viperin in macrophages or ACL cells stimulated with different LPSs (35), as well as in spleens of Atlantic cod injected with different LPSs or formalin-killed atypical Aeromonas salmonicida (35, 88). We also found similar results in LPS-treated Atlantic cod macrophages (unpublished data). Accordingly, the current study did not examine the effects of inhibition of immune-related pathways on the antibacterial response of Atlantic cod viperin. However, antibacterial induction of vertebrate viperin was reported in LPS-stimulated tilapia (19) and chicken (57) as well as mouse macrophages (11) and dendritic cells (89). LPS injection slightly up-regulated viperin expression in the spleen of orange-spotted grouper, but viperin induction was stronger in response to pIC or viral (i.e., grouper iridovirus, GIV) stimulation (90). It seems that, while the transcriptional regulation of the vertebrate viperin by the antiviral response is conserved among vertebrates, viperin may have species-dependent antibacterial responses.
Figure 10 depicts the inhibitors, the targeted factors in antiviral immune responses and the summary of pathway characterization results in this study. The current investigation showed that 2-AP, CHQ, S90, and RUX significantly repressed the pIC-triggered expression of viperin in Atlantic cod macrophages, and similar results were seen for ifng, isg15-1, and lgp2 (Figure 10). In agreement with the present study, 2-AP was previously reported to block pIC induction of viperin in a monocyte/macrophage-like cell line (RTS11) of rainbow trout (91) and mx promoter of Japanese flounder (Paralichthys olivaceus) embryo cells (48). 2-AP is known as an inhibitor of IFN-induced PKR autophosphorylation (92); however, a study revealed that inhibitory effects of 2-AP on IFNB transcription may occur PKR-independently, through inhibiting Akt and consequently nuclear translocation of activated IRF3 (93). The inhibitory mechanisms of 2-AP in fish species are yet to be determined, and 2-AP-associated repression of viperin and other studied genes in Atlantic cod may be caused by PKR- or IRF3-dependent mechanisms. In contrast to antiviral biomarker genes, 2-AP suppressed the basal expression of il1b in Atlantic cod macrophages. In agreement with this result, 2-AP-dependent inhibition of il1b expression was reported in human (94). Taken together, it seems that PKR-regulated expression of il1b is conserved, and 2-AP suppresses PKR-derived immune responses of Atlantic cod in a gene-specific manner. To determine TLR-dependent responses of Atlantic cod viperin, we used CHQ, which blocks the pIC response and TLR signaling by hindering endosomal acidification, thereby impairing PAMP recognition by intracellular TLRs (e.g., TLR3) (95). CHQ can also suppress autophagy by hindering lysosomal acidification, and it can be used as a drug with diverse functions (e.g., in malaria and cancer treatments) (96). However, immunosuppressive and antiviral activities of CHQ are associated with its roles in endosomal pH modulation and blocking nucleic acid binding to TLRs (97, 98). Therefore, the CHQ-mediated immunosuppression seen herein may be attributed to its effects on antiviral responses initiated by endosomal TLRs. CHQ was previously shown to inhibit the antiviral activity of rainbow trout macrophages (99), to decrease pIC induction of il1b in gilthead seabream (Sparus aurata) macrophages (100) and to block R848 (i.e., TLR7 ligand) response [e.g., myeloid differentiation primary response 88 (myd88) and il6] in peripheral blood leukocytes of Japanese flounder (101). The expression of il1b was not influenced by pIC stimulation in the current investigation, but this gene previously showed a slight up-regulation (i.e., 1.4-fold increase at 24 h post-stimulation) in response to pIC in Atlantic cod macrophages (34). Slight differences between il1b results of our previous and present studies may be due to biological variability of immune responses among individuals. However, CHQ enhanced the expression of il1b in the control group, and this gene expression profile (i.e., diverged response of antibacterial and antiviral biomarkers) reflects the specific effects of CHQ on the antiviral response of Atlantic cod macrophages. Collectively, it seems that CHQ influences intracellular TLRs of teleosts, and that activation of Atlantic cod viperin, ifng, isg15-1, and lgp2 is highly dependent upon the endosomal recognition of pIC.
S90 is known to inhibit the activity of p38 MAPK (102). S90 was found to be a strong inhibitor of LPS-induced inflammation relevant genes (e.g., il1b and tnfa) in head kidney leukocytes of Atlantic salmon (47). Generally, p38 MAPK is a well-established key regulator of inflammatory responses (103). Therefore, the suppressed constitutive expression of il1b in the current study may be explained by p38 MAPK-mediated regulation of inflammatory cytokines, as in a previous study involving murine macrophages (104). Nonetheless, with respect to S90-related inhibition of the virus-responsive IFNs, RIG-I-dependent p38 was suggested to be a pivotal factor in antiviral responses of mammalian dendritic cells (105). In Atlantic salmon, transcriptome profiling of antiviral responses of macrophage-like cells identified several pIC-responsive MAPKs (106). While the association of MAPK activation and antiviral responses of teleosts is not yet fully understood, our findings suggest an indirect or direct role of the p38 pathway in induction of Atlantic cod ifng and the other putative IFN-induced genes (i.e., viperin, isg15-1, and lgp2).
RUX blocks the activation of JAK1/JAK2 following the engagement of induced (e.g., pIC and LPS) type I and II IFNs with the IFN receptors (107, 108). As in Atlantic cod viperin, RUX significantly suppressed the expression of ifng, isg15-1, and lgp2 in the present study, suggesting the activation of these genes downstream of JAK1/JAK2-dependent pathway. There is no report on RUX-based inhibition of IFN-dependent responses of fish species, although RUX has been reported to significantly reduce the production of IFNG in mice (50). In mammalian macrophages, RUX suppressed LPS-induced expression of IFN-regulated genes (109) and the IFN-mediated response of genes containing STAT-binding sites in their promoters (107). Similar to crucian carp viperin (23), the proximal promoter region of Atlantic cod viperin contains putative binding sites for GAS and ISRE, suggesting the IFN- or STAT-dependent regulation of this gene. Although the viperin putative TFBSs (i.e., GAS and ISRE sites) identified herein are compatible with the JAK1/JAK2-dependent Atlantic cod viperin transcript expression, these in silico results need to be experimentally validated by future studies. ISRE-regulated activation, as well as IFN receptor (IFNR)- and IRF-dependent induction of viperin have been described for mammalian macrophages (11), and chicken viperin transcript was found to be IFN-responsive (57). Likewise, stimulation of Atlantic salmon TO cells with recombinant IFN (110) or overexpression of IFN in zebrafish embryos (111) up-regulated the expression of teleost viperin. Also, induction of teleost viperin through activating factors downstream of MDA5 and IFN pathways was reported in crucian carp (23). In the present study, we observed a comparable gene expression profile between viperin and ifng in response to different inhibitors (except for RESV). Moreover, two putative IFN-induced genes (i.e., isg15-1 and lgp2) studied herein showed expression profiles that were similar to that of viperin, suggesting that these genes may share signaling pathways (e.g., IFN-related pathway) activating their pIC response. Conversely, il1b in this study showed a different expression pattern and its expression increased in the RUX group compared to the DMSO control group. Likewise, RUX-mediated JAK inhibition increased the expression of pro-inflammatory cytokines (e.g., il6) in mouse macrophages (112). The qPCR results of the current study showed that RUX-mediated immune inhibition variably influenced the response of genes with different putative functions (e.g., antiviral vs. antibacterial roles) and regulatory pathways. We used RQ values of all samples from all treatments (i.e., pIC and PBS samples of inhibitor and control groups) and Pearson correlation coefficient tests to examine correlations between expression of ifng and other assessed genes. There were significant correlations (p < 0.0001) between the expression of Atlantic cod ifng and other antiviral genes [i.e., viperin (R: 0.71), isg15-1 (R: 0.70), and lgp2 (R: 0.94)], but no correlation was seen between ifng and il1b expression (R: 0.04; p = 0.74). This suggests that the IFN pathway plays important roles in transcriptional regulation of Atlantic cod viperin, isg15-1 and lgp2. Additionally, the repressed antiviral response of Atlantic cod viperin, isg15-1 and lgp2 by other immune inhibitors (e.g., 2-AP and CHQ) may also be attributed to their influence on IFNG secretion, as ifng expression was significantly influenced by these inhibitors. Taken together, our results, alongside previous studies, suggest that IFN-dependent regulation of viperin may be conserved among vertebrates. However, a previous study suggested that the pIC induction of rainbow trout viperin may be independent of protein synthesis (91). Therefore, future studies using protein synthesis inhibitors and recombinant IFNs are needed to confirm IFN inducibility of Atlantic cod viperin.
RESV can inhibit NFKB through preventing Nuclear factor kappa-B inhibitor alpha (NFKBIA) phosphorylation (113), and it was shown to down-regulate the immune responses of head kidney leucocytes in turbot (Scophthalmus maximus). However, RESV did not significantly change the expression of Atlantic cod viperin transcript in response to pIC herein. Conversely, the pIC response of Atlantic cod ifng was suppressed by RESV. Also, there was a decrease in pIC induction of isg15-1 and lgp2 in the RESV group compared to the pIC-stimulated DMSO vehicle control group. In agreement with these results, RESV suppressed virus-induced IFNG expression in mice (114). These results suggest that the TLR- or RLR-activated NFKB may enhance the expression of Atlantic cod ifng, and may influence the intensity of the pIC response of isg15-1 and lgp2. Although the current findings suggest NFKB-independent stimulation for Atlantic cod viperin, further studies using a wider range of RESV doses and multiple sampling points are needed to evaluate the time- and dose-dependent effects of RESV on Atlantic cod viperin expression.
In conclusion, the present study showed that Atlantic cod viperin is an evolutionarily conserved gene that has similar gene organization and flanking genes to its putative orthologs in other vertebrates. Atlantic cod Viperin exhibits a close phylogenetic relationship with Viperin of other teleosts. A highly-conserved protein structure reported herein suggests a functional role for the Atlantic cod Viperin comparable with that of other Viperin orthologs. Atlantic cod viperin transcript showed a tissue-specific constitutive expression and was most strongly expressed in the blood. The inhibitory effects of 2-AP, CHQ, and S90 on pIC induction of viperin transcript in Atlantic cod macrophages revealed that the expression of this gene may be dependent upon PKR, intracellular TLRs and MAPK, and/or possibly the factors (e.g., IRFs) activated downstream of these pathways. Also, RUX-associated suppression of Atlantic cod viperin, alongside the GAS and ISRE motifs predicted in the proximal promoter of this gene and its significant correlation with ifng expression in response to different immune inhibitors, suggest the IFN-mediated regulation of Atlantic cod viperin.
Author Contributions
KE took a lead role in gene characterization, sequence analyses, experimental design, sampling, cell isolation, qPCR assays, data analyses, data interpretation, and the writing of manuscript draft. AG helped with RNA extraction, performed computational modeling of Viperin proteins and took part in manuscript writing. XX and SMI helped with sequence characterization, tissue sampling and RNA extraction. ML took part in data analyses and interpretation as well as manuscript writing. MLR was involved in experimental design, data analyses, and data interpretation, and took an active role in manuscript writing. All authors read and approved the final manuscript.
Funding
This study was funded by Natural Sciences and Engineering Research Council of Canada (NSERC) Discovery Grants to MLR (341304-2012) and ML (047960-2015).
Conflict of Interest Statement
The authors declare that the research was conducted in the absence of any commercial or financial relationships that could be construed as a potential conflict of interest.
Acknowledgments
We would like to thank the Dr. Joe Brown Aquatic Research Building (JBARB) staff for assistance with fish husbandry. We are grateful to Dr. Tiago S. Hori for providing us with the RNA samples used as a template in RACE PCR. We would also like to thank Kathleen S. Parrish and David N. G. Huebert for helping with macrophage isolation and technical assistance in computational modeling analyses, respectively.
Supplementary Material
The Supplementary Material for this article can be found online at: https://www.frontiersin.org/articles/10.3389/fimmu.2019.00311/full#supplementary-material
References
1. Sadler AJ, Williams BR. Interferon-inducible antiviral effectors. Nat Rev Immunol. (2008) 8:559–68. doi: 10.1038/nri2314
2. Poynter SJ, DeWitte-Orr SJ. Fish interferon-stimulated genes: The antiviral effectors. Dev Comp Immunol. (2016) 65:218–25. doi: 10.1016/j.dci.2016.07.011
3. Bonjardim CA, Ferreira PC, Kroon EG. Interferons: signaling, antiviral and viral evasion. Immunol Lett. (2009) 122:1–11. doi: 10.1016/j.imlet.2008.11.002
4. Akira S, Uematsu S, Takeuchi O. Pathogen recognition and innate immunity. Cell. (2006) 124:783–801. doi: 10.1016/j.cell.2006.02.015
5. Yu M, Levine SJ. Toll-like receptor 3, RIG-I-like receptors and the NLRP3 inflammasome: key modulators of innate immune responses to double-stranded RNA viruses. Cytokine Growth Factor Rev. (2011) 22:63–72. doi: 10.1016/j.cytogfr.2011.02.001
6. Zhang Y-B, Gui J-F. Molecular regulation of interferon antiviral response in fish. Dev Comp Immunol. (2012) 38:193–202. doi: 10.1016/j.dci.2012.06.003
7. Langevin C, Aleksejeva E, Passoni G, Palha N, Levraud JP, Boudinot P. The antiviral innate immune response in fish: evolution and conservation of the IFN system. J Mol Biol. (2013) 425:4904–20. doi: 10.1016/j.jmb.2013.09.033
8. Schwarze J, Fitch PM, Heimweg J, Errington C, Matsuda R, de Bruin HG, et al. Viral mimic poly-(I: C) attenuates airway epithelial T-cell suppressive capacity: implications for asthma. Eur Respir J. (2016) 48:1785–8. doi: 10.1183/13993003.00841-2016
9. Gitlin L, Barchet W, Gilfillan S, Cella M, Beutler B, Flavell RA, et al. Essential role of mda-5 in type I IFN responses to polyriboinosinic: polyribocytidylic acid and encephalomyocarditis picornavirus. Proc Natl Acad Sci USA. (2006) 103:8459–64. doi: 10.1073/pnas.0603082103
10. Robertsen B. The interferon system of teleost fish. Fish Shellfish Immunol. (2006) 20:172–91. doi: 10.1016/j.fsi.2005.01.010
11. Severa M, Coccia EM, Fitzgerald KA. Toll-like receptor-dependent and -independent viperin gene expression and counter-regulation by PRDI-binding factor-1/BLIMP1. J Biol Chem. (2006) 281:26188–95. doi: 10.1074/jbc.M604516200
12. Fitzgerald KA. The interferon inducible gene: viperin. J Interferon Cytokine Res. (2011) 31:131–5. doi: 10.1089/jir.2010.0127
13. Mattijssen S, Pruijn GJM. Viperin, a key player in the antiviral response. Microbes Infect. (2012) 14:419–26. doi: 10.1016/j.micinf.2011.11.015
14. Helbig KJ, Beard MR. The role of viperin in the innate antiviral response. J Mol Biol. (2014) 426:1210–9. doi: 10.1016/j.jmb.2013.10.019
15. Saitoh T, Satoh T, Yamamoto N, Uematsu S, Takeuchi O, Kawai T, et al. Antiviral protein viperin promotes toll-like receptor 7- and toll-like receptor 9-mediated type I interferon production in plasmacytoid dendritic cells. Immunity. (2011) 34:352–63. doi: 10.1016/j.immuni.2011.03.010
16. Workenhe ST, Rise ML, Kibenge MJT, Kibenge FSB. The fight between the teleost fish immune response and aquatic viruses. Mol Immunol. (2010) 47:2525–36. doi: 10.1016/j.molimm.2010.06.009
17. Green TJ, Benkendorff K, Robinson N, Raftos D, Speck P. Anti-viral gene induction is absent upon secondary challenge with double-stranded RNA in the Pacific oyster, Crassostrea gigas. Fish Shellfish Immunol. (2014) 39:492–7. doi: 10.1016/j.fsi.2014.06.010
18. Green TJ, Helbig K, Speck P, Raftos DA. Primed for success: Oyster parents treated with poly (I: C) produce offspring with enhanced protection against Ostreid herpesvirus type I infection. Mol Immunol. (2016) 78:113–20. doi: 10.1016/j.molimm.2016.09.002
19. Lee SH, Peng KC, Lee LH, Pan CY, Hour AL, Her GM, et al. Characterization of tilapia (Oreochromis niloticus) viperin expression, and inhibition of bacterial growth and modulation of immune-related gene expression by electrotransfer of viperin DNA into zebrafish muscle. Vet Immunol Immunopathol. (2013) 151:217–28. doi: 10.1016/j.vetimm.2012.11.010
20. Liu S, Jiang C, Duan C, Hu L, Zhang S. Expression of virus-responsive genes and their response to challenge with poly (I:C) at different stages of the annual fish Nothobranchius guentheri: Implications for an asymmetric decrease in immunity. Fish Shellfish Immunol. (2015) 46:493–500. doi: 10.1016/j.fsi.2015.07.010
21. Dang W, Zhang M, Hu YH, Sun L. Differential regulation of Sciaenops ocellatus viperin expression by intracellular and extracellular bacterial pathogens. Fish Shellfish Immunol. (2010) 29:264–70. doi: 10.1016/j.fsi.2010.04.015
22. Workenhe ST, Hori TS, Rise ML, Kibenge MJT, Kibenge FSB. Infectious salmon anaemia virus (ISAV) isolates induce distinct gene expression responses in the Atlantic salmon (Salmo salar) macrophage/dendritic-like cell line TO, assessed using genomic techniques. Mol Immunol. (2009) 46:2955–74. doi: 10.1016/j.molimm.2009.06.015
23. Wang B, Zhang YB, Liu TK, Shi J, Sun F, Gui JF. Fish viperin exerts a conserved antiviral function through RLR-triggered IFN signaling pathway. Dev Comp Immunol. (2014) 47:140–9. doi: 10.1016/j.dci.2014.07.006
24. Zhang BC, Zhang J, Xiao ZZ, Sun L. Rock bream (Oplegnathus fasciatus) viperin is a virus-responsive protein that modulates innate immunity and promotes resistance against megalocytivirus infection. Dev Comp Immunol. (2014) 45:35–42. doi: 10.1016/j.dci.2014.02.001
25. Li Z, Xu X, Huang L, Wu J, Lu Q, Xiang Z, et al. Administration of recombinant IFN1 protects zebrafish (Danio rerio) from ISKNV infection. Fish Shellfish Immunol. (2010) 29:399–406. doi: 10.1016/j.fsi.2010.04.020
26. Rosenlund G, Halldórsson Ó. Cod juvenile production: research and commercial developments. Aquaculture. (2007) 268:188–94. doi: 10.1007/s10695-013-9775-9
27. Star B, Nederbragt AJ, Jentoft S, Grimholt U, Malmstrøm M, Gregers TF, et al. The genome sequence of Atlantic cod reveals a unique immune system. Nature. (2011) 477:207–10. doi: 10.1038/nature10342
28. Malmstrøm M, Matschiner M, Tørresen OK, Star B, Snipen LG, Hansen TF, et al. Evolution of the immune system influences speciation rates in teleost fishes. Nat Genet. (2016) 48:1204. doi: 10.1038/ng.3645
29. Solbakken MH, Rise ML, Jakobsen KS, Jentoft S. Successive losses of central immune genes characterize the Gadiformes' alternate immunity. Genome Biol Evol. (2016) 8:3508–15. doi: 10.1093/gbe/evw250
30. Solbakken MH, Voje KL, Jakobsen KS, Jentoft S. Linking species habitat and past palaeoclimatic events to evolution of the teleost innate immune system. Proc R Soc B. (2017) 284:20162810. doi: 10.1098/rspb.2016.2810
31. Rise ML, Hall J, Rise M, Hori T, Kurt Gamperl A, Kimball J, et al. Functional genomic analysis of the response of Atlantic cod (Gadus morhua) spleen to the viral mimic polyriboinosinic polyribocytidylic acid (pIC). Dev Comp Immunol. (2008) 32:916–31. doi: 10.1016/j.dci.2008.01.002
32. Rise ML, Hall JR, Rise M, Hori TS, Browne MJ, Gamperl AK, et al. Impact of asymptomatic nodavirus carrier state and intraperitoneal viral mimic injection on brain transcript expression in Atlantic cod (Gadus morhua). Physiol Genomics. (2010) 42:266–80. doi: 10.1152/physiolgenomics.00168.2009
33. Hori TS, Gamperl AK, Booman M, Nash GW, Rise ML. A moderate increase in ambient temperature modulates the Atlantic cod (Gadus morhua) spleen transcriptome response to intraperitoneal viral mimic injection. BMC Genomics. (2012) 13:431. doi: 10.1186/1471-2164-13-431
34. Eslamloo K, Xue X, Booman M, Smith NC, Rise ML. Transcriptome profiling of the antiviral immune response in Atlantic cod macrophages. Dev Comp Immunol. (2016) 63:187–205. doi: 10.1016/j.dci.2016.05.021
35. Seppola M, Mikkelsen H, Johansen A, Steiro K, Myrnes B, Nilsen IW. Ultrapure LPS induces inflammatory and antibacterial responses attenuated in vitro by exogenous sera in Atlantic cod and Atlantic salmon. Fish Shellfish Immunol. (2015) 44:66–78. doi: 10.1016/j.fsi.2015.01.018
36. Inkpen SM, Hori TS, Gamperl AK, Nash GW, Rise ML. Characterization and expression analyses of five interferon regulatory factor transcripts (Irf4a, Irf4b, Irf7, Irf8, Irf10) in Atlantic cod (Gadus morhua). Fish Shellfish Immunol. (2015) 44:365–81. doi: 10.1016/j.fsi.2015.02.032
37. Tamura K, Peterson D, Peterson N, Stecher G, Nei M, Kumar S. MEGA5: molecular evolutionary genetics analysis using maximum likelihood, evolutionary distance, and maximum parsimony methods. Mol Biol Evol. (2011) 28:2731–9. doi: 10.1093/molbev/msr121
38. Edgar RC. MUSCLE: multiple sequence alignment with high accuracy and high throughput. Nucleic Acids Res. (2004) 32:1792–7. doi: 10.1093/nar/gkh340
39. Finn RD, Coggill P, Eberhardt RY, Eddy SR, Mistry J, Mitchell AL, et al. The Pfam protein families database: towards a more sustainable future. Nucleic Acids Res. (2016) 44:D279–85. doi: 10.1093/nar/gkv1344
40. Fenwick MK, Li Y, Cresswell P, Modis Y, Ealick SE. Structural studies of viperin, an antiviral radical SAM enzyme. Proc Natl Acad Sci USA. (2017) 114:6806–11. doi: 10.1073/pnas.1705402114
41. Roy A, Kucukural A, Zhang Y. I-TASSER: a unified platform for automated protein structure and function prediction. Nat Protoc. (2010) 5:725. doi: 10.1038/nprot.2010.5
42. Yang J, Yan R, Roy A, Xu D, Poisson J, Zhang Y. The I-TASSER Suite: protein structure and function prediction. Nat Methods. (2015) 12:7. doi: 10.1038/nmeth.3213
43. Zhang Y. I-TASSER server for protein 3D structure prediction. BMC Bioinformatics. (2008) 9:40. doi: 10.1186/1471-2105-9-40
44. Hall TE, Smith P, Johnston IA. Stages of embryonic development in the Atlantic cod Gadus morhua. J Morphol. (2004) 259:255–70. doi: 10.1002/jmor.10222
45. Eslamloo K, Inkpen SM, Rise ML, Andreassen R. Discovery of microRNAs associated with the antiviral immune response of Atlantic cod macrophages. Mol Immunol. (2018) 93:152–61. doi: 10.1016/j.molimm.2017.11.015
46. Domínguez B, Pardo BG, Noia M, Millán A, Gómez-Tato A, Martínez P, et al. Microarray analysis of the inflammatory and immune responses in head kidney turbot leucocytes treated with resveratrol. Int Immunopharmacol. (2013) 15:588–96. doi: 10.1016/j.intimp.2013.01.024
47. Holen E, Winterthun S, Du ZY, Krøvel AV. Inhibition of p38 MAPK during cellular activation modulate gene expression of head kidney leukocytes isolated from Atlantic salmon (Salmo salar) fed soy bean oil or fish oil based diets. Fish Shellfish Immunol. (2011) 30:397–405. doi: 10.1016/j.fsi.2010.11.017
48. Ooi EL, Hirono I, Aoki T. Functional characterisation of the Japanese flounder, Paralichthys olivaceus, Mx promoter. Fish Shellfish Immunol. (2006) 21:293–304. doi: 10.1016/j.fsi.2005.12.004
49. Zhu LY, Lin AF, Shao T, Nie L, Dong WR, Xiang LX, et al. B cells in teleost fish act as pivotal initiating APCs in priming adaptive immunity: an evolutionary perspective on the origin of the B-1 cell subset and B7 molecules. J Immunol. (2014) 192:2699–714. doi: 10.4049/jimmunol.1301312
50. Heine A, Held SAE, Daecke SN, Wallner S, Yajnanarayana SP, Kurts C, et al. The JAK-inhibitor ruxolitinib impairs dendritic cell function in vitro and in vivo. Blood. (2013) 122:1192–202. doi: 10.1182/blood-2013-03-484642
51. Bustin SA, Benes V, Garson JA, Hellemans J, Huggett J, Kubista M, et al. The MIQE guidelines: minimum information for publication of quantitative real-time PCR experiments. Clin Chem. (2009) 55:611–22. doi: 10.1373/clinchem.2008.112797
52. Pfaffl MW. A new mathematical model for relative quantification in real-time RT–PCR. Nucleic Acids Res. (2001) 29:e45. doi: 10.1093/nar/29.9.e45
53. Grayfer L, Hodgkinson JW, Belosevic M. Antimicrobial responses of teleost phagocytes and innate immune evasion strategies of intracellular bacteria. Dev Comp Immunol. (2014) 43:223–42. doi: 10.1016/j.dci.2013.08.003
54. Sun BJ, Nie P. Molecular cloning of the viperin gene and its promoter region from the mandarin fish Siniperca chuatsi. Vet Immunol Immunopathol. (2004) 101:161–70. doi: 10.1016/j.vetimm.2004.04.013
55. Chen D, Guo X, Nie P. Phylogenetic studies of sinipercid fish (Perciformes: Sinipercidae) based on multiple genes, with first application of an immune-related gene, the virus-induced protein (viperin) gene. Mol Phylogenet Evol. (2010) 55:1167–76. doi: 10.1016/j.ympev.2010.01.039
56. Chin K-C, Cresswell P. Viperin (cig5), an IFN-inducible antiviral protein directly induced by human cytomegalovirus. Proc Natl Acad Sci USA. (2001) 98:15125–30. doi: 10.1073/pnas.011593298
57. Goossens KE, Karpala AJ, Rohringer A, Ward A, Bean AG. Characterisation of chicken viperin. Mol Immunol. (2015) 63:373–80. doi: 10.1016/j.molimm.2014.09.011
58. Qiu LQ, Cresswell P, Chin KC. Viperin is required for optimal Th2 responses and T-cell receptor–mediated activation of NF-κB and AP-1. Blood. (2009) 113:3520–9. doi: 10.1182/blood-2008-07-171942
59. Lei M, Liu H, Liu S, Zhang Y, Zhang S. Identification and functional characterization of viperin of amphioxus Branchiostoma japonicum: Implications for ancient origin of viperin-mediated antiviral response. Dev Comp Immunol. (2015) 53:293–302. doi: 10.1016/j.dci.2015.07.008
60. Zhong Z, Ji Y, Fu Y, Liu B, Zhu Q. Molecular characterization and expression analysis of the duck viperin gene. Gene. (2015) 570:100–7. doi: 10.1016/j.gene.2015.06.003
61. Milic NL, Davis S, Carr JM, Isberg S, Beard MR, Helbig KJ. Sequence analysis and characterisation of virally induced viperin in the saltwater crocodile (Crocodylus porosus). Dev Comp Immunol. (2015) 51:108–15. doi: 10.1016/j.dci.2015.03.001
62. Sofia HJ, Chen G, Hetzler BG, Reyes-Spindola JF, Miller NE. Radical SAM, a novel protein superfamily linking unresolved steps in familiar biosynthetic pathways with radical mechanisms: functional characterization using new analysis and information visualization methods. Nucleic Acids Res. (2001) 29:1097–106. doi: 10.1093/nar/29.5.1097
63. Hinson ER, Cresswell P. The N-terminal amphipathic α-helix of viperin mediates localization to the cytosolic face of the endoplasmic reticulum and inhibits protein secretion. J Biol Chem. (2009) 284:4705–12. doi: 10.1074/jbc.M807261200
64. Wang B, Zhang Y-B, Liu T-K, Gui J-F. Sequence analysis and subcellular localization of crucian carp Carassius auratus viperin. Fish Shellfish Immunol. (2014) 39:168–77. doi: 10.1016/j.fsi.2014.04.025
65. Frey PA, Hegeman AD, Ruzicka FJ. The radical SAM superfamily. Crit Rev Biochem Mol Biol. (2008) 43:63–88. doi: 10.1080/10409230701829169
66. Helbig KJ, Eyre NS, Yip E, Narayana S, Li K, Fiches G, et al. The antiviral protein viperin inhibits hepatitis C virus replication via interaction with nonstructural protein 5A. Hepatology. (2011) 54:1506–17. doi: 10.1002/hep.24542
67. Jiang D, Guo H, Xu C, Chang J, Gu B, Wang L, et al. Identification of three interferon-inducible cellular enzymes that inhibit the replication of hepatitis C virus. J Virol. (2008) 82:1665–78. doi: 10.1128/JVI.02113-07
68. Hoek KH, Eyre NS, Shue B, Khantisitthiporn O, Glab-Ampi K, Carr JM, et al. Viperin is an important host restriction factor in control of Zika virus infection. Sci Rep. (2017) 7:4475. doi: 10.1038/s41598-017-04138-1
69. Shaveta G, Shi J, Chow VT, Song J. Structural characterization reveals that viperin is a radical S-adenosyl-L-methionine (SAM) enzyme. Biochem Biophys Res Commun. (2010) 391:1390–5. doi: 10.1016/j.bbrc.2009.12.070
70. Wang S, Wu X, Pan T, Song W, Wang Y, Zhang F, et al. Viperin inhibits hepatitis C virus replication by interfering with binding of NS5A to host protein hVAP-33. J Gen Virol. (2012) 93:83–92. doi: 10.1099/vir.0.033860-0
71. Helbig KJ, Carr JM, Calvert JK, Wati S, Clarke JN, Eyre NS, et al. Viperin is induced following dengue virus type-2 (DENV-2) infection and has anti-viral actions requiring the C-terminal end of viperin. PLoS Negl Trop Dis. (2013) 7:e2178. doi: 10.1371/journal.pntd.0002178
72. Hinson ER, Cresswell P. The antiviral protein, viperin, localizes to lipid droplets via its N-terminal amphipathic α-helix. Proc Natl Acad Sci USA. (2009) 106:20452–7. doi: 10.1073/pnas.0911679106
73. Padhi A. Positive selection drives rapid evolution of certain amino acid residues in an evolutionarily highly conserved interferon-inducible antiviral protein of fishes. Immunogenetics. (2013) 65:75–81. doi: 10.1007/s00251-012-0655-8
74. Swain P, Nayak S. Role of maternally derived immunity in fish. Fish Shellfish Immunol. (2009) 27:89–99. doi: 10.1016/j.fsi.2009.04.008
75. Magnadóttir B, Lange S, Gudmundsdottir S, Bøgwald J, Dalmo R. Ontogeny of humoral immune parameters in fish. Fish Shellfish Immunol. (2005) 19:429–39. doi: 10.1016/j.fsi.2005.03.010
76. Rise ML, Hall JR, Alcock BP, Hori TS. Dynamic expression profiles of virus-responsive and putative antimicrobial peptide-encoding transcripts during Atlantic cod (Gadus morhua) embryonic and early larval development. Gene. (2012) 509:232–46. doi: 10.1016/j.gene.2012.08.017
77. Rise ML, Nash GW, Hall JR, Booman M, Hori TS, Trippel EA, et al. Variation in embryonic mortality and maternal transcript expression among Atlantic cod (Gadus morhua) broodstock: a functional genomics study. Mar Genomics. (2014) 18:3–20. doi: 10.1016/j.margen.2014.05.004
78. Seppola M, Johnsen H, Mennen S, Myrnes B, Tveiten H. Maternal transfer and transcriptional onset of immune genes during ontogenesis in Atlantic cod. Dev Comp Immunol. (2009) 33:1205–11. doi: 10.1016/j.dci.2009.06.013
79. Traverso JM, Fostier A, Bobe J. Egg transcriptome, the maternal legacy to the embryo. In: Fletcher GL, Rise ML, editors. Aquaculture Biotechnology. Chichester: Wiley Blackwell (2012). p. 177–92.
80. Lubzens E, Bobe J, Young G, Sullivan CV. Maternal investment in fish oocytes and eggs: the molecular cargo and its contributions to fertility and early development. Aquaculture. (2017) 472:107–43. doi: 10.1016/j.aquaculture.2016.10.029
81. Castro R, Jouneau L, Tacchi L, Macqueen DJ, Alzaid A, Secombes CJ, et al. Disparate developmental patterns of immune responses to bacterial and viral infections in fish. Sci Rep. (2015) 5:15458. doi: 10.1038/srep15458
82. Ge R, Zhou Y, Peng R, Wang R, Li M, Zhang Y, et al. Conservation of the STING-mediated cytosolic DNA sensing pathway in zebrafish. J Virol. (2015) 89:7696–706. doi: 10.1128/JVI.01049-15
83. Zhang J, Liu C, Zhao S, Guo S, Shen B. Molecular characterization and expression analyses of the Viperin gene in Larimichthys crocea (Family: Sciaenidae). Dev Comp Immunol. (2018) 79:59–66. doi: 10.1016/j.dci.2017.10.013
84. Geven EJW, Klaren PHM. The teleost head kidney: Integrating thyroid and immune signalling. Dev Comp Immunol. (2017) 66:73–83. doi: 10.1016/j.dci.2016.06.025
85. Peterson LW, Artis D. Intestinal epithelial cells: regulators of barrier function and immune homeostasis. Nat Rev Immunol. (2014) 14:141. doi: 10.1038/nri3608
86. Rombout JH, Abelli L, Picchietti S, Scapigliati G, Kiron V. Teleost intestinal immunology. Fish Shellfish Immunol. (2011) 31:616–26. doi: 10.1016/j.fsi.2010.09.001
87. Jensen I, Steiro K, Sommer A-I, Mennen S, Johansen A, Sandaker E, et al. Establishing a cell line from Atlantic cod as a novel tool for in vitro studies. Fish Shellfish Immunol. (2013) 34:199–208. doi: 10.1016/j.fsi.2012.10.022
88. Hori TS, Gamperl AK, Nash G, Booman M, Barat A, Rise ML. The impact of a moderate chronic temperature increase on spleen immune-relevant gene transcription depends on whether Atlantic cod (Gadus morhua) are stimulated with bacterial versus viral antigens. Genome. (2013) 56:567–76. doi: 10.1139/gen-2013-0090
89. Boudinot P, Riffault S, Salhi S, Carrat C, Sedlik C, Mahmoudi N, et al. Vesicular stomatitis virus and pseudorabies virus induce a vig1/cig5 homologue in mouse dendritic cells via different pathways. J Gen Virol. (2000) 81:2675–82. doi: 10.1099/0022-1317-81-11-2675
90. Wu MS, Chen CW, Liu YC, Huang HH, Lin CH, Tzeng CS, et al. Transcriptional analysis of orange-spotted grouper reacting to experimental grouper iridovirus infection. Dev Comp Immunol. (2012) 37:233–42. doi: 10.1016/j.dci.2012.04.002
91. DeWitte-Orr SJ, Leong JAC, Bols NC. Induction of antiviral genes, Mx and vig-1, by dsRNA and Chum salmon reovirus in rainbow trout monocyte/macrophage and fibroblast cell lines. Fish Shellfish Immunol. (2007) 23:670–82. doi: 10.1016/j.fsi.2007.01.017
92. Hu Y, Conway TW. 2-Aminopurine inhibits the double-stranded RNA-dependent protein kinase both in vitro and in vivo. J Interferon Res. (1993) 13:323–8.
93. Sugiyama T, Gotou T, Moriyama K, Kajiura N, Hasegawa T, Tomida J, et al. Mechanism of inhibition of lipopolysaccharide-induced interferon-β production by 2-aminopurine. Mol Immunol. (2012) 52:299–304. doi: 10.1016/j.molimm.2012.06.008
94. Youssef RE, Ledingham MA, Bollapragada SS, O'Gorman N, Jordan F, Young A, et al. The role of toll-like receptors (TLR-2 and-4) and triggering receptor expressed on myeloid cells 1 (TREM-1) in human term and preterm labor. Reproduct Sci. (2009) 16:843–56. doi: 10.1177/1933719109336621
95. de Bouteiller O, Merck E, Hasan UA, Hubac S, Benguigui B, Trinchieri G, et al. Recognition of double-stranded RNA by human toll-like receptor 3 and downstream receptor signaling requires multimerization and an acidic pH. J Biol Chem. (2005) 280:38133–45. doi: 10.1074/jbc.M507163200
96. Maycotte P, Aryal S, Cummings CT, Thorburn J, Morgan MJ, Thorburn A. Chloroquine sensitizes breast cancer cells to chemotherapy independent of autophagy. Autophagy. (2012) 8:200–12. doi: 10.4161/auto.8.2.18554
97. Rutz M, Metzger J, Gellert T, Luppa P, Lipford GB, Wagner H, et al. Toll-like receptor 9 binds single-stranded CpG-DNA in a sequence- and pH-dependent manner. Eur J Immunol. (2004) 34:2541–50. doi: 10.1002/eji.200425218
98. Savarino A, Boelaert JR, Cassone A, Majori G, Cauda R. Effects of chloroquine on viral infections: an old drug against today's diseases. Lancet Infect Dis. (2003) 3:722–7. doi: 10.1016/S1473-3099(03)00806-5
99. Jørgensen J, Zou J, Johansen A, Secombes C. Immunostimulatory CpG oligodeoxynucleotides stimulate expression of IL-1β and interferon-like cytokines in rainbow trout macrophages via a chloroquine-sensitive mechanism. Fish Shellfish Immunol. (2001) 11:673–82. doi: 10.1006/fsim.2001.0344
100. Muñoz I, Sepulcre MP, Meseguer J, Mulero V. Toll-like receptor 22 of gilthead seabream, Sparus aurata: molecular cloning, expression profiles and post-transcriptional regulation. Dev Comp Immunol. (2014) 44:173–9. doi: 10.1016/j.dci.2013.12.003
101. Zhou Z-X, Sun L. Immune effects of R848: evidences that suggest an essential role of TLR7/8-induced, Myd88-and NF-κB-dependent signaling in the antiviral immunity of Japanese flounder (Paralichthys olivaceus). Dev Comp Immunol. (2015) 49:113–20. doi: 10.1016/j.dci.2014.11.018
102. Nemoto S, Xiang J, Huang S, Lin A. Induction of apoptosis by SB202190 through inhibition of p38β mitogen-activated protein kinase. J Biol Chem. (1998) 273:16415–20. doi: 10.1074/jbc.273.26.16415
103. Schieven GL. The biology of p38 kinase: a central role in inflammation. Curr Top Med Chem. (2005) 5:921–8. doi: 10.2174/1568026054985902
104. Baldassare JJ, Bi Y, Bellone CJ. The role of p38 mitogen-activated protein kinase in IL-1β transcription. J Immunol. (1999) 162:5367–73.
105. Mikkelsen SS, Jensen SB, Chiliveru S, Melchjorsen J, Julkunen I, Gaestel M, et al. RIG-I-mediated activation of p38 MAPK is essential for viral induction of interferon and activation of dendritic cells dependence on TRAF2 and TAK1. J Biol Chem. (2009) 284:10774–82. doi: 10.1074/jbc.M807272200
106. Eslamloo K, Xue X, Hall JR, Smith NC, Caballero-Solares A, Parrish CC, Taylor RG, Rise ML. Transcriptome profiling of antiviral immune and dietary fatty acid dependent responses of Atlantic salmon macrophage-like cells. BMC Genomics. (2017) 18:706. doi: 10.1186/s12864-017-4099-2
107. Pattison MJ, MacKenzie KF, Elcombe SE, Arthur JSC. IFNβ autocrine feedback is required to sustain TLR induced production of MCP-1 in macrophages. FEBS Lett. (2013) 587:1496–503. doi: 10.1016/j.febslet.2013.03.025
108. Mascarenhas J, Hoffman R. Ruxolitinib: the first FDA approved therapy for the treatment of myelofibrosis. Clin Cancer Res. (2012) 18:3008–14. doi: 10.1158/1078-0432.CCR-11-3145
109. Febvre-James M, Lecureur V, Augagneur Y, Mayati A, Fardel O. Repression of interferon β-regulated cytokines by the Jak1/2 inhibitor ruxolitinib in inflammatory human macrophages. Int Immunopharmacol. (2018) 54:354–65. doi: 10.1016/j.intimp.2017.11.032
110. Sun B, Skjæveland I, Svingerud T, Zou J, Jørgensen J, Robertsen B. Antiviral activity of salmonid gamma interferon against infectious pancreatic necrosis virus and salmonid alphavirus and its dependency on type I interferon. J Virol. (2011) 85:9188–98. doi: 10.1128/JVI.00319-11
111. Aggad D, Mazel M, Boudinot P, Mogensen KE, Hamming OJ, Hartmann R, et al. The two groups of zebrafish virus-induced interferons signal via distinct receptors with specific and shared chains. J Immunol. (2009) 183:3924–31. doi: 10.4049/jimmunol.0901495
112. Pattison MJ, MacKenzie KF, Arthur JSC. Inhibition of JAKs in macrophages increases lipopolysaccharide-induced cytokine production by blocking IL-10–mediated feedback. J Immunol. (2012) 189:2784–92. doi: 10.4049/jimmunol.1200310
113. Adhami VM, Afaq F, Ahmad N. Suppression of ultraviolet B exposure-mediated activation of NF-κB in normal human keratinocytes by resveratrol. Neoplasia. (2003) 5:74–82. doi: 10.1016/S1476-5586(03)80019-2
Keywords: Gadus morhua, rsad2, teleost ISGs, qPCR, dsRNA, inhibition of antiviral responses
Citation: Eslamloo K, Ghorbani A, Xue X, Inkpen SM, Larijani M and Rise ML (2019) Characterization and Transcript Expression Analyses of Atlantic Cod Viperin. Front. Immunol. 10:311. doi: 10.3389/fimmu.2019.00311
Received: 13 September 2018; Accepted: 06 February 2019;
Published: 06 March 2019.
Edited by:
Leon Grayfer, George Washington University, United StatesReviewed by:
Pierre Boudinot, Institut National de la Recherche Agronomique (INRA), FranceChia-Ying Chu, National Taiwan University, Taiwan
Copyright © 2019 Eslamloo, Ghorbani, Xue, Inkpen, Larijani and Rise. This is an open-access article distributed under the terms of the Creative Commons Attribution License (CC BY). The use, distribution or reproduction in other forums is permitted, provided the original author(s) and the copyright owner(s) are credited and that the original publication in this journal is cited, in accordance with accepted academic practice. No use, distribution or reproduction is permitted which does not comply with these terms.
*Correspondence: Khalil Eslamloo, a2VzbGFtbG9vQG11bi5jYQ==
Matthew L. Rise, bXJpc2VAbXVuLmNh