 Shwetank1†
 Elizabeth L. Frost2†‡
 Taryn E. Mockus1
 Heather M. Ren1
 Mesut Toprak3
 Matthew D. Lauver1
 Colleen S. Netherby-Winslow1
 Ge Jin1
 Jennifer M. Cosby4
 Brian D. Evavold4
 Aron E. Lukacher1*
- 1Department of Microbiology and Immunology, Penn State College of Medicine, Hershey, PA, United States
- 2Immunology and Molecular Pathogenesis Graduate Program, Emory University, Atlanta, GA, United States
- 3Section of Neuropathology, Yale School of Medicine, New Haven, CT, United States
- 4Department of Pathology, Microbiology and Immunology, University of Utah, Salt Lake City, UT, United States
Programmed cell death-1 (PD-1) receptor signaling dampens the functionality of T cells faced with repetitive antigenic stimulation from chronic infections or tumors. Using intracerebral (i.c.) inoculation with mouse polyomavirus (MuPyV), we have shown that CD8 T cells establish a PD-1hi, tissue-resident memory population in the brains (bTRM) of mice with a low-level persistent infection. In MuPyV encephalitis, PD-L1 was expressed on infiltrating myeloid cells, microglia and astrocytes, but not on oligodendrocytes. Engagement of PD-1 on anti-MuPyV CD8 T cells limited their effector activity. NanoString gene expression analysis showed that neuroinflammation was higher in PD-L1−/− than wild type mice at day 8 post-infection, the peak of the MuPyV-specific CD8 response. During the persistent phase of infection, however, the absence of PD-1 signaling was found to be associated with a lower inflammatory response than in wild type mice. Genetic disruption and intracerebroventricular blockade of PD-1 signaling resulted in an increase in number of MuPyV-specific CD8 bTRM and the fraction of these cells expressing CD103, the αE integrin commonly used to define tissue-resident T cells. However, PD-L1−/− mice persistently infected with MuPyV showed impaired virus control upon i.c. re-infection with MuPyV. Collectively, these data reveal a temporal duality in PD-1-mediated regulation of MuPyV-associated neuroinflammation. PD-1 signaling limited the severity of neuroinflammation during acute infection but sustained a level of inflammation during persistent infection for maintaining control of virus re-infection.
Introduction
The inhibitory receptor PD-1 plays a dominant role in T cell exhaustion, a state of progressive loss of T cell function resulting from repetitive antigen stimulation such as in chronic viral disease or tumor development (1). Extensive work using experimental models of chronic infection [lymphocytic choriomeningitis virus (LCMV)-clone 13, simian immunodeficiency virus (SIV)] as well as analysis of T cells from individuals infected with human immunodeficiency virus (HIV), hepatitis C virus, and hepatitis B virus, demonstrate that blockade of PD-1 signaling restores T cell functionality (2). Engagement of PD-1 by its ligands PD-L1 (CD274/B7-H1) or PD-L2 (CD273/B7DC) results in recruitment of SHP-phosphatases proximal to the T cell receptor (TCR). These phosphatases inactivate kinase cascades induced by TCR signaling and thereby inhibit downstream pathways required for cytokine production, proliferation, and cytotoxicity (3, 4). PD-L1 is expressed on a variety of cell types while the expression of PD-L2 is limited to antigen presenting cells (5–7). CNS infection with neurotropic coronavirus induced the expression of PD-L1 but not PD-L2 on glia (8). In addition, only PD-1:PD-L1 interactions are responsible for inhibiting CD8 T cell effector function in mouse cytomegalovirus (MCMV) CNS infection (9). PD-1 mediated T cell exhaustion is characterized by increased expression of the transcription factors Eomesodermin (Eomes) and B lymphocyte-induced maturation protein-1 (Blimp-1), co-expression of inhibitory receptors PD-1, Tim3, and 2B4 and diminished effector function [Interferon (IFN)-γ and degranulation] (2, 10).
Accumulating evidence challenges the concept that PD-1 expression is solely synonymous with T cell dysfunction and senescence (11–13). PD-1 regulates T cell mobility in tissues (14) and T cell survival (10, 15). Additionally, in chronic high-viremic infections, T cell dysfunction is not absolute as shown by the emergence of CD8 T cell epitope-escape HIV late in infection (16), and increased viral titers after depletion of CD8 T cells in chronic SIV infection (17, 18). Recent reports support the concept that CD8 T cell exhaustion is a bona fide state of differentiation adapted by T cells, which enables them to survive and retain functionality during persistent infection (19, 20). Reversal of T cell exhaustion by blockade of the PD-1:PD-L1 axis indicates that exhausted T cells span a spectrum of dysfunction with the least exhausted cells, characterized as Tim3−PD-1intTCF-1hiCXCR5hi cells in LMCV infection (21, 22), being more susceptible to functional resurrection after checkpoint inhibitor blockade. PD-1 or PD-L1 antibody-mediated blockade has shown remarkable effectiveness for certain types of cancer (23). Expression of PD-1 has recently been reported in human lung- and brain-resident CD8 T cells, with PD-1 signaling proposed to limit inadvertent deployment of effector mechanisms (24). Tissue-resident memory CD8 T cells are an essential component of the first line of defense against re-infection in non-lymphoid tissues (24–26). Whether PD-1 regulates CD8 T cell activity and affects memory differentiation in non-lymphoid tissues is an open question. Here we asked, in CNS persistent infection, if PD-1 operates to dampen CD8 T cell effector activity and modulate neuroinflammation.
Mouse polyomavirus (MuPyV), a non-enveloped virus with a covalently closed circular ~5-kb double-stranded DNA genome, is the founding member of the family Polyomaviridae. MuPyV establishes a systemic low-level persistent infection in mice; however, whether the virus persists as a smoldering infection or cycles between latency and reactivation has yet to be experimentally ascertained. Inoculation i.c. with MuPyV gives rise to a stable population of virus-specific PD-1+ tissue-resident memory CD8 T cells in the brain (bTRM) (27, 28). Although the role of PD-1 in modulating T cell function has been extensively investigated for virus-specific lymphoid CD8 T cells in the setting of chronic viremia (29), only a few studies have examined PD-1's impact on TRM responding to a persistent viral CNS infection (8, 9, 30). In humans, JC polyomavirus (JCPyV) causes several aggressive CNS diseases, the most common being the frequently fatal demyelinating disease progressive multifocal leukoencephalopathy (PML) (31). JCPγV-specific CD8 T cells in PML patients express PD-1 (32). MCMV, Theiler's murine encephalomyelitis virus (TMEV), and JHM mouse hepatitis virus (JHMV) CNS infections demonstrate that excessive CD8 T cell effector activity is immunopathologic (8, 9, 30, 33). Whether PD-1 regulates neuroinflammation and formation of CD8 TRM in a persistent infection model is incompletely understood.
In this study, we show that PD-1 acts to inhibit the effector functions of virus-specific CD8 bTRM during MuPyV encephalitis. NanoString inflammatory gene expression analysis of brains of wild type (WT) and PD-L1−/− mice infected with MuPyV revealed that PD-1 signaling controls the inflammatory response during acute infection. In striking contrast, the absence of PD-1 signaling during persistent infection resulted in lower neuroinflammation than in WT mice. PD-1 was further found to affect the differentiation of virus-specific CD8 bTRM. Together, these findings reveal a complex, dynamic impact of PD-1 on neuroinflammation and CD8 bTRM formation and activity during persistent viral encephalitis.
Materials and Methods
Mice and Virus Inoculation
C57BL/6NCr (WT) female mice purchased from the Frederick Cancer Research and Development Center of the National Cancer Institute (Frederick, MD) and B7-H1−/− (PD-L1−/−) mice [generously provided by C.C. Bergmann (Lerner Research Institute, Cleveland, OH) with approval of L. Chen (Yale School of Medicine, New Haven, CT)] were housed in accordance with the guidelines of the Institutional Animal Care and Use Committees and the Department of Comparative Medicine at the Pennsylvania State University College of Medicine. The Pennsylvania State University College of Medicine Animal Resource Program is accredited by the Association for Assessment and Accreditation of Laboratory Animal Care International (AAALAC). The Pennsylvania State University College of Medicine has an Animal Welfare Assurance on file with the National Institutes of Health's Office of Laboratory Animal Welfare; the Assurance Number is A3045-01. TCR-I mice expressing a TCR transgene specific for the large T Ag (LT-Ag) 206–215 amino acids from the SV40 virus and the MuPyV mutant encoding this epitope have been previously described (34, 35). At 7-12 weeks of age, anesthetized mice were i.c. inoculated by injecting the right frontal lobe with 30 μl of 2 × 10⁷ plaque-forming units (PFU) of MuPyV strain A2 in DMEM 5% FBS, as previously described (27, 33, 36).
Quantification of MuPyV Genomes and LT-Ag mRNA
TaqMan real-time PCR was performed in an ABI StepOnePlus thermocycler (Applied Biosciences) with 10 μg of template DNA purified from tissues using the Maxwell 16 Research Instrument (Promega, Madison, WI) according to the manufacturer's instructions. Primers and amplification parameters are previously described (37). To determine MuPyV LT-Ag mRNA copy numbers, total RNA from FACS-purified cells was insolated using TRIzol (Ambion, USA) and cDNA was prepared using RevertAid H minus reverse transcriptase (Thermo Scientific, Waltham, MA), as per manufacturer's instructions. Quantitative PCR (qPCR) was performed using FastStart Universal Probe Master (ROX) mix (Sigma-Aldrich) and an ABI PRISM 5700 sequence detection system (Applied Biosystems, Foster, CA), with protocol and primer set as previously described (38).
Bone Marrow Dendritic Cell Culture
Bone marrow was flushed from the femurs and tibias of WT and PD-L1−/− mice using a 30-gauge needle and syringe loaded with DMEM 10% FBS. Red blood cells were lysed with ACK buffer. Bone marrow-derived cells were plated (5 × 10⁶ cells/100 mm diameter Petri dish) and cultured in DMEM 10% FBS with GM-CSF (20 ng/ml) at 37°C, with the media changed every 3 days. After 10 days, differentiated bone marrow dendritic cells (BMDCs) were harvested by gentle trypsinization [trypsin-EDTA (0.25%) (ThermoFisher Scientific) for < 1 min] to release loosely adherent cells. BMDCs were re-plated (3 × 10⁶ cells/100 mm diameter Petri dish in DMEM 10% FBS) with 100 U/ml IFN-γ (PeproTech US, Rocky Hill, NJ) to induce antigen presentation and PD-L1 expression and were incubated overnight at 37°C. BMDCs were transferred to a 96-well plate (3 × 10⁵ cells/well) and incubated with 10 μM LT359 peptide at 37°C for ~6 h prior to co-culture with T cells isolated from brain or spleen.
Cell Isolation, Intracellular Cytokine Staining, and Flow Cytometry
For isolation of neural and mononuclear cells (39), anesthetized mice were perfused transcardially with 30 ml heparinized PBS (100 U/ml). Brains were minced and digested with Collagenase I (100 mg/100 ml) for 15 min at 37°C. Single-step 37% Percoll centrifugation was used to remove myelin from brain homogenates. Cells were washed and incubated with antibodies against CD45 (1:200 dilution, 30-F11), CD11b (1:200 dilution, M1/70), GLAST (Miltenyi, Bergisch Gladbach, Germany, 1:200, ACSA-1), and O4 (product code 130-095-891, Miltenyi, Bergisch Gladbach, Germany; 1:20 dilution). For all other experiments, post perfusion, finely minced brains were digested with collagenase I (Worthington Biochemical, Lakewood, NJ) (40 mg/100 ml) for 20 min at 37°C, followed by a two-step 44%/66% Percoll gradient to remove myelin and cell debris. Spleen and brain cells were exposed to Fixable Viability Dye (eBioscience, San Diego, CA) and Fc Block (BioLegend, San Diego, CA) prior to staining with DbLT359 tetramers (NIH Tetramer Core Facility, Atlanta, GA) and antibodies to the following molecules: CD8α (53–6.7), CD44 (IM7), CD11b (M1/70), CD45(30-F11), CD69 (H1.2F3), CD103 (M290), IFN-γ (XMG1.2), and H-2Db (KH95) purchased from BD Biosciences (San Diego, CA); and PD-1 (RMP1-30), PD-L1 (MIH5), Eomes (Dan11mag), MHC-II (M5/114.15.2), Tim3 (RMT3-23), 2B4 (eBio244F4), and Lag3 (eBioC9B7W) purchased from eBioscience; and CD4 (RM4-5), CD45 (30-F11), CD11b (M1/70), FoxP3 (MF-14), CD25 (3C7), T-bet (4B10), PD-L2 (TY25), CD11c (N418), and CD127 (A7R34) from Biolegend (San Diego, CA). Brain and spleen cells were stimulated with 1 μM LT359-368 peptide (SAVKNY(Abu)SKL), no peptide or peptide-pulsed IFN-γ-treated BMDCs for 5-6 h in the presence of brefeldin A, stained for viability and surface markers, fixed, and permeabilized with CytoFix/CytoPerm (BD Biosciences, San Diego, CA), then stained for intracellular IFN-γ. Anti-IFN-γ staining in the absence of peptide was <1% of CD8+ CD44hi gated cells (data not shown). Samples were acquired on an LSR II or LSRFortessa (BD Biosciences, San Diego, CA) and data analyzed using FlowJo software (Tree Star, Ashland, OR).
Intracerebroventricular (i.c.v.) Cannulation
Prior to surgery, ALZET osmotic pumps (Model 2002, DURECT Corporation, Cupertino, CA) were loaded with 6 mg/ml control rat IgG (Jackson ImmunoResearch, West Grove, PA) or PD-L1 rat IgG (Clone 10F.9G2; BioXCell, West Lebanon, NH), according to manufacturer's instructions, and connected to L-shaped cannulas (ALZET Brain Infusion Kit 3) with tubing trimmed to 2 cm. Pumps were incubated overnight at 37°C in autoclaved PBS to activate flow. Surgical procedures were performed similarly to those described (40). Osmotic pumps were implanted subcutaneously via a scalp incision. After removal of soft tissue from the skull, the cannula was positioned into the left lateral ventricle (1.0 mm lateral to midline, 0.1 mm posterior to bregma, and 3.0 mm dorsoventral to the skull) and secured with ALZET Loctite adhesive. The scalp was sutured over the cannula. i.c.v. antibody administration lasted 14 days at a flow rate of 12 μl/day. Delivery of antibody to the lateral ventricle was confirmed by cutting the brain at the site of cannulation and measuring the volume of antibody remaining in the pump.
Micropipette Adhesion-Frequency Assay
CD8 T cells from brains were isolated using magnetic bead-based positive selection columns (Miltenyi, Bergisch Gladbach, Germany). Coating of human RBCs with the peptide-MHC (p-MHC) DbLT359 monomers, quantification of binding events, TCR surface densities, and TCR affinity calculations were performed as described earlier (27, 41, 42). An adhesion frequency ≥ 0.1 between a T cell and a DbLT359–coated RBC is scored as Ag-reactive.
Luxol Fast Blue (LFB)-Periodic Acid Schiff (PAS)-Hematoxylin Histology
Mice were anesthetized with ketamine and xylazine, perfused transcardially with 10 mL of 10% heparin in PBS and 10 mL of 10% neutral buffered formalin (NBF). After perfusion, heads were removed and immersed in 10% NBF overnight at room temperature. The next day, brains were sectioned on a coronal brain cutting matrix. Formalin fixed-paraffin embedded (FFPE) samples were deparaffinized, then 10 μm sections stained with LFB-PAS, and counterstained with Harris-modified hematoxylin (Fisher), as described (43). LFB-PAS stained sections were digitally imaged on a Keyence BZ-X710 all-in-one fluorescence microscope (4x magnification) and stitched together using ImageJ software (National Institutes of Health, Bethesda, MD). Analysis of myelination in the white matter tracts was performed as described (44).
Immunofluorescence Microscopy
Anesthetized mice were perfused transcardially with heparinized PBS followed by 10% NBF. Three-mm pieces were coronally using a cutting matrix and immersed overnight in 10% NBF and then embedded in paraffin. Ten μm FFPE brain sections were deparaffinized and rehydrated. Antigen retrieval was then performed using 10 mM sodium citrate buffer (pH 6.0). Brain sections were stained with anti-NeuN (Clone A60; Millipore, Darmstadt, Germany) or anti-APC (Clone CC-1; Abcam, Cambridge, UK) for 30 min at room temperature using the Mouse-On-Mouse Fluorescein Kit (Vector, Burlingame, CA), then stained overnight at 4°C with rabbit anti-VP1 [graciously provided by R. Garcea (University of Colorado, Boulder, CO)] followed by donkey anti-rabbit IgG conjugated to Alex Fluor 594 (Jackson ImmunoResearch, West Grove, PA). Astrocyte staining was performed using directly conjugated anti-GFAP (Clone GA5; eBioscience, San Diego, CA). Tissue sections were then mounted with ProLong Gold Anti-Fade Reagent with DAPI (Life Technologies, Carlsbad, CA). Images were acquired using a Leica DM4000 B LED microscope (Leica-Camera, Wetzlar, Germany).
NanoString Gene Expression Analysis
RNA was isolated from a 2-mm thick brain section from the left hemisphere of the cerebrum using the Maxwell® 16 simplyRNA tissue kit with an in-solution DNAse digestion step. RNA from uninfected control groups (2 mice/pool) and infected groups (3 mice/pool) were subjected to NanoString gene expression analysis. 100 ng RNA was used to assess the expression of 254 mouse inflammatory genes provided in the nCounter® Inflammation mouse panels. Fold changes and p-value for the genes were calculated using nSolver software. Fold changes higher than 1.5 fold and p ≤ 0.05 were considered significant. The gene list was imported into the Ingenuity Pathway Analysis (IPA) tool (Qiagen, Redwood City, CA) for enrichment analysis of the pathways and upstream regulators, using Ingenuity Knowledge Base (IKB) as reference data and the contextual analysis settings for mouse tissues (Supplementary Table 1). The enrichment data and the p-values, calculated by Fisher's exact test, were exported and plotted using ggplot2 package in R software. Principal component analysis (PCA) was performed using START: Shiny Transcriptome Analysis Resource Tool hosted at http://kcvi.shinyapps.io/START (46).
Statistical Analysis
p-values were determined by Mann Whitney, Wilcoxon matched-pairs signed rank test, or one-way or two-way ANOVA using GraphPad Prism software (La Jolla, CA). All p < 0.05 were considered significant.
Results
MuPyV-Infected Glial Cells and Infiltrating Monocytes Express High Levels of PD-L1
Using adoptively transferred transgenic CD8 T cells expressing a MuPyV-specific TCR, we previously showed that brain-resident, but not splenic, antiviral CD8 T cells were PD-1hi (28). Here, we examined the expression of PD-1 ligands by microglia, oligodendrocytes, and astrocytes, as well as by infiltrating monocytes in mice acutely infected with MuPyV (Supplementary Figure 1). With the exception of oligodendrocytes, all of these cell types variably upregulated PD-L1 after i.c. MuPyV inoculation, with the infiltrating monocytes having the highest frequency of PD-L1+ cells (Figure 1A). None of these cells showed expression of PD-L2 (data not shown). Although each of these cell populations was infected by MuPyV, microglia and infiltrating monocytes expressed at least a log higher LT-Ag transcripts than oligodendrocytes (Figure 1B). The marginally higher expression of VP1 transcripts in astrocytes vs. oligodendrocytes, while not achieving statistical significance, reinforces previous studies showing that JCPyV more efficiently infects astrocytes than oligodendrocytes in brains of mice engrafted with human glial progenitor cells (47). We further found that astrocytes, but not oligodendrocytes, express the viral capsid protein, VP1 (Figure 1C), a result in line with the human chimeric glial mouse-JCPyV infection model showing that astrocytes and not oligodendrocytes support productive infection (47, 48). In an interesting observation, we found that PD-L1+ astrocytes and microglia harbored a higher viral LT-Ag mRNA load as well (Figure 1D). These data show that resident and infiltrating CNS cell types that express PD-L1 are also infected with MuPyV with a positive association between PD-L1 expression and virus infection.
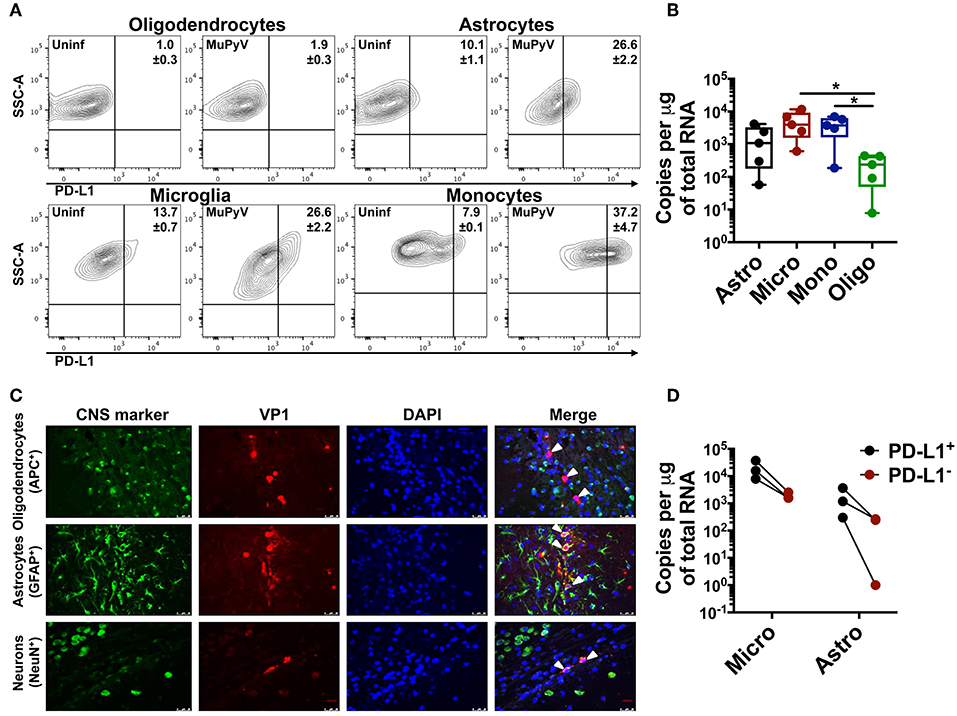
Figure 1. Neural cells express PD-L1. (A) Representative contour plots with frequency of PD-L1+ oligodendrocytes (CD11bneg/CD45neg/O4+), astrocytes (CD11bneg/CD45neg/GLAST+), microglia (CD11bhi/CD45int) and infiltrating monocytes (CD11bhi/CD45hi) from mock inoculated controls and MuPyV-infected mice at 8 dpi. The gates were drawn on the basis of the fluorescence minus one (FMO) controls. (B) LT-Ag mRNA copy number from FACS-purified astrocytes (Astro), microglia (Micro), infiltrating monocytes (Mono), and oligodendrocytes (Oligo). Ct values were normalized to the amount of total RNA taken for cDNA synthesis. Each point represents data from a pool of 3 mice. (C) Fluorescence photomicrographs of FFPE brain tissue sections from mice euthanized at 4 dpi stained with antibodies specific for the indicated CNS cell markers (green) and for MuPyV capsid protein VP1 (red). Nuclei were counterstained with DAPI (blue). White arrows in merged images indicate VP1+ cells (magnification 400X). (D) LT-Ag mRNA copy numbers from FACS-purified PD-L1+ and PD-L1− microglia and astrocytes. Ct values were normalized with the Ct value of TBP mRNA for each cell type between the PD-L1+ and PD-L1− samples. Each point connected by a line indicates cells from a pool of 3 mice. Data are cumulative from two independent experiments with 2–4 mice per group. Two-way ANOVA with Tukey multiple comparison test was performed. Values represent mean ± SD; *p ≤ 0.05.
Sustained PD-1 Expression by Antiviral CD8 T Cells During MuPyV Encephalitis
We reasoned that higher TCR affinity by the CD8 bTRM would lead to augmented TCR signaling. Expression of the transcription factor IRF4 is reflective of TCR affinity and correlates with TCR signaling strength (49, 50). In confirmation of this prediction, we found that the CD8 bTRM stained with tetramers for the dominant DbLT359 MuPyV epitope exhibited higher levels of TCR-signaling, as reflected by the higher expression of IRF4 in the brains than in spleens of mice at 45 days post-infection (dpi) (Figure 2A).
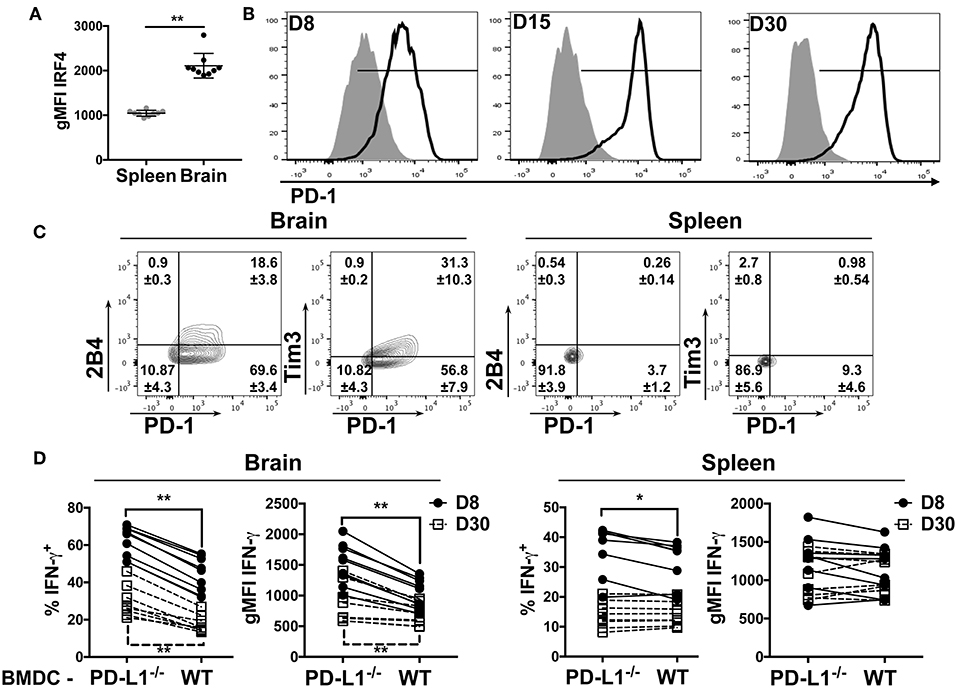
Figure 2. bTRM express PD-1 during MuPyV infection. (A) Expression of IRF4 by DbLT359-specific CD8 T cells from brains and spleens of WT mice at 45 dpi in the indicated groups, represented as gMFI of the population. (B) Representative histograms of PD-1 expression by DbLT359+ CD8 T cells from brain (solid-line) or spleen (shaded) at the indicated dpi. (C) Representative contour plots with frequencies of Tim3/PD-1 and 2B4/PD-1 expressing brain-infiltrating virus-specific CD8 T cells at 45 dpi. (D) Frequency and gMFI of IFN-γ+ CD44+ CD8 T cells from the brain and spleen at the indicated timepoints upon in vitro stimulation with the LT359 peptide-pulsed BMDC from WT and PD-L1−/− mice. Each point connected by a line indicates cells from one mouse. Data are from two independent experiments with 4-5 mice per group. Mann Whitney tests (A) between WT and PD-L1−/− groups and Wilcoxon matched-pairs signed rank test (D) were performed. Values represent mean ± SD; *p ≤ 0.05, **p ≤ 0.01, not significant (ns) p > 0.05.
To understand if increased affinity of virus specific bTRM may reflect selective accumulation of TCR clonotypes in the brain, we performed TCR repertoire analysis using the the TCR-β ImmunoSEQ assay. FACS-purified DbLT359 tetramer+ CD8 T cells were isolated from the brains and spleens of mice 30 dpi. Notably, ~75 of the top 100 TCR clones from the spleen were absent in the brain. Productive entropy, a measure of the diversity of the TCR sequences, was also higher for the DbLT359-specific memory CD8 T cells from the spleen than the DbLT359 specific bTRM (Supplementary Figure 2A). The low diversity of TCR clones in the brain suggests that a subset of virus-specific peripheral CD8 T cells infiltrate or survive during the process of bTRM development.
The dichotomy in PD-1 expression between brain and splenic MuPyV-specific TCR transgenic CD8 T cells was recapitulated by the endogenous DbLT359-specific CD8 T cell response. This dichotomy in PD-1 expression was recapitulated by the endogenous DbLT359-specific CD8 T cell response. DbLT359 tetramer+ CD8 T cells from the brain expressed PD-1 during the acute phase of infection (8 dpi), the expression peaked at 15 dpi, and was sustained into persistent infection (Figure 2B). In contrast, DbLT359-specific CD8 T cells in the spleen only transiently expressed a low level of PD-1 during acute infection (Figure 2B). A sizable fraction of PD-1hi MuPyV-specific CD8 T cells in the brains of persistently infected mice also expressed the inhibitory receptors Tim3 and 2B4 (Figure 2C).
Next, we asked whether engagement of PD-1 by its ligand, PD-L1, functionally inhibited MuPyV-specific CD8 bTRM. Bone marrow-derived dendritic cells (BMDCs) from WT and PD-L1−/− mice were treated with IFN-γ to maximize MHC class I and PD-L1 expression (Supplementary Figures 2B,C), then pulsed with LT359 peptide and used to stimulate T cells isolated from brains and spleens of MuPyV infected mice. LT359 peptide-stimulated CD8 T cells from brains had a higher frequency of IFN-γ+ cells and higher gMFI for IFN-γ at both 8 and 30 dpi when exposed to PD-L1−/− BMDCs as compared to WT BMDCs. In contrast, DbLT359-specific CD8 T cells from the spleen showed only a modest increase in IFN-γ production at 8 dpi when stimulated by PD-L1−/− BMDCs, a time point coincident with PD-1 expression (Figure 2D). Taken together, these data point toward PD-1-mediated inhibition of virus-specific CD8 T cell effector activity during MuPyV encephalitis.
PD-L1 Deficiency Results in a Heightened Inflammatory Environment
Given that disruption of PD-1:PD-L1 signaling augmented IFN-γ production by anti-viral CD8 T cells in vitro, we hypothesized that PD-1 could be playing a role in controlling neuroinflammation in vivo. Upregulation of MHC class II expression on microglia is a commonly used indicator of neuroinflammation (9, 51, 52). Comparing MHC class II expression on microglia from brains of MuPyV infected WT and PD-L1−/− mice, we found significantly higher I-Ab (MHC class II) surface expression on microglia from PD-L1−/− mice at 8 dpi (Figure 3A); however, by 45 dpi MHC II expression levels on microglia of WT and PD-L1−/− mice were comparable (Figure 3B). These data point toward an acute-to-persistent infection phase remission of the heightened inflammatory environment in the PD-L1−/− mice. Furthermore, we found that brain microglia from mice that were adoptively transferred with IFN-γ-sufficient MuPyV-specific TCR transgenic CD8 T cells upregulated I-Ab expression, but no I-Ab upregulation was seen in mice that received IFN-γ deficient-transgenic TCR CD8 T cells (Figure 3C). These data support the likelihood that IFN-γ released by CNS-infiltrating, virus-specific CD8 T cells contributes to neuroinflammation during MuPyV encephalitis.
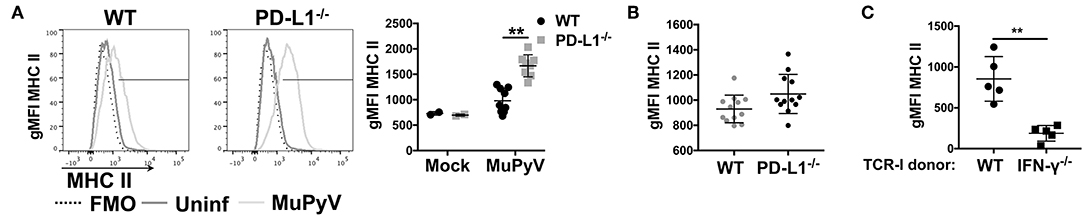
Figure 3. Lack of PD-1 signaling augments CD8 T cell IFN-γ production in vivo. (A) Representative histograms of MHC class II expression on microglia from WT and PD-L1−/− mice at 8 dpi (left panel) with mean ± SD of MHC II gMFI (right panel). (B) MHC II gMFI (mean ± SD) on microglia at 45 dpi. (C) MHC II gMFI on microglia from WT mice at 8 dpi after i.v. transfer of IFN-γ sufficient or IFN-γ−/− naïve TCR-I cells at day−1. Combined data from 2 to 3 independent experiments with 2–4 mice per group; each value indicates cells isolated from an individual mouse. Two-way ANOVA with Tukey multiple comparison test (A) or Mann Whitney test (C) was performed. **p ≤ 0.01.
To obtain a more comprehensive view of the role of PD-1 signaling in controlling neuroinflammation, NanoString gene expression analysis using a 254 gene mouse inflammation panel was performed on brains from acutely (8 dpi) and persistently (35 dpi) infected mice. At 8 dpi, a higher number of genes were upregulated in PD-L1−/− (50 genes) vs. WT mice (25 genes) (Figure 4A). However, in persistent infection, the inflammatory landscape profoundly changed, and did so differently between WT and PD-L1−/− mice. For example, in WT mice, a number of genes were uniquely expressed in the 8 dpi and 35 dpi datasets. In contrast, the gene set upregulated in PD-L1−/− mice at 35 dpi represented a subset of those same genes that were upregulated at 8 dpi (Figures 4B,C). These differences were further reinforced by principal component analysis (PCA) which showed that the inflammatory gene expression profile in the brains of WT mice at 35 dpi were significantly different from both uninfected as well as 8 dpi WT mice (Figure 4D). These observations suggest that the neuroinflammatory environment changes considerably over the course of MuPyV infection in the WT mice, while PD-L1−/− mice show fewer differences between acute and persistent infection.
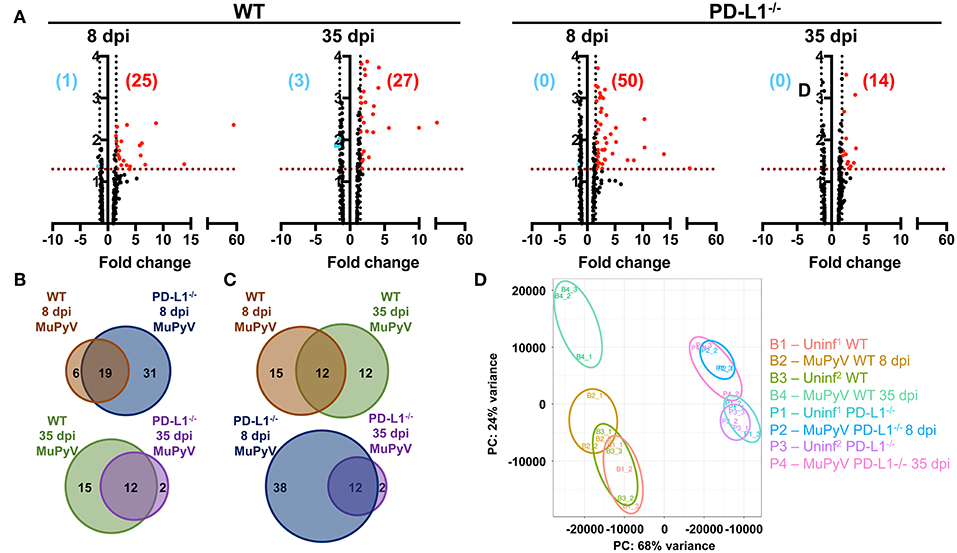
Figure 4. Brains of WT mice and PD-L1−/− mice undergo dynamic and disparate changes in inflammatory transcriptomes from acute to persistent phases of infection. (A) Volcano plots representing differentially expressed genes (fold change ≥1.5 and p ≤ 0.05) of MuPyV infected WT brain samples vs. mock inoculated WT control brains and MuPyV infected PD-L1−/− brains vs. mock inoculated PD-L1−/− brains at 8 dpi and 35 dpi. Combined data from a total of 3 pools of 3 mice per pool. Downregulated and upregulated genes are represented in blue and red dots, respectively. Similarly, numbers in blue and red represent the number of downregulated and upregulated genes, respectively. The y-axis represents –log(p-value) for each gene in the NanoString mouse inflammation panel. (B,C) Venn diagrams showing the overlap in the differentially regulated genes between each group as indicated. (D) PCA of each pooled sample was performed using normalized counts of all genes in the array. Uninf1 and Uninf2 are two independent sets of mock infected controls samples run along with the 8 dpi and 35 dpi MuPyV-infected samples, respectively.
Ingenuity pathway analysis (IPA) revealed major differences in the neuroinflammation signaling pathways in MuPyV-infected WT and PD-L1−/− mice. A heightened inflammatory state is indicated in PD-L1−/− mice by engagement of pathways involved in interferon signaling, dendritic cell maturation and recognition by Pattern Recognition Receptors (PRRs) at 8 dpi (Figure 5A). Conversely, at 35 dpi the neuroinflammation signaling pathway, interferon signaling, role of PRRs in virus recognition and iNOS signaling exhibited higher enrichment scores and –log(p-value) in WT mice than their PD-L1−/− counterparts (Figure 5B). These data provide further evidence for a sustained inflammatory response in WT mice but not in PD-L1−/− mice. Using upstream regulator analysis of IPA, we found that TNF-α and IFN-γ, mediator of CD8 T cell effector function and other inflammatory mediators like IL-15, IL-21, NOS2, STAT1, and NF-κB had higher z-score and –log(p-value) at 35 dpi in PD-L1−/− mice than WT mice (Supplementary Figure 3). These data suggest that PD-1 protects against neuroinflammation during acute MuPyV infection, but paradoxically, ablation of this signaling pathways results in failure to sustain an inflammatory response during persistent infection.
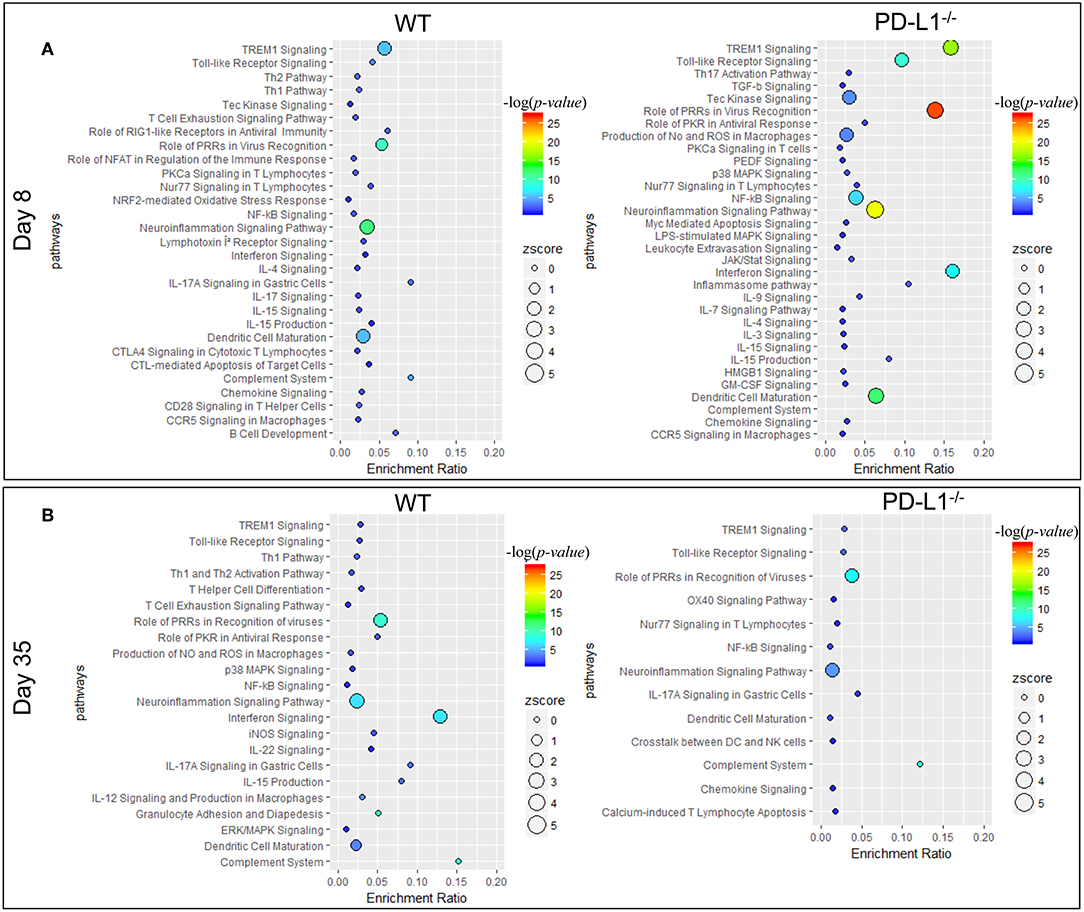
Figure 5. PD-1 signaling alters inflammatory pathways in the brain during MuPyV infection. Pathway enrichment analysis of the differentially expressed genes between MuPyV-infected WT vs. mock-inoculated WT control (left panel), and MuPyV-infected PD-L1−/− vs. mock-inoculated PD-L1−/− control brain (right panel) at 8 dpi (A) and 35 dpi (B) using IPA software. The y-axis represents pathway and the x-axis represents enrichment ratio. Bubble size represents the z-score and color represents the -log(p-value) calculated by Fisher's exact test.
PD-L1-Deficiency Affects the TRM Phenotype
PD-1 signaling has been postulated to regulate CD8 T cell memory formation both in the context of peripheral as well as resident memory (10, 53, 54). In MCMV infection, PD-1 signaling promoted bTRM formation, but had no effect on virus control (53). However, unlike in MCMV acute infection, PD-L1−/− mice showed only a modest, albeit significant, increase in the number of the DbLT359-tetramer+ CD8 T cells; this increase was not seen in the spleen (Figure 6A). Unexpectedly, the frequency as well as number of DbLT359-specific CD8 T cells expressing CD103 were modestly higher in persistently infected PD-L1−/− mice than WT mice (Figure 6B). We independently confirmed this apparent inverse relationship between PD-1 signaling and CD103 expression on MuPyV-specific CD8 T cells by continuous two-week delivery of anti-PD-1 vs. control IgG in persistently infected WT mice (Figure 6C). Interestingly, viral load was unaffected upon either Pdcd1 ablation or antibody-mediated blockade of the PD-1 signaling (Figure 6C and Supplementary Figure 5C). TGF-β produced by CD25+ FoxP3+ CD4+ T cells induces CD103 (55). During the acute phase of infection, brain infiltrating CD25+ FoxP3+ CD4+ T cells were found to express PD-1. Also, PD-L1−/− mice had moderately higher numbers of CD25+ FoxP3+ CD4 T cells compared to the WT mice (Supplementary Figures 4A,B). This increase coincides with higher TGF-β transcripts in the PD-L1−/− mice (Supplementary Figure 4C). These data suggest that the expression of PD-1 on brain infiltrating CD4 T cells could be regulating the observed CD8 T cell response and phenotype in PD-L1−/− mice.
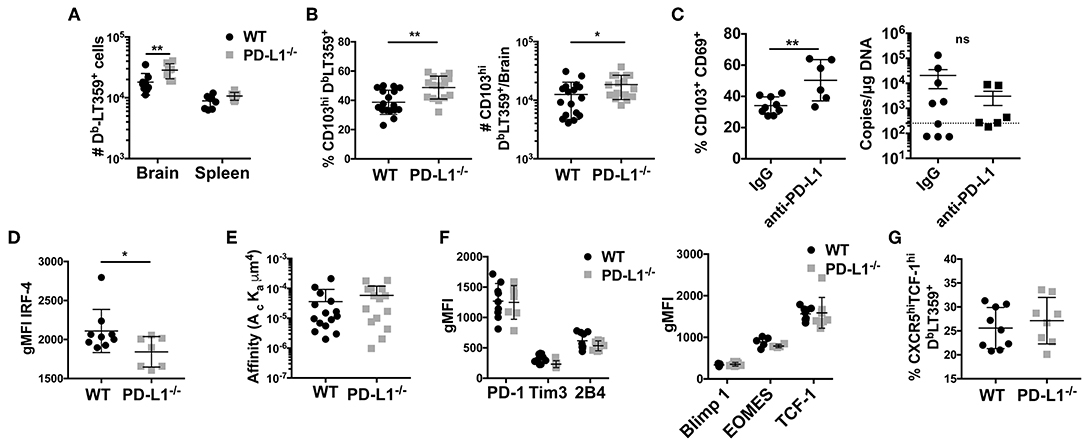
Figure 6. Lack of PD-1 signaling is associated with an increased frequency of CD103+ bTRM (A) Number of DbLT359 specific CD8 T cells in WT and PD-L1−/− mice. (B) Frequency and number of brain CD103+ DbLT359+ CD8 T cells in WT and PD-L1−/− mice. (C) Frequency of CD103+DbLT359+CD69+ CD8 T cells and viral DNA load at 30 dpi in brains of WT mice with control IgG or PD-L1 antibody delivered by i.c.v. cannulae. (D) gMFI of IRF4 expression by DbLT359+ T cells at 9 and 45 dpi. (E) TCR affinities of DbLT359 monomer-binding CD8 T cells determined by 2D-micropipette adhesion assay. Data are from a pool of 5 mice. (F) gMFI of PD-1, Tim3, and 2B4 (left panel), and Blimp-1, EOMES, and TCF-1 (right panel). (G) Frequency of TCF-1+CXCR5+ DbLT359+ CD8 T cells from the brains of mice at 45 dpi. Data are from two to three independent experiments with 3–8 mice per group. Mann Whitney test between WT and PD-L1−/− groups was performed in panels B, C, and D; two-way ANOVA with Tukey multiple comparison test in panel A was performed. Values represent mean ± SD; *p ≤ 0.05, **p ≤ 0.01, not significant (ns) p>0.05.
Subcortical demyelination and enlargement of the ventricles are some of the hallmarks of JCPyV-associated-CNS-syndromes (31). To detect demyelination MuPyV encephalitis, LFB-PAS-hematoxylin staining was performed on vehicle i.c. injected and MuPyV infected brains. No change was seen at 4 dpi between control and infected WT mice (Supplementary Figure 5A). Small foci of demyelination and vacuolation were present in the cingulum bundle and the external capsule at 9 dpi, with enlarged ventricles and edema in the white matter tracts that became progressively worse by 30 dpi (Supplementary Figure 5A). Given the heightened neuroinflammation in the PD-L1−/− mouse brains, we were surprised to see comparable levels of demyelination in persistently infected WT and PD-L1−/− mice [19 dpi (Supplementary Figure 5B) and 30 dpi (data not shown)].
Because MuPyV-specific bTRM express high affinity TCRs and are nearly all PD-1hi, we next investigated the possibility that PD-1 might influence the generation of these cells. At 8 dpi, there was no difference in expression of IRF4 by DbLT359-tetramer+ CD8 T cells between WT and PD-L1−/− mice, but at 45 dpi the bTRM from PD-L1−/− mice showed lower IRF4 expression (Figure 6D). Decreased IRF4 expression was not only restricted to the immunodominant DbLT359 tetramer+ CD8 T cells, but was also seen in the DbLT359 tetramer− CD8 T cells (Supplementary Figure 6A). To see if the difference in IRF4 expression stemmed from differences in TCR affinity, we performed 2D micropipette cell adhesion assays. Interestingly, no difference in TCR affinities between the DbLT359-specific CD8 T cells from WT and PD-L1−/− mice was detected (Figure 6E). Expression of LT-Ag transcript in the brain was also found to be similar between WT and PD-L1−/− mice, negating the possibility that differences in the expression of IRF4 could be ascribed to the differences in antigen expression (Supplementary Figure 6B). Thus, a mechanism other than modulation of TCR affinity comes into play to dampen TCR signaling strength by virus-specific CD8 T cells in the absence of PD-1 signaling.
In LCMV clone 13 chronic infection, circulating CD8 T cells undergo severe exhaustion in the absence of PD-1:PD-L1 signaling (10). Thus, we asked if MuPyV-specific CD8 bTRM developing in the absence of PD-1 signaling undergo terminal exhaustion as an alternative explanation for lower TCR signal strength. Genetic deficiency of PD-L1, did not change the expression of PD-1, 2B4, or Tim3 by MuPyV-specific CD8 T cells (Figure 6F). Lack of PD-1 signaling also did not affect the expression of the transcription factors Eomes, Blimp-1 and TCF-1 (all known to be associated with exhaustion) by DbLT359-specific CD8 T cells (Figure 6F). TCF1hiCXCR5hi CD8 T cells have been recently defined as the PD-1+ memory subset in LCMV clone 13 infections that exhibited less exhaustion and improved functionality upon PD-1 blockade (21, 22). In analogous fashion, we found that DbLT359-specific CD8 bTRM in PD-L1−/− mice had higher numbers of TCF1hiCXCR5hi cells (Figure 6G). Taken together, these findings suggest that loss of PD-1 signaling during MuPyV-encephalitis led to increased CD103 expression and did not guide CD8 bTRM toward terminal exhaustion.
PD-L1 Deficiency Results in Impaired Virus Control Upon Re-infection
Lack of PD-1 signaling due to genetic ablation of PD-L1 resulted in an increased fraction of CD103+ MuPyV-specific CD8 bTRM but did not affect virus levels. CD103 expression has been associated with improved functionality in CD8 TRM cells (56). To test bTRM recall responsiveness, we re-inoculated >45 dpi WT and PD-L1−/− mice i.c. with MuPyV and compared their ability to control this homologous virus challenge. Five days after re-inoculation, persistently infected WT and PD-L1−/− mice showed similar increases in numbers of total CD8 T cells, but significantly more DbLT359-specific CD8 T cells were seen only in the brains of the re-infected WT mice (Figure 7A). The difference between total and virus-specific CD8 T cell numbers in the re-infected WT mice suggested that this increase was predominantly due to recall expansion of anti-MuPyV CD8 bTRM rather than recruitment. Importantly, re-infected PD-L1−/− mice had an ~87-fold increase in virus load in the brain, whereas WT mice showed roughly a 6-fold increase in virus levels (Figure 7B). DbLT359-specific CD8 T cells from the brains of WT and PD-L1−/− mice at day 5 post-challenge also exhibited similar abilities to produce IFN-γ and degranulate (e.g., CD107a/b+) upon LT359 peptide stimulation (Figure 7C). The recall response upon re-infection was mainly due to the activation of CD103+ cells, as only CD103+ cells showed high proliferative potential as indicated by their Ki67 expression. We also observed a moderate decrease in Ki67+ cells in PD-L1−/− mice (Figure 7D). These observations are in line with data in Figure 5B and Supplementary Figure 3, showing PD-1 signaling deficiency results in failure to sustain an inflammatory environment, resulting in poorer virus control. Moreover, these data support the likelihood that neuroinflammatory factors induced by PD-1 signaling are required to maintain immunologic defense against resurgence of a persistent viral encephalitis.
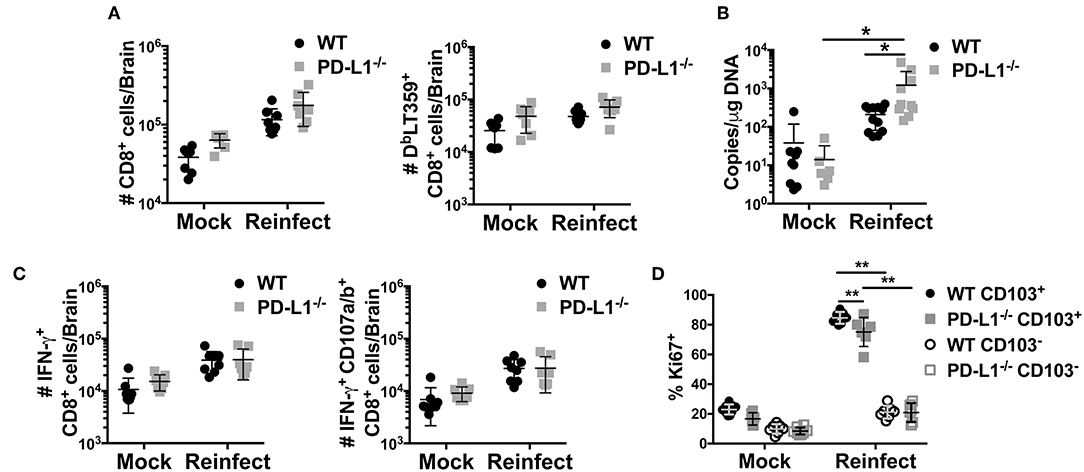
Figure 7. Lack of PD-1 signaling results in impaired viral control. WT or PD-L1−/− mice were re-infected i.c. with MuPyV or mock inoculated at 35 dpi, then euthanized 5 days later. Total CD8 T cells and DbLT359+ CD8 T cells from brains were analyzed by flow cytometry. (A) Number of total CD8 and DbLT359+ CD8 T cells per brain, (B) Brain viral DNA genome copies by qPCR at 5 days after re-infection. (C) Number of IFN-γ+ (left panel) and IFN-γ+ CD107a/b+ (right panel) CD8 T cells upon in vitro stimulation with LT359 peptide. (D) Frequency of Ki67+ LT359+ CD103+/− CD8 T cells upon reinfection. Data from two independent experiments with 3–5 mice per group. Two-way ANOVA with Tukey multiple comparison test was performed. Values represent mean ± SD; *p ≤ 0.05, **p ≤ 0.01. (D) Frequency of Ki67+ LT359+ CD103+/− CD8 T cells upon reinfection.
Discussion
Accumulating evidence indicates that expression of PD-1 and CD103 by CD8 bTRM is dependent on virus context. For example, VSV and LCMV-Armstrong generate PD-1− CD103+ CD8 bTRM, but CD8 bTRM in TMEV and MCMV encephalitis are PD-1+ CD103+ (53, 57–59). In contrast, during persistent MuPyV encephalitis, virus-specific CD8 T cells are uniformly PD-1+, but only ~40% express CD103 (28). In addition, irrespective of CD103 status, MuPyV-specific CD8 bTRM are maintained stably independent of resupply from the circulation; and CD103+ and CD103− cells have highly overlapping transcriptomes (28, 60). However, the CD103+ subset preferentially produces IFN-γ (28, 60) and proliferates upon i.c. MuPyV re-infection (Figure 7D). Moreover, PD-L1−/− mice have diminished ability to control virus levels upon homologous virus re-infection, despite having a higher proportion of CD103+ MuPyV-specific CD8 bTRM than WT mice. Although CD103 expression has been linked to CD8 bTRM formation in response to VSV CNS infection (61), other studies show that CD8 T cell motility in the small intestine mucosa and brain are not dependent on CD103 (58, 62). In addition, intestinal pathogen-specific CD8 TRM to oral Yersinia pseudotuberculosis infection are comprised of CD103+ and CD103− populations, with the latter preferentially localizing to infectious foci (63). In sum, the potential contributions of CD103 to anatomical localization and function of CD8 T cells in different tissues and in the setting of different pathogen infections remain to be determined.
CD4 T cell-derived cytokines may be involved in upregulating CD103 on CD8 TRM. Nearly all MuPyV-specific CD8 T cells in the brains of CD4 T cell-deficient mice are CD103− (60). TGF-β induces CD103 on TRM (64–66); more TGF-β1 transcripts are detected in brains of PD-L1−/− than WT mice persistently infected with MuPyV (Supplementary Figure 4C). In this connection, all CD25+ CD4 T cells isolated from the brains of acutely MuPyV infected mice are PD-1+ and a fraction are FoxP3+ as well (Supplementary Figures 4A,B). Together, these data raise the possibility that, in the absence of inhibitory PD-1 signaling, CD4 T cells in the brain produce more cytokines that induce CD103 expression on CD8 bTRM.
PD-1 expression by CD8 T cells may not inevitably result in T cell exhaustion. PD-1 has been shown to be dispensable for CD8 T cell exhaustion in chronic LCMV infection (10). Severity and duration of chronic viral infections are associated with expression of multiple inhibitory receptors by CD8 T cells in addition to PD-1 (67). In infected WT and PD-L1−/− mice, however, PD-1+ DbLT359 specific CD8 bTRM cells expressed equivalent levels of Tim3 and 2B4. Expression of the Blimp1, Eomes and TCF-1 transcription factors was also unaffected by the absence of PD-1 signaling. LT359 peptide-stimulated bTRM from WT and PD-L1−/− mice were similarly capable of IFN-γ production and degranulation, indicating retention of function independent of PD-1 signaling. MuPyV-specific CD8 bTRM from WT and PD-L1−/− mice also expressed similar levels of PD-1 during persistent infection. We recently reported that PD-1 downregulation on splenic MuPyV-specific CD8 T cells is followed by Pdcd1 promoter loci remethylation (28). PD-1 is stably expressed on anti-MuPyV bTRM in PD-L1−/− mice. These data support the interpretation that PD-1 signaling does not regulate the methylation status of the Pdcd1 gene promotor. In the brains of PD-L1−/− mice a number of upstream regulators were enriched during acute infection but reduced or below threshold during persistent infection (e.g., IFN-γ, IL-15, NOS, NFATC2, and IL12-A), suggesting dynamic epigenetic changes in these genes in the absence of PD-1 signaling.
Microglia, astrocytes and oligodendrocytes express PD-L1, under various inflammatory conditions, such as those induced by MCMV and TMEV CNS infections (8, 33, 68, 69). Yet, PD-L1 in mouse coronavirus encephalomyelitis is only transiently and poorly expressed on microglia, although oligodendrocytes exhibit high and sustained expression (8). In MCMV encephalitis, microglia and astrocytes express PD-L1 (9). In MuPyV infection, PD-L1 was expressed on the infiltrating monocytes, microglia and astrocytes, but not on oligodendrocytes. IFN-γ is a potent inducer of PD-L1 (9). The positive correlation between viral LT-Ag mRNA and PD-L1 expression in MuPyV-infected brain cells could be a result of contact of the infected cells with IFN-γ-secreting CD8 T cells. A similar mechanism termed “adaptive resistance” dampens anti-tumor CD8 effector activity (70, 71). The alternate possibility that MuPyV-infected cells upregulate PD-L1 as a virus-immune evasion strategy is less likely, given that oligodendrocytes, which are also infected, fail to express PD-L1.
Using a NanoString mouse inflammatory gene expression array, we uncovered a PD-L1-dependent difference in the inflammation transcription landscape over the course of MuPyV infection. Compared to WT mice, PD-L1 deficiency during acute infection involved upregulated expression of more genes and enrichment of neuroinflammatory pathways (Figures 4, 5 and Supplementary Figure 3). Of these, brains of PD-L1−/− mice showed exclusive enrichment of NF-κB and apoptotic pathways, as well as IL-9, IL-12, and IL-3 signaling pathways (Figure 5 and Supplementary Figure 3). Although the inflammation transcriptome changed considerably as infection transitioned from acute to persistent infection in WT mice, it failed to do so in PD-L1−/− mice (Figure 4D). Despite this difference, WT and PD-L1−/− mice shared the IL-15 signaling pathway as an upstream regulator. IL-15 is of particular interest, because it is expressed by CNS parenchymal cells as well as by infiltrating immune cells in response to an ongoing inflammatory insult (72). In addition, IL-15 limits apoptosis in neuronal cells and suppresses nitric oxide production in neurons (72). The importance of IL-15 in memory CD8 T cell differentiation and establishing CD8 TRM in barrier tissues are well documented (73–76). An intriguing possibility is that a deficiency in IL-15 in PD-L1 deficient mice underlies the compromised ability of CD8 T cells to control virus levels upon re-infection and promotes neural cell death during persistent infection.
The interferon signaling pathway also showed pronounced differences between WT and PD-L1−/− mice. Genes in this pathway were found to be significantly enriched in persistently, but not acutely infected, WT mice with the reverse seen in PD-L1−/− mice (Figure 5). Type I and II IFNs have been shown to inhibit JCPyV replication in glial cells in vitro (77, 78). In a clinical trial to evaluate IFN-γ as a prophylactic therapy for opportunistic infections in HIV+ patients, none receiving IFN-γ developed PML while 10% of those in the placebo group did (79). Type I IFNs have been shown to enhance the cytolytic activity of airway-resident memory CD8 T cells a secondary respiratory virus challenge (80). We reported that Type I and Type II IFNs inhibit MuPyV replication in vitro and in peripherally inoculated mice, that MuPyV infection in vitro and in vivo induces IFN-β mRNA, and that Type I IFN regulates MuPyV-specific CD8 T cell memory differentiation and function (81, 82). JCPyV, as well as BKPyV and SV40, infections induce a STAT1-dependent upregulation of interferon-stimulated genes and production of IFN-β (83, 84). Thus, differences in IFN signaling pathways in WT and PD-L1−/− mice may reflect dynamic changes over the course of MuPyV encephalitis in Type I IFN-mediated innate immunity and/or Type II IFN production by CNS-infiltrating virus-specific T cells. It merits emphasizing, however, that the NanoString data do not establish a temporal link between PD-1 signaling and CD8 bTRM development.
In summary, PD-1 signaling plays a critical role in regulating the immune response against MuPyV infection of the CNS. Defects in the PD-1:PD-L1 signaling pathway may lead to increased neuroinflammation at the peak of the CD8 bTRM response, but neuroinflammation was not maintained during the persistent phase of this viral encephalitis. Thus, the inhibitory functions of PD-1 are necessary for the generation of a controlled, sustained inflammatory response in the CNS. These findings offer insights into the role of PD-1 in modulating an immune response of a persistent viral infection in the CNS beyond its documented function as a CD8 T cell inhibitory receptor.
Ethics Statement
Institutional Animal Care and Use Committees and the Department of Comparative Medicine at the Pennsylvania State University College of Medicine. The Pennsylvania State University College of Medicine Animal Resource Program is accredited by the Association for Assessment and Accreditation of Laboratory Animal Care International (AAALAC). The Pennsylvania State University College of Medicine has an Animal Welfare Assurance on file with the National Institutes of Health's Office of Laboratory Animal Welfare; the Assurance Number is A3045-01.
Author Contributions
Shwetank, EF, and AL contributed to the conception and design of the study and wrote the manuscript. Shwetank, EF, TM, HR, MT, ML, CN-W, GJ, and JC performed experiments, analyzed data, and performed the statistical analysis. All authors contributed to manuscript revision, read and approved the submitted version.
Funding
Funding for this work was supported by grants from The National Institutes of Health (R01 NS088367 and R01 NS092662 to AL, R01 AI096879 to BE, F31 NS083336 to EF, and F32 NS106730 to CN-W), and the Young Investigator Award from Adaptive Biotech Inc. to Shwetank.
Conflict of Interest Statement
The authors declare that the research was conducted in the absence of any commercial or financial relationships that could be construed as a potential conflict of interest.
Acknowledgments
We thank the Penn State College of Medicine Flow Cytometry Core Facility staff, N. Sheaffer, J. Bednarczyk, and J. Vogel for assistance with flow cytometry analysis and cell sorting. We also thank Adam Fike for help with NanoString analysis.
Supplementary Material
The Supplementary Material for this article can be found online at: https://www.frontiersin.org/articles/10.3389/fimmu.2019.00783/full#supplementary-material
References
1. Virgin HW, Wherry EJ, Ahmed R. Redefining chronic viral infection. Cell. (2009) 138:30–50. doi: 10.1016/j.cell.2009.06.036
3. Okazaki T, Maeda A, Nishimura H, Kurosaki T, Honjo T. PD-1 immunoreceptor inhibits B cell receptor-mediated signaling by recruiting src homology 2-domain-containing tyrosine phosphatase 2 to phosphotyrosine. Proc Natl Acad Sci USA. (2001) 98:13866–71. doi: 10.1073/pnas.231486598
4. Chemnitz JM, Parry RV, Nichols KE, June CH, Riley JL. SHP-1 and SHP-2 associate with immunoreceptor tyrosine-based switch motif of programmed death 1 upon primary human T cell stimulation, but only receptor ligation prevents T cell activation. J Immunol. (2004) 173:945–54. doi: 10.4049/jimmunol.173.2.945
5. Latchman Y, Wood CR, Chernova T, Chaudhary D, Borde M, Chernova I, et al. PD-L2 is a second ligand for PD-1 and inhibits T cell activation. Nat Immunol. (2001) 2:261–8. doi: 10.1038/85330
6. Riella LV, Paterson AM, Sharpe AH, Chandraker A. Role of the PD-1 pathway in the immune response. Am J Transplant. (2012) 12:2575–87. doi: 10.1111/j.1600-6143.2012.04224.x
7. Rozali EN, Hato SV, Robinson BW, Lake RA, Lesterhuis WJ. Programmed death ligand 2 in cancer-induced immune suppression. Clin Dev Immunol. (2012) 2012:656340. doi: 10.1155/2012/656340
8. Phares TW, Ramakrishna C, Parra GI, Epstein A, Chen L, Atkinson R, et al. Target-dependent B7-H1 regulation contributes to clearance of central nervous system infection and dampens morbidity. J Immunol. (2009) 182:5430–8. doi: 10.4049/jimmunol.0803557
9. Schachtele SJ, Hu S, Sheng WS, Mutnal MB, Lokensgard JR. Glial cells suppress postencephalitic CD8 T lymphocytes through PD-L1. Glia. (2014). 62:1582–94. doi: 10.1002/glia.22701
10. Odorizzi PM, Pauken KE, Paley MA, Sharpe A, Wherry EJ. Genetic absence of PD-1 promotes accumulation of terminally differentiated exhausted CD8+ T cells. J Exp Med. (2015) 212:1125–37. doi: 10.1084/jem.20142237
11. Duraiswamy J, Ibegbu CC, Masopust D, Miller JD, Araki K, Doho GH, et al. Phenotype, function, and gene expression profiles of programmed death-1hi CD8 T cells in healthy human adults. J Immunol. (2011) 186:4200–12. doi: 10.4049/jimmunol.1001783
12. Paley MA, Kroy DC, Odorizzi PM, Johnnidis JB, Dolfi DV, Barnett BE, et al. Progenitor and terminal subsets of CD8+ T cells cooperate to contain chronic viral infection. Science. (2012) 338:1220–5. doi: 10.1126/science.1229620
13. Hong JJ, Amancha PK, Rogers K, Ansari AA, Villinger F. Re-evaluation of PD-1 expression by T cells as a marker for immune exhaustion during SIV infection. PLoS ONE. (2013) 8:e60186. doi: 10.1371/journal.pone.0060186
14. Zinselmeyer BH, Heydari S, Sacristan C, Nayak D, Cammer M, Herz J, et al. PD-1 promotes immune exhaustion by inducing antiviral T cell motility paralysis. J Exp Med. (2013) 210:757–74. doi: 10.1084/jem.20121416
15. Staron MM, Gray SM, Marshall HD, Parish IA, Chen JH, Perry CJ, et al. The transcription factor FoxO1 sustains expression of the inhibitory receptor PD-1 and survival of antiviral CD8+ T cells during chronic infection. Immunity. (2014) 41:802–14. doi: 10.1016/j.immuni.2014.10.013
16. Price DA, West SM, Betts MR, Ruff LE, Brenchley JM, Ambrozak DR, et al. T cell receptor recognition motifs govern immune escape patterns in acute SIV infection. Immunity. (2004) 21:793–803. doi: 10.1016/j.immuni.2004.10.010
17. Jin X, Bauer DE, Tuttleton SE, Lewin S, Gettie A, Blanchard J, et al. Dramatic rise in plasma viremia after CD8+ T cell depletion in simian immunodeficiency virus-infected macaques. J Exp Med. (1999) 189:991–8. doi: 10.1084/jem.189.6.991
18. Schmitz JE, Kuroda MJ, Santra S, Sasseville VG, Simon MA, Lifton MA, et al. Control of viremia in simian immunodeficiency virus infection by CD8+ lymphocytes. Science. (1999) 283:857–60. doi: 10.1126/science.283.5403.857
19. Speiser DE, Utzschneider DT, Oberle SG, Munz C, Romero P, Zehn D. T cell differentiation in chronic infection and cancer: functional adaptation or exhaustion? Nat Rev Immunol. (2014) 14:768–74. doi: 10.1038/nri3740
20. Wherry EJ, Kurachi M. Molecular and cellular insights into T cell exhaustion. Nat Rev Immunol. (2015) 15:486–99. doi: 10.1038/nri3862
21. Im SJ, Hashimoto M, Gerner MY, Lee J, Kissick HT, Burger MC, et al. Defining CD8+ T cells that provide the proliferative burst after PD-1 therapy. Nature. (2016) 537:417–21. doi: 10.1038/nature19330
22. Wu T, Ji Y, Moseman EA, Xu HC, Manglani M, Kirby M, et al. The TCF1-Bcl6 axis counteracts type I interferon to repress exhaustion and maintain T cell stemness. Sci Immunol. (2016) 1:eaai8593. doi: 10.1126/sciimmunol.aai8593
23. Pauken KE, Wherry EJ. Overcoming T cell exhaustion in infection and cancer. Trends Immunol. (2015) 36:265–76. doi: 10.1016/j.it.2015.02.008
24. Hombrink P, Helbig C, Backer RA, Piet B, Oja AE, Stark R, et al. Programs for the persistence, vigilance and control of human CD8+ lung-resident memory T cells. Nat Immunol. (2016) 17:1467–78. doi: 10.1038/ni.3589
25. Schenkel JM, Masopust D. Tissue-resident memory T cells. Immunity. (2014) 41:886–97. doi: 10.1016/j.immuni.2014.12.007
26. Smolders J, Heutinck KM, Fransen NL, Remmerswaal EBM, Hombrink P, Ten Berge IJM, et al. Tissue-resident memory T cells populate the human brain. Nat Commun. (2018) 9:4593. doi: 10.1038/s41467-018-07053-9
27. Frost EL, Kersh AE, Evavold BD, Lukacher AE. Cutting Edge: Resident memory CD8 T cells express high-affinity TCRs. J Immunol. (2015) 195:3520–4. doi: 10.4049/jimmunol.1501521
28. Shwetank AHA, Frost EL, Schmitz HM, Mockus TE, Youngblood BA, Lukacher AE. Maintenance of PD-1 on brain-resident memory CD8 T cells is antigen independent. Immunol Cell Biol. (2017) 95:953–9. doi: 10.1038/icb.2017.62
29. Barber DL, Wherry EJ, Masopust D, Zhu B, Allison JP, Sharpe AH, et al. Restoring function in exhausted CD8 T cells during chronic viral infection. Nature. (2006) 439:682–7. doi: 10.1038/nature04444
30. Phares TW, Stohlman SA, Hinton DR, Atkinson R, Bergmann CC. Enhanced antiviral T cell function in the absence of B7-H1 is insufficient to prevent persistence but exacerbates axonal bystander damage during viral encephalomyelitis. J Immunol. (2010) 185:5607–18. doi: 10.4049/jimmunol.1001984
31. Miskin DP, Koralnik IJ. Novel syndromes associated with JC virus infection of neurons and meningeal cells: no longer a gray area. Curr Opin Neurol. (2015) 28:288–94. doi: 10.1097/WCO.0000000000000201
32. Tan CS, Bord E, Broge TA Jr, Glotzbecker B, Mills H, Gheuens S, et al. Increased program cell death-1 expression on T lymphocytes of patients with progressive multifocal leukoencephalopathy. J Acquir Immune Defic Syndr. (2012) 60:244–8. doi: 10.1097/QAI.0b013e31825a313c
33. Duncan DS, Miller SD. CNS expression of B7-H1 regulates pro-inflammatory cytokine production and alters severity of Theiler's virus-induced demyelinating disease. PLoS ONE. (2011) 6:e18548. doi: 10.1371/journal.pone.0018548
34. Staveley-O'carroll K, Schell TD, Jimenez M, Mylin LM, Tevethia MJ, Schoenberger SP, et al. In vivo ligation of CD40 enhances priming against the endogenous tumor antigen and promotes CD8+ T cell effector function in SV40 T antigen transgenic mice. J Immunol. (2003) 171:697–707. doi: 10.4049/jimmunol.171.2.697
35. Wilson JJ, Pack CD, Lin E, Frost EL, Albrecht JA, Hadley A, et al. CD8 T cells recruited early in mouse polyomavirus infection undergo exhaustion. J Immunol. (2012) 188:4340–8. doi: 10.4049/jimmunol.1103727
36. Savarin C, Bergmann CC, Hinton DR, Stohlman SA. Differential regulation of self-reactive CD4+ T cells in cervical lymph nodes and central nervous system during viral encephalomyelitis. Front Immunol. (2016) 7:370. doi: 10.3389/fimmu.2016.00370
37. Kemball CC, Lee ED, Vezys V, Pearson TC, Larsen CP, Lukacher AE. Late priming and variability of epitope-specific CD8+ T cell responses during a persistent virus infection. J Immunol. (2005) 174:7950–60. doi: 10.4049/jimmunol.174.12.7950
38. Maru S, Jin G, Desai D, Amin S, Shwetank L, Lukacher AE, et al. Inhibition of retrograde transport limits polyomavirus infection in vivo. mSphere. (2017) 2:e00494–17. doi: 10.1128/mSphereDirect.00494-17
39. Legroux L, Pittet CL, Beauseigle D, Deblois G, Prat A, Arbour N. An optimized method to process mouse CNS to simultaneously analyze neural cells and leukocytes by flow cytometry. J Neurosci Methods. (2015) 247:23–31. doi: 10.1016/j.jneumeth.2015.03.021
40. Devos SL, Miller TM. Direct intraventricular delivery of drugs to the rodent central nervous system. J Vis Exp. (2013) e50326. doi: 10.3791/50326
41. Huang J, Zarnitsyna VI, Liu B, Edwards LJ, Jiang N, Evavold BD, et al. The kinetics of two-dimensional TCR and pMHC interactions determine T-cell responsiveness. Nature. (2010) 464:932–6. doi: 10.1038/nature08944
42. Sabatino JJ Jr, Huang J, Zhu C, Evavold BD. High prevalence of low affinity peptide-MHC II tetramer-negative effectors during polyclonal CD4+ T cell responses. J Exp Med. (2011) 208:81–90. doi: 10.1084/jem.20101574
44. Swartz EM, Holmes GM. Gastric vagal motoneuron function is maintained following experimental spinal cord injury. Neurogastroenterol Motil. (2014) 26:1717–29. doi: 10.1111/nmo.12452
45. Li M, Delos SE, Montross L, Garcea RL. Polyomavirus VP1 phosphorylation: coexpression with the VP2 capsid protein modulates VP1 phosphorylation in Sf9 insect cells. Proc Natl Acad Sci USA. (1995) 92:5992–6. doi: 10.1073/pnas.92.13.5992
46. Nelson JW, Sklenar J, Barnes AP, Minnier J. The START App: a web-based RNAseq analysis and visualization resource. Bioinformatics. (2017) 33:447–9. doi: 10.1093/bioinformatics/btw62
47. Kondo Y, Windrem MS, Zou L, Chandler-Militello D, Schanz SJ, Auvergne RM, et al. Human glial chimeric mice reveal astrocytic dependence of JC virus infection. J Clin Invest. (2014) 124:5323–36. doi: 10.1172/JCI76629
48. Goldman SA, Nedergaard M, Windrem MS. Modeling cognition and disease using human glial chimeric mice. Glia. (2015) 63:1483–93. doi: 10.1002/glia.22862
49. Shorter SK, Schnell FJ, Mcmaster SR, Pinelli DF, Andargachew R, Evavold BD. Viral escape mutant epitope maintains TCR affinity for antigen yet curtails CD8 T cell responses. PLoS ONE. (2016) 11:e0149582. doi: 10.1371/journal.pone.0149582
50. Maru S, Jin G, Schell TD, Lukacher AE. TCR stimulation strength is inversely associated with establishment of functional brain-resident memory CD8 T cells during persistent viral infection. PLoS Pathog. (2017) 13:e1006318. doi: 10.1371/journal.ppat.1006318
51. Marques CP, Cheeran MC, Palmquist JM, Hu S, Urban SL, Lokensgard JR. Prolonged microglial cell activation and lymphocyte infiltration following experimental herpes encephalitis. J Immunol. (2008) 181:6417–26. doi: 10.4049/jimmunol.181.9.6417
52. Ren X, Akiyoshi K, Vandenbark AA, Hurn PD, Offner H. Programmed death-1 pathway limits central nervous system inflammation and neurologic deficits in murine experimental stroke. Stroke. (2011) 42:2578–83. doi: 10.1161/STROKEAHA.111.613182
53. Prasad S, Hu S, Sheng WS, Chauhan P, Singh A, Lokensgard JR. The PD-1: PD-L1 pathway promotes development of brain-resident memory T cells following acute viral encephalitis. J Neuroinflammation. (2017) 14:82. doi: 10.1186/s12974-017-0860-3
54. Prasad S, Hu S, Sheng WS, Chauhan P, Lokensgard JR. Reactive glia promote development of CD103+ CD69+ CD8+ T-cells through programmed cell death-ligand 1 (PD-L1). Immun Inflamm Dis. (2018) 6:332–44. doi: 10.1002/iid3.221
55. Graham JB, Da Costa A, Lund JM. Regulatory T cells shape the resident memory T cell response to virus infection in the tissues. J Immunol. (2014) 192:683–90. doi: 10.4049/jimmunol.1202153
56. Topham DJ, Reilly EC. Tissue-resident memory CD8+ T cells: from phenotype to function. Front Immunol. (2018) 9:515. doi: 10.3389/fimmu.2018.00515
57. Wakim LM, Woodward-Davis A, Liu R, Hu Y, Villadangos J, Smyth G, et al. The molecular signature of tissue resident memory CD8 T cells isolated from the brain. J Immunol. (2012) 189:3462–71. doi: 10.4049/jimmunol.1201305
58. Steinbach K, Vincenti I, Kreutzfeldt M, Page N, Muschaweckh A, Wagner I, et al. Brain-resident memory T cells represent an autonomous cytotoxic barrier to viral infection. J Exp Med. (2016) 213:1571–87. doi: 10.1084/jem.20151916
59. Pavelko KD, Bell MP, Harrington SM, Dong H. B7-H1 influences the accumulation of virus-specific tissue resident memory T cells in the central nervous system. Front Immunol. (2017) 8:1532. doi: 10.3389/fimmu.2017.01532
60. Mockus TE, Shwetank L, auver MD, Ren HM, Netherby CS, Salameh T, Kawasawa YI, et al. CD4 T cells control development and maintenance of brain-resident CD8 T cells during polyomavirus infection. PLoS Pathog. (2018) 14:e1007365. doi: 10.1371/journal.ppat.1007365
61. Wakim LM, Woodward-Davis A, Bevan MJ. Memory T cells persisting within the brain after local infection show functional adaptations to their tissue of residence. Proc Natl Acad Sci USA. (2010) 107:17872–9. doi: 10.1073/pnas.1010201107
62. Thompson EA, Mitchell JS, Beura LK, Torres DJ, Mrass P, Pierson MJ, et al. Interstitial migration of CD8αβ T cells in the small intestine is dynamic and is dictated by environmental cues. Cell Rep. (2019). 26:2859–67. doi: 10.1016/j.celrep.2019.02.034
63. Bergsbaken T, Bevan MJ. Proinflammatory microenvironments within the intestine regulate the differentiation of tissue-resident CD8+ T cells responding to infection. Nat Immunol. (2015) 16:406–14. doi: 10.1038/ni.3108
64. Zhang N, Bevan MJ. Transforming growth factor-beta signaling controls the formation and maintenance of gut-resident memory T cells by regulating migration and retention. Immunity. (2013) 39:687–96. doi: 10.1016/j.immuni.2013.08.019
65. Mackay LK, Wynne-Jones E, Freestone D, Pellicci DG, Mielke LA, Newman DM, et al. T-box transcription factors combine with the cytokines TGF-β and IL-15 to control tissue-resident memory T cell fate. Immunity. (2015) 43:1101–11. doi: 10.1016/j.immuni.2015.11.008
66. Tian Y, Cox MA, Kahan SM, Ingram JT, Bakshi RK, Zajac AJ. A Context-dependent role for IL-21 in modulating the differentiation, distribution, and abundance of effector and memory CD8 T cell subsets. J Immunol. (2016) 196:2153–66. doi: 10.4049/jimmunol.1401236
67. Blackburn SD, Shin H, Haining WN, Zou T, Workman CJ, Polley A, et al. Coregulation of CD8+ T cell exhaustion by multiple inhibitory receptors during chronic viral infection. Nat Immunol. (2009) 10:29–37. doi: 10.1038/ni.1679
68. Magnus T, Schreiner B, Korn T, Jack C, Guo H, Antel J, et al. Microglial expression of the B7 family member B7 homolog 1 confers strong immune inhibition: implications for immune responses and autoimmunity in the CNS. J Neurosci. (2005) 25:2537–46. doi: 10.1523/JNEUROSCI.4794-04.2005
69. Lokensgard JR, Schachtele SJ, Mutnal MB, Sheng WS, Prasad S, Hu S. Chronic reactive gliosis following regulatory T cell depletion during acute MCMV encephalitis. Glia. (2015) 63:1982–96. doi: 10.1002/glia.22868
70. Taube JM, Anders RA, Young GD, Xu H, Sharma R, Mcmiller TL, et al. Colocalization of inflammatory response with B7-H1 expression in human melanocytic lesions supports an adaptive resistance mechanism of immune escape. Sci Transl Med. (2012) 4:127ra137. doi: 10.1126/scitranslmed.3003689
71. Koyama S, Akbay EA, Li YY, Herter-Sprie GS, Buczkowski KA, Richards WG, et al. Adaptive resistance to therapeutic PD-1 blockade is associated with upregulation of alternative immune checkpoints. Nat Commun. (2016) 7:10501. doi: 10.1038/ncomms10501
72. Pan W, Wu X, He Y, Hsuchou H, Huang EY, Mishra PK, et al. Brain interleukin-15 in neuroinflammation and behavior. Neurosci Biobehav Rev. (2013) 37:184–92. doi: 10.1016/j.neubiorev.2012.11.009
73. Mackay LK, Rahimpour A, Ma JZ, Collins N, Stock AT, Hafon ML, et al. The developmental pathway for CD103+ CD8+ tissue-resident memory T cells of skin. Nat Immunol. (2013) 14:1294–301. doi: 10.1038/ni.2744
74. Schenkel JM, Fraser KA, Casey KA, Beura LK, Pauken KE, Vezys V, et al. IL-15-independent maintenance of tissue-resident and boosted effector memory CD8 T cells. J Immunol. (2016) 196:3920–6. doi: 10.4049/jimmunol.1502337
75. Sowell RT, Goldufsky JW, Rogozinska M, Quiles Z, Cao Y, Castillo EF, et al. IL-15 complexes induce migration of resting memory CD8 T cells into mucosal tissues. J Immunol. (2017) 199:2536–46. doi: 10.4049/jimmunol.1501638
76. Strutt TM, Dhume K, Finn CM, Hwang JH, Castonguay C, Swain SL, et al. IL-15 supports the generation of protective lung-resident memory CD4 T cells. Mucosal Immunol. (2018) 11:668–80. doi: 10.1038/mi.2017.101
77. O'hara BA, Atwood WJ. Interferon β1-a and selective anti-5HT2a receptor antagonists inhibit infection of human glial cells by JC virus. Virus Res. (2008) 132:97–103. doi: 10.1016/j.virusres.2007.11.002
78. De-Simone FI, Sariyer R, Otalora YL, Yarandi S, Craigie M, Gordon J, et al. IFN-γ inhibits JC virus replication in glial cells by suppressing T-antigen expression. PLoS ONE. (2015) 10:e0129694. doi: 10.1371/journal.pone.0129694
79. Riddell LA, Pinching AJ, Hill S, Ng TT, Arbe E, Lapham GP, et al. A phase III study of recombinant human interferon gamma to prevent opportunistic infections in advanced HIV disease. AIDS Res Hum Retroviruses. (2001) 17:789–97. doi: 10.1089/088922201750251981
80. Kohlmeier JE, Cookenham T, Roberts AD, Miller SC, Woodland DL. Type I interferons regulate cytolytic activity of memory CD8+ T cells in the lung airways during respiratory virus challenge. Immunity. (2010) 33:96–105. doi: 10.1016/j.immuni.2010.06.016
81. Wilson JJ, Lin E, Pack CD, Frost EL, Hadley A, Swimm AI, et al. Gamma interferon controls mouse polyomavirus infection in vivo. J Virol. (2011) 85:10126–34. doi: 10.1128/JVI.00761-11
82. Qin Q, Shwetank FEL, Maru S, Lukacher AE. Type I interferons regulate the magnitude and functionality of mouse polyomavirus-specific CD8 T cells in a virus strain-dependent manner. J Virol. (2016) 90:5187–5199. doi: 10.1128/JVI.00199-16
83. Giacobbi NS, Gupta T, Coxon AT, Pipas JM. Polyomavirus T antigens activate an antiviral state. Virology. (2015) 476:377–85. doi: 10.1016/j.virol.2014.12.032
Keywords: viral encephalitis, tissue-resident memory, CD8 T cells, PD-1, PD-L1, mouse polyomavirus, neuroinflammation
Citation: Shwetank, Frost EL, Mockus TE, Ren HM, Toprak M, Lauver MD, Netherby-Winslow CS, Jin G, Cosby JM, Evavold BD and Lukacher AE (2019) PD-1 Dynamically Regulates Inflammation and Development of Brain-Resident Memory CD8 T Cells During Persistent Viral Encephalitis. Front. Immunol. 10:783. doi: 10.3389/fimmu.2019.00783
Received: 04 February 2019; Accepted: 25 March 2019;
Published: 17 April 2019.
Edited by:
Carl G. Feng, University of Sydney, AustraliaReviewed by:
James R. Lokensgard, University of Minnesota Twin Cities, United StatesIain Leslie Campbell, University of Sydney, Australia
Copyright © 2019 Shwetank, Frost, Mockus, Ren, Toprak, Lauver, Netherby-Winslow, Jin, Cosby, Evavold and Lukacher. This is an open-access article distributed under the terms of the Creative Commons Attribution License (CC BY). The use, distribution or reproduction in other forums is permitted, provided the original author(s) and the copyright owner(s) are credited and that the original publication in this journal is cited, in accordance with accepted academic practice. No use, distribution or reproduction is permitted which does not comply with these terms.
*Correspondence: Aron E. Lukacher, YWx1a2FjaGVyQHBlbm5zdGF0ZWhlYWx0aC5wc3UuZWR1
†These authors have contributed equally to this work
‡Present Address: Elizabeth L. Frost, Department of Neuroscience, Center for Brain Immunology and Glia, School of Medicine, University of Virginia, Charlottesville, VA, United States