 Paulo C. M. Urbano1
 Xuehui He1
 Bennie van Heeswijk1
 Omar P. S. Filho2
 Henk Tijssen1Ruben L. Smeets1
 Irma Joosten1
 Hans J. P. M. Koenen1*
- 1Laboratory Medical Immunology, Department of Laboratory Medicine, Radboud University Medical Center, Nijmegen, Netherlands
- 2Department of Biochemistry, Radboud University Medical Center, Nijmegen, Netherlands
Maintenance of regulatory T cells CD4+CD25highFOXP3+ (Treg) stability is vital for proper Treg function and controlling the immune equilibrium. Treg cells are heterogeneous and can reveal plasticity, exemplified by their potential to express IL-17A. TNFα-TNFR2 signaling controls IL-17A expression in conventional T cells via the anti-inflammatory ubiquitin-editing and kinase activity regulating enzyme TNFAIP3/A20 (tumor necrosis factor-alpha-induced protein 3). To obtain a molecular understanding of TNFα signaling on IL-17 expression in the human effector (effTreg, CD25highCD45RA−) Treg subset, we here studied the kinome activity regulation by TNFα signaling. Using FACS-sorted naïve (naïveTreg, CD25highCD45RA+) and effTreg subsets, we demonstrated a reciprocal relationship between TNFα and IL-17A expression; effTreg (TNFαlow/IL-17Ahigh) and naïveTreg (TNFαhigh/IL-17Alow). In effTreg, TNFα-TNFR2 signaling prevented IL-17A expression, whereas inhibition of TNFα signaling by clinically applied anti-TNF antibodies led to increased IL-17A expression. Inhibition of TNFα signaling led to reduced TNFAIP3 expression, which, by using siRNA inhibition of TNFAIP3, appeared causally linked to increased IL-17A expression in effTreg. Kinome activity screening of CD3/CD28-activated effTreg revealed that anti-TNF-mediated neutralization led to increased kinase activity. STRING association analysis revealed that the TNF suppression effTreg kinase activity network was strongly associated with kinases involved in TCR, JAK, MAPK, and PKC pathway signaling. Small-molecule-based inhibition of TCR and JAK pathways prevented the IL-17 expression in effTreg. Together, these findings stress the importance of TNF-TNFR2 in regulating the kinase architecture of antigen-activated effTreg and controlling IL-17 expression of the human Treg. These findings might be relevant for optimizing anti-TNF-based therapy and may aid in preventing Treg plasticity in case of Treg-based cell therapy.
Highlights
- Naïve and effector CD4+ regulatory T cells have a reciprocal IL-17A–TNFα relationship; effTreg (TNFlow/ IL-17Ahigh) and naïveTreg (TNFhigh/ IL-17Alow).
- TNFα-TNF receptor-2 signaling regulates IL-17A expression via ubiquitin-editing TNFAIP3/A20 protein in effTreg.
- TNFα suppresses T-cell receptor and Janus kinase protein activity and promotes IL-17A expression in effTreg.
- siRNA-mediated TNFAIP3 inhibition of effTreg, similar to TNFα signaling inhibition by anti-TNF treatment, leads to enhanced IL17A expression.
- TNFα signaling regulates the kinase architecture of antigen-activated effTreg.
Introduction
Regulatory CD4+CD25highFOXP3+ T cells (Treg) are essential for human immune homeostasis (1). Human Treg cells reveal heterogeneity and contain multiple cell subsets that are characterized by differential expression of maturation, activation, and migration markers (2). At birth, the majority of the Treg are naïve (3), while later in life, the frequencies of CD45RA− memory (effector) Treg increase at the expense of naïve Treg frequencies (4). Naïve (naïveTreg) and effector (effTreg) Treg have distinct transcriptional, proteomic, metabolic, as well as enhancer and promoter landscapes (5–7).
Effector Treg cells were shown to express pro-inflammatory cytokines such as the autoimmune associated pro-inflammatory cytokine IL-17A, but also naïve Treg was found to produce IL-17A albeit at lower frequencies (5, 8). IL-17A-producing Treg have been observed in human inflammatory diseases such as psoriasis and IBD, suggesting that they contribute to the inflammatory process as has been demonstrated in mouse models (9–14). Although some cues that regulate IL-17A expression by Treg have been identified, including mTOR inhibition (15), CD28 superagonist stimulation (16), and platelet microparticle interaction (17), our mechanistic understanding of IL-17A expression by Treg is limited, let alone that this information is available for naïve and effector Treg. Recently, it has been elucidated that TNFR2 signaling is vital to establish Treg stability by promoting FOXP3 expression and inhibiting secretion of pro-inflammatory cytokines like IL-17A and IFNγ (18, 19). In conventional CD4+ memory T cells, inhibition of TNFR2 signaling by anti-TNF led to reduced expression of the anti-inflammatory regulator tumor necrosis factor-alpha-induced protein 3 (TNFAIP3, also known as A20), and as a consequence, this resulted in increased IL-17A expression (20). TNFAIP3/A20 acts as a ubiquitin-editing enzyme that regulates multiple other signaling pathways such as IL-17R (21) signaling and kinase activity [e.g., PKC (22), TCR (23), and MAPK (24)].
TNF-TNFR2 signaling appears essential for human Treg expansion and proper function and additionally an autologous TNFα signaling feedback loop has been proposed that regulates IL-17A expression in human Treg (18, 19, 25–29). Anti-TNF therapy is successfully used for the treatment of severe chronic inflammatory diseases such as inflammatory bowel diseases, psoriasis, psoriatic arthritis, and rheumatoid arthritis (30–33). Paradoxically, it has been observed that in 0.6–5% of the patients treated with anti-TNF medication, this might unintentionally trigger specific forms of immune pathology, suggesting that inhibition of anti-TNF therapy affects Treg function (34–37). If and how naïve and effector Treg are affected by inhibition of TNFα is not known.
We hypothesize that TNFα signaling controls IL-17A expression in Treg by interfering at the level of kinase activity, which we here explored in effTreg. We demonstrate that inhibition of TNFα signaling by anti-TNF in vitro led to increased IL-17A expression. Down-regulation of the anti-inflammatory mediator TNFAIP3 played a role in this process. Comprehensive kinome analysis revealed that inhibition of TNFα signaling in effTreg unexpectedly led to an increase of a kinase activity network containing TCR-linked kinases and immune signaling pathway such as the JAK. Small-molecule-based inhibition of these pathways prevented the anti-TNF-induced IL-17A expression in effTreg.
Results
naïveTreg and effTreg Cells Reveal a Reciprocal IL-17A—TNFα Relationship
To investigate the link between TNFα and IL-17A expression in naïve and effector Treg, FACS-sorted naïveTreg (CD4+CD45RA+CD25+) and effTreg (CD4+CD45RA−CD25high) (Figure 1A) derived from healthy volunteers were stimulated with PMA plus ionomycin, and subsequently TNFA, IL17A, IL17F, and RORC (RORɤt) expression was accessed by RT-qPCR (Figure 1B). As compared to effTreg, naïveTreg expressed significantly lower levels of IL17A, IL17F, and RORC (p = 0.0005, p = 0.0093, and p = 0.0016, respectively), while TNFA expression was higher (p = 0.0002) (Figure 1B). Next, we compared the fold change in gene expression between the Treg subsets and observed a reciprocal gene expression signature for TNFA, IL17A, IL17F, and RORC (Figure 1C). Correlation analysis revealed a reciprocal relationship between TNFA and IL17A (r = −0.50), IL17F (r = −0.42), and RORC (r = −0.68) (Figure 1D). As expected, a strong positive correlation between IL17A/IL17F (r = 0.81), IL17A/RORC (r = 0.74), and IL17A/RORC (r = 0.54) was observed. The inverse relationship was also confirmed at the protein level upon PMA plus ionomycin stimulation (Figure 1E) or αCD3/CD28 stimulation of FACS-sorted Treg (Figure 1F). As compared to effTreg, naïveTreg hardly produced IL-17A, but showed an increased production of TNFα. Analysis of conventional T cells further supported the uniquely high production of IL-17A in these effTreg, as the numbers of IL-17A/FOXP3-positive cells in FACS-sorted naïve or memory CD4+CD25− T cells were very low (Figure S1).
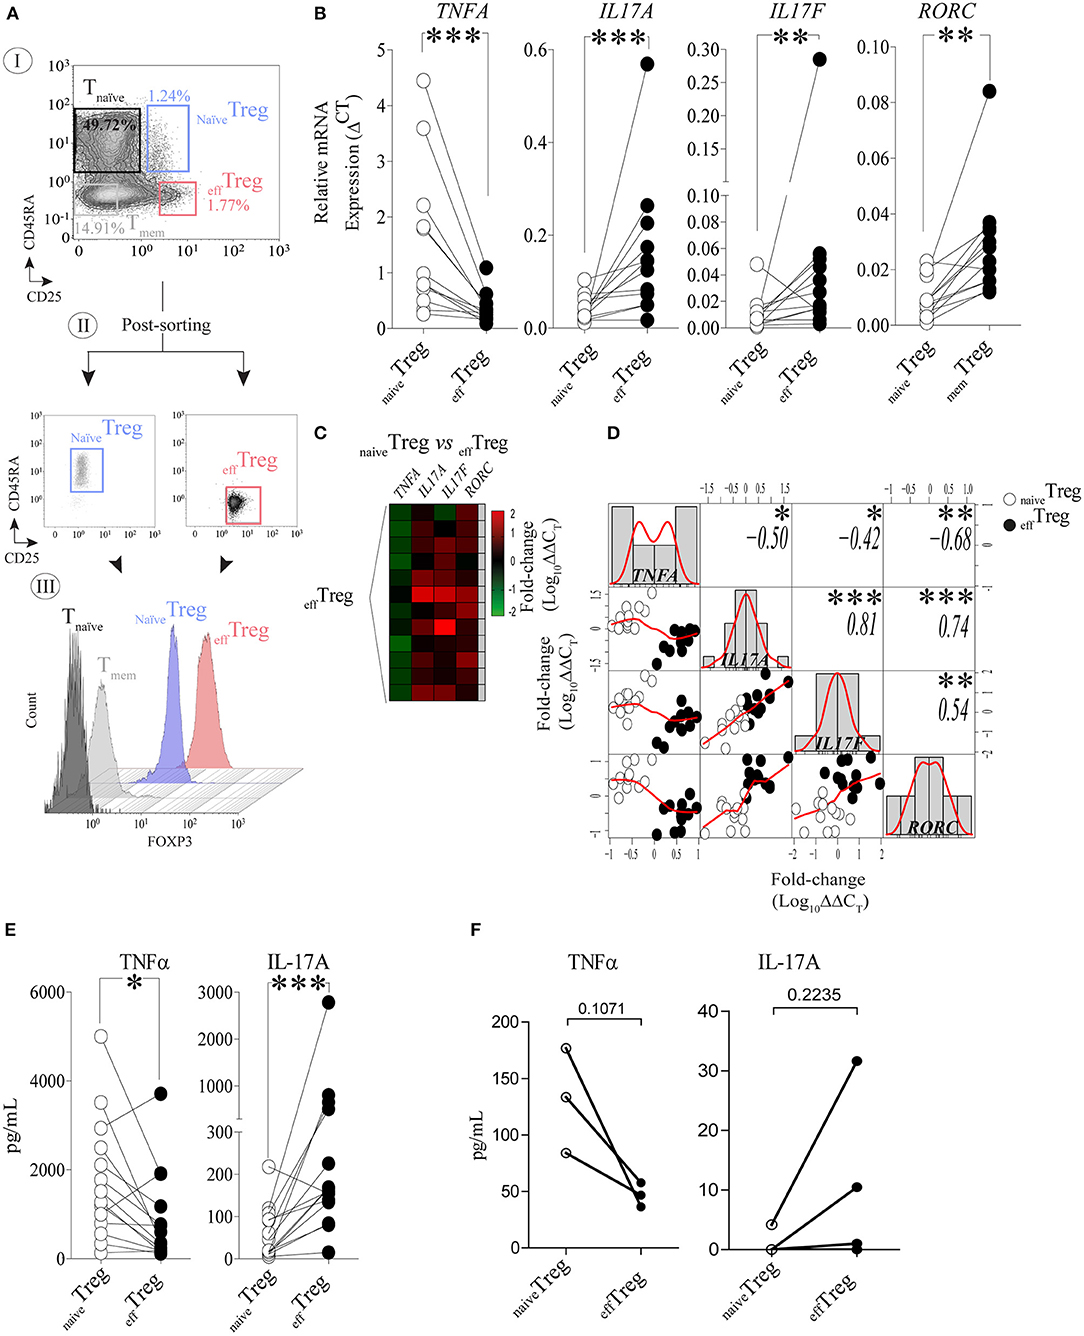
Figure 1. Reciprocal TNFα and IL-17A expression in human naïveTreg and effTreg cells. (A) An example of the FACS sorting strategy of naïveTreg and effTreg based on CD4, CD45RA, and CD25 expression (I. dotplots), post-sorting analysis (II. dotplots) and confirmation of FOXP3 expression in the sorted cell population (III. histograms). Conventional CD4+CD45RA−CD25− naïve T cells (Tnaïve), and CD4+CD45RA−CD25− memory T cells (Tmem) were sorted and displayed for comparison of FOXP3 expression levels (III). (B) RT-qPCR gene expression of TNFA, IL17A, IL17F, and RORC in naïveTreg and effTreg after 20 h of PMA and ionomycin stimulation (n = 12). (C) Heatmap displaying the fold change of transcripts expression in effTreg within different donors (rows). naïveTreg were used as reference to calculate the fold change. (D) Multiple correlation matrix depicting the correlation of gene expression in both Treg subsets (naïveTreg [open dots] and effTreg [closed dots]). Sample distribution (histogram) is shown, linear regression is also plotted (red lines), whereas p-value significance and r-values are displayed based on Pearson correlation test. Y and X axes depict the log10-fold change of TNFA, IL17A, IL17F, and RORC expression. Each column represents a gene; in every intersection (rows), we observe the correlation between genes. (E) Presence of the cytokines TNFα and IL-17A in culture supernatant after overnight stimulation of Treg subsets using PMA and ionomycin. Cytokines were measured using Luminex (n = 14). (F) Presence of TNFα and IL-17A in culture supernatants of αCD3/CD28/rhIL-2 activated Treg subsets after 5 days of culture (n = 3, mean ± SEM). For statistical analysis, Wilcoxon matched-pairs signed-ranks test (B,E), or two-way ANOVA followed by a Bonferroni post-hoc test (F) were used. *p < 0.05, **p < 0.01,***p < 0.001, ns, not significant.
TNFα-TNF Receptor-2 Signaling Regulates IL-17A Expression via Ubiquitin-Editing TNFAIP3/A20 Protein in Effector CD4+ Regulatory T Cells
Under the stimulation conditions mentioned above, effTreg, but not naïveTreg, demonstrated a clear capacity to produce IL-17A; therefore, we focused our further experiments primarily on effTreg. To analyze if TNFα signaling regulates IL-17A expression in effTreg, FACS-sorted effTreg were stimulated with αCD3/CD28-beads plus rhIL-2 and supplemented with either soluble recombinant human (rh)TNFα or the anti-TNFα agent etanercept (ETN, here referred to as anti-TNF), which is a fusion protein of TNF receptor 2 and IgG1 Fc, which neutralizes TNFα and prevents TNFα signaling. Supplementation of rhTNFα as compared to supplementation of anti-TNF, resulted in a significant reduction of IL-17A expressing FOXP3+ effTreg (p 3.19e-07) (Figure 2A). At the transcriptional level, we demonstrated that supplementation of rhTNFα suppressed IL-17A, IL-17F, and RORC gene expression in effTreg (Figure 2B). These data support the idea that TNFα signaling controls IL-17A expression in effTreg.
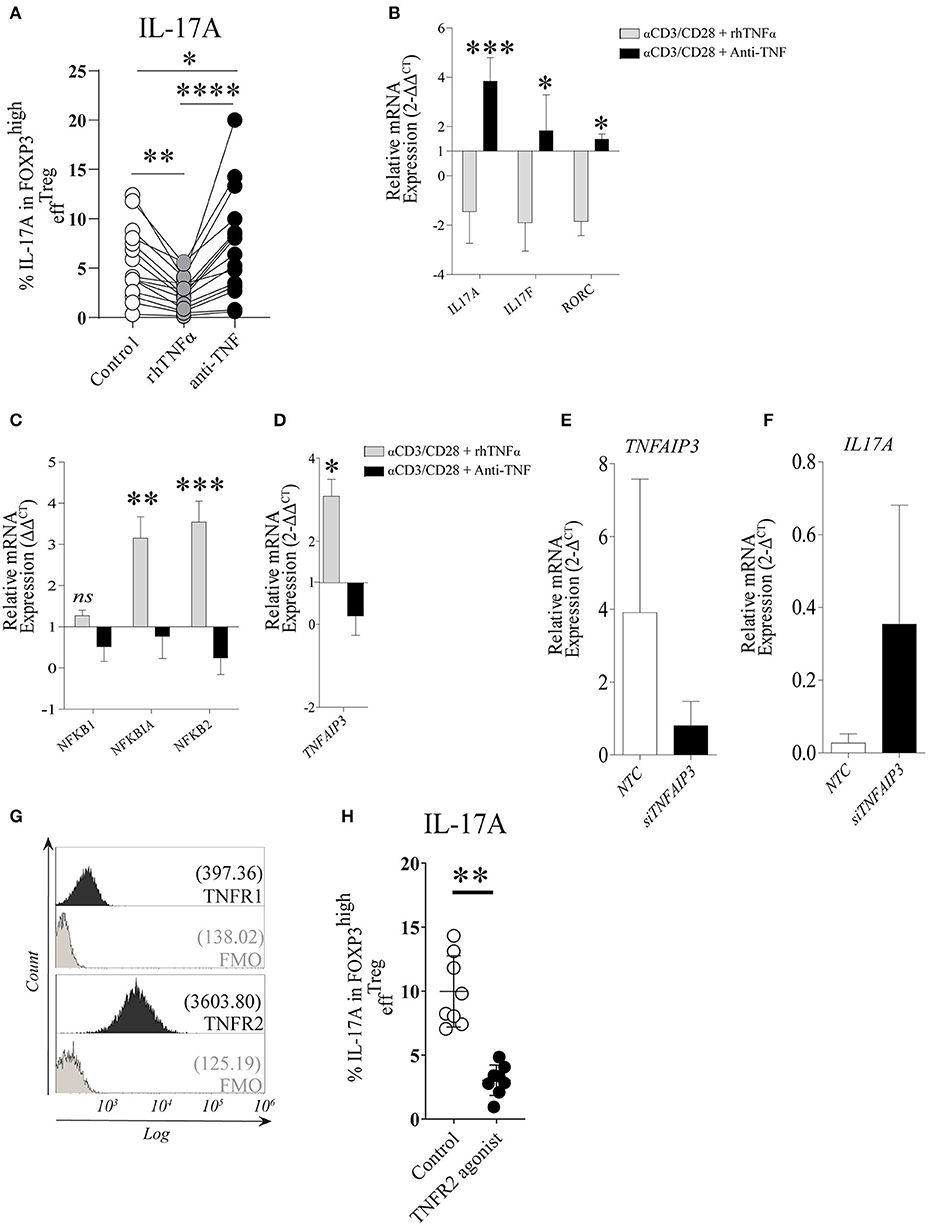
Figure 2. TNFα-TNFR2 signaling reduces IL-17A expression in activated effTreg, conceivably via the anti-inflammatory regulator TNFAIP3/A20. (A) Flow cytometry of intracellular IL-17A expression in FOXP3high effTreg that were stimulated with αCD3/CD28/rhIL-2 for 5 days in the absence or presence of rhTNFα or anti-TNF (n = 15). (B) RT-qPCR gene expression of IL-17A, IL-17F, and RORC, (C) NFκB target genes NFKB1, NFKB1A, NFKB2 (n = 5), and (D) TNFAIP3 (n = 8) at day 4 of culture. (E,F) TNFAIP3 and IL-17A gene expression of non-targeting-gene control (NTC) and siTNFAIP3 effTreg after 6 days under αCD3/CD28/rhIL-2 stimulation (n = 3). (G) Histogram depicting the expression of TNFR1 and TNFR2 on effTreg directly after FACS sorting (n = 9). (H) Flow cytometry of IL-17A expression in FOXP3high effTreg that were stimulated with αCD3/CD28 beads plus rhIL-2 with or without TNFR2 agonist for 5 days (n = 9). All data are shown as mean ± SEM. For statistical analysis, a Friedman test followed by Dunn's multiple comparison test (A), a two-way ANOVA followed by a Bonferroni posttest (B,C), and a Wilcoxon matched-pairs signed-rank test (D,G,H) were used. *p < 0.05, **p < 0.01,***p < 0.001, ****p < 0.0001, ns, not significant.
TNFα binding to its receptors (TNFR1 and TNFR2) leads to a cascade of intracellular events that culminate in NFκB translocation to the nucleus and subsequent transcription of NFκB target genes NFKBIA (encode Iκβα), NFKB1 (encode p50), and NFKB2 (encode p52) (38, 39). Therefore, we analyzed the effect on the expression of NFκB target genes in effTreg after αCD3/CD28 stimulation with and without supplementation of rhTNFα or anti-TNF. Supplementation with rhTNFα led to a significant increase of NFKBIA and NFKB2 expression, indicating that TNFα signaling promotes the expression of NFκB target genes, an indication of NFκB activation during Treg activation, while anti-TNF suppressed the NFκB pathway (Figure 2C). We previously found that TNFα signaling enhanced TNFAIP3 (tumor necrosis factor-induced protein 3) expression in conventional T cells (20). TNFAIP3 encodes the ubiquitin-editing enzyme A20, which in turn regulates NFκB activity. Here, we also observed that TNFα signaling regulated TNFAIP3 expression in effTreg (Figure 2D). To demonstrate causality between suppression of TNFAIP3 and enhanced expression of IL-17A, we carried out a small interfering RNA assay (siRNA) to inhibit TNFAIP3 transcription. siRNA-mediated TNFAIP3 inhibition of effTreg, similar to TNFα signaling inhibition by anti-TNF treatment, led to enhanced IL-17A gene expression (Figures 2E,F).
As TNFα can bind to both TNFR1 and TNFR2, we measured the expression of these receptors on freshly isolated effTreg and demonstrated that they expressed TNFR2, but TNFR1 was hardly detected (Figure 2G). The latter agrees with previous studies (20, 40) and suggests that TNFα-mediated regulation of IL-17A expression in effTreg might be primarily mediated via the TNFR2. To examine this, αCD3/CD28-stimulated effTreg were cultured in the absence and presence of a specific TNFR2 agonist for 5 days. TNFR2 agonist stimulation led to a reduction in the percentages of IL-17A expressing FOXP3+ cells (Figure 2H). This indicates that IL-17A expression in effTreg subsets is regulated via TNFα-TNFR2 signaling. Together, these data suggest that TNFα signaling via TNFR2 promotes the expression of the anti-inflammatory mediator TNFAIP3/A20, which seems to prevent IL-17A expression in regulatory T cells, as ablation of TNFα signaling suppresses TNFAIP3/A20 and results in increased IL-17A expression in human Treg.
TNFα Suppresses T-Cell Receptor and Janus Kinase Protein Activity and Regulates IL-17A Expression in Effector Regulatory T Cells
TNFAIP3/A20 has been demonstrated to regulate critical proteins involved in TCR (23), TNFα (41), IL-17R (21), and Wnt signaling (20, 42). Recently, we demonstrated that the prevention of TNFα signaling in conventional CD4+ memory T cells leads to inhibition of TNFAIP3/A20 expression, which subsequently leads to enhanced IL-17A expression (20). TNFAIP3/A20 has been shown to regulate kinase activity (21, 23). To better understand kinase regulation by TNFα signaling in effTreg, we here profiled the activity of ~300 kinases in FACS-sorted effTreg following stimulation with αCD3/CD28 beads in the absence or presence of anti-TNF or rhTNFα. Subsequently, we analyzed the threonine/serine and tyrosine kinase activity using a multiplex human kinase activity array. This kinome array employs ~300 peptide substrates with known phosphorylation sites and provides a reliable and high-throughput kinase profiling tool for further pathway elucidation (see Materials and Methods) (43). We found 30 unique and differentially activated kinases following anti-TNF vs. rhTNFα supplementation comparison (Figure S2). For the kinase activity profiling, we focused on the two most extreme states of TNF pathway signaling and addressed the differential kinase activity profile following effTreg activation following TNF vs. anti-TNF supplementation. The obtained kinome data were visualized using a volcano plot that shows the fold change of kinase activity and the associated level of significance (p-values) (Figure 3A, left panel; raw data Table S1). We found that inhibition of TNFα signaling, as compared to the supplementation of rhTNFα, in activated effTreg significantly promoted the activity of multiple kinases (red symbols indicate p < 0.05). The ranked log2-fold changes of kinase activity are shown in the right panel of Figure 3A. Notably, several of the kinases were related to TCR signaling [CD3ζ (CD247), CD3ε, ZAP70, and Lck] (44). Also, cell cycle regulating (CALM, CD28, GSK3B, MAPK3, PGR, and JAK3) (45, 46) and apoptosis (ANXA2, Annexin V) (47)-related kinases were induced.
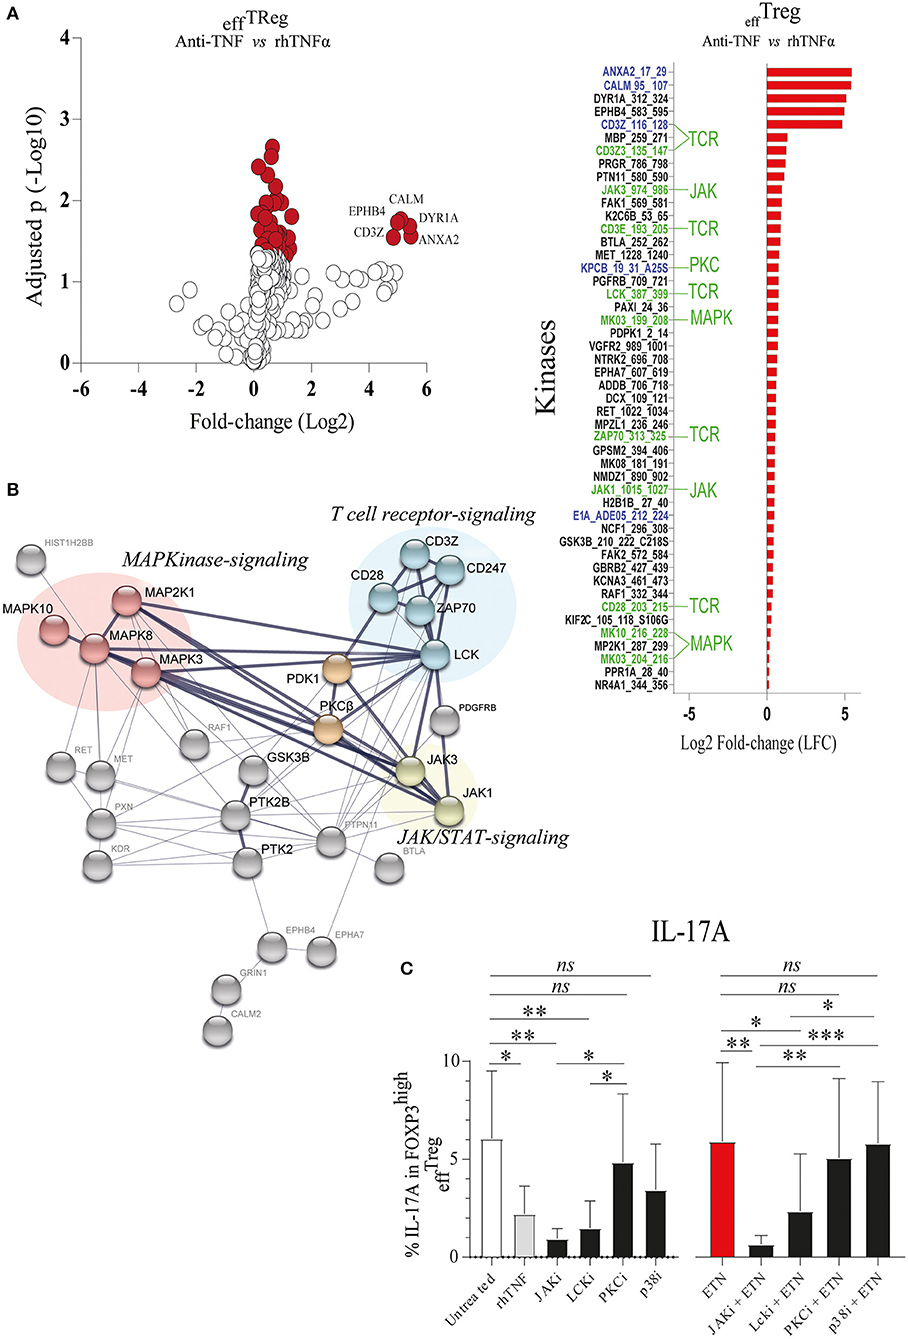
Figure 3. TNFα signaling in effTreg suppresses TCR and JAK kinase activity, leading to regulation of IL-17A expression. effTreg were stimulated with αCD3/CD28 beads and rh-IL-2 in the presence of rhTNFα or anti-TNF. On day 4, phosphoserine/threonine kinase (STK) and phosphotyrosine kinase (PTK) activity of cells were Analyzed using a kinome activity array. (A) Left panel: Volcano plot showing the fold change in kinase activity and adjusted p-values (red symbols, p < 0.05; n = 4) in STK and PTK kinase activity. Right panel: Fold change in the kinases identified by comparing anti-TNF with rhTNFα conditions. Of note, TNFα was used as reference to calculate the fold change. Green texts indicate unique kinases that show increased activity upon comparison of anti-TNF to rhTNFα conditions; Blue texts represent kinases with enhanced activity upon comparison of comparing anti-TNF to the control (αCD3/CD28 stimulated without rhTNF or anti-TNF). (B) Cumulative STRING© protein network analysis based on the identified kinases listed in (A). (C) Flow cytometry of intracellular IL-17A expression in FOXP3high effTreg. Pathway inhibition validation assays applying small chemical molecules in the stimulation assay as described above (mean ± SEM, n = 7). JAKi, JAK inhibitor (tofacitinib); Lcki, Lck inhibitor (A420983); PKCi, PKC inhibitor (AEB071); and p38i, p38MAPK inhibitor (UR13870). ANOVA Dunnett's testing (A) and Friedman test followed by Dunn's multiple comparisons test (C) were used. *p < 0.05, **p < 0.001, ***p 0.0001, ns, not significant.
To obtain a more comprehensive understanding of the kinase network and cellular pathways regulated by neutralization of TNFα, the kinases that were significantly activated following anti-TNF mAb treatment were analyzed using STRING (Search Tool for the Retrieval of Interacting Genes/Proteins). STRING is a web-based biological resource (https://string-db.org) of known and predicted protein–protein interactions enabling prediction of the functional protein association network of a group of given proteins by estimating the likelihood of meaningful biological interactions (48). In our analysis, we used the highest confidence interaction score (0.900) to associate all kinases that were significantly activated following anti-TNF treatment as listed in the right panel of Figure 3A. STRING association analysis demonstrated that inhibition of TNFα signaling in activated effTreg involved prominent immune signaling pathways such as the PKC, p38-MAPK, and JAK pathways, which were all linked to TCR signaling [CD3ζ (CD247) and CD3ε] (Figure 3B). Previously, these pathways were shown to be associated with the induction of IL-17A expression (49–52).
To validate if the predicted pathways were indeed involved in rhTNFα-induced suppression of IL-17A expression in effTreg, FACS-sorted effTreg were activated in the presence or absence of anti-TNF and specific kinase inhibitors of JAK/STAT (Tofacitinib), PKC (AEB071, Sotrastaurin), or p38 MAPK (UR13870). For the inhibition of TCR signaling, an Lck inhibitor (A420983) was applied. We demonstrated that suppression of JAK, and Lck kinases, but not PKC and p38, prevented the expression of IL-17A expression in effTreg that were activated under TNFα signaling inhibiting or not (Figure 3C). In fact, suppression of JAK and Lck inhibited the expression of IL-17 similar to the TNF supplementation condition. The inhibitors tested did not affect FOXP3 expression (Figure S3).
Next, we performed a functional ontology enrichment analysis of the most significant biological process networks, processes, and diseases by submitting the kinase data that we identified in activated effTreg following supplementation vs. inhibition of TNFα to MetaCore™ database analysis. Significant enriched MetaCore™ GO process networks involved immune response-TCR signaling, cell cycle regulation, and lymphocyte proliferation (Figure 4A). The most significantly enriched MetaCore™ Go processes based on the submitted kinases were kinase signaling pathways via transmembrane receptor protein tyrosine, signal transduction processes, and tyrosine phosphorylation and modification (Figure 4B). Furthermore, there was an enrichment of cell communication and cell development processes. MetaCore™ Go diseases indicated a strong enrichment of autoimmune disease, next to other pathological conditions ranging from the nervous system, nutritional, and metabolic disorders (Figure 4C). Together, these data demonstrated that CD3 and CD28 activation of effTreg in the absence of TNF-signaling by anti-TNF treatment promotes tyrosine kinase activity of relevant TCR-associated signaling pathways.
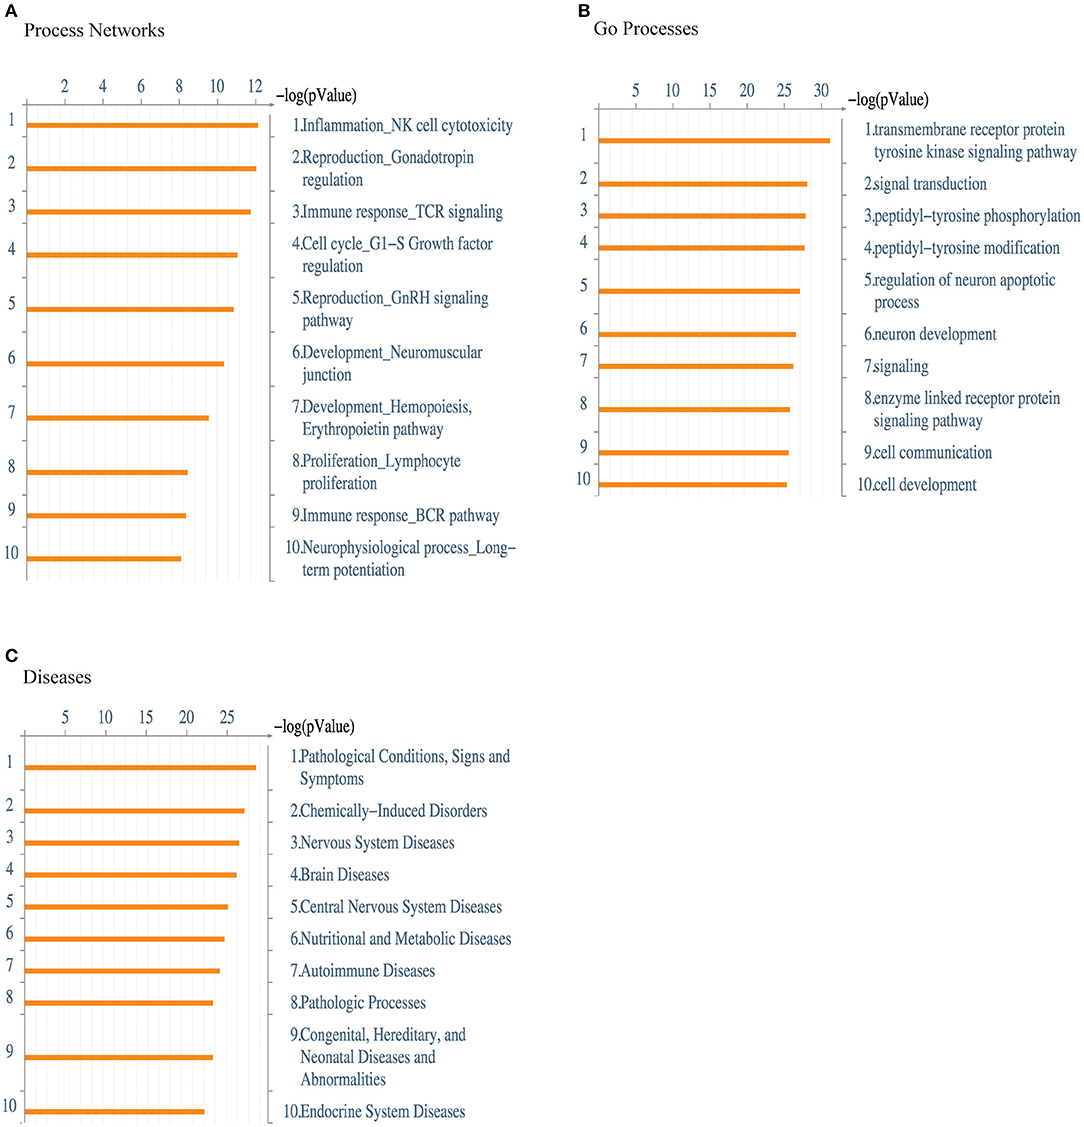
Figure 4. Enrichment analysis of the kinome array data. Functional ontology enrichment analysis using the MetaCore™ database reveals (A) the distinct biological networks, (B) the different biological processes, and (C) various diseases related to kinases identified in Figure 3. The probability of a random intersection between the set of kinases with ontology entities was estimated with the “p” value of the hypergeometric intersection. A lower “p” value means higher relevance of the entity to the dataset, which appears in higher rating for the entity.
Discussion
Human Treg can express the pro-inflammatory cytokine IL-17A under specific conditions; a phenomenon referred to as Treg plasticity (5, 8). The molecular mechanisms regulating this phenomenon are not well-understood. In our current work, we demonstrate that TNFα signaling regulates IL-17A expression in effTreg by controlling a kinase activity network that includes TCR linked kinases and other prominent immune signaling kinase pathways such as the JAK pathway. Also, TNFα-mediated regulation of the anti-inflammatory mediator TNFAIP3/A20 appeared crucial to control IL-17A expression by effTreg. TNFR2 is the main receptor for TNFα signaling in Treg. TNFR2 stimulation has been demonstrated to support Treg stability (18, 19, 25, 53), whereas the effect of TNF signaling on the stability of Treg is ambiguous (54, 55). Here, we show that TNFR2 is highly expressed on human effTreg, and TNF-TNFR2 signaling in effTreg acts as a negative regulator of IL-17A expression by controlling TCR and JAK signaling.
STRING association analysis revealed that inhibition of TNFα signaling is associated with increased TCR associated signaling of CD3ζ, CD3ε, ZAP70, and Lck, indicating that TNFα signaling in effTreg functions as a rheostat of TCR signal transmission. Although information of TNFα stimulation on the TCR signaling in Treg is lacking, it has been shown in CD4+ T cells of both mice and man that TNFα stimulation results in specific down-regulation of TCRζ expression and impaired TCR/CD3 signaling, including phosphorylation of the TCRζ, CD3ε, ZAP-70 tyrosine kinase, and linker for activation of T cells (LAT) (56). TCR signaling is essential for both effector and regulatory T cells (57). Treg have a more extensive TCR repertoire than effector T cells, and TCR signaling is crucial for proper Treg function (58–61). Signaling via the T cell antigen receptor of Treg is critical for FOXP3 expression and their suppressive activity. Mutations resulting in signaling-deficient TCRζ chains led to increased Treg numbers with higher suppressive activity (62–64). Reduced TCR signaling will alleviate downstream signaling and favor Treg cell lineage commitment. TNFα signaling, as we demonstrate here, seems to safeguard TCR-related kinase activity in effTreg and stabilize Treg function as illustrated by preventing IL-17A expression. Note that anti-TNF had a mild effect on the induction of IL-17A expression in effTreg, which is in contrast to its clear induction of IL-17A in conventional memory T cells (20). This phenomenon may be caused by the poor intrinsic capacity of effTreg to produce TNFα in vitro. In fact, highly pure FACS-sorted effTreg barely produced TNFα (41.35 pg/ml ± 6.75), whereas memory conventional T cells produced significantly higher levels (335.7 pg/ml ± 65.33, n = 4) (data not shown).
Next to TCR-derived signals, Treg integrates inputs from cytokine, chemotactic, and metabolic cues to fulfill their function optimally. Proximal cytokine signaling often takes place via JAK-STAT signaling (65). IL-17A gene transcription is associated with JAK-STAT3 signaling (66). Inhibition of TNFα signaling using anti-TNF inhibitor ETN was associated with increased JAK1 and JAK3 kinase activity in αCD3/CD28 stimulated effTreg. Inhibition of JAK1 and JAK3 kinase activity by the clinically applied JAK inhibitor tofacitinib prevented IL-17A expression in anti-TNF-treated effTreg, suggesting that TNFα signaling is involved in driving JAK/STAT signaling. Although TNFα is not a prototypic JAK/STAT activating cytokine, the anti-inflammatory molecule A20 (encoded by TNFAIP3) that is a downstream target of TNFα signaling acts as a regulator of STAT (67, 68). The absence of A20 in myeloid cells resulted in enhanced STAT1-dependent inflammation (68). This relationship needs to be confirmed in effTreg.
Although anti-TNF therapy is improving the life quality of many patients with chronic inflammatory diseases, 10–20% of patients do not respond to the treatment while 0.6–5% of patients treated with TNF inhibitors reveal paradoxical immune-mediated inflammatory side effects (36, 37). Although the mechanism of the latter phenomenon is not fully understood, it might be of interest to consider an additional JAK inhibitor treatment such as tofacitinib or other JAK inhibitors to prevent the putative IL-17A expression by Treg. Also, regarding Treg-based immune therapy in transplantation or autoimmunity, the clinical design has started to consider strategies to minimize the risks of Treg plasticity (69) at the time of ex vivo production and following in vivo administration (70, 71). Our results suggests that TNFα-TNFR2 signaling or inhibition of JAK signaling might favor Treg stability. Along with this line of reasoning, it has been demonstrated that JAK inhibition (72) as well as TNFR2 stimulation (18, 19) support human Treg function and prevent Treg plasticity.
In conclusion, we demonstrated an inverse production of TNFα and IL-17A between human naïve and effector Treg cells. Supplementation of rhTNFα led to a down-regulation in the frequency of IL-17A-producing effTreg, mainly via the activation of NFkB pathway as well as the up-regulation of TNFAIP3/A20 expression. TNFR2 receptor seems to play a crucial role since we hardly detected any expression of TNFR1 on effTreg and treatment of effTreg with TNFR2 specific agonist resulted in a similar inhibition of IL-17A production. Accordingly, inhibition of TNFα signaling using the clinically applied anti-TNF inhibitor ETN led to decreased TNFAIP3 and increased IL-17A expression, a phenomenon similar to what is observed in human conventional memory CD4+ T cells. Kinome activity screening of αCD3/CD28 stimulated effTreg revealed that anti-TNF led to an increase in kinase activity of multiple kinases including CD3ζ (CD247) and LcK. A functional ontology enrichment analysis indicated that these kinases were highly associated with different immune response signaling pathways including TCR-, JAK-mediated pathways. We propose that these findings might be relevant for optimizing anti-TNF-based therapy and may aid in preventing Treg plasticity in case of Treg-based cell therapy.
Materials and Methods
Study Approval
The protocols of this study were performed in agreement with the Declaration of Helsinki and in accordance with the Radboud university medical center (Radboudumc) in Nijmegen, the Netherlands.
Subjects
Blood buffy coats from voluntary donors were purchased from the Sanquin Blood Bank, Nijmegen, the Netherlands. The volunteers gave written informed consent.
Regulatory T Cell Isolation
CD4+ T cells were isolated using RosetteSep™ Human CD4+ T cell enrichment cocktail 25–50 μl of cocktail/ml of blood (StemCell Technologies, Vancouver, Canada) according to the instructions of the supplier. To sort CD4+CD25+CD45RA+ (naïveTreg) and CD4+CD25highCD45RA− (effTreg), the purified CD4+ cells were washed and stained with anti-CD25-BV510 (M-A251, BD, New Jersey, USA), anti-CD45RA− PE (4KB5, Dako, Brüsseler Straße, Germany), CD4-PE-Cy5.5 (13B8.2, Beckman-Coulter, California, United States), and FACS-sorted on a FACSAria™ III machine (BD Biosciences, New Jersey, United States). The gating strategy during FACS sorting, post-sorting purity analysis, and confirmation of FOXP3 expression in freshly sorted cell subsets are described in Figure 1A. The purity of the sorted cell populations was 95.3 ± 4.1% (mean ± SD).
Cell Culture
RPMI-1640 Dutch modified (Gibco, Massachusetts, United States) culture medium, containing sodium bicarbonate and 20 mM HEPES, supplemented with penicillin/streptomycin (100 U/ml), sodium pyruvate (1 mM), glutamine/glutamax, and 10% human pooled serum (HPS, Radboudumc), was used in all experiments. After cell isolation, 2.5 × 10⁴ cells/well were cultured in 96-well U-bottom plates and stimulated with Dynabeads® Human T-Activator CD3/CD28 (αCD3/CD28 beads, 1:5 of bead:cell ratio) (Gibco, Massachusetts, United States) in the presence of recombinant human (rh) IL-2 (rhIL-2, 100 U/ml) (Proleukin Prometheus Laboratories, California, United States). In some conditions, cultures were supplemented with rhTNFα (50 ng/ml, R&D, Minnesota, United States), or TNFα inhibitors etanercept (5 μg/ml; ETN—Enbrel, Pfizer, New York, United States), or TNFR2 agonist (2.5 μg/ml, Clone MR2-1, Hycult Biotech, Uden, the Netherlands). To examine the effect of a pharmaceutical inhibitor, tofacitinib (0.112 μM, Pfizer, New York, United States), PKC inhibitor Sotrastaurin (1 μM), Lck inhibitor A420983 (1 μM), or p38α/β kinase inhibitor UR13870 (10 μM) was pre-incubated with the FACS-sorted cells for 30 min before the addition of any stimulus. In some cases, cells were stimulated with PMA (12.5 ng/ml) and ionomycin (500 ng/ml) for 20 h.
Flow Cytometry
Flow cytometry was performed using a 10-color Navios Flow cytometer (Beckman Coulter, California, United States), which is equipped with blue (488 nm), red (638 nm), and violet (405 nm) lasers. For surface staining, the following antibodies were used: anti-CD3-ECD (UCHT1), anti-CD45RA-ECD (2H4LDH11LDB9), anti-CD45-KO (J33), anti-CD4-PE-Cy5.5 (13B8.2), and anti-CD8-APC-AF700 (B9.11) (all from Beckman-Coulter); anti-TNFR1-AF488 (16803, R&D); and anti-TNFR2-APC (22235, R&D). For intracellular staining, the following antibodies were used: anti-IFNγ-PE-Cy7 (4S.B3) and anti-IL-17A-AF-660 (eBio64DEC17) (eBioscience, California, United States). Unstained (Fluorescence Minus One, FMO) samples were also measured to help set the gates during data analysis. To evaluate cytokine production, we challenged the cultured Treg subsets for another 4 h with PMA (12.5 ng/ml), ionomycin (500 ng/ml), and Brefeldin A (5 μg/ml) (Sigma-Aldrich, Missouri, United States) before performing the FACS staining process. Briefly, cells were stained with the fixable viability dye-eFluo 780 (FVD, eBioscience) for 30 min at 4°C, following with surface mAb staining, cell fixation, and permeabilization by using the Intracellular Fixation & Permeabilization Buffer Set (eBioscience) and intracellular mAb staining. For flow cytometry data analysis, Kaluza1.5 software (Beckman Coulter) was used.
Small Interfering RNA Transfection
For small interfering RNA (siRNA) knockdown of TNFAIP3, Accell SMARTpool siRNA (Dharmacon, Colorado, United States) was used according to the manufacturer's instructions. Briefly, 1 × 10⁵ effTreg cells per well were stimulated with αCD3/CD28 beads (1:5 of bead:cell ratio) in Accell Delivery Medium (Dharmacon) supplemented with rhIL-2 (100 U/ml) and incubated with 1 mmol cyclophilin B siRNA (positive control), or 1 mmol non-targeting control siRNA, or 1 mmol TNFAIP3 siRNA for 120 h (for siRNA sequences, see Table S2). Quantitative real-time PCR (RT-qPCR) was performed to confirm the knockdown of the target gene expression.
RT-qPCR
Total RNA was extracted by using the RNeasy Plus Micro Kit (Qiagen) followed by cDNA synthesis using the SuperScript III First-Strand Synthesis System and Oligo(dT)20 primer (Thermo Fisher Scientific, Massachusetts, United States). TaqMan gene expression assays were purchased from Thermo Fisher Scientific (Table S3). RT-PCR was acquired in a 7500 Real-Time PCR System (Applied Biosystems). RT-qPCR cycle values (CT) obtained for specific mRNA expression in each sample were normalized to the CT values of human HPRT1 (endogenous control), resulting in ΔCT values (log ratio of the gene concentrations) that were used to calculate the relative gene expression.
Then, we performed an exponential conversion of ΔCT, namely, 2−ΔCT using the following formula:
2−ΔCT representing the relative gene expression was used in Figures 1B,E,F.
effTreg stimulated in the absence of anti-TNF or rhTNFα were used as a baseline to calculate the relative gene expression in fold change (ΔΔCT) for effTreg stimulated in the presence of rhTNFα vs. ETN treatment.
Subsequently, we performed an exponential conversion of ΔΔCT, namely, 2−ΔΔCT using the following formula:
2−ΔΔCT representing the relative gene expression in fold change was employed for Figures 2B–D. In Figures 1C,D, log10 ΔΔCT was employed. The Relative Quantification app (Thermo Fisher Scientific cloud) was used for data analysis.
Measurement of Cytokines Secretion
The cell culture supernatants were analyzed for the presence of IL-17A, IFNγ, and TNFα using Bio-Plex Pro Human Th17 Cytokine Assays (Bio-Rad, California, United States) according to the manufacturer's instruction. The cytokine concentrations were measured using a Luminex100 machine (Luminex Corp., Texas, United States). The lowest limit of detection was <1.870 pg/ml for IL-17A, <2.411 pg/ml for IFNγ, and <2.231 pg/ml for TNFα.
Protein Kinase Chip Assay
After sorting and stimulations of cells, samples were frozen for further analysis. The protein isolation was performed according to the manufacturer's instruction (P1160, PamGene International B.V., 's-Hertogenbosch, the Netherlands). Kinase activity was measured with PamGene's Protein Tyrosine Kinase (PTK) PamChip (Cat. number 86402) and Serine Threonine kinase (STK) PamChip (Cat. number 87102). Each PTK PamChip array contains 196 peptides immobilized on a porous membrane, whereas each STK PamChip array contains 144 peptides (see the full list of peptides at www.pamgene.com). The peptide sequences (13 amino acids long) harbor phosphorylation sites, defined based on literature or derived from computational predictions and are correlated with one or multiple upstream kinases. A fluorescently labeled anti-phospho-Tyr antibody (PY20) is used to detect the phosphorylation activity of tyrosine kinases present in the sample. For the STK assay, an antibody mix is used to detect the phosphorylated Ser/Thr, and the 2nd FITC-conjugated antibody is used in a detection mix to quantify the phosphorylation signal. BioNavigator software 6.3 (PamGene) was used to determine signal intensities, peptide quality control (QC) and preselection (phosphorylation kinetics, or increase in signal over time, in 25% of the arrays analyzed), Log 2 transformation, ANOVA-Dunnett's testing, and data visualization. Mapping and pathway elucidation analysis were performed using METACORE™ (Clarivate Analytics, PA, USA) and STRING (73). As described by the GeneGo manufacturer's report, the analysis consists in matching the protein IDs of possible targets for the “common,” “similar,” and “unique” sets with protein IDs in functional ontologies in MetaCore (73). The lower p-value means a higher relevance of the entity to the dataset, which shows a higher rating for the entity.
Statistics
Statistical analysis was performed using GraphPad Prism 5.0 for Windows (GraphPad Software, San Diego, California, USA) and R. For experiments with more than two groups of matched samples, we used non-parametric Friedman test followed by Dunn's Multiple Comparison Test, whereas for experiments with only two groups of matched samples, we employed non-parametric Wilcoxon matched-pairs signed-rank test.
Data Availability Statement
The datasets generated for this study are available on request to the corresponding author.
Ethics Statement
The studies involving human participants were reviewed and approved by the Radboud university medical center (Radboudumc) in Nijmegen, the Netherlands. The patients/participants provided their written informed consent to participate in this study.
Author Contributions
PU, IJ, and HK designed the research. PU, OF, XH, HT, and BH performed the experiments. PU, OF, IJ, BH, XH, RS, and HK analyzed the data. PU, XH, IJ, and HK prepared and wrote the final manuscript. All the authors reviewed the paper.
Conflict of Interest
The authors declare that the research was conducted in the absence of any commercial or financial relationships that could be construed as a potential conflict of interest.
Acknowledgments
PU and OF were supported by a scholarship provided by the Brazilian mobility program Science Without Borders. We thank PAMgene especially Rob Ruijtenbeek and Dirk Pijnenburg for supporting the kinome analysis. We also thank Roslyn Kemp from the University of Otago, Department of Microbiology and Immunology, who helped review the manuscript.
Supplementary Material
The Supplementary Material for this article can be found online at: https://www.frontiersin.org/articles/10.3389/fimmu.2019.03047/full#supplementary-material
Figure S1. Expression of IL-17A in Conventional and regulatory T cells. Sorted naïve T cells (CD4+CD45RA+CD25−), memory T cells (CD4+CD45RA−CD25−), naïve Treg (CD4+CD45RA+CD25low) and effector Treg (CD4+CD45RA−CD25high) were stimulated with anti-CD3/CD28 bead plus rhIL-2. Cells were harvested on day 5 and intracellular FOXP3 and IL-17A expression were detected by FACS staining.
Figure S2. Kinome data analysis. Kinase activity of effTreg following αCD3/CD28 bead plus rhIL-2 activation in the absence or presence of anti-TNF or rhTNFα. Significant changes of kinase activities are presented in a Venn diagram (A, left panel) and a bar plot that ranked based on the log2 fold-change of kinase activities. (B,C) Bar graphs showing significant changes of kinase activity between anti-TNF and αCD3/CD28 control (B) or rhTNF and αCD3/CD28 control (C).
Figure S3. The Janus kinase, Lck, PKC and p38 MAPK inhibitors do not affect FOXP3 expression in effTreg. effTreg were stimulated with αCD3/CD28 beads in the presence or absence of rhTNFα or anti-TNF or small chemical molecules such as JAK inhibitor (tofacitinib), Lck inhibitor (A420983), PKC inhibitor (AEB071) and p38MAPK inhibitor (UR13870) for 5 days. Flow cytometry analysis of intracellular FOXP3 expression (n = 5). Data are shown as mean ± SEM.
Table S1. Kinome Log 2-transformed dataset.
Table S2. Target genes used for siRNA interference.
Table S3. Primers used for RT-qPCR.
References
1. Smigiel KS, Srivastava S, Stolley JM, Campbell DJ. Regulatory T cell homeostasis: steady-state maintenance and modulation during inflammation. Immunol Rev. (2014) 259:40. doi: 10.1111/imr.12170
2. Koenen HJ, Fasse E, Joosten I. CD27/CFSE-based ex vivo selection of highly suppressive alloantigen-specific human regulatory T cells. J Immunol. (2005) 174:7573–83. doi: 10.4049/jimmunol.174.12.7573
3. Seddiki N, Santner-Nanan B, Tangye SG, Alexander SI, Solomon M, Lee S, et al. Persistence of naive CD45RA+ regulatory T cells in adult life. Blood. (2006) 107:2830–8. doi: 10.1182/blood-2005-06-2403
4. Valmori D, Merlo A, Souleimanian NE, Hesdorffer CS, Ayyoub M. A peripheral circulating compartment of natural naive CD4 Tregs. J Clin Invest. (2005) 115:1953–62. doi: 10.1172/JCI23963
5. Miyara M, Yoshioka Y, Kitoh A, Shima T, Wing K, Niwa A, et al. Functional delineation and differentiation dynamics of human CD4+ T cells expressing the FoxP3 transcription factor. Immunity. (2009) 30:899–911. doi: 10.1016/j.immuni.2009.03.019
6. Cuadrado E, van den Biggelaar M, de Kivit S, Chen YY, Slot M, Doubal I, et al. Proteomic analyses of human regulatory T cells reveal adaptations in signaling pathways that protect cellular identity. Immunity. (2018) 48:1046–59 e6. doi: 10.1016/j.immuni.2018.04.008
7. Schmidl C, Hansmann L, Lassmann T, Balwierz PJ, Kawaji H, Itoh M, et al. The enhancer and promoter landscape of human regulatory and conventional T-cell subpopulations. Blood. (2014) 123:e68–78. doi: 10.1182/blood-2013-02-486944
8. Koenen HJ, Smeets RL, Vink PM, van Rijssen E, Boots AM, Joosten I. Human CD25highFoxp3pos regulatory T cells differentiate into IL-17-producing cells. Blood. (2008) 112:2340–52. doi: 10.1182/blood-2008-01-133967
9. Zhou X, Bailey-Bucktrout SL, Jeker LT, Penaranda C, Martínez-Llordella M, Ashby M, et al. Instability of the transcription factor Foxp3 leads to the generation of pathogenic memory T cells in vivo. Nat Immunol. (2009) 10:1000–7. doi: 10.1038/ni.1774
10. Zhou X, Bailey-Bucktrout S, Jeker LT, Bluestone JA. Plasticity of CD4+ FoxP3+ T cells. Curr Opin Immunol. (2009) 21:281–5. doi: 10.1016/j.coi.2009.05.007
11. Bovenschen HJ, van de Kerkhof PC, van Erp PE, Woestenenk R, Joosten I, Koenen HJ. Foxp3+ regulatory T cells of psoriasis patients easily differentiate into IL-17A-producing cells and are found in lesional skin. J Invest Dermatol. (2011) 131:1853–60. doi: 10.1038/jid.2011.139
12. Yang L, Li B, Dang E, Jin L, Fan X, Wang G. Impaired function of regulatory T cells in patients with psoriasis is mediated by phosphorylation of STAT3. J Dermatol Sci. (2016) 81:85–92. doi: 10.1016/j.jdermsci.2015.11.007
13. Kluger MA, Nosko A, Ramcke T, Goerke B, Meyer MC, Wegscheid C, et al. RORγt expression in T regs promotes systemic lupus erythematosus via IL-17 secretion, alteration of T reg phenotype and suppression of Th2 responses. Clin Exp Immunol. (2017) 188:63–78. doi: 10.1111/cei.12905
14. Kitani A, Xu L. Regulatory T cells and the induction of IL-17. Mucosal Immunol. (2008) 1:S43–46. doi: 10.1038/mi.2008.51
15. He X, Koenen HJPM, Smeets RL, Keijsers R, van Rijssen E, Koerber A, et al. Targeting PKC in human T cells using sotrastaurin (AEB071) preserves regulatory T cells and prevents IL-17 production. J Invest Dermatol. (2014) 134:975–83. doi: 10.1038/jid.2013.459
16. He X, Smeets RL, van Rijssen E, Boots AM, Joosten I, Koenen HJ. Single CD28 stimulation induces stable and polyclonal expansion of human regulatory T cells. Sci Rep. (2017) 7:43003. doi: 10.1038/srep43003
17. Dinkla S, van Cranenbroek B, van der Heijden WA, He X, Wallbrecher R, Dumitriu IE, et al. Platelet microparticles inhibit IL-17 production by regulatory T cells through P-selectin. Blood. (2016) 127:1976–86. doi: 10.1182/blood-2015-04-640300
18. He X, Landman S, Bauland SC, van den Dolder J, Koenen HJ, Joosten I, et al. A TNFR2-agonist facilitates high purity expansion of human low purity Treg cells. PLoS ONE. (2016) 11:e0156311. doi: 10.1371/journal.pone.0156311
19. Okubo Y, Mera T, Wang L, Faustman DL. Homogeneous expansion of human T-regulatory cells via tumor necrosis factor receptor 2. Sci Rep. (2013) 3:3153. doi: 10.1038/srep03153
20. Urbano PCM, Aguirre-Gamboa R, Ashikov A, van Heeswijk B, Krippner-Heidenreich A, Tijssen H, et al. TNF-α-induced protein 3 (TNFAIP3) /A20 acts as a master switch in TNF-α blockade–driven IL-17A expression. J Allergy Clin Immunol. (2018) 142:517–29. doi: 10.1016/j.jaci.2017.11.024
21. Garg AV, Ahmed M, Vallejo AN, Ma A, Gaffen SL. The deubiquitinase A20 mediates feedback inhibition of interleukin-17 receptor signaling. Sci Signal. (2013) 6:ra44. doi: 10.1126/scisignal.2003699
22. Stilo R, Varricchio E, Liguoro D, Leonardi A, Vito P. A20 is a negative regulator of BCL10- and CARMA3-mediated activation of NF- B. J Cell Sci. (2008) 121:1165–71. doi: 10.1242/jcs.021105
23. Düwel M, Welteke V, Oeckinghaus A, Baens M, Kloo B, Ferch U, et al. A20 negatively regulates T cell receptor signaling to NF-kappaB by cleaving Malt1 ubiquitin chains. J Immunol. (2009) 182:7718–28. doi: 10.4049/jimmunol.0803313
24. Luo H, Liu Y, Li Q, Liao L, Sun R, Liu X, et al. A20 regulates IL-1-induced tolerant production of CXC chemokines in human mesangial cells via inhibition of MAPK signaling. Sci Rep. (2015) 5:18007. doi: 10.1038/srep18007
25. Chen X, Wu X, Zhou Q, Howard OM, Netea MG, Oppenheim JJ. TNFR2 is critical for the stabilization of the CD4+Foxp3+ regulatory T cell phenotype in the inflammatory environment. J Immunol. (2013) 190:1076–84. doi: 10.4049/jimmunol.1202659
26. Kleijwegt FS, Laban S, Duinkerken G, Joosten AM, Zaldumbide A, Nikolic T, et al. Critical role for TNF in the induction of human antigen-specific regulatory T cells by tolerogenic dendritic cells. J Immunol. (2010) 185:1412–8. doi: 10.4049/jimmunol.1000560
27. Bilate AM, Lafaille JJ. Can TNF-α boost regulatory T cells? J Clin Invest. (2010) 120:4190–2. doi: 10.1172/JCI45262
28. Urbano PCM, Koenen HJPM, Joosten I, He X. An autocrine TNFα-tumor necrosis factor receptor 2 loop promotes epigenetic effects inducing human treg stability in vitro. Front Immunol. (2018) 9:573. doi: 10.3389/fimmu.2018.00573
29. Vasanthakumar A, Liao Y, Teh P, Pascutti MF, Oja AE, Garnham AL, et al. The TNF receptor superfamily-NF-κB axis is critical to maintain effector regulatory T cells in lymphoid and non-lymphoid tissues. Cell Rep. (2017) 20:2906–20. doi: 10.1016/j.celrep.2017.08.068
31. Owczarek D, Cibor D, Szczepanek M, Mach T. Biological therapy of inflammatory bowel disease. Pol Arch Med Wewnetrznej. (2009) 119:84–8. doi: 10.20452/pamw.614
32. Braun J, Breban M, Maksymowych WP. Therapy for ankylosing spondylitis: new treatment modalities. Best Pract Res Clin Rheumatol. (2002) 16:631–51. doi: 10.1053/berh.2002.0245
33. Feldmann M, Maini RN. Anti -TNF α t herapy of rheumatoid arthritis: what have we learned? Annu rev Immunol. (2001) 19:163–96. doi: 10.1146/annurev.immunol.19.1.163
34. Ko JM, Gottlieb AB, Kerbleski JF. Induction and exacerbation of psoriasis with TNF-blockade therapy: a review and analysis of 127 cases. J Dermatolog Treat. (2009) 20:100–8. doi: 10.1080/09546630802441234
35. Denadai R, Teixeira FV, Steinwurz F, Romiti R, Saad-Hossne R. Induction or exacerbation of psoriatic lesions during anti-TNF-α therapy for inflammatory bowel disease: a systematic literature review based on 222 cases. J Crohn Colitis. (2013) 7:517–24. doi: 10.1016/j.crohns.2012.08.007
36. Mocci G, Marzo M, Papa A, Armuzzi A, Guidi L. Dermatological adverse reactions during anti-TNF treatments: focus on inflammatory bowel disease. J Crohns Colitis. (2013) 7:769–79. doi: 10.1016/j.crohns.2013.01.009
37. Sfikakis PP, Iliopoulos A, Elezoglou A, Kittas C, Stratigos A. Psoriasis induced by anti-tumor necrosis factor therapy: a paradoxical adverse reaction. Arthritis Rheum. (2005) 52:2513–8. doi: 10.1002/art.21233
38. Paul S, Schaefer BC. A new look at T cell receptor signaling to nuclear factor-κB. Trends Immunol. (2013) 34:269–81. doi: 10.1016/j.it.2013.02.002
39. Vereecke L, Beyaert R, van Loo G. The ubiquitin-editing enzyme A20 (TNFAIP3) is a central regulator of immunopathology. Trends Immunol. (2009) 30:383–91. doi: 10.1016/j.it.2009.05.007
40. Aspalter RM, Eibl MM, Wolf HM. Regulation of TCR-mediated T cell activation by TNF-RII. J Leukoc Biol. (2003) 74:572–82. doi: 10.1189/jlb.0303112
41. Coornaert B, Carpentier I, Beyaert R. A20: central gatekeeper in inflammation and immunity. J Biol Chem. (2009) 284:8217–21. doi: 10.1074/jbc.R800032200
42. Nakamura BN, Glazier A, Kattah MG, Duong B, Jia Y, Campo D, et al. A20 regulates canonical wnt-signaling through an interaction with RIPK4. PLoS ONE. (2018) 13:e0195893. doi: 10.1371/journal.pone.0195893
43. Baharani A, Trost B, Kusalik A, Napper S. Technological advances for interrogating the human kinome. Biochem Soc Trans. (2017) 45:65–77. doi: 10.1042/BST20160163
44. Gorman CL, Russell AI, Zhang Z, Cunninghame Graham D, Cope AP, Vyse TJ. Polymorphisms in the CD3Z gene influence TCRzeta expression in systemic lupus erythematosus patients and healthy controls. J Immunol. (2008) 180:1060–70. doi: 10.4049/jimmunol.180.2.1060
45. Archangelo LF, Greif PA, Hölzel M, Harasim T, Kremmer E, Przemeck GK, et al. The CALM and CALM/AF10 interactor CATS is a marker for proliferation. Mol Oncol. (2008) 2:356–67. doi: 10.1016/j.molonc.2008.08.001
46. Miyata Y, Nishida E. DYRK1A binds to an evolutionarily conserved WD40-repeat protein WDR68 and induces its nuclear translocation. Biochim Biophys Acta Mol Cell Res. (2011) 1813:1728–39. doi: 10.1016/j.bbamcr.2011.06.023
47. Wang CY, Lin CF. Annexin A2: its molecular regulation and cellular expression in cancer development. Dis Markers. (2014) 2014:308976. doi: 10.1155/2014/308976
48. Szklarczyk D, Morris JH, Cook H, Kuhn M, Wyder S, Simonovic M, et al. The STRING database in 2017: quality-controlled protein-protein association networks, made broadly accessible. Nucleic Acids Res. (2017) 45:D362–8. doi: 10.1093/nar/gkw937
49. Maeshima K, Yamaoka K, Kubo S, Nakano K, Iwata S, Saito K, et al. The JAK inhibitor tofacitinib regulates synovitis through inhibition of interferon-γ and interleukin-17 production by human CD4+ T cells. Arthritis Rheum. (2012) 64:1790–8. doi: 10.1002/art.34329
50. Tanaka Y, Maeshima K, Maeshima Y, Yamaoka K. In vitro and in vivo analysis of a JAK inhibitor in rheumatoid arthritis. Ann Rheum Dis. (2012) 71(Suppl 2):70–4. doi: 10.1136/annrheumdis-2011-200595
51. Gomez-Rodriguez J, Sahu N, Handon R, Davidson TS, Anderson SM, Kirby MR, et al. Differential expression of interleukin-17A and−17F is coupled to T cell receptor signaling via inducible T cell kinase. Immunity. (2009) 31:587–97. doi: 10.1016/j.immuni.2009.07.009
52. Noubade R, Krementsov DN, Del Rio R, Thornton T, Nagaleekar V, Saligrama N, et al. Activation of p38 MAPK in CD4 T cells controls IL-17 production and autoimmune encephalomyelitis. Blood. (2011) 118:3290–300. doi: 10.1182/blood-2011-02-336552
53. Zaragoza B, Chen X, Oppenheim JJ, Baeyens A, Gregoire S, Chader D, et al. Suppressive activity of human regulatory T cells is maintained in the presence of TNF. Nat Med. (2016) 22:16–7. doi: 10.1038/nm.4019
54. Valencia X, Stephens G, Goldbach-Mansky R, Wilson M, Shevach EM, Lipsky PE. TNF downmodulates the function of human CD4+CD25hi T-regulatory cells. Blood. (2006) 108:253–61. doi: 10.1182/blood-2005-11-4567
55. Nie H, Zheng Y, Li R, Guo TB, He D, Fang L, et al. Phosphorylation of FOXP3 controls regulatory T cell function and is inhibited by TNF-α in rheumatoid arthritis. Nat Med. (2013) 19:322–8. doi: 10.1038/nm.3085
56. Érsek B, Molnár V, Balogh A, Matkó J, Cope AP, Buzás EI, et al. CD3ζ-chain expression of human T lymphocytes is regulated by TNF via Src-like adaptor protein-dependent proteasomal degradation. J Immunol. (2012) 189:1602–10. doi: 10.4049/jimmunol.1102365
57. Zhu J, Shevach EM. TCR signaling fuels T(reg) cell suppressor function. Nat Immunol. (2014) 15:1002–3. doi: 10.1038/ni.3014
58. Nishio J, Baba M, Atarashi K, Tanoue T, Negishi H, Yanai H, et al. Requirement of full TCR repertoire for regulatory T cells to maintain intestinal homeostasis. Proc Natl Acad Sci USA. (2015) 112:12770–5. doi: 10.1073/pnas.1516617112
59. Wong J, Obst R, Correia-Neves M, Losyev G, Mathis D, Benoist C. Adaptation of TCR repertoires to self-peptides in regulatory and nonregulatory CD4+ T cells. J Immunol. (2007) 178:7032–41. doi: 10.4049/jimmunol.178.11.7032
60. Li MO, Rudensky AY. T cell receptor signalling in the control of regulatory T cell differentiation and function. Nat Rev Immunol. (2016) 16:220–33. doi: 10.1038/nri.2016.26
61. Schmidt AM, Lu W, Sindhava VJ, Huang Y, Burkhardt JK, Yang E, et al. Regulatory T cells require TCR signaling for their suppressive function. J Immunol. (2015) 194:4362–70. doi: 10.4049/jimmunol.1402384
62. Ohkura N, Sakaguchi S. Regulatory T cells: roles of T cell receptor for their development and function. Semin Immunopathol. (2010) 32:95–106. doi: 10.1007/s00281-010-0200-5
63. Levine AG, Arvey A, Jin W, Rudensky AY. Continuous requirement for the TCR in regulatory T cell function. Nat Immunol. (2014) 15:1070–8. doi: 10.1038/ni.3004
64. Hwang S, Song KD, Lesourne R, Lee J, Pinkhasov J, Li L, et al. Reduced TCR signaling potential impairs negative selection but does not result in autoimmune disease. J Exp Med. (2012) 209:1781–95. doi: 10.1084/jem.20120058
65. Villarino AV, Kanno Y, O'Shea JJ. Mechanisms and consequences of Jak–STAT signaling in the immune system. Nat Immunol. (2017) 18:374–84. doi: 10.1038/ni.3691
66. Harrington LE, Hatton RD, Mangan PR, Turner H, Murphy TL, Murphy KM, et al. Interleukin 17–producing CD4+ effector T cells develop via a lineage distinct from the T helper type 1 and 2 lineages. Nat Immunol. (2005) 6:1123–32. doi: 10.1038/ni1254
67. Wenzl K, Manske MK, Sarangi V, Asmann YW, Greipp PT, Schoon HR, et al. Loss of TNFAIP3 enhances MYD88L265P-driven signaling in non-Hodgkin lymphoma. Blood Cancer J. (2018) 8:97. doi: 10.1038/s41408-018-0130-3
68. De Wilde K, Martens A, Lambrecht S, Jacques P, Drennan MB, Debusschere K, et al. A20 inhibition of STAT1 expression in myeloid cells: a novel endogenous regulatory mechanism preventing development of enthesitis. Ann Rheum Dis. (2017) 76:585–92. doi: 10.1136/annrheumdis-2016-209454
69. Tang Q, Vincenti F. Transplant trials with Tregs: perils and promises. J Clin Invest. (2017) 127:2505–12. doi: 10.1172/JCI90598
70. de Quirós EB, Camino M, Gil N, Panadero E, Medrano-Lopez C, Gil-Jaurena JM, et al. “First-in-human” clinical trial employing adoptive transfer of autologous thymus-derived Treg cells (thyTreg) to prevent graft rejection in heart-transplanted children. Transplantation. (2018) 102:S205. doi: 10.1097/01.tp.0000542859.38902.af
71. Mathew JMH, -Voss J, LeFever A, Konieczna I, Stratton C, He J, et al. A phase I clinical trial with ex vivo expanded recipient regulatory T cells in living donor kidney transplants. Sci Rep. (2018) 8:7428. doi: 10.1038/s41598-018-25574-7
72. Sewgobind VDKD, Quaedackers ME, Van der Laan LJW, Kraaijeveld R, Korevaar SS, Chan G, et al. The Jak inhibitor CP-690,550 preserves the function of CD4+CD25brightFoxP3+ regulatory T cells and inhibits effector T cells. Am J Transplant. (2010) 10:1785–95. doi: 10.1111/j.1600-6143.2010.03200.x
Keywords: Treg, FOXP3, TNF, anti-TNF, IL-17A, JAK, TCR
Citation: Urbano PCM, He X, Heeswijk Bv, Filho OPS, Tijssen H, Smeets RL, Joosten I and Koenen HJPM (2020) TNFα-Signaling Modulates the Kinase Activity of Human Effector Treg and Regulates IL-17A Expression. Front. Immunol. 10:3047. doi: 10.3389/fimmu.2019.03047
Received: 30 August 2019; Accepted: 12 December 2019;
Published: 21 January 2020.
Edited by:
Margarita Dominguez-Villar, Imperial College London, United KingdomReviewed by:
Benoit L. Salomon, Institut National de la Santé et de la Recherche Médicale (INSERM), FranceRaffaele De Palma, University of Campania Luigi Vanvitelli, Italy
Copyright © 2020 Urbano, He, Heeswijk, Filho, Tijssen, Smeets, Joosten and Koenen. This is an open-access article distributed under the terms of the Creative Commons Attribution License (CC BY). The use, distribution or reproduction in other forums is permitted, provided the original author(s) and the copyright owner(s) are credited and that the original publication in this journal is cited, in accordance with accepted academic practice. No use, distribution or reproduction is permitted which does not comply with these terms.
*Correspondence: Hans J. P. M. Koenen, SGFucy5Lb2VuZW5AcmFkYm91ZHVtYy5ubA==