 Katerina Zachova1
 Petr Kosztyu1
 Josef Zadrazil2
 Karel Matousovic3
 Karel Vondrak4
 Petr Hubacek5Bruce A. Julian6
 Zina Moldoveanu7Zdenek Novak8
 Klara Kostovcikova9
 Milan Raska1,7*
 Jiri Mestecky6,7,9*
- 1Department of Immunology, Faculty of Medicine and Dentistry, University Hospital Olomouc, Palacky University Olomouc, Olomouc, Czechia
- 2Department of Internal Medicine III Nephrology, Rheumatology and Endocrinology, University Hospital Olomouc, Palacky University Olomouc, Olomouc, Czechia
- 3Department of Medicine, Second Faculty of Medicine, University Hospital Motol, Charles University, Prague, Czechia
- 4Department of Pediatrics, Second Faculty of Medicine, Charles University, Prague, Czechia
- 5Department of Medical Microbiology, Second Faculty of Medicine, University Hospital Motol, Charles University, Prague, Czechia
- 6Department of Medicine, University of Alabama at Birmingham, Birmingham, AL, United States
- 7Department of Microbiology, University of Alabama at Birmingham, Birmingham, AL, United States
- 8Department of Surgery, University of Alabama at Birmingham, Birmingham, AL, United States
- 9Laboratory of Cellular and Molecular Immunology, Institute of Microbiology, Czech Academy of Sciences, Prague, Czechia
IgA nephropathy (IgAN) is the dominant type of primary glomerulonephritis worldwide. However, IgAN rarely affects African Blacks and is uncommon in African Americans. Polymeric IgA1 with galactose-deficient hinge-region glycans is recognized as auto-antigen by glycan-specific antibodies, leading to formation of circulating immune complexes with nephritogenic consequences. Because human B cells infected in vitro with Epstein-Barr virus (EBV) secrete galactose-deficient IgA1, we examined peripheral blood B cells from adult IgAN patients, and relevant controls, for the presence of EBV and their phenotypic markers. We found that IgAN patients had more lymphoblasts/plasmablasts that were surface-positive for IgA, infected with EBV, and displayed increased expression of homing receptors for targeting the upper respiratory tract. Upon polyclonal stimulation, these cells produced more galactose-deficient IgA1 than did cells from healthy controls. Unexpectedly, in healthy African Americans, EBV was detected preferentially in surface IgM- and IgD-positive cells. Importantly, most African Blacks and African Americans acquire EBV within 2 years of birth. At that time, the IgA system is naturally deficient, manifested as low serum IgA levels and few IgA-producing cells. Consequently, EBV infects cells secreting immunoglobulins other than IgA. Our novel data implicate Epstein-Barr virus infected IgA+ cells as the source of galactose-deficient IgA1 and basis for expression of relevant homing receptors. Moreover, the temporal sequence of racial-specific differences in Epstein-Barr virus infection as related to the naturally delayed maturation of the IgA system explains the racial disparity in the prevalence of IgAN.
Introduction
The most common cause of glomerulonephritis in the world, Immunoglobulin A nephropathy (IgAN), is an autoimmune disease in which IgA1-containing circulating immune complexes (CIC) deposit in the glomerular mesangium to induce tissue injury, (1–5), culminating in end-stage renal disease in 20–40% of patients within 20 years of the biopsy diagnosis (3). An extensive search for an exogenous antigen of microbial or food origin failed to identify any uniformly involved in the formation of nephritogenic IgA-containing CIC (6). Subsequent CIC and mesangial deposit analyses revealed that the IgA is exclusively of the IgA1 subclass and is polymeric (pIgA) (4, 5). Furthermore, the O-glycans in the hinge region of the heavy chains of the pIgA1 are deficient in galactose (Gd-IgA1) and are recognized as auto-antigen by IgG or IgA antibodies to form nephritogenic CIC (1–3, 5, 7–20). In comparison to IgA2, IgA1 has a hinge region with an additional 9-serine and threonine amino acids that are sites for potential attachment of O-glycans (21).
Although IgAN is the most common form of glomerulonephritis in many countries (2, 3, 22–26), its prevalence displays a surprisingly unique geographical distribution. The disease is common in East Asia, Europe, Australia, and North America, but is rare in central Africa and uncommon in African Americans (2, 3, 25–41). Environmental and genetic factors have been considered in these remarkable geographically related differences (24–26).
Studies concerning IgA structure, metabolism, tissue distribution of cells producing IgA1 or IgA2, and Epstein-Barr virus (EBV)-induced differentiation of B cells into IgA-secreting cells (42–47) suggested possible involvement of EBV in the pathogenesis of IgAN. Thus, in vitro EBV-transformed peripheral-blood cells from healthy individuals produce almost exclusively pIgA of the IgA1 subclass (42, 45, 46, 48). Importantly, we have demonstrated that EBV-transformed cells from IgAN patients secrete Gd-IgA1 (15). Therefore, we analyzed the Ig isotypic association and phenotypes of in vivo EBV-infected B cells from patients with IgAN or other renal diseases, and White and African American healthy controls.
EBV infects most African Black and African American children by age 1–2 years (49–53). At this age, the entire IgA system is naturally deficient, as evidenced by the virtual absence or low levels of serum IgA and paucity of IgA-producing cells in various tissues (54–58). As a marker of IgA system maturation, serum IgA levels reach adult levels in puberty (54, 57). Therefore, the greatly reduced number of IgA+ B cells in early childhood diminishes the chance for EBV to infect such cells. In the White population, EBV infection occurs mainly at adolescence and >95% of adults are EBV-infected (51, 52, 59–63). In healthy adult Whites, EBV genomes have been detected in 80–90% of circulating B cells with IgA on their cell surfaces (s; sIgA+) (64).
EBV infection has been associated with highly diverse human diseases of infectious (infectious mononucleosis), malignant (nasopharyngeal carcinoma, Burkitt's lymphoma, and Hodgkin's disease), and autoimmune (systemic lupus erythematosus, multiple sclerosis, and inflammatory bowel disease) nature (59–63, 65–70). Previous studies of the role of EBV in IgA production (42, 44, 45, 47, 48) support the participation of EBV in the pathogenesis of IgAN. Consequently, we analyzed EBV-infected B cells from White IgAN patients, Whites with other renal diseases, and White and African American healthy controls for cell-surface (s) Ig isotypes, production of Gd-IgA1 after polyclonal stimulation, and expression of receptors involved in selective homing to various mucosal or systemic lymphoid tissues (71).
Materials and Methods
Reagents
All chemicals, unless otherwise specified, were purchased from Sigma (St. Louis, MO). Tissue-culture media and media supplements were purchased from Invitrogen (Carlsbad, CA).
Study Subjects
Informed consent was obtained from all participants. The ethical committee of the University Hospital in Olomouc and University Hospital in Motol and the UAB Institutional Review Board, protocol #140108002, approved this study. White adult patients with IgAN and non-IgAN kidney disease and White adult healthy controls were recruited at the Nephrology, Rheumatology, and Endocrinology Department and Department of Transfusion Medicine, University Hospital Olomouc and the Department of Medicine of the University Hospital Motol, Czech Republic. The diagnosis of IgAN for 31 patients had been based on staining for IgA as the dominant or co-dominant Ig in the mesangial immune deposits by routine immunofluorescence microscopy of clinically indicated kidney biopsies, in the absence of clinical or laboratory features of nephritis of SLE, IgA vasculitis, or liver disease. The disease-control group was comprised of 20 patients with non-IgAN kidney disease. Baseline clinical data, including gender, age, blood pressure, serum creatinine level, eGFR, urinary albumin/creatinine ratio (ACR), 24-h proteinuria, hematuria, and treatment with angiotensin-converting enzyme (ACE) inhibitor or angiotensin receptor blocker (ARB), were obtained from review of medical records. The healthy-control groups consisted of 59 Whites for the serology studies and 22 Whites for the EBER+ studies, and 11 African American adults recruited at the University of Alabama at Birmingham. Biochemical and physical parameters were determined based on routine clinical laboratory analyses in the respective hospitals. The clinical and biochemical characteristics of the study participants are compiled in Table 1.
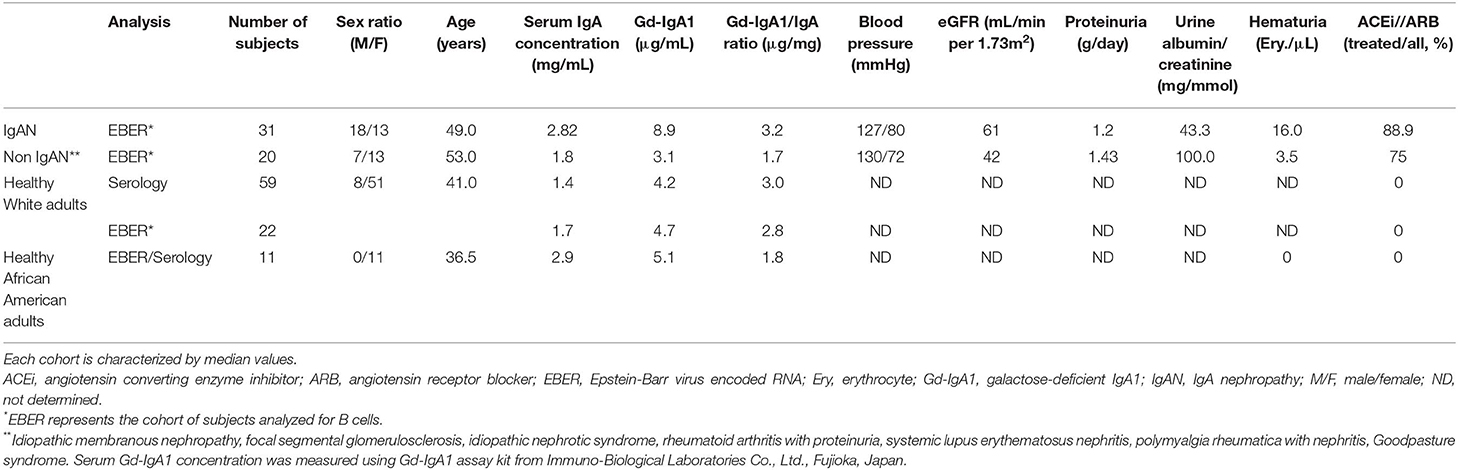
Table 1. Clinical and biochemical characteristics of study subjects.
Blood Samples
Peripheral blood mononuclear cells (PBMC), isolated from heparinized blood by centrifugation on Histopaque 1077, were used for all cellular analyses. Isolated PBMC were processed immediately or frozen at −80°C in 20% RPMI 1640, 70% FBS, 10% DMSO for later experiments. Sera were isolated from venous blood drawn into Vacuette serum clot activator tubes.
Pokeweed Mitogen Stimulation
PWM stimulation was performed by incubating PBMC in complete growth medium composed of RPMI 1640 medium supplemented with 10% FBS and PWM at concentration 5 μg/ml. Cells were grown for 7 days at 37°C in a humidified-CO2 atmosphere.
Cell Staining
Unstimulated or PWM-stimulated PBMCs were stained with fluorochrome-labeled antibodies and oligo DNA probes in successive steps: First, after blocking of cellular surface proteins with PBS (Biosera, Nuaille, France) + 10% FBS, surface-exposed receptors were labeled with combinations of selected fluorochrome-conjugated monoclonal antibodies (mAbs): anti-CD19-PE, anti-CD19-PE-eFluor610, anti-CD19-APC-eFluor780, anti-CD27-PE-Cy7, anti-CD38-PE-Cy5, anti-CD138-PE-Cy7, anti-β1 integrin- PE-Cy7, anti-β7 integrin-FITC, anti-CD62L-PE-Cy5, anti-CCR7-PE-Cy7, anti-CCR9-PE, anti-IgM-FITC, anti-IgD-FITC, Fixable Viability Dye-APC-eFluor780, and Fixable Viability Dye-eFluor450 (e-Bioscience, San Diego, CA), anti-CD21-PE-Cy7, anti-CD27-APC-H7, anti-CCR5-PE-Cy5, anti-IgG-PE-Cy5, anti-CCR10-PE, and anti-α4 integrin-PE-Cy5 (BD Biosciences, San Jose, CA), and anti-IgA-biotin or anti-IgG-biotin (Jackson ImmunoResearch, West Grove, PA) diluted in PBS + 10% FBS. Cells were incubated with various combinations of antibodies (Tables 2A,B) for 20 min at RT in the dark at dilutions optimized in preliminary experiments for each mAb. Biotinylated mAbs were stained using Streptavidin-FITC (Southern Biotech, Birmingham, AL) or Streptavidin—Pacific Orange (ThermoFisher Scientific, Waltham, MA). Conjugated mAbs were selected based on their stability during subsequent hybridization. After staining, the cells were washed and analyzed by flow cytometry directly or fixed before intracellular staining and/or hybridization using 4% paraformaldehyde (EMS, Hatfield, PA) for 10 min at RT, followed by permeabilization with 0.5% Tween 20 (Serva, Heidelberg, Germany) in PBS for 10 min at RT. All gating steps settled were based on the FMO (fluorochromes minus one) controls (Figure S1). The EBER probe specificity was based on Daudi (EBER positive) and Jurkat (EBER negative) cell line.
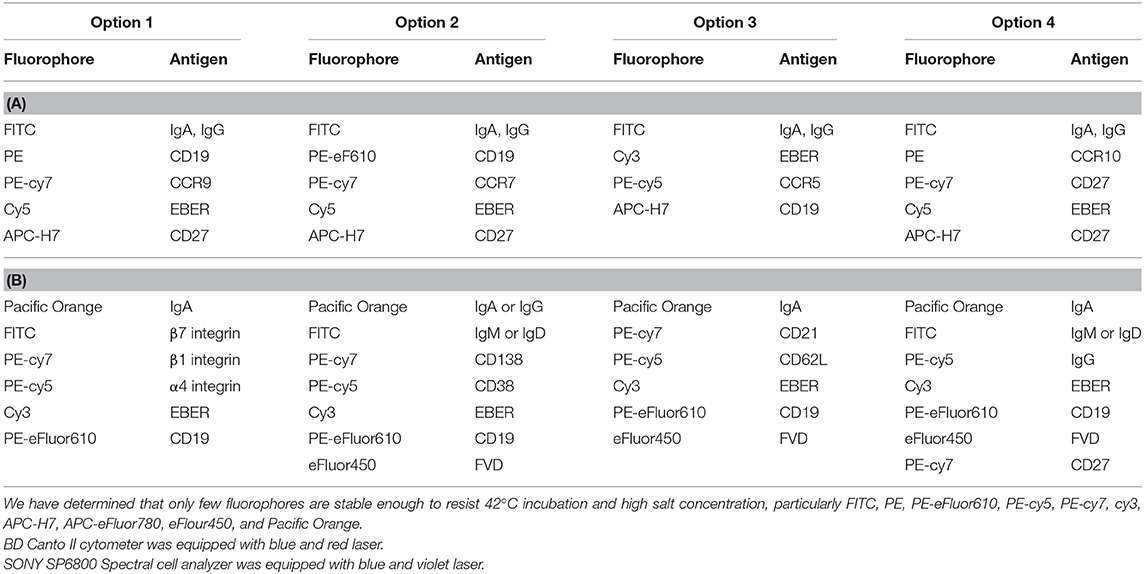
Table 2. (A) Usage of fluorophore-labeled antibody used by FACS Canto II flow cytometer; (B) Usage of fluorophore-labeled antibodies used by SONY SP6800 flow cytometer.
Surface-stained, fixed, and permeabilized cells were stained for intracellular immunoglobulins using biotin-labeled anti-IgA or anti-IgG and Streptavidin-FITC or Streptavidin—Pacific Orange, or anti-IgG-PE-Cy5 or anti-IgM-FITC or anti-IgD-FITC in PBS + 0.25% Tween 20 + 5% FBS for 30 min at RT in the dark. Finally, cells were washed with adapting buffer (31.25 mM NaCl, 6.25 mM Na2EDTA, 62.5 mM Tris-HCl pH 7.5 and 37.5% formamide) and hybridized with three Cy5- or Cy3-conjugated DNA probes specific for EBER-1 (5′-AAACATGCGGACCACCAGCTGGTAC-3′, 5′-AAGACGGCAGAAAGCAGAGTCTGGG-3′, 5′-AAACCTCTAGGGCAGCGTAGGTCCT-3′ Generi Biotech, Hradec Kralove, Czech Republic) in hybridization solution (10% dextran sulfate, 10 mM NaCl, 30% formamide, 0.1% sodium pyrophosphate, 0.2% polyvinylpyrrolidone, 5 mM Na2EDTA, and 50 mM TRIS-HCl, pH7.5). Cells were incubated with probes at concentration 12 pmol/ml for 1 h at 42°C in the dark. At the end, cells were washed with 0.5% Tween 20 in PBS for 10 min and subsequently for 30 min at 42°C, and analyzed by flow cytometry.
Flow Cytometry Analysis
FACS analyses were performed using Canto II cytometer (BD Biosciences) equipped with blue (488 nm) and red (633 nm) lasers and DIVA software or using SONY Spectral Analyzer (SONY Biotechnologies, San Jose, CA) equipped with blue (488 nm) and violet (405 nm) lasers and SP6800 software. More detailed analyses were performed by FlowJo software (Tree Star Inc., Ashland, OR).
ELISA Determination of IgA and Gd-IgA1 Levels
ELISA measurement of serum levels of total IgA and Gd-IgA1 was done according to previously described protocols (15, 16). Serum Gd-IgA1 level was measured using a Gd-IgA1 Assay (Immuno-Biological Laboratories Co., Ltd., Fujioka, Japan) according to manufacturer's instructions. Briefly, tested sera were diluted 1:500 in enclosed buffer and added to wells pre-coated with rat anti-Gd-IgA1 IgG. After the incubation for 1 h at RT, plates were washed and incubated with HRP-conjugated mouse anti-human IgA Ab for 30 min at RT. After washing, plates were developed with 3,3′,5,5′-tetramethylbenzidine (TMB; ThermoFisher Scientific) and absorbance was measured at 450 nm by an ELISA reader.
EBV Serology
Serum levels and Ig isotypes of antibodies specific for EBV antigens, VCA, EA, and EBNA1, were analyzed using commercial ELISA kits (VIDIA s.r.o., Vestec, Czech Republic) according to manufacturer's instructions. In brief, sera were diluted 1:100 in enclosed buffer and applied on ELISA plates pre-coated with respective antigen. Plates were incubated with serum for 30 min at RT, thereafter washed, and incubated with HRP-conjugated secondary mAb. After 1 h, wells were washed, developed with TMB, and absorbance was measured at 450 nm by an ELISA reader.
Statistics
Normality was examined by QQ Plots and Kolmogorov-Smirnov test. Statistical analysis was performed utilizing student's t-test or by Welch's ANOVA in instances where variances were unequal. Mann–Whitney U-test was used in instances where non-parametric test was required. When appropriate, paired t-test or non-parametric Wilcoxon Signed Rank test was performed. ANOVA model was used for multiple group comparisons with Tukey's post-hoc test. Homogeneity of Variances was tested using Levenes' statistic. If non-parametric comparison was required, Kruskal-Wallis test was used instead with Dunn-Bonferroni post-hoc test. All statistical analyses were done by GraphPad Prism v.5 software (GraphPad Software, La Jolla, CA) or SPSS v.25 (IBM Corp, Riverside, CA). A p ≤ 0.05 was considered to be significant in two-tail tests. Only the statistically significant differences are denoted in the figures.
Results
High Frequency of EBV Infection in CD19+ and sIgA+ B Cells in IgAN
Using EBV-encoded small RNAs (EBER)-specific probe and phenotypic analysis of CD19+ cells, we found that the White EBV-seropositive patients with IgAN displayed a higher frequency of EBV infection (CD19+ EBER+ cells) compared to non-IgAN patients and White controls (Figure 1A; gating strategy is shown in Figure S1). There were no differences in expression of sIgD, sIgM, sIgG, and sIgA among uninfected CD19+ cells between patients with IgAN, patients with non-IgAN kidney diseases, and healthy Whites (Figure 1B). However, the distribution of sIg on EBER+ CD19+ cells differed between IgAN patients, non-IgAN patients, and White healthy controls. In IgAN patients, these cells were mostly sIgA+ rather than sIgM+ or sIgG+, whereas in the other two groups sIgA+ cells were not dominant (Figure 1C). Thus, the percentage of peripheral-blood EBER+ CD19+ cells related to sIg isotype indicated a preferential association with sIgA+ cells for IgAN patients that was not found for non-IgAN patients and White healthy controls (Figure 1D).
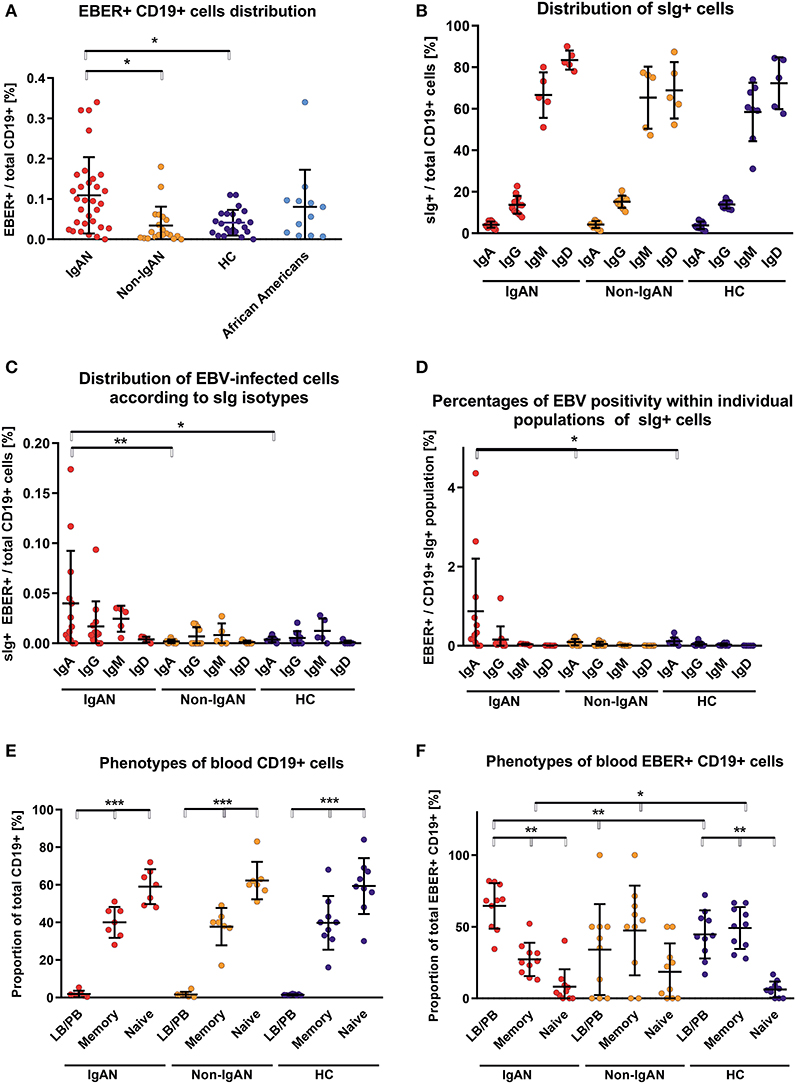
Figure 1. Patients with IgAN exhibit more EBV-infected CD19+ cells in peripheral blood than the disease and healthy controls. (A) EBER hybridization probe was used to determine the EBV positivity of CD19+ cells in PBMC from IgAN patients (IgAN; n = 31), non-IgAN patients (non-IgAN; n = 20), White healthy controls (HC; n = 22), and African American healthy controls (n = 11). The highest percentages of EBER+ CD19+ cells were in the IgAN patients and healthy African Americans. (B) Expression of surface (s) immunoglobulins: sIgA, sIgG, sIgM, and sIgD were characterized on CD19+ cells from PBMC from IgAN patients (n = 12 for IgA and IgG subpopulations and N = 5 for IgM and IgD subpopulations), non-IgAN patients (n = 10 for IgA and IgG subpopulations and N = 5 for IgM and IgD subpopulations), and White healthy controls (n = 8 for IgA, IgG, and IgM and N = 5 for IgD). (C) The proportion of sIgA-, sIgG-, sIgM-, or sIgD-positive EBER+ CD19+ cells were specified from populations analyzed in panel (B) and expressed as percentage of the total pool of CD19+ PBMC () or (D) as a percentage of isotype-matching CD19+ cells. In the panel (C) mean percentage values ±SD for IgAN group are IgG = 0.017 ± 0.023, IgM = 0.025±0.01, and for Non-IgAN group are IgG = 0.007 ± 0.008, IgM = 0.008 ± 0.009. In contrast to non-IgAN patients and White healthy controls, in whom EBV was detected preferentially in sIgM and sIgG cells, for IgAN patients the EBER+ CD19+ cells were predominantly sIgA-positive. (E) The distribution of B-cell maturation stages was analyzed in PBMC using surface staining for naive cells (CD19+ CD27−), memory cells (CD19+ CD27+), and LB/PB (CD19dim− CD27++ CD38+). No difference between groups (n = 7) in the distribution of individual maturation stages was observed. (F) In contrast, analogous populations of EBV-infected (EBER+) cells from PBMC of IgAN patients (n = 10) exhibited significant changes, namely the dominance of EBER+ LB/PB cells and fewer memory B cells when compared to non-IgAN patients (n = 10) and White healthy controls (n = 10) cohorts. Data are means ± SD. Numerical expression of all presented data (means ± SD) are provided in Supplementary Materials. P values were calculated using one-way ANOVA followed by Tukey's post-hoc test or using Kruskal-Wallis test with Dunn-Bonferroni post-hoc test when needed. *p < 0.05, **p < 0.01, ***p < 0.001.
To determine additional phenotypic properties of EBER+ cells, B cells were classified as naïve, memory, and lymphoblast (LB)/plasmablast (PB) phenotypes according to expression of CD27 and CD38 (naïve B cells are CD19+ CD27−; memory B cells CD19+ CD27+; and LB/PB CD19dim CD27+ CD38+). Although there were few LB/PB cells compared to the numbers of naïve and memory B cells (Figure 1E), LB/PB comprised the majority of the EBER+ population from IgAN patients (Figure 1F). These data suggest that more sIgA+ cells of LB/PB phenotypes were present in peripheral blood of IgAN patients as compared to non-IgAN patients and White healthy controls.
We performed analogous analysis of EBV-infected cell also for IgAN children and controls (Figure S2). Children with IgAN exhibit moderate increase in EBV-infected CD19+ cells in peripheral blood, predominantly of sIgM+.
Paucity of sIgA Expression on EBER+ B Cells From Healthy African Americans
We detected EBER+ CD19+ cells in blood of the healthy African Americans in frequencies higher, but statistically insignificant, than those in blood from White healthy controls and non-IgAN patients (Figure 1A). Proportions of sIg isotypes of total CD19+ cells were similar in IgAN and non-IgAN patients and White and African American healthy controls (Figures 1B, 2A). However, the proportions among the EBV-infected cells markedly differed. In IgAN patients, the cells were mainly sIgA+ (Figure 1C), whereas in White healthy controls sIgG+ and sIgM+ cells dominate with fewer IgA+ cells (Figure 1C). In healthy African Americans the EBV-infected cells were dominantly sIgM+ and sIgD+ with only a negligible contribution from sIgA+ cells (Figure 2B). These results are consistent with observations that EBV infection occurs in early childhood more often in African Americans than in Whites.
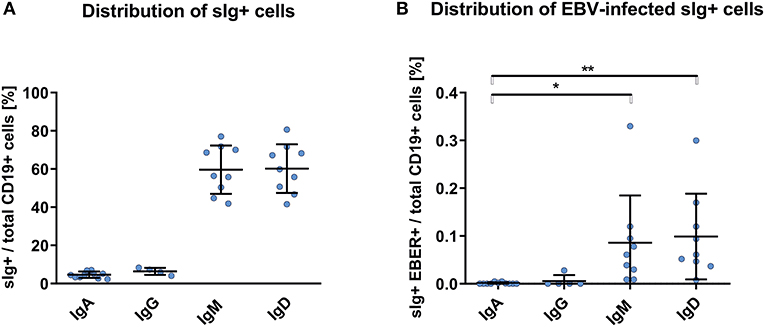
Figure 2. PBMC of African Americans do not exhibit dominance of sIgA+ EBV-infected CD19+ cells. (A) Isotypes of sIg on CD19+ PBMC from healthy African Americans (n = 9). (B) sIg isotype distribution in EBV-infected (EBER+) CD19+ B cells. This finding contrasts to that for the White healthy controls in whom the fractions of sIgA+ and sIgG+ cells were more prominent (Figure 1C). Data are means ± SD. Numerical expression of all presented data (means ± SD) are provided in Supplementary Materials. P values were calculated using one-way ANOVA followed by Tukey's post-hoc test or using Kruskal-Wallis test with Dunn-Bonferroni post-hoc test when needed. *p < 0.05, **p < 0.01.
We found significant serological differences between White and African American healthy controls with respect to circulating anti-EBV antibodies. African Americans had higher levels of IgG and IgA specific for viral capsid antigen (Figure 3).
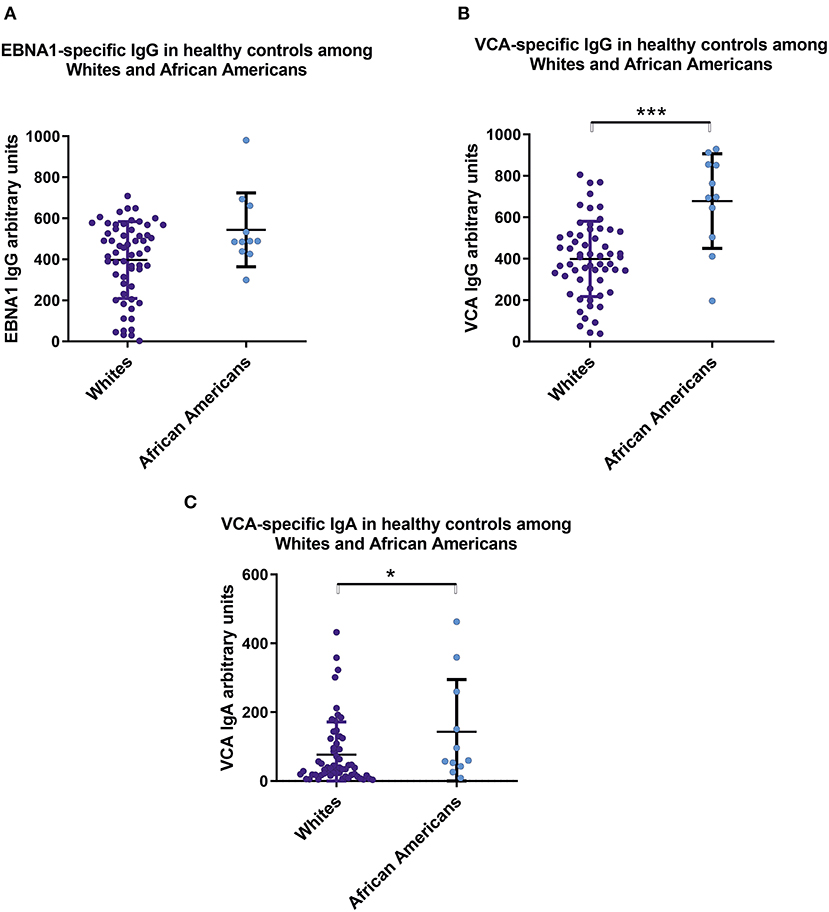
Figure 3. Sera from healthy African Americans exhibit higher levels of IgA and IgG specific for EBV VCA than do sera from White healthy controls. Comparison of serum levels of (A) IgG anti-EBNA1, (B) IgG anti-VCA, and (C) IgA anti-VCA levels in healthy Whites (n = 59) and African American (n = 11). Particularly, mean values ± SD for IgG anti-ENBA are 396 ± 185 for White healthy controls and 543 ± 171 for African Americans. Numerical expression of all presented data (means ± SD) are provided in Supplementary Materials. In graphs, means and standard deviations are shown. *p < 0.05, ***p < 0.001.
Expansion of Intracellular IgA+ EBER+ Cells in IgAN Patients After Polyclonal Stimulation
Flares of macroscopic hematuria in IgAN patients are often associated with an acute upper-respiratory-tract infection (2, 3, 37). In the absence of a suitable animal model and ethical restrictions in humans, we examined PBMC after polyclonal and T-cell-dependent stimulation with pokeweed mitogen (PWM) for the number of IgA+ EBER+ cells. PWM stimulation significantly increased the population of EBV-infected cells from IgAN patients and White healthy controls (Figure 4A). PWM stimulation induced a larger increase in number of intracellular IgA+ (iIgA+) LB/PB for IgAN patients than for White healthy controls (Figure 4B). For IgAN patients, the response for iIgA+ cells was comparable to that for iIgG+ cells and exceeded that for iIgM+ cells. For White healthy controls, the increase in iIgG+ cells exceeded that for iIgA+ cells. In contrast, EBER+ LB/PB from IgAN patients responded to PWM more than did cells from White healthy controls but a statistical significance was achieved only for iIgA+ cells (Figure 4C). For IgAN patients and White healthy controls, PWM-induced secretion of IgA and Gd-IgA1 into the culture supernatants (Figures 4D,E). However, when expressed as ratio of Gd-IgA to total IgA, the response to PWM was significant only for IgAN patients (Figure 4F).
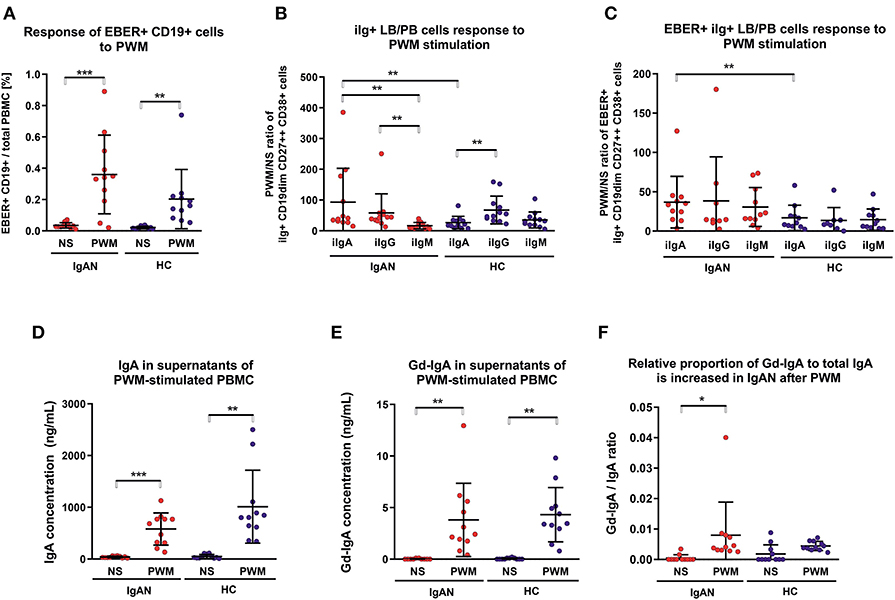
Figure 4. Pokeweed mitogen (PWM) stimulation of PBMC from IgAN patients increases number of intracellular IgA (iIgA+) and iIgA+ EBER+ cells. (A) PBMC from IgAN patients (IgAN; n = 10) and White healthy controls (HC; n = 10) were stimulated with 5 μg/ml PWM for 7 days. Viable cells (Fixable Viability Dye-eFluor negative) were then stained for CD19, CD27, CD38, EBER, and intracellular (i) immunoglobulins: iIgA, iIgG, and iIgM. PWM stimulation significantly increased the proportion of EBER+ CD19dim cells compared to cells that were not stimulated (NS), indicating that PWM induced proliferation of EBER+ CD19dim cells. (B) The proportions of intracellular immunoglobulin isotype iIgA-, iIgG-, and iIgM-positive CD19dim CD27++ CD38+ cells (lymphoblast/plasmablast; LB/PB) were analyzed before (NS) and after PWM stimulation of PBMC from IgAN patients and White healthy controls. PWM stimulation of PMBC from IgAN patients increased the populations of iIgA+, iIgG+, and IgM+ LB/PB cells in contrast to the increase of iIgM+ and iIgG+ and less prominent increase of IgA+ in PBMC from White healthy controls. (C) The proportions of EBER+ iIgA+, iIgG+, or iIgM+ in the LB/PB cells were analyzed before and after PWM stimulation of PBMC from IgAN patients and White healthy controls. PWM more effectively stimulated proliferation of iIgA+ cells from IgAN patients than cells bearing other Ig isotypes in White healthy controls. (D) Measurement of IgA secreted in culture supernatant confirmed a significant increase in total IgA and (E) of Gd-IgA1 after PWM stimulation of PBMC from IgAN patients and White healthy controls. The proportion of Gd-IgA1 in the total IgA secreted by PBMC from IgAN patients was moderately, although insignificantly, higher than that secreted by cells from White healthy controls. (F) The ratio of Gd-IgA to total IgA was calculated from results in (D, E). Data are means ± SD. Numerical expression of all presented data (means ± SD) are provided in Supplementary Materials. P values were calculated using paired t-test or non-parametric Wilcoxon Signed Rank test was performed when required. Multiple groups were analyzed using one-way ANOVA followed by Tukey's post-hoc test or using Kruskal-Wallis test with Dunn-Bonferroni post-hoc test where needed. *p < 0.05, **p < 0.01, ***p < 0.001.
Altered Expression of Homing Receptors in EBV-Infected B Cells
We examined the expression of integrins (L-selectin, α4β1, and α4β7) and relevant chemokine receptors on EBV-negative and -infected B cells and their sIgA+ subpopulations from peripheral blood of IgAN patients and White healthy controls. For EBV-negative cells, the numbers of B cells and the ratios of sIgA+ subpopulation expressing α4β1+ and α4β7+ were similar in IgAN patients and White healthy controls (Figures 5A,B). However, analogous comparative studies revealed highly significant differences between these two groups for the expression of homing receptors on EBV-infected cells. Cells from IgAN patients exhibited equal expression of gut-homing receptor α4β7 and respiratory-tract homing receptor α4β1 (Figure 5C) whereas cells from healthy White controls express only gut-homing α4β7 but no α4β1 (Figure 5C). Analogous differences in the expression of homing receptors between IgAN patients and White healthy controls were detected in the sIgA+ EBV-infected subpopulation (Figure 5D). In addition to α4β1, these cells displayed enhanced expression of CCR7 (Figure 6) that is involved in homing to systemic and mucosal sites. There was no significant difference in expression of the homing receptors CCR5, CCR9, CCR10, and L-selectin. Therefore, phenotypic analysis of CD19+ sIgA+ EBER+ B cells from patients with IgAN demonstrated a significantly altered expression of homing receptors, with preferential targeting to the upper respiratory tract and tonsils.
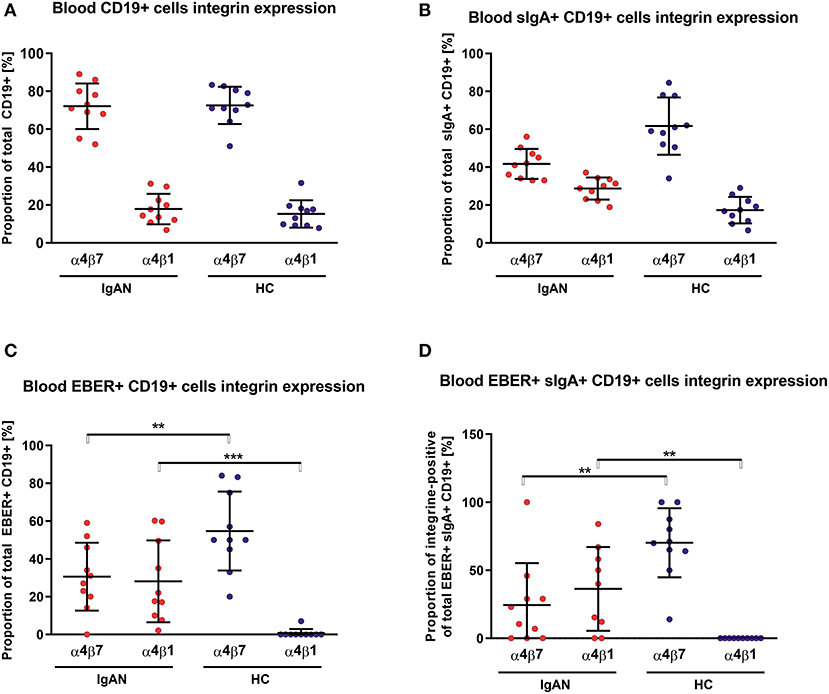
Figure 5. PBMC from IgAN patients contains a substantial proportion of EBER+ CD19+ α4β1 integrin-positive cells. (A) Distribution of integrins α4β7- and α4β1-positive CD19+ PBMC was analyzed in IgAN patients (IgAN; n = 10) and White healthy controls (HC; n = 10). (B) Percentage distribution of α4β7 or α4β1 on IgA+ CD19+ PBMC. Values in percentage are α4β7 = 41.7 ± 7.5 and α4β1 = 28.7 ± 5.5 for IgAN group and α4β7 = 61.7 ± 14.3 and α4β1 =17.3 ± 6.6 for HC (C) Percentage distribution of α4β7 or α4β1 on EBV-infected (EBER+) CD19+ PBMC. (D) Percentage distribution of α4β7 or α4β1 on EBV-infected (EBER+) CD19+ PBMC expressing sIgA. Proportion of α4β7- and α4β1-positive CD19+ cells is comparable in IgAN patients and White healthy controls, with significant dominance of α4β7-single-positive CD19+ cells, see section A. In contrast to sIgA+ CD19+ cells from White healthy controls, cells from IgAN patients did not exhibit such an α4β7 dominance, see section B. Moreover, EBV-infected CD19+ and, particularly, EBV-infected sIgA+ CD19+ cells from IgAN patients displayed a reduced proportion of α4β7-positive cells and a larger α4β1-positive subpopulation. In White healthy controls the α4β1-single-positive sIgA+ CD19+ cells were absent whereas the population of α4β7+-single-positive cells was increased, indicating different migration behavior between EBV-infected cells in IgAN patients and White healthy controls. Data are means ± SD. Numerical expression of all presented data (means ± SD) are provided in Supplementary Materials. P values were calculated using student's t-test or by Welch's ANOVA in instances where variances were unequal. Mann-Whitney U-test was used in instances where non-parametric test was required. *p < 0.05, **p < 0.01, ***p < 0.001.
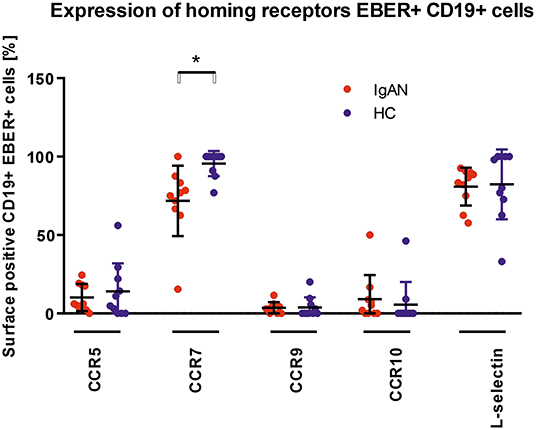
Figure 6. Analysis of changes in expression of trafficking molecules in EBV-infected CD19+ PBMC from IgAN and HC. Surface expression of selected trafficking molecules was analyzed in PBMC of IgAN patients (n = 10) and HC (n = 10) with regard to CD19+ EBER+ cells. Significant changes were detected for CCR7. Data are means ± SD. Numerical expression of all presented data (means ± SD) are provided in Supplementary Materials. P values were calculated using student's t-test or by Welch's ANOVA in instances where variances were unequal. Mann–Whitney U-test was used in instances where non-parametric test was required. *p < 0.05.
Discussion
Our studies support the involvement of EBV in the pathogenesis of IgAN. We found that B cells and their sIgA+ subpopulation in peripheral blood of IgAN patients displayed a significantly higher frequency of EBV infection than did cells of the same phenotype from non-IgAN patients and White healthy controls. Upon polyclonal stimulation in vitro, the EBV-infected sIgA+ cells secreted Gd-IgA1 that is bound by glycan-specific antibodies to form immune complexes that induce the glomerular injury of IgAN (1–3, 5, 7–20). Although about 40% of first-degree relatives of IgAN patients and some healthy individuals have increased serum Gd-IgA1 levels, most do not have any clinical manifestation of renal disease (1–3, 72–74). It is well established that the quantities and relative stoichiometric proportions of antigen (Gd-IgA1) to antibody (glycan-specific antibody) play the decisive role in formation of nephritogenic immune complexes (1–3).
The EBV-infected sIgA+ cells displayed increased expression of homing receptors for targeting the upper respiratory tract. Migration and tissue distribution of lymphocytes and other cell populations depend on expression of integrin and chemokine receptors on cell surfaces and their specific interactions with corresponding ligands on endothelial cells of post-capillary venules (56, 71, 75–79). For sIgA+ B cells and LB/PB in peripheral blood and IgA-producing plasma cells in mucosal or systemic lymphoid tissues, precursors of such cells originate in mucosal inductive sites to subsequently populate anatomically remote effector sites (56, 71, 75–79). Expression of homing receptors is profoundly influenced and altered by viruses, including EBV (80–84). The significantly altered expression of homing receptors of the EBV-infected sIgA+ cells provides a plausible basis for the common occurrence of synpharyngitic macroscopic hematuria in patients with IgAN.
Our study included healthy African Americans and White healthy controls who displayed key differences in phenotypic characteristics of B cells and serological findings. EBV had infected and remained preferentially associated with sIgM+ and sIgD+ rather than sIgA+ cells. This difference may account for the low frequency of IgAN in African Blacks and African Americans. EBV may infect B cells from the earliest stages of their development and in vitro may induce their differentiation into plasma cells which express only intracellular J chain but do not secrete Ig due to the lack of Ig gene rearrangement (85, 86). African Blacks and African Americans are infected with EBV early in childhood, after the protective effect of maternal IgG anti-EBV antibodies acquired passively through placental transport has waned (49, 50, 87–89). Naturally delayed maturation of the IgA system in early childhood manifests as absent or low levels of IgA in sera and secretions and low numbers of IgA-producing cells in tissues (54–58). In this setting, the possibility that EBV will infect such cells is greatly diminished. Instead, EBV infects B cells committed to produce Ig of other isotypes. Due to the ensuing induction of humoral and cellular immune responses in infected children (68, 70, 90–94), EBV is confined to the initially infected B cell population and will not later enter cells that secrete IgA. The mechanisms involved in the asymptomatic EBV infection of children have not been sufficiently explored. Levels of circulating CD8+ T cells with robust cytotoxic T cell activity are high in very young children, and then substantially diminish with age (90, 91, 93, 94). Detailed comparative epidemiological studies in Africa and the US (including African Americans and Whites) revealed that these markedly divergent temporal and racial differences in EBV infections are highly correlated with the socio-economic status (hygiene, family size, income, and education), stress, nutrition, co-infection, breastfeeding, magnitude of cellular and humoral immune responses, and genetic background (51–53, 63, 68, 87–89, 92, 95–97). Thus, early asymptomatic EBV infection with ensuing immune responses may be responsible for the well-documented low incidence of IgAN as well as infectious mononucleosis in African Blacks and African Americans (2, 3, 25–46, 48–71, 90, 96).
Another aspect that should be considered with respect to an association of EBV with IgAN concerns the familial incidence of EBV infection (50–52, 59–61, 96). In addition to the probably dominant role of genetic associations with IgAN (2, 3, 26, 97), EBV infection of relatives in close contact may contribute to the clustering of IgAN in some families.
Our results are based on the analyses of B cells from peripheral blood. The virus enters through the oro-pharyngeal mucosa and infects epithelial cells and B cells in Waldeyer's ring, collections of small lymphoid tissues dispersed in the oropharyngeal mucosa, and draining lymph nodes (51, 59–61, 63, 70, 79). Furthermore, Ig-producing cells in the nasopharyngeal and upper respiratory tract mucosae, palatine tonsils, and adenoids contain, in comparison to other mucosal tissues, almost exclusively IgA1-producing cells (46, 56, 79, 81). EBV-infected cells are detectable in B cells in Waldeyer's ring, draining lymph nodes, and peripheral blood, whereas other lymphoid tissues (bone marrow, spleen, and intestinal mucosa) do not contain EBV-infected cells (59–61, 63, 70, 92, 98–100). Because tonsillectomy is infrequently performed for IgAN patients in most countries, the use of B cells from peripheral blood is justifiable on the basis of their highly relevant phenotypic characteristics.
The participation of tonsillar B cells, LB, PB, and plasma cells in the pathogenesis of IgAN remains controversial (101, 102). Although relevant tonsillar abnormalities, including the increased production of polymeric Gd-IgA1, have been reported (103–109) it remains unclear whether the palatine tonsils are a major source of Gd-pIgA1; other compartments of Waldeyer's ring and draining lymph nodes may be involved. Because most of the EBER+ sIgA+ cells in our studies displayed LB and PB phenotypes, they may also contribute to the circulatory pool of Gd-IgA1.
Increased serum IgA1 levels are common in patients with IgAN (2, 3). Several cytokines participate in isotype switching from sIgM+ to sIgA+ in B cells and further differentiation to IgA-producing cells (110, 111). TGFβ appears to play the essential role in switching B cells from sIgM+ to sIgA+, and IL-10 is critical for terminal differentiation into IgA-secreting plasma cells (110–114). Increased serum levels of IL-10 are present in IgAN patients (114–116). As an IL-10 analog is within the EBV genome (117–120), it is plausible that virus-encoded IL-10 (vIL-10) and other EBV-induced immunoregulatory cytokines (121, 122), structurally and functionally homologous to their human counterparts, enhance terminal cellular differentiation and increase IgA production in IgAN patients.
EBV infects nearly all humans worldwide, but most individuals remain without apparent clinical manifestations. In this respect, EBV infection is, in its outcome, reminiscent of infections with other herpes viruses and human papilloma virus (123). In most infected individuals, these viruses establish a lifelong latent residence without associated clinical manifestations. However, in a genetically or immunologically susceptible population, EBV infection may display a highly variable outcome resulting in a broad spectrum of seemingly unrelated diseases (51, 59–63, 65–70, 90–92). We suggest that this spectrum now includes IgAN.
Our study has limitations. First, due to unavailability of relevant samples of blood from African American and African Black children, we could not assess the precise timing of EBV infection. Second, the results cannot be experimentally addressed, due to the unavailability of a relevant animal model. Although hominoid primates, chimpanzee and gorilla, possess IgA1 and IgA2 subclasses highly homologous in their protein and glycan structures, including the hinge region, to their human counterparts (21, 23), they are refractory to EBV infection. The Old World primates are infectable by EBV but produce IgA homologous to human IgA2 that lacks the hinge region with O-linked glycans of critical importance in the pathogenesis of IgAN (2, 3).
We propose that EBV is intimately involved in the characteristic racial prevalence of IgAN based on an age-dependent initiation of infection. This association may be related to the naturally delayed maturation of the IgA system (Figure 7). This novel concept is supported by the low incidence of IgAN and infectious mononucleosis in geographical locations with convincingly documented differences of EBV infections in very early childhood. Furthermore, the reported similarities in clinical and laboratory findings in patients with IgAN and IgA vasculitis with nephritis (Henoch-Schoenlein purpura nephritis) (3) suggest the possible involvement of EBV also in the latter disease. Our findings suggest that the ongoing efforts to develop vaccines (124–126) against infectious mononucleosis and EBV-associated malignancies may also reduce the incidence of IgAN.
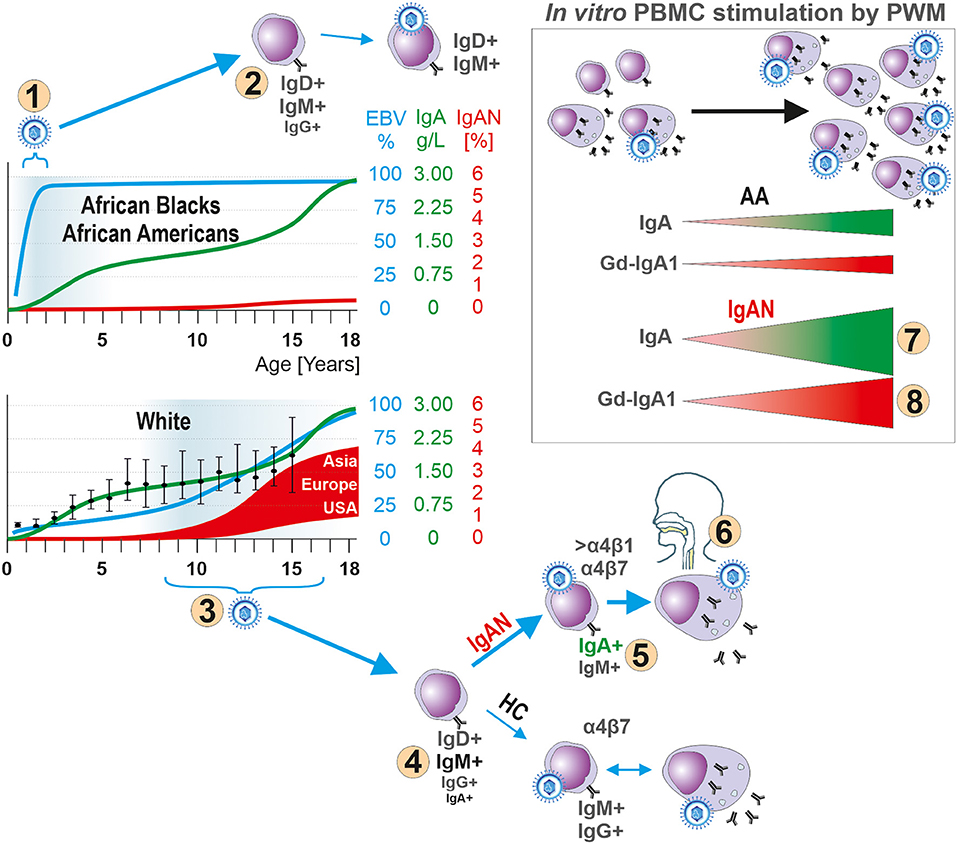
Figure 7. Hypothesis for the role of EBV in the pathogenesis of IgAN. In children, development of the IgA system displays natural, physiologically delayed, maturation as manifested by low levels of IgA in body fluids and few IgA-producing cells in lymphoid tissues. The early EBV infection of African Blacks and African Americans (number “1”) occurs at the time of immaturity of the IgA system, thereby reducing the chance for EBV to infect sIgA+ B cells due to their paucity. Instead, sIgM+ and sIgD+ B cells are preferentially infected (number “2”). The well-described humoral and cellular immune responses to a primary EBV exposure prevent spreading of EBV to other yet uninfected B cells, including sIgA+ cells, or infection of sIgA+ cells during a subsequent exposure to the virus. In contrast, Whites are infected with EBV at onset or during pubescence (number “3”), when sIgA+ cells are present, leading to entry of the virus into B cells, including sIgA+ cells (number “4”) which leads to increased synthesis of Gd-IgA1 that can cause IgAN (number “5”). In IgAN patients most EBV+ sIgA+ cells express Waldeyer's ring- and upper respiratory tract-homing receptor α4β1 (number “6”) thereby targeting the cells to sites where an infection is often associated with an episode of macroscopic hematuria in patients with IgAN. Indeed, in vitro PWM stimulation of EBER+ CD19+ cells from IgAN patients induces proliferation of IgA-producing cells (number “7”) and especially Gd-IgA1-producing cells (number “8”). If a clinical infection were to induce similar effect in vivo, the newly formed Gd-IgA1 may be the target for circulating autoantibodies to form immune complexes that deposit in the glomerular mesangium to induce the renal injury of IgAN. HC abbreviates for White healthy controls.
Data Availability Statement
The datasets generated for this study are available on request to the corresponding authors.
Ethics Statement
Written informed consent was obtained from all participants. The ethical committee of the University Hospital in Olomouc and University Hospital in Motol and the UAB Institutional Review Board, protocol #140108002, approved this study.
Author Contributions
JM and MR designed the research and wrote the paper. KZ, PK, ZM, and KK performed research. JZ, KM, KV, ZN, ZM, PH, and BJ performed research and analyzed data.
Conflict of Interest
BJ is a co-founder and holds equity in Reliant Glycosciences, LLC and has received financial support from IGA Nephropathy Foundation of America, clinical-study grants from Calliditas Pharmaceuticals and Retrophin Inc., a research grant from Alexion Pharmaceuticals, and an honorarium from Visterra Inc.
The remaining authors declare that the research was conducted in the absence of any commercial or financial relationships that could be construed as a potential conflict of interest.
Acknowledgments
The research was supported by the conceptual development of research organization grant (MHCZ-DRO, FNOl, 00098892) of the Ministry of Health Czech Republic and by Ministry of School, Youth, and Sport, Czech Republic grant CZ.02.1.01/0.0/0.0/16_025/0007397 awarded to MR, by Czech Science Foundation grant 17-11275S awarded to MR and JM and by National Institute of Diabetes and Digestive and Kidney Diseases of the National Institutes of Health grant R01DK99228 awarded to JM. We thank Ms. Courtany Grammer who assisted with the recruitment of African American controls.
Supplementary Material
The Supplementary Material for this article can be found online at: https://www.frontiersin.org/articles/10.3389/fimmu.2020.00267/full#supplementary-material
Abbreviations
ACE, Angiotensin-converting enzyme; ARB, Angiotensin receptor blocker; CIC, Circulating Immune Complexes; EBER, EBV-encoded small RNA; EBV, Epstein-Barr virus; Gd-IgA1, Galactose-deficient IgA1; IgA, Immunoglobulin A; IgAN, IgA nephropathy; LB, Lymphoblast; PB, Plasmablasts; PBMC, Peripheral blood mononuclear cells; pIgA, Polymeric IgA; PWM, Pokeweed mitogen; sIgA+, Surface IgA-positive B cell; vIL-10, virus-encoded IL-10.
References
1. Knoppova B, Reily C, Maillard N, Rizk DV, Moldoveanu Z, Mestecky J, et al. The origin and activities of IgA1-containing immune complexes in IgA nephropathy. Front Immunol. (2016) 7:117. doi: 10.3389/fimmu.2016.00117
2. Mestecky J, Raska M, Julian BA, Gharavi AG, Renfrow MB, Moldovenau Z. IgA nephropathy: molecular mechanisms of the disease. Annu Rev Pathol Mech Dis. (2013) 8:217–40. doi: 10.1146/annurev-pathol-011110-130216
3. Wyatt RJ, Julian BA. IgA nephropathy. N Engl J Med. (2013) 368:2402–14. doi: 10.1056/NEJMra1206793
4. Conley ME, Cooper MD, Michael AF. Selective deposition of immunoglobulin A1 in immunoglobulin A nephropathy, anaphylactoid purpura nephritis, and systemic lupus erythematosus. J Clin Invest. (1980) 66:1432–6. doi: 10.1172/JCI109998
5. Czerkinsky C, Koopman WJ, Jackson S, Collins JE, Crago SS, Schrohenloher RE, et al. Circulating immune complexes and immunoglobulin A rheumatoid factor in patients with mesangial immunoglobulin A nephropathies. J Clin Invest. (1986) 77:1931–8. doi: 10.1172/JCI112522
6. Mestecky J, Waldo FB, Britt WJ, Julian BA, Tomana M, van den Wall Bake AWL. Exogenous antigens deposited in the glomeruli of patients with IgA nephropathy. In: Sakai H, Sakai O, Nomoto Y, editors. Pathogenesis of IgA Nephropathy. Tokyo: Harcourt Brace Jovanovich (1990). p. 247–57.
7. Mestecky J, Tomana M, Crowley-Nowick PA, Moldoveanu Z, Julian BA, Jackson S. Defective galactosylation and clearance of IgA1 molecules as a possible etiopathogenic factor in IgA nephropathy. Contrib Nephrol. (1993) 104:172–82. doi: 10.1159/000422410
8. Allen AC. Abnormal glycosylation of IgA: is it related to the pathogenesis of IgA nephropathy? Nephrol Dial Transplant. (1995) 10:1121–4. doi: 10.1093/ndt/10.7.1121
9. Allen AC. Mesangial IgA1 in IgA nephropathy exhibits aberrant O-glycosylation: observations in three patients. Kidney Int. (2001) 60:969–73. doi: 10.1046/j.1523-1755.2001.060003969.x
10. Hiki Y, Kokubo T, Iwase H, Masaki Y, Sano T, Tanaka A, et al. Underglycosylation of IgA1 hinge plays a certain role for its glomerular deposition in IgA nephropathy. J Am Soc Nephrol. (1999) 10:760–9.
11. Rizk DV, Saha MK, Hall S, Novak L, Brown R, Huang ZQ, et al. (2019). Glomerular immunodepostis of patients with IgA nephropathy are enriched for IgG autoantibodies specific for galactose-deficient IgA1. J Am Soc Nephrol. 30:2017–26. doi: 10.1681/ASN.2018111156
12. Coppo R, Amore A. Aberrant glycosylation in IgA nephropathy (IgAN). Kidney Int. (2004) 65:1544–7. doi: 10.1111/j.1523-1755.2004.05407.x
13. Xu LX, Zhao MH. Aberrantly glycosylated serum IgA1 are closely associated with pathologic phenotypes of IgA nephropathy. Kidney Int. (2005) 68:167–72. doi: 10.1111/j.1523-1755.2005.00390.x
14. Lau KK, Wyatt RJ, Moldoveanu Z, Tomana M, Julian BA, Hogg RJ, et al. Serum levels of galactose-deficient IgA in children with IgA nephropathy and Henoch-Schoenlein purpura. Ped Nephrol. (2007) 22:2067–72. doi: 10.1007/s00467-007-0623-y
15. Suzuki H, Moldoveanu Z, Hall S, Brown R, Vu HL, Novak L, et al. IgA1-secreting cell lines from patients with IgA nephropathy produce aberrantly glycosylated IgA1. J Clin Invest. (2008) 118:629–39. doi: 10.1172/JCI33189
16. Moldoveanu Z, Wyatt RJ, Lee J, Tomana M, Julian BA, Mestecky J, et al. Patients with IgA nephropathy have increased serum galactose-deficient IgA1 levels. Kidney Int. (2007) 71:1148–54. doi: 10.1038/sj.ki.5002185
17. Shimozato S, Hiki Y, Odani H, Takahashi K, Yamamoto K, Sugiyama S. Serum under-galactosylated IgA1 is increased in Japanese patients with IgA nephropathy. Nephrol Dial Transplant. (2008) 23:1931–9. doi: 10.1093/ndt/gfm913
18. Tissandie E, Morelle W, Berthelot L, Vrtovsnik F, Daugas E, Walker F, et al. Both IgA nephropathy and alcoholic cirrhosis feature abnormally glycosylated IgA1 and soluble CD89-IgA and IgG-IgA complexes: common mechanisms for distinct diseases. Kidney Int. (2011) 80:1352–63. doi: 10.1038/ki.2011.276
19. Oortwijn BD, Roos A, Royle L, van Gijlswijk-Janssen DJ, Faber-Krol MC, Eijgenraam J-W, et al. Differential glycosylation of polymeric and monomeric IgA: a possible role in glomerular inflammation in IgA nephropathy. J Am Soc Nephrol. (2006) 17:3529–39. doi: 10.1681/ASN.2006040388
20. Huang ZQ, Raska M, Stewart TJ, Reily C, King RG, Crossman DK, et al. Somatic mutations modulate autoantibodies against galactose-deficient IgA1 in IgA nephropathy. J Am Soc Nephrol. (2016) 27:3278–84. doi: 10.1681/ASN.2014101044
21. Woof J, Mestecky J. Mucosal immunologlobulins. In: Mestecky J, Strober W, Russell MW, Kelsall BL, Cheroute H, Lambrecht BN, editors. Mucosal Immunology. 4th ed. Amsterdam: Elsevier/Academic Press (2015). p. 287–324.
22. Gharavi AG, Yan Y, Scolari F, Schena FP, Frasca GM, Ghiggeri GM, et al. IgA nephropathy, the most common cause of glomerulonephritis, is linked to 6q22-23. Nat Genet. (2000) 26:354–7. doi: 10.1038/81677
23. Julian BA, Waldo FB, Rifai A, Mestecky J. IgA nephropathy, the most common glomerulonephritis worldwide. A neglected disease in the United States? Am J Med. (1988) 84:129–32. doi: 10.1016/0002-9343(88)90019-8
24. Kiryluk K, Li Y, Scolari F, Sanna-Cherchi S, Choi M, Verbitsky M, et al. Discovery of new risk loci for IgA nephropathy implicates genes involved in immunity against intestinal pathogens. Nat Genet. (2014) 46:1187–96. doi: 10.1038/ng.3118
25. Schena FP, Nistor I. Epidemiology of IgA nephropathy: a global perspective. Semin Nephrol. (2018) 38:435–42. doi: 10.1016/j.semnephrol.2018.05.013
26. Kiryluk Y, Li S, Sanna-Cherchi S, Rohanizadegan M, Suzuki H, Eitner F, et al. Geographic differences in genetic susceptibility to IgA nephropathy: GWAS replication study and geospatial risk analysis. PLoS Genet. (2012) 8:e1002765. doi: 10.1371/journal.pgen.1002765
27. McGrogan A, Franssen CF, de Vries CS. The incidence of primary glomerulonephritis worldwide: a systematic review of the literature. Nephrol Dial Transplant. (2011) 26:414–30. doi: 10.1093/ndt/gfq665
28. Nair R, Walker PD. Is IgA nephropathy the commonest primary glomerulopathy among young adults in the USA? Kidney Int. (2006) 69:1455–8. doi: 10.1038/sj.ki.5000292
29. Galla JH, Kohaut EC, Alexander R, Mestecky J. Racial difference in the prevalence of IgA-associated nephropathies. Lancet. (1984) 2:522. doi: 10.1016/S0140-6736(84)92599-6
30. Jennette JC, Gallo GR, Baldwin DS. Low incidence of IgA nephropathy in blacks. Kidney Int. (1985) 28:944–50. doi: 10.1038/ki.1985.222
31. Neelakantappa K, Gallo GR, Baldwin DS. Immunoglobulin A nephropathy in blacks and homozygosity for the genetic marker A2m. Ann Intern Med. (1986) 104:287–8. doi: 10.7326/0003-4819-104-2-287_2
32. Seedat YK, Nathoo BC, Parag KB, Naiker IP, Ramsaroop R. IgA nephropathy in blacks and Indians of Natal. Nephron. (1988) 50:137–41. doi: 10.1159/000185144
34. Finlayson G, Alexander R, Juncos L, Schlein E, Teague P, Waldman R, et al. Immunoglobulin A glomerulonephritis: a clinicopathologic study. Lab Invest. (1975) 32:140–8.
35. Lee SM, Rao VM, Franklin WA, Schiffer MS, Aronson AJ, Spargo BH, et al. IgA nephropathy: morphologic predictors of progressive renal disease. Hum Pathol. (1982) 13:314–22. doi: 10.1016/S0046-8177(82)80221-9
36. Kher KK, Makker SP, Moorthy B. IgA nephropathy (Berger's disease) - a clinicopathologic study in children. Int J Pediatr Nephrol. (1983) 4:11–8.
37. Wyatt RJ, Julian BA, Bhathena DB, Mitchell BL, Holland NH, Malluch HH. IgA nephropathy: presentation, clinical course, and prognosis in children and adults. Am J Kidney Dis. (1984) 4:192–200. doi: 10.1016/S0272-6386(84)80071-2
38. Crowley-Nowick PA, Julian BA, Wyatt RJ, Galla JH, Wall BM, Warnock DG, et al. IgA nephropathy in blacks: studies of IgA2 allotypes and clinical course. Kidney Int. (1991) 39:1218–24. doi: 10.1038/ki.1991.154
39. Borok MZ, Nathoo KJ, Gabriel R, Porter KA. Clinicopathological features of Zimbabwean patients with sustained proteinuria. Cent Afr J Med. (1997) 43:152–8.
40. Wyatt RJ, Julian BA, Baehler RW, Stafford CC, McMorrow RG, Ferguson T, et al. Epidemiology of IgA nephropathy in central and eastern Kentucky for the period 1975 through 1994. J Am Soc Nephrol. (1998) 9:853–8.
41. Hastings MC, Moldoveanu Z, Julian BA, Novak J, Sanders JT, McGlothan KR, et al. Galactose-deficient IgA1 in African Americans with IgA nephropathy: serum levels and heritability. Clin J Am Soc Nephrol. (2010) 5:2069–74. doi: 10.2215/CJN.03270410
42. Moldoveanu Z, Egan ML, Mestecky J. Cellular origins of human polymeric and monomeric IgA: intracellular and secreted forms of IgA. J Immunol. (1984) 133:3156–62.
43. Mestecky J, McGhee JR. Immunoglobulin A (IgA): molecular and cellular interactions involved in IgA biosynthesis and immune response. Adv Immunol. (1987) 40:153–245. doi: 10.1016/S0065-2776(08)60240-0
44. Conley ME, Koopman WJ. In vitro regulation of IgA subclass synthesis. I. Discordance between plasma cell production and antibody secretion. J Exp Med. (1982) 156:1615–21. doi: 10.1084/jem.156.6.1615
45. Conley ME, Chan MA, Sigal NH. In vitro regulation of IgA subclass production. III. Selective transformation of IgA1 producing cells by Epstein-Barr virus. J Immunol. (1987) 138:1403–7.
46. Crago SS, Kutteh WH, Moro I, Allansmith MR, Radl J, Haaijman JJ, et al. Distribution of IgA1-, IgA2-, and J chain-containing cells in human tissues. J Immunol. (1984) 132:16–8.
47. Conley ME, Brown P. IgA subclass distribution in peripheral blood lymphocyte cultures stimulated with lipopolysaccharide, pokeweed mitogen or Epstein-Barr virus. Adv Exp Med Biol. (1987) 216B:1185–91.
48. Kutteh WH, Koopman WJ, Conley ME, Egan ML, Mestecky J. Production of predominantly polymeric IgA by human peripheral blood lymphocytes stimulated in vitro with mitogens. J Exp Med. (1980) 152:1424–9. doi: 10.1084/jem.152.5.1424
49. Biggar RJ, Henle W, Fleisher G, Bocker J, Lennette ET, Henle G. Primary Epstein-Barr virus infections in African infants. I. Decline of maternal antibodies and time of infection. Int J Cancer. (1978) 22:239–43. doi: 10.1002/ijc.2910220304
50. Biggar RJ, Henle G, Bocker J, Lennette ET, Fleisher G, Henle W. Primary Epstein-Barr virus infections in African infants. II. Clinical and serological observations during seroconversion. Int J Cancer. (1978) 22:244–50. doi: 10.1002/ijc.2910220305
51. Linde A. Eptsein-Barr virus. In: Murray PR, Baron EJ, Jorgensen MA, Pfaller RH, editors. Manual of Clinical Microbiology. Washington, DC: ASM Press (2003). p. 1331–40.
52. Dowd JB, Palermo T, Brite J, McDade TW, Aiello A. Seroprevalence of Epstein-Barr virus infection in U.S. children ages 6-19, 2003-2010. PLoS ONE. (2013) 8:e64921. doi: 10.1371/journal.pone.0064921
53. Condon LM, Cederberg LE, Rabinovitch MD, Liebo RV, Go JC, Delaney AS, et al. Age-specific prevalence of Epstein-Barr virus infection among Minnesota children: effects of race/ethnicity and family environment. Clin Infect Dis. (2014) 59:501–8. doi: 10.1093/cid/ciu342
55. Gleeson M, Cripps AW. Ontogeny of mucosal immunity and aging. In: Mestecky J, Strober W, Russel MW, Kelsall BL, Cheroutre H, Lambrecht BN, editors. Mucosal Immunology. 4th ed. Amsterdam: Academic Press/Elsevier (2015). p. 161–85.
56. Brandtzaeg P. The mucosal B cell system. In: Mestecky J, Strober W, Russel MW, Kelsall BL, Cheroutre H, Lambrecht BN, editors. Mucosal Immunology. 4th ed. Amsterdam: Academic Press/Elsevier (2015). p. 623–81.
57. Stiehm ER, Fudenberg HH. Serum levels of immune globulins in health and disease: a survey. Pediatrics. (1966) 37:715–27.
58. De Greef GE, Van Tol MJ, Van Den Berg JW, Staalduinen GJ, Janssen CJ, Radl J, et al. Serum immunoglobulin class and IgG subclass levels and the occurrence of homogeneous immunoglobulins during the course of ageing in humans. Mech Ageing Dev. (1992) 66:29–44. doi: 10.1016/0047-6374(92)90071-K
59. Young LS. Epstein-Barr virus (Herpesviridae). In: Granoff A, Webster RG, editors. Encyclopedia of Virology. San Diego, CA: Academic Press (1999). p. 487–501.
60. Rowe M. Epstein-Barr virus, infection and immunity. In: Delves PJ, Roitt IM, editors. Encyclopedia of Immunology. San Diego, CA: Academic Press (1998). p. 828–33.
61. Cohen JI. Epstein-Barr virus infection. N Engl J Med. (2000) 343:481–92. doi: 10.1056/NEJM200008173430707
62. Crawford DH. Biology and disease associations of Epstein-Barr virus. Philos Trans R Soc Lond B Biol Sci. (2001) 356:461–73. doi: 10.1098/rstb.2000.0783
63. Thorley-Lawson DA. Epstein-Barr virus: exploiting the immune system. Nat Rev Immunol. (2001) 1:75–82. doi: 10.1038/35095584
64. Ehlin-Henriksson B, Zou JZ, Klein G, Ernberg I. Epstein-Barr virus genomes are found predominantly in IgA-positive B cells in the blood of healthy carriers. Int J Cancer. (1999) 83:50–4. doi: 10.1002/(sici)1097-0215(19990924)83:1<50::aid-ijc10>3.0.co;2-1
65. Hsu JL, Glaser SL. Epstein-barr virus-associated malignancies: epidemiologic patterns and etiologic implications. Crit Rev Oncol Hematol. (2000) 34:27–53. doi: 10.1016/S1040-8428(00)00046-9
66. Ascherio A, Munger KL. EBV and Autoimmunity. Curr Top Microbiol Immunol. (2015) 390:365–85. doi: 10.1007/978-3-319-22822-8_15
67. Draborg AH, Duus K, Houen G. Epstein-Barr virus in systemic autoimmune diseases. Clin Dev Immunol. (2013) 2013:535738. doi: 10.1155/2013/535738
68. Hislop AH, Duus K, Houen G. Cellular responses to viral infection in humans: lessons from Epstein-Barr virus. Annu Rev Immunol. (2013) 25:587–617. doi: 10.1146/annurev.immunol.25.022106.141553
69. Harley JB, Chen X, Pujato M, Miller D, Maddox A, Forney C, et al. Transcription factors operate across disease loci, with EBNA2 implicated in autoimmunity. Nature Genet. (2018) 50:699–707. doi: 10.1038/s41588-018-0102-3
70. Tangye SG, Palendira U, Edwards ES. Human immunity against EBV-lessons from the clinic. J Exp Med. (2017) 214:269–83. doi: 10.1084/jem.20161846
71. Youngman KR, Lazarus NH, Butcher EC. Lymphocyte homing: chemokines and adhesion molecules in T cell and IgA plasma cell localization in the mucosal immune system. In: Mestecky J, Lamm ME, Strober W, Bienenstock J, McGhee JR, Mayer L, editors. Mucosal Immunology. 3rd ed. Amsterdam, Boston, MA: Academic Press/Elsevier (2005). p. 667–80.
72. Tomana M, Novak J, Julian BA, Matousovic K, Konecny K, Mestecky J. Circulating immune complexes in IgA nephropathy consist of IgA1 with galactose-deficient hinge region and antiglycan antibodies. J Clin Invest. (1999) 104:73–81. doi: 10.1172/JCI5535
73. Gharavi AG, Moldoveanu Z, Wyatt RJ, Barker CV, Woodford SY, Lifton RP, et al. Aberrant IgA1 glycosylation is inherited in familial and sporadic IgA nephropathy. J Am Soc Nephrol. (2008) 19:1008–14. doi: 10.1681/ASN.2007091052
74. Kiryluk K, Moldoveanu Z, Sanders JT, Eison TM, Suzuki H, Julian BA, et al. Aberrant glycosylation of IgA1 is inherited in both pediatric IgA nephropathy and Henoch-Schönlein purpura nephritis. Kidney Int. (2011) 80:79–87. doi: 10.1038/ki.2011.16
75. Fernandes JR, Snider DP. Polymeric IgA-secreting and mucosal homing pre-plasma cells in normal human peripheral blood. Int Immunol. (2010) 22:527–40. doi: 10.1093/intimm/dxq037
76. Pakkkanen SH, Kantele JM, Moldoveanu Z, Hedges S, Hakkinen M, Mestecky J, et al. Expression of homing receptors on IgA1 and IgA2 plasmablasts in blood reflects differential distribution of IgA1 and IgA2 in various body fluids. Clin Vaccine Immunol. (2010) 17:393–401. doi: 10.1128/CVI.00475-09
77. Mikhak Z, Agace WW, Luster AD. Lymphocyte in trafficking to mucosal tissue. In: Mestecky J, Strober W, Russell MW, Kelsall BL, Cheroutre H, Lambrecht BN, editors. Mucosal Immunology. 4th ed. Amsterdam: Academic Press/Elsevier (2015). p. 805–30.
78. Dey A, Molodecky NA, Verma H, Sharma P, Yang JS, Saletti G, et al. Human circulating antibody-producing B cell as a predictive measure of mucosal immunity to poliovirus. PLoS ONE. (2016) 11:e0146010. doi: 10.1371/journal.pone.0146010
79. Brandtzaeg P. Immunobiology of the tonsils and adenoids. In: Mestecky J, Strober W, Russell MW, Kelsall BL, Cheroutre H, Lambrecht BN, editors. Mucosal Immunology. 4th ed. Amsterdam: Academic Press/Elsevier (2015). p. 1985–2016.
80. Nakayama T, Fujisawa R, Izawa D, Hieshima K, Takada K, Yoshie O, et al. Human B cells immortalized with Epstein-Barr virus upregulate CCR6 and CCR10 and downregulate CXCR4 and CXCR5. J Virol. (2002) 76:3072–7. doi: 10.1128/JVI.76.6.3072-3077.2002
81. Johansen FE, Baekkevold ES, Carlsen HS, Farstad IN, Soler D, Brandtzaeg P. Regional induction of adhesion molecules and chemokine receptors explains disparate homing of human B cells to systemic and mucosal effector sites: dispersion from tonsils. Blood. (2005) 106:593–600. doi: 10.1182/blood-2004-12-4630
82. Rincon J, Prieto J, Patarroyo M. Expression of integrins and other adhesion molecules in Epstein-Barr virus-transformed B lymphoblastoid cells and Burkitt's lymphoma cells. Int J Cancer. (1992) 51:452–8. doi: 10.1002/ijc.2910510319
83. Ehlin-Henriksson B, Mowafi F, Klein G, Nilsson A. Epstein-Barr virus infection negatively impacts the CXCR4-dependent migration of tonsillar B cells. Immunology. (2006) 117:379–85. doi: 10.1111/j.1365-2567.2005.02311.x
84. Dorner M, Zucol F, Alessi D, Haerle SK, Bossart W, Weber M, et al. Beta1 integrin expression increases susceptibility of memory B cells to Epstein-Barr virus infection. J Virol. (2010) 84:6667–77. doi: 10.1128/JVI.02675-09
85. Katamine S, Otsu M, Tada K, Tsuchiya S, Sato T, Ishida N, et al. Epstein-Barr virus transforms precursor B cells even before immunoglobulin gene rearrangements. Nature. (1984) 309:369–72. doi: 10.1038/309369a0
86. Kubagawa H, Burrows PD, Grossi CE, Mestecky J, Cooper MD. Precursor B cells transformed by Epstein-Barr virus undergo sterile plasma-cell differentiation: J-chain expression without immunoglobulin. Proc Natl Acad Sci U.S.A. (1988) 85:875–9. doi: 10.1073/pnas.85.3.875
87. Daud II, Coleman CB, Smith NA, Ogolla S, Simbiri K, Bukusi EA, et al. Breast milk as a potential source of Epstein-Barr virus transmission among infants living in a malaria-endemic region of Kenya. J Infect Dis. (2015) 212:1735–42. doi: 10.1093/infdis/jiv290
88. Junker AK, Thomas EE, Radcliffe A, Forsyth RB, Davidson AG, Rymo L. Epstein-Barr virus shedding in breast milk. Am J Med Sci. (1991) 302:220–3. doi: 10.1097/00000441-199110000-00005
89. Lee HJ, Elo IT, McCollum KF, Culhane JF. Racial/ethnic differences in breastfeeding initiation and duration among low-income, inner-city mothers. Soc Sci Q. (2009) 90:1251–71. doi: 10.1111/j.1540-6237.2009.00656.x
90. Pender MP. CD8+ T-cell deficiency, Epstein-Barr virus infection, vitamin D deficiency, and steps to autoimmunity: a unifying hypothesis. Autoimmune Dis. (2012) 2012:189096. doi: 10.1155/2012/189096
91. Pender MP, Csurhes PA, Pfluger CM, Burrows SR. CD8 T cell deficiency impairs control of Epstein–Barr virus and worsens with age in multiple sclerosis. J Neurol Neurosurg Psychiatry. (2012) 83:353–4. doi: 10.1136/jnnp-2011-300213
92. Evans AS, Niederman JC. Epstein-Barr virus. In: Evans AS, editor. Viral Infections of Humans: Epidemiology and Control. (New York, NY: Plenum Medical Book Co) (1982). p. 253–82.
93. Comans-Bitter WM, de Groot R, van den Beemd R, Neijens HJ, Hop WC, Groeneveld K, et al. Immunophenotyping of blood lymphocytes in childhood. Reference values for lymphocyte subpopulations. J Pediatr. (1997) 130:388–93. doi: 10.1016/S0022-3476(97)70200-2
94. Fornasieri A, Sinico R, Fiorini G, Goldaniga D, Colsanati G, Vendemia F, et al. T-lymphocyte subsets in primary and secondary glomerulonephritis. Proc Eur Dial Transplant Assoc. (1983) 19:635–41.
95. Chiang KF, Sharma AJ, Nelson JM, Olson CK, Perrine CG. Receipt of breast milk by gestational age - United States, 2017. MMWR Morb Mortal Wkly Rep. (2019) 68:489–93. doi: 10.15585/mmwr.mm6822a1
96. Nye FJ. Social class and infectious mononucleosis. J Hyg. (1973) 71:145–9. doi: 10.1017/S0022172400046313
97. Kiryluk K, Novak J. The genetics and immunobiology of IgA nephropathy. J Clin Invest. (2014) 124:2325–32. doi: 10.1172/JCI74475
98. Babcock GJ, Decker LL, Freeman RB, Thorley-Lawson DA. Epstein-Barr virus-infected resting memory B cells, not proliferating lymphoblasts, accumulate in the peripheral blood of immunosuppressed patients. J Exp Med. (1999) 190:567–76. doi: 10.1084/jem.190.4.567
99. Tierney RJ, Steven N, Young LS, Rickinson AB. Epstein-Barr virus latency in blood mononuclear cells: analysis of viral gene transcription during primary infection and in the carrier state. J Virol. (1994) 68:7374–85. doi: 10.1128/JVI.68.11.7374-7385.1994
100. Miyashita EM, Yang B, Lam KM, Crawford DH, Thorley-Lawson DA. A novel form of Epstein-Barr virus latency in normal B cells in vivo. Cell. (1995) 80:593–601. doi: 10.1016/0092-8674(95)90513-8
102. Kawamura T. Tonsillectomy is a valuable treatment option in IgA nephropathy. Kidney Dis. (2018) 4:167.
103. Béné MC, Faure GC, Hurault de Ligny B, de March AK. Clinical involvement of the tonsillar immune system in IgA nephropathy. Acta Otolaryngol Suppl. (2004) 124:10–4 doi: 10.1080/03655230410003369
104. Harper SJ, Allen AC, Bene MC, Pringle JH, Faure G, Lauder I, et al. Increased dimeric IgA-producing B cells in tonsils in IgA nephropathy determined by in situ hybridization for J chain mRNA. Clin Exp Immunol. (1995) 101:442–8. doi: 10.1111/j.1365-2249.1995.tb03132.x
105. Egido J, Blasco R, Lozano L, Sancho J, Garcia-Hoyo R. Immunological abnormalities in the tonsils of patients with IgA nephropathy: inversion in the ratio of IgA: IgG bearing lymphocytes and increased polymeric IgA synthesis. Clin Exp Immunol. (1984) 57:101–6.
106. Horie A, Hiki Y, Odani H, Yasuda Y, Takahashi M, Kato M, et al. IgA1 molecules produced by tonsillar lymphocytes are under-O-glycosylated in IgA nephropathy. Am J Kidney Dis. (2003) 42:486–96. doi: 10.1016/S0272-6386(03)00743-1
107. Itoh A, Iwase H, Takatani T, Nakamura I, Hayashi M, Oba K, et al. Tonsillar IgA1 as a possible source of hypoglycosylated IgA1 in the serum of IgA nephropathy patients. Nephrol Dial Transplant. (2003) 18:1108–14. doi: 10.1093/ndt/gfg108
108. Nakata J, Suzuki Y, Suzuki H, Sato D, Kano T, Yanagawa H, et al. Changes in nephritogenic serum galactose-deficient IgA1 in IgA nephropathy following tonsillectomy and steroid therapy. PLoS ONE. (2014) 9:e89707. doi: 10.1371/journal.pone.0089707
109. Meng H, Ohtake H, Ishida A, Ohta N, Kakehata S, Yamakawa M. IgA production and tonsillar focal infection in IgA nephropathy. J Clin Exp Hematop. (2012) 52:161–70. doi: 10.3960/jslrt.52.161
110. Cerutti A. The regulation of IgA class switching. Nat Rev Immunol. (2008) 8:421–34. doi: 10.1038/nri2322
111. Banchereau J, Bazan F, Blanchard D, Briere F, Galizzi JP, Vankooten C, et al. The CD40 antigen and its ligand. Annu Rev Immunol. (1994) 12:881–922. doi: 10.1146/annurev.iy.12.040194.004313
112. Defrance T, Vanbervliet B, Briere F, Durand I, Rousset F, Banchereau J. Interleukin-10 and transforming growth-factor beta cooperate to induce anti-CD40 activated naïve human B-cells to secrete immunoglobulin-A. J Exp Med. (1992) 175:671–82. doi: 10.1084/jem.175.3.671
113. Rousset F, Garcia E, Defrance T, Peronne C, Vezzio N, Hsu DH, et al. Interleukin 10 is a potent growth and differentiation factor for activated human B lymphocytes. Proc Natl Acad Sci U.S.A. (1992) 89:1890–3. doi: 10.1073/pnas.89.5.1890
114. Zhang Z, Wang H, Zhang L, Crew R, Zhang N, Liu X, et al. Serum levels of soluble ST2 and IL-10 are associated with disease severity in patients with IgA nephropathy. J Immunol Res. (2016) 2016:6540937. doi: 10.1155/2016/6540937
115. Li Z, Wang C, Liu L, Wang H, Lv L, Wang R. Association between interleukin-10 gene polymorphism and development of IgA nephropathy in a Chinese population. Int J Clin Exp Pathol. (2016) 9:8663–8.
116. Yano N, Endoh M, Nomoto Y, Sakai H, Fadden K, Rifai A. Phenotypic characterization of cytokine expression in patients with IgA nephropathy. J Clin Immunol. (1997) 17:396–403. doi: 10.1023/A:1027368308453
117. Burdin N, Peronne C, Banchereau J, Rousset F. Epstein-Barr virus transformation induces B lymphocytes to produce human interleukin 10. J Exp Med. (1993) 177:295–304. doi: 10.1084/jem.177.2.295
118. Jochum S, Moosmann A, Lang S, Hammerschmidt W, Zeidler R. The EBV immunoevasins vIL-10 and BNLF2a protect newly infected B cells from immune recognition and elimination. PLoS Pathog. (2012) 8:e1002704. doi: 10.1371/journal.ppat.1002704
119. Minnicelli C, Barros MH, Klumb CE, Romano SO, Zalcberg IR, Hassan R. Relationship of Epstein-Barr virus and interleukin 10 promoter polymorphisms with the risk and clinical outcome of childhood Burkitt lymphoma. PLoS ONE. (2012) 7:e46005. doi: 10.1371/journal.pone.0046005
120. Moore KW, Vieira P, Fiorentino DF, Trounstine ML, Khan TA, Mosmann TR. Homology of cytokine synthesis inhibitory factor (IL-10) to the Epstein-Barr virus gene BCRFI. Science. (1990) 248:1230–4. doi: 10.1126/science.2161559
121. Panikkar A, Smith C, Hislop A, Tellam N, Dasari V, Hogquist KA, et al. Cytokine-mediated loss of blood dendritic cells during Epstein-Barr virus-associated acute infectious mononucleosis: Implication for immune dysregulation. J Infect Dis. (2015) 212:1957–61. doi: 10.1093/infdis/jiv340
122. Balfour HH Jr, Odumade OA, Schemling DO, Mullan BD, Ed JA, Knight JA, et al. (2013). Behavioral, virologic, and immunologic factors associated with acquisition and severity of primary Epstein-Barr virus infection in university students. J Infect Dis. 207:80–8. doi: 10.1093/infdis/jis646
123. Forman D, de Martel C, Lacey CJ, Soerjomataram I, Lortet-Tieulent L, Bruni L, et al. Global burden of human papillomavirus and related diseases. Vaccine. (2012) 30 Suppl 5:F12–23. doi: 10.1016/j.vaccine.2012.07.055
124. Cohen JI. Vaccine Development for Epstein-Barr virus. Adv Exp Med Biol. (2018) 1045:477–93. doi: 10.1007/978-981-10-7230-7_22
125. Alonso-Padilla J, Lafuente EM, Reche PA. Computer-aided design of an epitope-based vaccine against Epstein-Barr virus. J Immunol Res. (2017) 2017:9363750. doi: 10.1155/2017/9363750
Keywords: IgA, EBV-Epstein-Barr virus, racial distribution, IgA nephropathy, mucosal immunology
Citation: Zachova K, Kosztyu P, Zadrazil J, Matousovic K, Vondrak K, Hubacek P, Julian BA, Moldoveanu Z, Novak Z, Kostovcikova K, Raska M and Mestecky J (2020) Role of Epstein-Barr Virus in Pathogenesis and Racial Distribution of IgA Nephropathy. Front. Immunol. 11:267. doi: 10.3389/fimmu.2020.00267
Received: 01 November 2019; Accepted: 03 February 2020;
Published: 28 February 2020.
Edited by:
Cecil Czerkinsky, Institut National de la Santé et de la Recherche Médicale (INSERM), FranceReviewed by:
Hiromi Kubagawa, Deutsches Rheuma-Forschungszentrum (DRFZ), GermanyLudmila Podracka, Comenius University, Slovakia
Copyright © 2020 Zachova, Kosztyu, Zadrazil, Matousovic, Vondrak, Hubacek, Julian, Moldoveanu, Novak, Kostovcikova, Raska and Mestecky. This is an open-access article distributed under the terms of the Creative Commons Attribution License (CC BY). The use, distribution or reproduction in other forums is permitted, provided the original author(s) and the copyright owner(s) are credited and that the original publication in this journal is cited, in accordance with accepted academic practice. No use, distribution or reproduction is permitted which does not comply with these terms.
*Correspondence: Jiri Mestecky, bWVzdGVja3lAdWFiLmVkdQ==; Milan Raska, bWlsYW4ucmFza2FAdXBvbC5jeg==