 Fábio S. Zanuzzo
 Anne Beemelmanns
 Jennifer R. Hall
 Matthew L. Rise
 Anthony K. Gamperl
- 1Department of Ocean Sciences, Memorial University, St. John's, NL, Canada
- 2Aquatic Research Cluster, CREAIT Network, Ocean Sciences Centre, Memorial University, St. John's, NL, Canada
Climate change is predicted to increase water temperatures and decrease oxygen levels in freshwater and marine environments, however, there is conflicting information regarding the extent to which these conditions may impact the immune defenses of fish. In this study, Atlantic salmon were exposed to: (1) normoxia (100–110% air saturation) at 12°C; (2) an incremental temperature increase (1°C per week from 12 to 20°C), and then held at 20°C for an additional 4 weeks; and (3) “2” with the addition of moderate hypoxia (~65–75% air saturation). These conditions realistically reflect what farmed salmon in some locations are currently facing, and future conditions in Atlantic Canada and Europe, during the summer months. The salmon were sampled for the measurement of head kidney constitutive anti-bacterial and anti-viral transcript expression levels, and blood parameters of humoral immune function. Thereafter, they were injected with either the multi-valent vaccine Forte V II (contains both bacterial and viral antigens) or PBS (phosphate-buffer-saline), and the head kidney and blood of these fish were sampled at 6, 12, 24, and 48 h post-injection (HPI). Our results showed that: (1) neither high temperature, nor high temperature + moderate hypoxia, adversely affected respiratory burst, complement activity or lysozyme concentration; (2) the constitutive transcript expression levels of the anti-bacterial genes il1β, il8-a, cox2, hamp-a, stlr5-a, and irf7-b were up-regulated by high temperature; (3) while high temperature hastened the peak in transcript expression levels of most anti-bacterial genes by 6–12 h following V II injection, it did not affect the magnitude of changes in transcript expression; (4) anti-viral (viperin-b, mx-b, and isg15-a) transcript expression levels were either unaffected, or downregulated, by acclimation temperature or V II injection over the 48 HPI; and (5) hypoxia, in addition to high temperature, did not impact immune transcript expression. In conclusion, temperatures up to 20°C, and moderate hypoxia, do not impair the capacity of the Atlantic salmon's innate immune system to respond to bacterial antigens. These findings are surprising, and highlight the salmon's capacity to mount robust innate immune responses (i.e., similar to control fish under optimal conditions) under conditions approaching their upper thermal limit.
Introduction
According to the Intergovernmental Panel on Climate Change Assessment report of 2014 and the special report of 2019 (1), the surface temperature of the world's oceans is expected to increase by 1–3°C over the next 80 years [also see Collins et al. (2)]. Therefore, understanding how elevated temperatures affect marine species is critical, and a growing focus worldwide (3–6). In addition, reductions in water dissolved oxygen content (hypoxia) are expected to impact the health and distribution of marine organisms as the frequency and severity of hypoxic events are also increasing (7–9). Marine aquaculture sites are particularly vulnerable to changes in these environmental conditions, as they are generally in coastal regions, and the fish are confined and cannot seek out conditions that might be more favorable / optimal. For example, temperatures have recently exceeded 22–23°C in Atlantic salmon (Salmo salar) sea-cages in Tasmania, water temperatures often reach 18–20°C during the summer in Canada and Norway, and it is not uncommon for oxygen levels to drop below 70% of air saturation during these periods (10–12). These changes in environmental conditions represent a considerable challenge for the aquaculture industry as they can affect the growth, health and welfare of fish held in sea-cages [e.g., see Wade et al. (13)].
A properly functioning immune system is key to the ability of fish to resist infection by bacteria and viruses, and it is well established that water temperature modulates fish immune function (14–16). However, there is contradicting information regarding the impact(s) of high temperature on the ability of fish to mount an effective defense against pathogens [e.g., see Makrinos and Bowden (15)]. For example, while several studies have reported that high temperatures have a beneficial effect (17–24), a number of studies have demonstrated a relatively small effect (25–27), the opposite effect (19, 28–32), or conflicting and complex results (33, 34). The reasons for these disparate results may be, in part, related to the rate of temperature increase (i.e., acute vs. chronic), the range of temperatures used (i.e., whether they exceeded the physiological/optimum range for that particular species), as well as the particularities/complexity of the teleost immune system; i.e., some fish appear to rely more on non-specific (innate) responses at low temperatures, whereas at higher temperatures they may depend more on specific (acquired) immunity (15, 26, 35, 36). Thus, it is unclear whether high temperatures impair the fish's ability to respond to an infection, especially under the thermal conditions that cultured fish such as Atlantic salmon may realistically face during the summer months; i.e., an incremental temperature increase to levels that approach or exceed their upper lethal limit (10, 13, 37).
Hypoxia has been associated with disease outbreaks (38–40), and is also known to adversely impact fish immune function. Rodriguez et al. (41) reported that acute hypoxia reduced the constitutive transcript levels of ifna and mx in the kidney of Atlantic salmon. Chronic and moderate intermittent hypoxia reduce leucocyte respiratory burst in this species (42). Finally, Kvamme et al. (43) exposed post-smolt Atlantic salmon to chronic hypoxia and then subjected them to a viral or bacterial immune-stimulation, and showed that while hypoxia reduced or delayed the expression of immune-related genes the overall effects were not large. However, Kvamme et al. (43) compared “control” fish kept at 74 ± 3.6% of air saturation with those kept at 52 ± 5.2% (mean ± SD) of air saturation, and the oxygen level that the “control” fish were exposed to is already considered hypoxic for this species.
Very few authors have examined the impact of the combination of moderate hypoxia and high temperatures on fish immune responses (44, 45), and no studies have investigated the impact of moderate hypoxia in combination with incremental increases in temperatures as high as 20°C on Atlantic salmon immune function; conditions that appear to be prevalent in Tasmania (10, 13) and led to mass mortalities at salmon sea-cage sites in Newfoundland in the summer of 2019 (46). Hence, in this study, Atlantic salmon were subjected to an incremental temperature increase (1°C week per week, from 12 to 20°C), then 4 weeks at 20°C, under normoxia or moderate hypoxia (~70% air saturation). Thereafter, the fish's innate immune function was evaluated prior to, and 6, 12, 24, and 48 h after, they were given an intraperitoneal (IP) injection of the multivalent vaccine Forte V II.
Materials and Methods
This study was conducted in accordance with the guidelines of the Canadian Council on Animal Care, and approved by the Institutional Animal Care Committee of Memorial University of Newfoundland, Canada (Protocol #16-90 KG). This research was conducted as part of the Mitigating the Impact of Climate-Related Challenges on Salmon Aquaculture (MICCSA) project, and the effects of these experimental protocols on growth characteristics (specific growth rate, food consumption, feed conversion ratio etc.) and mortality have recently been published (37).
Animals
Atlantic salmon of Saint John River strain were obtained from Northern Harvest Sea Farms Ltd., and initially held at the Dr. Joe Brown Aquatic Research Building (JBARB; Ocean Sciences Centre, MUN) in 3,000 L circular tanks for 1 month. During this period, seawater temperature and oxygen levels were 10 ± 1°C and >95% of air saturation, respectively, photoperiod was 12 h light: 12 h dark, and the fish were fed a commercial salmonid diet (EWOS Dynamic S, EWOS Canada Ltd, British Columbia, Canada) at a ration of 1% body weight day−1. After acclimation, the fish were netted, lightly anesthetized in seawater containing tricaine methanesulfonate (AquaLife TMS, 0.1 g L−1; Syndel Laboratories Ltd, Nanaimo, BC, Canada), weighed, and had a PIT (Passive Integrated Transponder) tag implanted in their peritoneal cavity for individual identification. The fish were then returned to the same tanks for approximately 1 month.
Experimental Design
A total of 360 salmon were moved from the JBARB, and randomly distributed into six 2200 L circular experimental tanks (60 fish tank−1) located in the Laboratory for Atlantic Salmon and Climate Change Research (LASCCR, Ocean Sciences Centre, St. John's, NL, Canada). After acclimating to the experimental tanks for 10 days, all fish were netted, lightly anesthetized (0.1 g L−1 TMS), and had their initial mass recorded (137.6 ± 1.3 g; mean ± SE). The fish were then allowed to recover for 15 days at 12 ± 1°C at an oxygen level of >95% air sat (photoperiod of 14 h light: 10 h dark). After this period, duplicate tanks were split into three treatments: control (CN), warm and normoxia (WN), and warm and hypoxia (WH). One header tank was designated to supply the control tanks, and the other header tank to supply the WN and WH tanks. For the control treatment, temperature, and oxygen levels were kept constant during the entire experiment at 12°C and >95% (air sat.), respectively. For the WH treatment, the oxygen level in the tanks was gradually lowered to 70% (air sat.) over a period of 2 weeks by reducing oxygenation in the header tank that fed these tanks, whereas oxygen levels in the WN treatment was maintained at 100–110% oxygen by placing oxygen diffusers in these tanks. Thereafter, the temperature in the WN and WH tanks was gradually increased from 12 to 20°C (by 1°C per week); the weekly temperature increments were 0.3°C (from days 1 to 3), 0.1°C on day 4, and then no change from days 5–7. When the water temperature in the WN and WH tanks reached 20°C, the fish were acclimated to these conditions for an additional 4 weeks. The salmon were carefully fed by hand twice daily to satiation (at 9:00 and 15:00) with commercial salmon feed (as described above), with feeding stopped when a few pellets began to accumulate on the bottom of each tank. See Supplementary Information in Gamperl et al. (37) for more specific information on these experimental protocols.
The tanks were supplied with seawater at 15 L min−1 (flow-through system) at the desired temperature. Seawater temperatures were controlled with the aid of large plate heat-exchangers that delivered heated seawater to a vacuum degasser that supplied each header tank, and tank temperatures and dissolved oxygen levels in all the experimental tanks were monitored every morning (YSI, ProODO, OH, USA). In addition, a Fibox 3 (LCD V3) meter with a pre-calibrated dipping probe (PreSens; Regensburg, Germany), and a computer running LCDPST3 Version 2.0.1.0 software (PreSens), were used to monitor dissolved oxygen levels in one of the hypoxic tanks continuously [see Gamperl et al. (37)]. Ammonia and nitrite levels in the tanks were also monitored (LaMotte test kit, Maryland, USA) on a weekly basis, and remained within acceptable levels (i.e., below 0.02 and 0.5 mg L−1, respectively).
After the WN and WH fish had been at 20°C for 4 weeks, eight fish per treatment (4 fish tank−1) were sampled (see below for details) for the assessment of basal (constitutive) immune function and head kidney transcript expression (i.e., at time 0). Two days after this initial sampling, the remaining fish in the tank were anesthetized in seawater containing 0.1 g L−1 TMS and then: (1) given an IP injection of Forte V II (Elanco Limited, Charlottetown, PEI, Canada; see additional information below) or phosphate-buffered-saline (PBS; sham-injected); and (2) injected with fluorescent elastomer (VIE; Northwest Marine Technology Inc., Ancortes, WA, USA) in the cartilage just behind the eye, with different colors for Forte V II (red) and PBS (yellow). This procedure allowed for the quick identification of PBS or Forte V II-fish in the tanks, and was chosen to minimize inflammation as this tissue is poorly vascularized. Following the IP and VIE procedures, the fish were returned to the same tank. Four fish (N = 8) per tank for each group (CN-PBS, CN-Forte V II; WN-PBS, WN-Forte V II; WH-PBS and WH-Forte V II) had their spleen and head kidney sampled at 6, 12, 24, and 48 h post-injection (HPI). At 24 HPI, blood was also collected by caudal puncture to measure respiratory burst, the hemolytic activity of the alternative pathway of the complement system and plasma lysozyme concentration, and the spleen was weighed to calculate spleen-somatic index. Finally, we measured head kidney transcript expression levels of 12 genes (see Table 1) involved in the salmon's anti-bacterial and/or anti-viral response in all groups at all time points.
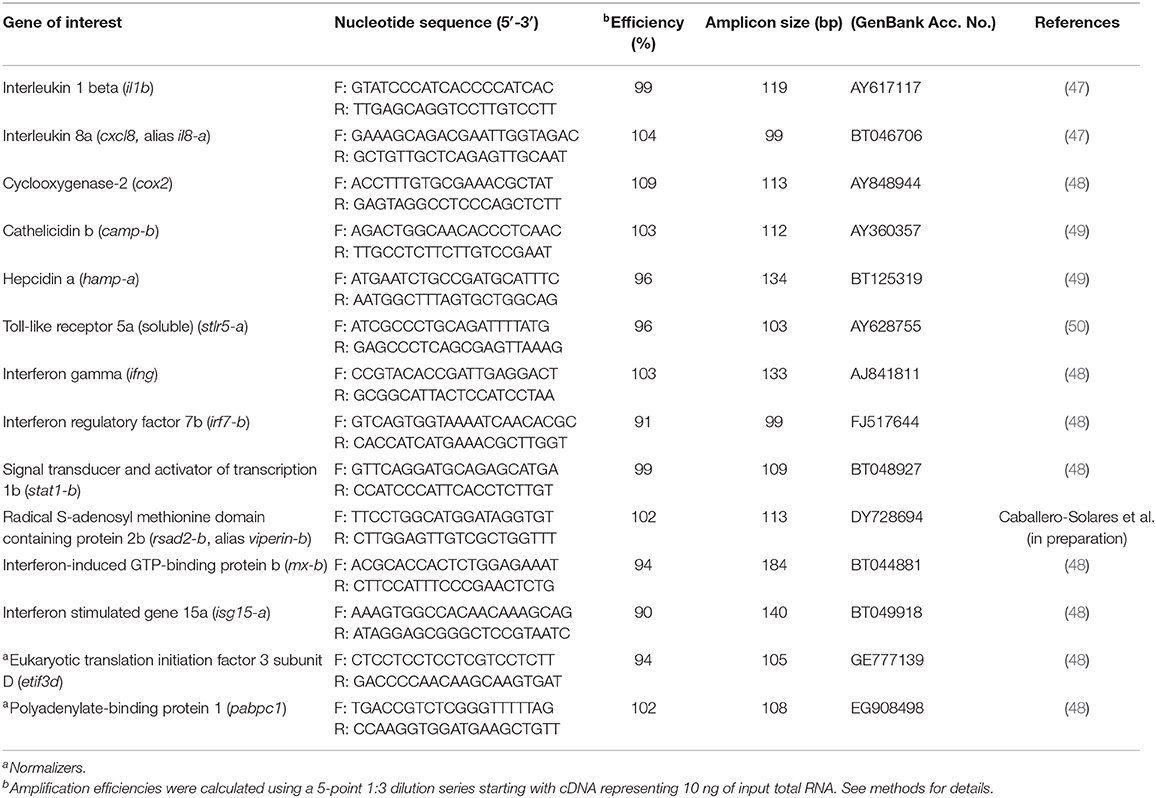
Table 1. Primers used in the Real-time quantitative polymerase chain reaction (qPCR) analyses.
Antigen Preparation and IP Injection
Forte V II was obtained in the form of a vaccine. This vaccine contains formalin-inactivated cultures of Infectious Salmon Anemia Virus (ISAV), Aeromonas salmonicida, Vibrio anguillarum serotypes I & II, V. ordalii, and V. salmonicida serotypes I & II in a liquid emulsion with an oil based adjuvant. The vaccine was allowed to warm to room temperature to facilitate injection; 50 μL was injected independent of fish mass, as recommended by the manufacturer. PBS was filtered using a 0.2 μm cartridge prior to injection, and administered using the same procedure as for Forte V II. Fish were fasted for 48 h prior to injection.
Sampling
At time 0 (pre-injection) and at 6, 12, 24, and 48 HPI, the fish were quickly euthanized (in seawater containing 0.4 g L−1 TMS) and had their fork length and weight measured. The head kidney and spleen were then quickly removed, placed in separate 1.5 ml RNase-free tubes, snap-frozen in liquid nitrogen, and then stored at −80°C until RNA was prepared for the assessment of gene transcription. In addition, at 24 HPI, the spleens were weighed to measure the spleen-somatic index, and 2 mL of blood was collected by caudal puncture. For each individual, one hundred microliters of whole blood were immediately used in the respiratory burst assay. The remaining blood was centrifuged at 800 × g for 2 min at 4°C, and the plasma was transferred to a 1.5 ml tube and snap-frozen in liquid nitrogen before being stored at −80°C for the determination of hemolytic activity of the complement system and lysozyme concentration.
Humoral Immune Response
Respiratory Burst
The production of reactive oxygen species (ROS) by salmon blood leukocytes was measured by chemiluminescence following the methods described by Marnila et al. (51), Nikoskelainen et al. (20) and Nikoskelainen et al. (52). Briefly, whole blood (2 μL mL−1 final concentration) was added to a mixture of 1 mM luminol (5-amino-2,3-dihydro 1,4-phthalazinedione, Sigma, St. Louis, MO, USA) in 0.2 M sodium borate and PBS. Then, 225 μL of this solution was added to triplicate wells of a 96-well white cliniplate (Cat. No. 28298-610, VWR International, Mississauga, ON), followed by 25 μL of 20 mg mL−1 zymosan from Saccharomyces cerevisiae (Sigma, Z4250). Thereafter, chemiluminescence was measured over 60 min using a microplate reader (SpectraMax M5; Molecular Devices, Sunnydale, CA, USA) at room temperature (~20°C). During this time, a curve of the luminescence counts per second (LCS) was obtained, and peak values were taken to represent the respiratory burst of each sample.
Hemolytic Activity of the Alternative Pathway of the Complement System
Complement hemolytic activity was measured according to Ferriani et al. (53) and Polhill et al. (54) with modifications made by Zanuzzo et al. (55) for salmonids. Initially, a sample of rabbit blood was mixed with an equal volume of Alsever solution (anticoagulant, pH 6.1). Then, an equal volume of TEA-EDTA chelating buffer (triethanolamine ethylenediamine tetraacetic acid; 0.1 M, pH 7.4 with 0.1% gelatin) was added, incubated for 15 min at 37°C, and then centrifuged at 800 × g for 10 min at 4°C to separate the cells [predominantly erythrocytes (i.e., red blood cells, RBCs)]. The rabbit RBCs (RaRBCs) were then washed three times in TEA-Mg2+ buffer (2 mM, pH 7.4) with successive centrifugations (at 800 × g for 10 min at 4°C), and stored for up to 15 days in Alsever solution at 4°C. Finally, before use, 1 mL of the RaRBC suspension was washed three times in TEA-EGTA-Mg2+ buffer [triethanolamine ethylene glycol tetraacetic acid (8 mM), with 2 mM of Mg2+ and 0.1% gelatin, pH 7.4], with successive centrifugations (at 800 × g for 10 min at 4°C), and then adjusted using the same buffer to an optical density of between 0.7 and 0.8 at 700 nm. The assay was carried out at a 1:8 dilution (75 μL of plasma combined with 125 μL of TEA-EGTA-Mg2+ buffer and 400 μL of the RaRBC suspension) and absorbance was measured for 20 min at 35°C. Plasma aliquots were heated for 30 min at 56°C to provide a negative control. Hemolytic complement activity for each sample was measured as the time (seconds) required for the initial optical density to be reduced by one-half (50% of RaRBC hemolysis by the complement alternative pathway).
Plasma Lysozyme Concentration
Plasma lysozyme concentration was determined according to Demers and Bayne (56). Briefly, standard solutions (0–10 ng μL−1) of hen egg white lysozyme (HEWL, Sigma-Aldrich, L6876) were prepared fresh from a frozen aliquot using 66 mM potassium phosphate buffer, pH 6.2. Then, dilutions of the standard and of serum (25 μL) were placed into triplicate wells of a 96-well plate. One hundred and seventy-five microliters of a 0.075% (wt:v) Micrococcus lysodeikticus (Sigma-Aldrich, M3770) suspension prepared in the same buffer were then added to each well. After rapid mixing, absorbance was measured at 450 nm every 20 s for 15 min at room temperature (~20°C) using a microplate reader (SpectraMax M5; Molecular Devices, Sunnydale, CA, USA). The rate of decrease in absorbance for each sample was then compared to that obtained with the standard curve, and lysozyme was expressed in ng μL−1 based on hen egg white lysozyme activity (ng μL−1 HEWL eq) which was used as the standard.
Immune-Related Transcript Expression
RNA Preparation
Head kidney and spleen samples (~100 mg tissue per sample) were homogenized in 400 μL of TRIzol Reagent (Invitrogen) using individual RNase-free pestles and a motorized Kontes RNase-Free Pellet Pestle Grinder (Kimble Chase, Vineland, NJ). An additional 400 μL of TRIzol Reagent (Invitrogen) were then added to each sample, mixed by pipetting, and the homogenates frozen on dry ice and stored at −80°C. Frozen homogenates were further processed by slowly thawing them on ice and then passing them through a QIAshredder (QIAGEN, Mississauga, ON) spin column following the manufacturer's instructions. Two-hundred microliters of TRIzol (Invitrogen) were then added to each sample to make a total homogenate volume of ~1 mL, and the TRIzol total RNA extractions were then completed following the manufacturer's instructions.
Each TRIzol-extracted RNA sample (45 μg) was treated with 6.8 Kunitz units of DNaseI (RNase-Free DNase Set, QIAGEN) with the manufacturer's buffer (1x final concentration) at room temperature for 10 min to degrade any residual genomic DNA. DNase-treated RNA samples were then column-purified using the RNeasy Mini Kit (QIAGEN) following the manufacturer's instructions. RNA integrity was verified by 1% agarose gel electrophoresis, and RNA purity was assessed by A260/280 and A260/230 NanoDrop UV spectrophotometry for both the pre-cleaned and the column-purified RNA samples. Column-purified RNA samples had A260/280 ratios between 2.0 and 2.3, and A260/230 ratios between 1.9 and 2.3.
cDNA Synthesis and qPCR Parameters
First-strand cDNA templates for qPCR were synthesized in 20 μL reactions from 1 μg of DNaseI-treated, column-purified, total RNA using random primers (250 ng; Invitrogen), dNTPs (0.5 mM final concentration; Invitrogen) and M-MLV reverse transcriptase (200 U; Invitrogen) with the manufacturer's first strand buffer (1X final concentration) and DTT (10 mM final concentration) at 37°C for 50 min.
All PCR amplifications were performed in 13 μL reactions using 1X Power SYBR Green PCR Master Mix (Applied Biosystems), 50 nM of both the forward and reverse primers and cDNA representing 4 ng of input total RNA, and using the ViiA 7 Real Time PCR system (384-well format) (Applied Biosystems). The real-time analysis program consisted of 1 cycle of 50°C for 2 min, 1 cycle of 95°C for 10 min, and 40 cycles of 95°C for 15 s and 60°C for 1 min, with fluorescence detection at the end of each 60°C step, and was followed by dissociation curve analysis.
Endogenous Control (Normalizer) Selection
Transcript expression levels of the target genes [i.e., transcripts of interest (TOI)] were normalized to transcript expression levels of two endogenous control genes. These endogenous controls were selected from six candidate normalizers [60S ribosomal protein L32 (rp132; BT043656), β-actin (actb; BG933897), elongation factor 1-alpha 1 (ef1a1; AF321836), elongation factor 1-alpha 2 (ef1a2; BT058669), eukaryotic translation initiation factor 3 subunit D (etif3d; GE777139) and polyadenylate-binding protein 1 (pabpc1; EG908498)]. Normalizer testing was performed separately on 24 HPI and on 48 HPI samples. At 24 HPI, the fluorescence threshold cycle (CT) values of 12 head kidney and of 12 spleen samples from the control treatment [CN-PBS, CN-Forte V II (N = 6 per group)] were measured; at 48 HPI, the CT values of 24 head kidney samples from each of the three treatments [6 groups: CN-PBS, CN-Forte V II; WN-PBS, WN-Forte V II; WH-PBS, WH-Forte V II (N = 4 per group)] were measured. These were analyzed separately using geNorm (57). Using this software, etif3d [geNorm M = 0.147 (24 HPI), 0.157 (48 HPI)] and pabpc1 [geNorm M = 0.165 (24 HPI), 0.160 (48 HPI)] were determined to be stably expressed, and thus, were selected as the normalizers for both the pilot and main qPCR studies. When the experimental qPCR studies were performed, the endogenous control transcripts were indeed stably expressed in all samples (e.g., see Supplementary Table 1).
Real-Time Quantitative Polymerase Chain Reaction (qPCR)
As both the head kidney and spleen have immune-relevant functions, a preliminary study was conducted to determine which tissue would be best to assess changes in immune-relevant transcript expression levels. Briefly, transcript expression levels of 6 biomarker genes playing putative anti-bacterial and/or anti-viral roles [interleukin 8a (cxcl8, alias il8-a), cyclooxygenase-2 (cox2), cathelicidin b (camp-b), interferon gamma (ifng), interferon regulatory factor 7b (irf7-b), and interferon stimulated gene 15a (isg15-a)] were measured in the head kidney and spleen of the same salmon from the CN treatment at 24 HPI [i.e., CN-PBS and CN-Forte V II (N = 8 per group)]. On each plate, for every sample, the TOIs and endogenous controls were tested in triplicate and a no-template control was included. The relative quantity (RQ) of each transcript was determined using the ViiA 7 Software Relative Quantification Study Application (Version 1.2.3) (Applied Biosystems/Life Technologies), with normalization to both etif3d and pabpc1 transcript levels, and with amplification efficiencies incorporated. For each TOI, the sample with the lowest normalized expression (mRNA) level, irrespective of tissue, was set as the calibrator sample (i.e., assigned an RQ value = 1.0).
Based on this preliminary experiment we selected the head kidney as the target tissue for the main qPCR study to assess how temperature/hypoxia affected the transcript expression levels of immune-relevant genes. While the transcript expression levels (i.e., PBS vs. Forte V II stimulated) obtained for the two tissues were similar, the data for the head kidney was less variable (i.e., fewer outliers were detected; 5 vs. 13 overall), and the expression of more genes was significantly different (see Supplementary Figure 1).
In the main qPCR study, transcript expression levels of 12 genes were assessed in head kidney samples from all groups in the study (see Experimental Design). More specifically, six of these genes are highly involved in the anti-bacterial response [interleukin 1-beta (il1b), il8-a, cox2, camp-b, hepcidin a (hamp-a), and toll-like receptor 5a (soluble) (stlr5-a)] (Figure 2), 3 in both the anti-bacterial and anti-viral responses [ifng, irf7-b and signal transducer and activator of transcription 1b (stat1-b)] (Figure 3), and 3 specifically in the anti-viral response [radical S-adenosyl methionine domain containing protein 2b (rsad2-b, alias viperin-b), interferon-induced GTP-binding protein b (mx-b) and isg15-a] (Figure 4). The sequences of the primer pairs used in the qPCR assays are presented in Table 1. All of these primers had been previously subjected to quality assurance testing (see references in Table 1), and primers for viperin-b were kindly provided by Dr. Albert Caballero-Solares (in preparation). On each plate, for every sample, the TOIs and endogenous controls were tested in triplicate, and a plate linker sample (i.e., a sample that was run on all plates in a given study; a transcript/plate was deemed acceptable only if its linker CT value was within 0.5 cycles of the linker samples of all other plates in the study) and a no-template control were included. The relative quantity (RQ) of each transcript was determined as described above; for each TOI, the sample with the lowest normalized expression (mRNA) level was set as the calibrator sample (i.e., assigned an RQ value = 1.0).
Statistical Analyses
Values were identified as outliers if they were > 4 or < −4 of the studentized x predicted y, and only four values were removed from the analyses. Some of the data were log10 transformed prior to statistical analysis as they failed normality (Cramer Von Mises) and/or homoscedasticity tests (Brown–Forsythe). One-way ANOVAs, followed by Duncan's new multiple range post-hoc tests were used to test for differences in constitutive (basal) transcript expression among the groups at 20°C. Two-way ANOVAs [3 (treatments) × 2 (injections; PBS, Forte V II)], followed by Duncan's new multiple range (MRT) post-hoc tests, were used to examine the effects of temperature and moderate hypoxia on respiratory burst, plasma lysozyme concentration, hemolytic activity of the complement system, and spleen-somatic index at 24 HPI. A three-way ANOVA factorial model [3 (treatments) × 2 (injections; PBS, Forte V II) × 4 (time points; 6, 12, 24, and 48 HPI)] would have led to too many interactions, and tested factors that were not related to the main hypotheses of this study. Thus, a two-way ANOVA considering only fish injected with Forte V II [3 (treatments) × 4 (sampling points; 6, 12, 24, and 48 h)], and a second two-way ANOVA considering only fish injected with PBS [3 (treatments) × 4 (time points; 6, 12, 24 and 48h)], followed by Duncan's new MRTs, were used to examine the effect of temperature and moderate hypoxia on transcript expression levels at the different time points post-injection. In addition, we used t-tests to compare the transcript expression levels between Forte V II and PBS-injected fish within each treatment and time point. Finally, within each injection group (i.e., PBS or Forte V II), Dunnett's tests were used to test whether values at 6, 12, 24, and 48 HPI were significantly different from “initial” (time 0) values. In all cases, P < 0.05 was used as the level of statistical significance. All data in the paper are expressed as mean ± SE. However, data presented in the Supplementary Figure 1 accompanying this paper are presented as mean ± SD to show the absolute variation.
Results
Humoral Immune Responses
At 24 HPI, the leukocytes of PBS injected fish held at 20°C under normoxia or hypoxia had significantly higher (~ 6 and 14-fold, respectively) respiratory burst compared with CN (12°C) fish (Figure 1A). Furthermore, after the Forte V II injection, the leukocytes of WH fish had significantly higher (2-fold) respiratory burst compared with WN fish. In the CN fish, the injection of Forte V II resulted in a 61% decrease in respiratory burst (P < 0.05). This effect was also apparent in the WN and WH fish, where values were decreased by 53 and 69%, respectively, following V II injection (P < 0.05). There were no significant differences in the hemolytic activity of the complement system or plasma lysozyme concentrations among treatments or injection groups (Figures 1B,C). The spleen-somatic index of PBS-injected CN and WN fish was not different, but the SSI of the WH fish was ~30% lower compared with these other 2 treatments (Figure 1D). Although Forte V II injection did not affect the SSI in CN and WN fish, it increased SSI in the WH treatment to levels measured in the CN and WN treatments.
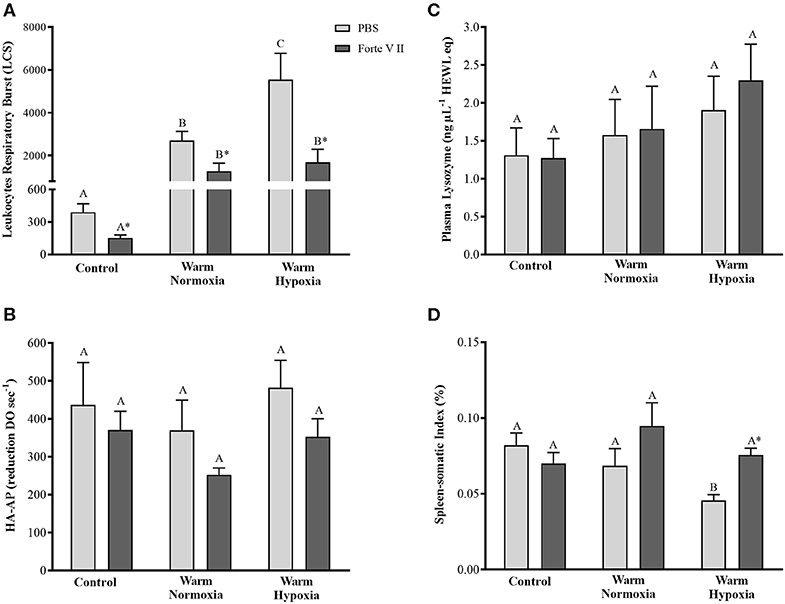
Figure 1. Respiratory burst (A), hemolytic activity of the complement system (B), serum concentration of lysozyme (C), and spleen-somatic index (D) in salmon held at 12°C (under normoxia) or 20°C (under normoxia or mild hypoxia) (i.e., treatment) 24 h post-intraperitoneal injection with PBS or Forte V II (i.e., injection group). Different capital letters indicate a significant difference (P < 0.05) among treatments for PBS or Forte V II-injected fish. An asterisk (*) indicates a significant difference between PBS and Forte V II injection groups within a treatment. Values are means ± 1 standard error (S.E.), N = 7–8.
Immune-Related Transcript Expression Levels
Effects of PBS and V II Injection in Control Fish
The injection of PBS only significantly affected the transcript expression levels of 2 of the 12 genes evaluated, and this effect was relatively small. CN (12°C; normoxia) fish injected with PBS had significantly higher transcript expression levels of camp-b at 24 and 48 HPI, while levels of ifng were significantly lower at 6 HPI compared with their respective baseline (pre-injection) values (Figures 2D, 3A, respectively). In contrast, V II injection significantly affected transcript expression levels of 10 of the 12 genes. Levels of 7 genes, including il1b, il8-a, cox2, camp-b, hamp-a, stlr5-a, and ifng, were greatly up-regulated by V II injection (i.e., by 44, 20, 53, 130, 167, 20, and 17-fold compared with constitutive values, respectively; Figures 2, 3A), whereas levels of irf7-b, and stat1-b only increased by 2 and 2.6-fold, respectively (Figures 3B,C). Interestingly, in CN fish injected with V II, transcript expression levels of viperin-b were significantly down-regulated at 24 (by 2.7-fold) and 48 HPI (by 1.5-fold) compared with PBS group (Figure 4A). The timing of peak expression also differed among the V II stimulated genes. Transcript expression levels of il1b and il8-a were highest (i.e., peaked) at 6 HPI, whereas those of cox2 were highest at 12 HPI, those of camp-b, hamp-a, stlr5-a, and stat1-b were highest at 24 HPI, and those of ifng and irf7-b peaked at 48 HPI.
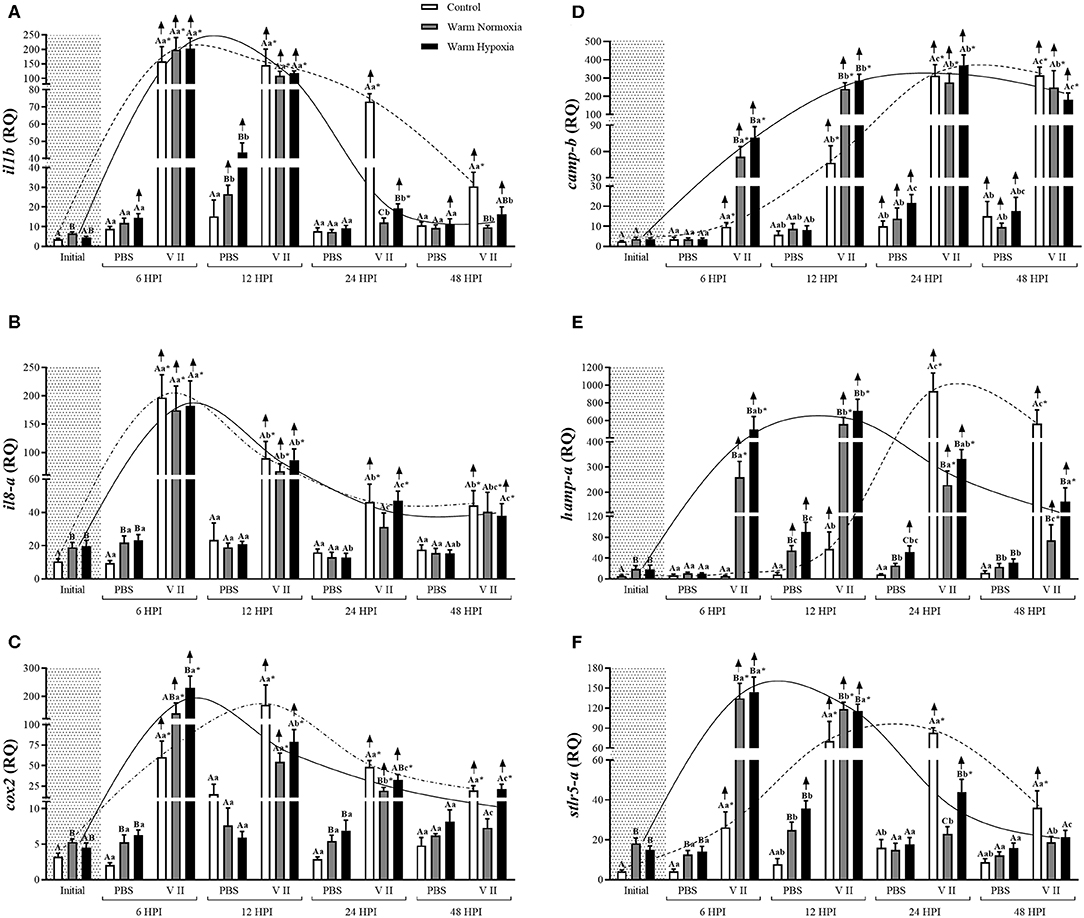
Figure 2. Transcript expression levels of 6 anti-bacterial biomarkers [il1b (A), il8-a (B), cox2 (C), camp-b (D), hamp-a (E), and stlr5-a (F)] in the head kidney of salmon held at 12°C (under normoxia) or 20°C (under normoxia or mild hypoxia) (i.e., treatment) 6, 12, 24, and 48 h post-intraperitoneal injection with PBS or Forte V II (i.e., group). Different capital letters indicate a significant difference (P < 0.05) among treatments within an injection group at a given time point (e.g., the three treatments six HPI after PBS injection) whereas dissimilar lower case letters indicate a significant difference over time within a treatment/group (e.g., control PBS-injected fish at 6, 12, 24, and 48 HPI). An asterisk (*) indicates a significant difference between PBS and Forte V II fish within a treatment at the same time point post-injection. The arrows indicate a significant difference compared with initial (constitutive expression) levels, within an injection group. Dotted (control) or solid lines (warm normoxia and hypoxia) illustrate the general pattern of changes in transcript expression levels for a given gene over time in Forte V II-injected fish, and are not based on any mathematical analysis. Transcript levels are presented as mean ± SE relative quantity (RQ) values (i.e., values for the transcript of interest were normalized to both etif3d and pabpc1 transcript levels and were calibrated to the individual with the lowest normalized expression level of that given transcript). N = 7–8.
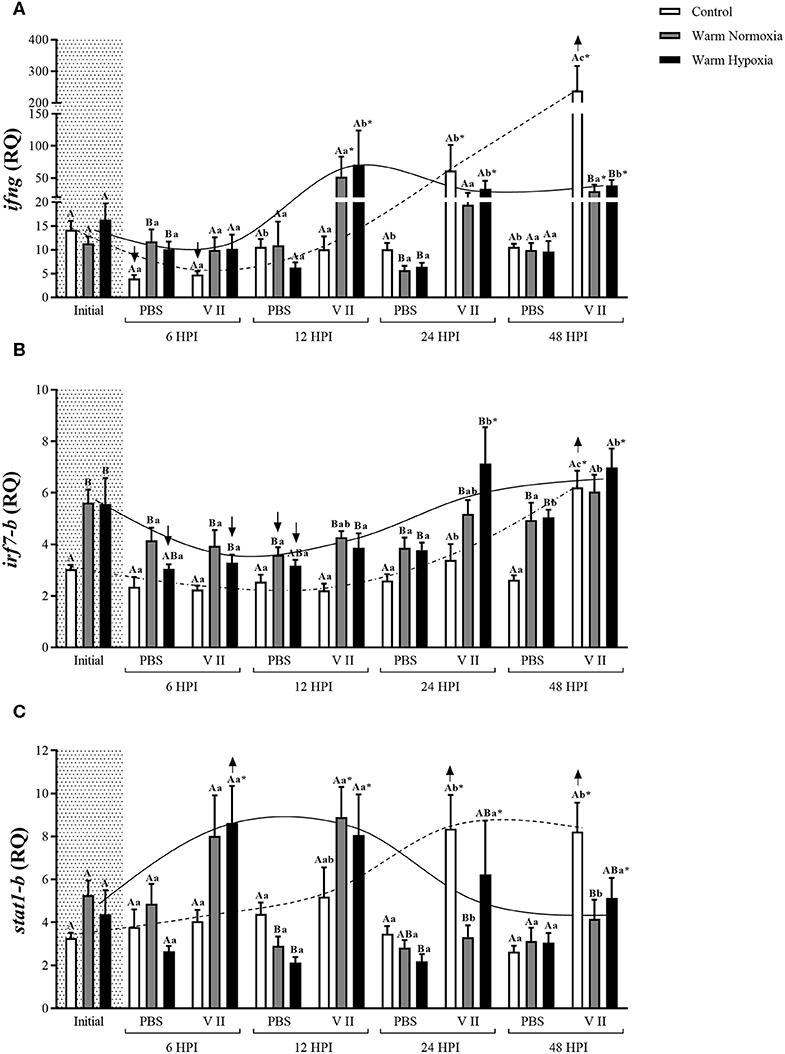
Figure 3. Transcript expression levels of three anti-bacterial/anti-viral biomarkers [ifng (A), irf7-b (B), and stat1-b (C)] in the head kidney of salmon held at 12°C (under normoxia) or 20°C (under normoxia or mild hypoxia) (i.e., treatment) 6, 12, 24, and 48 h post-intraperitoneal injection with PBS or Forte V II (i.e., injection group). Different capital letters indicate a significant difference (P < 0.05) among treatments within an injection group at a given time point (e.g., the three treatments 6 HPI after PBS injection) whereas dissimilar lower case letters indicate a significant difference over time within a treatment/group combination (e.g., control PBS-injected fish at 6, 12, 24, and 48 HPI). An asterisk (*) indicates a significant difference between PBS and Forte V II injection groups within a treatment at the same time point post-injection. The arrows (↑ or ↓) indicate a significant difference compared with initial (constitutive expression) levels, within an injection group. Dotted (control) or solid lines (warm normoxia and hypoxia) illustrate the general pattern of changes in transcript expression levels for a given gene over time in Forte V II-injected fish, and are not based on any mathematical analysis. Transcript levels are presented as mean ± SE relative quantity (RQ) values (i.e., values for the transcript of interest were normalized to both etif3d and pabpc1 transcript levels and were calibrated to the individual with the lowest normalized expression level of that given transcript). N = 7–8.
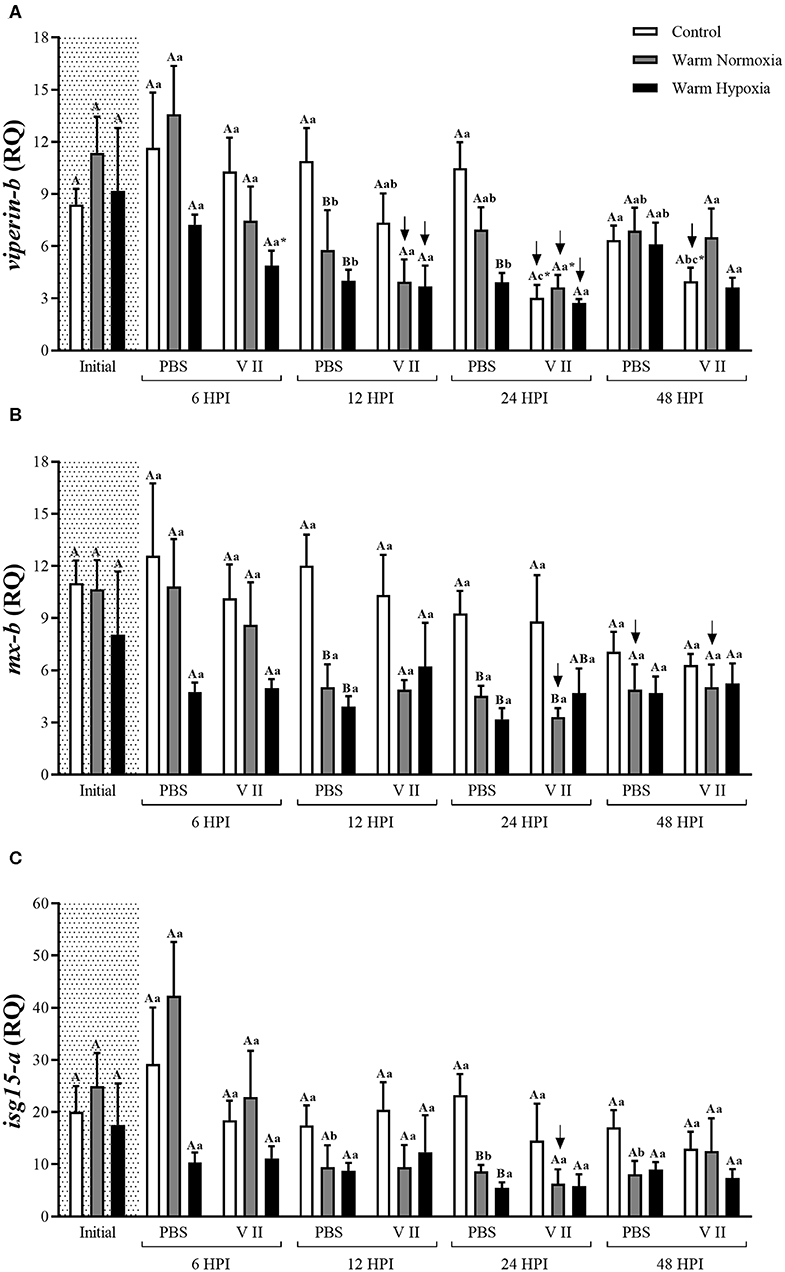
Figure 4. Transcript expression levels of 3 anti-viral biomarkers [viperin-b (A), mx-b (B), and isg15-a (C)] in the head kidney of salmon held at 12°C (under normoxia) or 20°C (under normoxia or mild hypoxia) (i.e., treatment) 6, 12, 24, and 48 h post-intraperitoneal injection with PBS or Forte V II (i.e., injection group). Different capital letters indicate a significant difference (P < 0.05) among treatments within an injection group at a given time point (e.g., the three treatments 6 HPI after PBS injection) whereas dissimilar lower case letters indicate a significant difference over time within a treatment/group combination (e.g., control PBS-treated at 6, 12, 24, and 48 HPI). An asterisk (*) indicates a significant difference between PBS and Forte V II injection groups within a treatment at the same time point post-injection. The arrows indicate a significant difference compared with initial (constitutive expression) levels, within an injection group. Transcript levels are presented as mean ± SE relative quantity (RQ) values (i.e., values for the transcript of interest were normalized to both etif3d and pabpc1 transcript levels and were calibrated to the individual with the lowest normalized expression level of that given transcript). N = 7–8.
Effect of High Temperature on Immune-Related Transcript Expression
At the initial (constitutive) sampling, salmon acclimated to 20°C had significantly higher transcript expression levels of il1b, il8-a, cox2, hamp-a, stlr5-a (Figure 2) and irf7-b (Figure 3B) compared with CN (12°C) fish. However, post-injection transcript expression levels were very similar between CN and WN fish for most genes. For example, il1b, il8-a, cox2, camp-b, irf7-b, and stat1-b had very similar peak expression levels in both treatments (Figures 2, 3B,C). The exceptions were hamp-a, ifng, and stlr5-a. WN fish had lower maximum transcript levels of hamp-a (561 vs. 932 RQ, respectively) and ifng (52 vs. 239 RQ, respectively) compared with CN fish (Figures 2E, 3A). In contrast, WN fish had higher peak transcript expression levels of stlr5-a (~40%) compared with CN salmon (Figure 2F). Although the magnitude of post-injection transcript expression levels between CN and WN fish only differed for a few genes, the timing of peak expression for many of the genes was considerably earlier in the WN treatment compared with the CN treatment; e.g., while cox2 transcript expression levels peaked at 6 HPI in WN fish, they peaked at 12 HPI in CN fish. Similar patterns were also observed for hamp-a (12 vs. 24 HPI; WN vs. CN, respectively), camp-b (12–24 vs. 24–48 HPI), stlr5-a (6 vs. 24 HPI), ifng (12 vs. 48 HPI), and stat1-b (6–12 vs. 24–48 HPI) (Figures 2, 3). In contrast, no differences were observed in the timing of peak transcript expression levels for il1b, and il8-a between WN and CN salmon (Figures 2A,B).
Effect of Moderate Hypoxia on Immune-Related Transcript Expression
There were no differences in the constitutive or maximum transcript expression levels between the WN and WH salmon (Figures 2–4). Furthermore, there were only a few differences in post-injection transcript expression levels between the WN and WH treatments. The WH group had higher post-injection transcript levels of il1b and stlr5-a at 24 HPI compared with WN fish (Figures 2A,F), whereas this same effect was observed for cox2, hamp-a, and stat1-b at 48 HPI (Figures 2C,E, 3C, respectively).
Discussion
Climate change is predicted to increase water temperatures and decrease oxygen levels in the marine environment, and this may affect fish health and welfare, including their capacity to respond to pathogens (10, 13, 15, 39, 40). However, there is conflicting information about whether, and to what extent, these environmental factors may impact the immune defenses of fish (15). Thus, in this study, Atlantic salmon were subjected to a controlled incremental increase in water temperature (i.e., from 12 to 20°C, at a rate of 1°C per week) under normoxia or moderate hypoxia (~70% of air sat.) and then held at 20°C for 4 weeks. These conditions (i.e., an incremental temperature increase in association with moderate hypoxia) realistically reflect what farmed salmon face, or may face, in the future during the summer months (10–13). Thereafter, the salmon were immune-stimulated with the commercial vaccine Forte V II, and sampled at 6, 12, 24, and 48 HPI. We showed that while manipulating these environmental conditions did not affect the activity of complement system or plasma lysozyme concentration, high temperature (20°C) significantly increased respiratory burst and that the combination of this challenge with moderate hypoxia further increased this response (see PBS injection group, Figure 1). In addition, we report that high temperature up-regulated the constitutive expression of il1b, il8-a, cox2, hamp-a, stlr5-a, and irf7-b transcripts in the head kidney and hastened the increase in cox2, hamp-a, camp-b, stlr5-a, ifng, and stat1-b transcript expression levels post-stimulation with Forte V II. Interestingly, although high temperature affected the timing of changes in transcript expression levels, it did not have major effects on the magnitude of these changes, and hypoxia had few additional effects. Collectively, our results indicate that moderate hypoxia in combination with incremental increases in temperatures as high as 20°C do not impair the capacity of the Atlantic salmon's innate immune system to respond to bacterial pathogens.
Impact of High Temperature, Hypoxia and Forte V II on the Humoral Immune Response and SSI
In our study, the respiratory burst of circulating (blood) leukocytes increased by ~ 6-fold in 20°C- compared with 12°C-acclimated fish, and the addition of moderate hypoxia induced a further increase in this response (Figure 1A). Nikoskelainen et al. (20) showed that respiratory burst increased in rainbow trout (Oncorhynchus mykiss) following long-term acclimation to high temperature (20 vs. 5°C). Further, it is well documented that long-term exposure to high temperatures increases the number of circulating leukocytes, and in particular the number of neutrophils in teleost species such as turbot (Scophthalmun maximus) (58), catfish (Pangasianodon hypophthalmus) (59) and Atlantic salmon (32). Hypoxia has also been shown to promote an increase in the number of leukocytes in rainbow trout (60). Thus, we hypothesize that exposure to high temperatures increased the number of circulating leukocytes, in particular neutrophils, and that hypoxia potentiated this response. Furthermore, the vaccine Forte V II significantly decreased respiratory burst, independent of temperature or oxygen level, and we attribute this reduction to the migration of circulating leukocytes into the abdominal cavity (i.e., the site of Forte V II injection). This hypothesis is supported by preliminary measurements using flow cytometry which showed that there was a reduction in the number of circulating leukocytes in fish injected with Forte V II compared with those injected with PBS (data not shown).
In our study, we did not observe differences in hemolytic activity of the complement system, in plasma lysozyme concentration or in the spleen-somatic index between fish exposed to high temperature alone or in combination with hypoxia compared with control fish (Figures 1B–D). In contrast, rainbow trout exposed to high temperature (20°C) for 57 days had an increased activity of the complement system (20), whereas no differences were observed in Atlantic cod (Gadus morhua) complement activity after long-term exposure to 1, 7, or 14°C (33). Valero et al. (61) investigated the effects of seasonal (slow) temperature changes on lysozyme concentration in European sea bass (Dicentrarchus labrax), and also found no impact of temperature. Finally, Salazar-Lugo et al. (62) did not find differences in the non-specific immune response of tambaqui (Colossoma macropomum) following 21 days of exposure to high temperatures. Thus, our results are consistent with the literature, and suggest that long-term acclimation to high temperatures does not impair the humoral immune responses of fish, and may even enhance these responses.
Effects of High Temperature on Constitutive Transcript Expression Levels
In our study, fish acclimated to 20°C had higher constitutive expression of il1b, il8-a, cox2, hamp-a, stlr5-a, and irf7-b (Figures 2, 3B). These results agree with recent research conducted by our group which investigated the transcriptomic responses of salmon to 20°C acclimation using the 44-K Agilent salmon microarray and qPCR, and revealed that the constitutive expression of 15 important immune-related transcripts clustered very differently compared with control fish when subjected to principal component analysis (PCA) [Beemelmanns et al. (in preparation)]. The up-regulated transcripts observed at the initial sampling are related to a number of important aspects of the fish innate immune response including the inflammatory process (il1b and il8), prostaglandin production (cox2) and bacterial recognition (stlr5-a), or are antimicrobial peptides (hamp-a) or transcription regulatory factors (irf7-b) (63–69). Hyperthermia is known to induce inflammatory signaling in mammals, but the effects of high temperatures on inflammation in fish is still poorly understood (27). The increase in il1b expression observed in salmon acclimated to 20°C in this study is consistent with a similar study performed by Perez-Casanova et al. (34) on Atlantic cod, and has also been observed in mammals (70, 71). Collectively, these data suggest that IL-1β may play an important physiological role during prolonged heat exposure, and it could also be modulating the expression of genes encoding other inflammatory mediators such as il8-a, cox2, hamp and other antimicrobial peptides (63, 64, 72, 73).
Another plausible explanation for how long-term exposure to high temperatures could modulate the constitutive transcription of immune-related genes and inflammation is changes in the fish's bacterial community (74). Several studies show that temperature affects bacterial diversity in the water (75) as well as the fish gut microbiota (76–78), and a number of studies have linked gut microbiota load and diversity with the fish's immune system (79, 80). For example, gut microbiota can modulate the transcription of several immune-related genes in the digestive tract and also affect the innate immune response (81–83). Taken together, these findings suggest that changes in the profile of constitutive immune-related transcript expression could be partially related to inflammatory signaling as a direct effect of high temperature and/or an indirect effect through changes in the diversity and abundance of the fish's microbial community. Although, we have raised several plausible explanations of how long-term exposure to high temperature may modulate the constitutive transcription of immune-related genes, little information is available and this research area deserves further attention.
Effects of Forte V II on the Anti-bacterial and Anti-viral Innate Immune Response
To our knowledge, no study has used the vaccine Forte V II, or injected similar bacterial and viral PAMPs (A. salmonicida, V. anguillarum, V. ordalii, and V. salmonicida and ISAV) concurrently. The Forte V II vaccine greatly increased the transcript expression levels of anti-bacterial genes such as il1b, il8-a, cox2, camp-b, hamp-a, stlr5-a, infg, and stat1-b, in the head-kidney of Atlantic salmon (Figures 2, 3A,C). The up-regulation of these genes is consistent with studies that have injected teleost fishes with A. salmonicida or Vibrio sp. For example, STAT1 is a signal transduction protein critical to the interferon pathway, and has been shown to be up-regulated upon A. salmonicida infection in Japanese eel (Anguilla japonica) (84). The IP-injection of formalin-killed A. salmonicida induced a similar increase in the expression of il1b, camp-b and il8-a at 24 HPI in the spleen of trout acclimated at 10°C (85). Finally, Atlantic salmon experimentally infected with V. salmonicida showed a similar up-regulation of il1b, il8-a, and stlr5-a expression in the spleen between 6 and 12 HPI (86).
Although we observed a robust anti-bacterial response, the vaccine Forte V II which contains formalin-killed cultures of ISAV did not stimulate the expression of transcripts that are specifically related to the anti-viral response (i.e., viperin-b, mx-b, and isg15-a; Figure 4). ISAV is one of the most important viruses impacting marine salmonid aquaculture, and disease outbreaks have been reported in several regions of the world, but mainly Norway, Canada and Chile (87). With respect to post-injection effects of ISAV vaccines on innate immune gene expression, Collet et al. (88) IP injected salmon at 10°C with a commercial ISAV vaccine, and showed that the expression of mx in the blood had a sustained increase starting at 8 days post-injection (DPI). McBeath et al. (89) reported that the expression levels of mx and type I and II ifn in the head kidney increased drastically after day 4, and peaked at day 6, post-infection with ISAV in salmon acclimated at 11°C. Wolf et al. (90) found that an IP administered ISAV vaccine up-regulated mx transcript levels in the spleen after 8 DPI. LeBlanc et al. (91) used a 32 k cDNA microarray platform and reported that no transcripts were dysregulated at 24 HPI and that only 25 transcripts were ≥2-fold differentially expressed at 3 DPI. Further, LeBlanc et al. (92) injected salmon at 13°C with ISAV and observed that the expression of mx and stat1 only started to be up-regulated at 10 and 20 DPI, respectively, and Caruffo et al. (93) reported that ISAV infection (IP) only induced the transcription of mx in the head-kidney of salmon after 40 DPI. These studies suggest that a relatively long time is necessary for the salmon immune system to respond to ISAV, and that there might have been up-regulation of anti-viral transcripts in our study if we had sampled for a longer period.
Interestingly, we observed that the transcript expression of some specific anti-viral immune genes such as viperin-b, mx-b and isg15-a, was down-regulated in fish injected with Forte V II compared with the PBS group or their constitutive levels (see Figure 4). According to Eberl (74), and the concept of “immunity by equilibrium,” the activation of one type of response may inhibit another type, and an immune equilibrium is maintained by the competing immune responses. Boucontet et al. (94) used zebrafish (Danio rerio) to test whether viral infection (with Sindbis virus) would interfere with bacterial susceptibility, and whether bacterial infection (with Shigella flexneri) would affect the susceptibility to viral infection. The authors found that virus-infected fish were hyper-susceptible to bacterial infection, while fish infected with bacteria first and virus later did not experience increased mortality or microbial burden. These results are remarkably similar to what has been observed in mouse models (95) and in humans (96). Although we still do not know if the mechanisms that lead to increased bacterial or viral susceptibility upon infection with other types of pathogen-associated antigens are shared between fish and mammals, our results suggest that a robust anti-bacterial response may suppress anti-viral transcript expression in fish, and could have contributed to the absence of up-regulated anti-viral transcript expression levels in this study. This finding also suggests that concomitant vaccination for bacterial and viral pathogens might not be as effective as if they are administered separately (i.e., at different times), at least with respect to non-specific immune responses. The hypothesis that fishes have a defined and limited capacity to respond to antigenic substances is supported by Busch (97).
Effects of High Temperature on Anti-bacterial Transcript Expression
The effects of temperature on fish biology have been extensively studied. However, information about how long-term acclimation to high temperatures affects the innate immune response, specifically the expression of immune-related genes, is still limited. The majority of studies in this area suggest that high temperatures induce an earlier expression of immune-relevant genes (14, 98). However, studies have often compared immune-related gene expression in fish held at different temperatures at the same time point (25) or only at a limited number of time points (99); which could potentially have led to questionable conclusions. In addition, many studies in fish have only investigated the effects of short-term exposure to high temperature on immune-related gene expression (29, 44, 98, 100, 101). In this study, water temperature was slowly increased from 12 to 20°C under conditions of normoxia and moderate hypoxia [i.e., mimicking what salmon at cage-sites may face during the summer months (10–12, 37)], and the salmon were sampled at 6, 12, 24, and 48 HPI with Forte V II or PBS. We found that high temperature hastened the peak in transcript expression levels of 5 genes (cox2, camp-b, hamp-a, stlr5-a, and stat1-b; Figures 2, 3C), but that the maximum post-injection levels were similar for eight of the nine anti-bacterial genes (Figures 2, 3). Taken together, our results indicate that temperatures up to 20°C hasten the induction, but do not alter the magnitude of, immune-related transcript expression levels in salmon. An earlier increase in expression levels of immune-related genes at high temperatures was also observed by Thanasaksiri et al. (102) for Japanese flounder (Paralichthys olivaceus) injected with polyinosinic:polycytidylic acid [poly (I:C)] at 25 vs. 15°C, and by Hori et al. (103) in Atlantic cod injected with formalin-killed A. salmonicida at 16 vs. 10°C. Similarly, mx and stat1 transcripts were strongly up-regulated in Japanese flounder injected with poly (I:C) at 25°C at 3 HPI, whereas at 15°C, the genes were only up-regulated at 24 HPI (98). Furthermore, the magnitude and timing of expression observed in our study are consistent with data obtained by a number of other authors: for tnfa1, tnfa2, il1b, and il8 in peripheral blood leukocytes and head kidney homogenates of southern Bluefin tuna (Thunnus thynnus) stimulated with LPS at 25 and 18°C (27); by Raida and Buchmann (31) when measuring the expression of il6, il10, ifng, tnfa, and tgf in the spleen of rainbow trout acclimated for 8 weeks at 25 or 15°C and bath vaccinated with Y. ruckeri; and as shown by Kaneshige et al. (104) in Japanese flounder injected with formalin-killed Edwarsiella tarda at 25 and 15°C for il1b, hamp, and ifng.
Although we measured similar increases in transcript expression levels in the 12 and 20°C groups for almost all genes examined, the expression of ifng did not follow this pattern and it had lower peak expression (by approx. 4.5-fold) in fish acclimated to 20°C compared with CN fish acclimated to 12°C (Figure 3A). This result is in agreement with Kaneshige et al. (104) who observed lower peak irf-1 transcript expression in the head kidney of Japanese flounder (Paralichthys olivaceus) acclimated to high temperature (22 vs. 15°C). These authors suggested that certain genes involved in the IFN-γ signaling pathway might be sensitive to high temperatures and that this leads to increased susceptibility to pathogen infection. Wang et al. (99) also found that the transcript level of ifng was inhibited at low and high temperatures (21 and 33°C) compared with optimal temperatures (such as 25 and 29°C) after Nile tilapia (Oreochromis niloticus) were vaccinated with inactivated Streptococcus agalactiae. Although we did not find a difference in the maximal post-injection expression of stat1-b, which is one of the transcription factors activated by type II IFNs such as IFN-γ (105), these findings suggest that the resistance to pathogens afforded by the IFN-γ signaling pathway may be reduced at higher temperatures. Similarly, vaccines that are dependent on type II IFN stimulation might not be as effective at warmer water temperatures. Overall, these data suggest that ifng may potentially be a useful biomarker for evaluating the impact of high temperatures on the immune responses of fish.
Effects of Hypoxia on Immune-Related Transcript Expression
In this study, we also examined whether the combination of moderate hypoxia and an incremental temperature increase to 20°C would impair the innate immune response as such conditions have been observed in salmon sea-cages in Tasmania (10), Norway (12) and Newfoundland (11). Further, these conditions recently led to massive mortalities at several cage-sites in Newfoundland during the summer of 2019 (46). While the addition of moderate hypoxia did not affect peak post-vaccination transcript expression, we did observe that fish exposed to an incremental temperature increase and moderate hypoxia had higher expression levels of i1β and stlr5-a at 24 HPI compared with fish only exposed to high temperature, and that a similar profile was apparent for cox2, hamp-a and stat1-b at 48 HPI (Figures 2, 3C). Collectively, these data suggest that hypoxia increases the duration of elevated immune-relevant transcript expression when fish are exposed to high temperatures, and this finding is consistent with the results of Kvamme et al. (43). These authors injected salmon with poly (I:C) or a water-based V. anguillarum vaccine at 10°C, and reported that there was a more rapid down-regulation of gene transcription in fish acclimated to 75 vs. 52% air saturation.
The Overall Effects of an Incremental Temperature Increase and Hypoxia on Innate Immune Responses
In summary, we found that an incremental increase to 20°C enhanced leukocyte respiratory burst, increased the constitutive expression of several immune-related genes, hastened the peak in transcript expression levels after Forte V II injection, but inhibited the expression of ifng post-stimulation. However, these impacts were relatively small overall, and our findings indicate that an incremental temperature increase up to 20°C [a temperature only 2–3°C below the acclimation temperature where Atlantic salmon mortalities become significant (37, 106)] modulates, but does not have a major effect on, the salmon's innate immune response. This conclusion is consistent with several studies on a variety of teleost species (25, 34, 58, 61). However, there are also a number of studies that have shown that short-term (acute) exposure to high temperatures impairs or limits the immune response (19, 29, 30, 101, 107, 108). There is little information on the effect of the rate of temperature change (increase) on fish immune responses (15), and although the current study did not examine this issue, we suspect that the non-deleterious effect of long-term exposure to high temperature may, in part, be related to circulating cortisol levels in fish exposed to long-term vs. acute increases in temperature. Plasma cortisol has been shown to increase sharply after an acute exposure to high temperature in fish (109–112), while chronic exposure to high temperature revealed few impacts on the stress physiology/cortisol levels in Atlantic salmon (113) or other teleost species (25, 34, 114, 115). In fact, we measured resting plasma cortisol levels in a very similar experiment to this one [see Experiment #2 in Gamperl et al. (37)] and they did not become elevated until the fish experienced a temperature of 22°C [Zanuzzo et al. (in preparation)]. This hormone is a well-known modulator of the immune system, and higher cortisol levels limit or reduce the immune response [e.g., see Zanuzzo et al. (116)]. Perez-Casanova et al. (34) suggested that when exposed to an incremental temperature increase, immune function is influenced by complex interactions between thermal effects and temperature-induced stress (i.e., elevated circulating cortisol levels). Thus, the effects of faster changes in water temperature (e.g., degrees per hour) on the fish's immune response might not directly reflect a temperature effect, but rather the effect of stress (elevated cortisol levels). Such an effect could largely explain the conflicting results surrounding the effect of high temperature on the fish immune response to bacterial and/or viral antigens.
Few studies have examined the effect of chronic hypoxia on the innate immune response of fish, but those that have suggest that this environmental condition may impair the capacity of fish to respond to pathogens. For example, chronic and moderate intermittent hypoxia have been shown to decrease leucocyte respiratory burst in Atlantic salmon (42). Gallage et al. (117) observed a lower, and delayed, antibody production in Nile tilapia chronically exposed to hypoxia, and the authors associated the delay in antibody production with a reduction in the transcript levels of i1β, tcrβ, and mhcIIβ. Kvamme et al. (43) found that Atlantic salmon exposed to chronic hypoxia had either reduced expression or a delay in the expression of immune-related genes. Even fewer studies have investigated the impact of the combination of hypoxia and high temperature on fish immune function. However, Wang et al. (44) reported that hypoxia reduced the protection afforded by vaccination in Nile tilapia independent of acclimation temperature (30 vs. 35°C). Further, Niklasson et al. (45) exposed salmon to chronic hypoxia (50% air sat.) at 8 and 16°C, and showed that hypoxia negatively affected the intestinal mucosal immune system and that these effects were more pronounced at 16°C; these data suggest that hypoxia has additive adverse effect to those of high temperature. Although, the addition of moderate hypoxia potentially represents an additional challenge to that of high temperature, contrary to our expectation, it had few effects on the salmon's innate immune function (with the exception of enhancing respiratory burst in PBS-injected fish and delaying the return of transcript expression to pre-vaccination levels). The limited effects of chronic hypoxia on the innate immune responses in this study may be related to the level of hypoxia used (~70% of air saturation), which might have enabled a suite of physiological responses that allowed WH fish to up-regulate immune-related transcript expression to levels similar to WN and CN fish. This hypothesis does have some support in the literature. Moderate hypoxia (60–65% air sat.) had no effect on the severity or progress of pancreas disease in Atlantic salmon infected with Salmonid Alphavirus (SAV) (118). Magnoni et al. (119) exposed rainbow trout to 4.5 mg L−1 of dissolved oxygen for 49 days, but reported no changes in the lysozyme, peroxidase and alternative complement pathway activities, and concluded that the trout displayed an adaptive response to the level of chronic hypoxia to which they were exposed.
Summary and Perspectives
Due to accelerated climate change, fish will likely face incremental temperature increases that approach or exceed their upper thermal limit, and often in combination with hypoxia, in the future (1, 2, 7, 13). However, little is known about the impact of rising temperatures and reduced dissolved oxygen levels on fish immune defenses. In our study, we found that an incremental increase in water temperature to 20°C alone, or in combination with moderate hypoxia (70% air saturation), had only very limited impacts on the Atlantic salmon's capacity to mount an innate immune response. These findings do not support the hypothesis that salmon innate immune responses are greatly impaired at high temperature and hypoxia, and thus, suggest that such an effect is not responsible for disease outbreaks during the summer months. However, it is also very likely that the conditions examined in this study [i.e., 20°C and moderate hypoxia (70% air saturation] are on the edge/limit of the physiological tolerance for this strain of salmon [see Gamperl et al. (37)], and that further deterioration in these environmental conditions could lead to the impairment of salmon immune function.
Although this study examined the salmon's capacity (innate immunity) to respond to antigens from several pathogens, we cannot draw conclusions about the susceptibility to disease under different environmental conditions because we injected fish with formalin inactivated cultures of bacteria and / ISAV (i.e., commercial multivalent vaccine Forte V II). The susceptibility to disease at each temperature is specific, and a trade-off between the effects of temperature on the host and pathogen. For example, while high temperature (15 vs. 12°C) increases infection prevalence and pathogen burden in rainbow trout exposed to Tetracapsuloides bryosalmonae (28), it provides olive flounder (Paralichthys olivaceus) with enhanced protection against haemorrhagic septicaemia virus (i.e., no mortality at 20°C compared with 24% at 15°C) (24). In the latter study, the authors concluded that fish at lower temperature had a delay in the host response and that this provided a window for viral growth. In addition to susceptibility, the adaptive immune system might respond differently to temperature and hypoxia compared with the innate immune response. For example, Atlantic salmon vaccinated for V. salmonicida at 2, 4, and 6°C had better protection against infection than fish vaccinated at 8 or 10°C (120). Collectively, these findings suggest that we have a lot more to learn about fish immune function, and how to protect commercially important aquaculture species from pathogens in the face of accelerated climate change.
Data Availability Statement
The qPCR data generated for this study are included in the article/Supplementary Material.
Ethics Statement
This study was conducted in accordance with the guidelines of the Canadian Council on Animal Care, and approved by the Institutional Animal Care Committee of Memorial University of Newfoundland, Canada (Protocol #16-90 KG).
Author Contributions
Specifically, FZ, AG, AB, and MR contributed to the experimental design. FZ, AB, and AG carried out the experiment and samplings. JH performed the immune-related transcript expression study, and along with FZ wrote the materials and methods section. FZ performed the humoral immune assays, generated the figures, analyzed results and wrote the manuscript. AB, AG, JH, and MR revised the manuscript. All authors have made a substantial and intellectual contribution to the study, and approved it for publication.
Funding
This research described above is part of the MICCSA project, and was funded by the Atlantic Canada Opportunities Agency (781-9658-205222), Innovate NL (5404-1209-104) and the Innovate PEI Graduate and Post-Doctoral Fellowship Fund. The primer pairs for viperin-b were kindly provided by Dr. Caballero-Solares while he was funded by the Biomarker Platform for Commercial Aquaculture Feed Development project, this is a Genomic Applications Partnership Program (GAPP #6604) project, funded by the Government of Canada through Genome Canada and Genome Atlantic.
Conflict of Interest
The authors declare that the research was conducted in the absence of any commercial or financial relationships that could be construed as a potential conflict of interest.
Acknowledgments
We thank Danny Boyce and the staff of the Dr. Joe Brown Aquatic Research Building (JBARB) (Ocean Sciences Centre, Memorial University, NL) for assistance with fish care, and Sylvie Lirette (Charles River Laboratories, Constant, QC, Canada) for providing the rabbit blood used in the complement assays. We are very grateful to MacGregor Parent, Olufemi Ajiboye, Tasha Harrold, and Rebeccah Sandrelli for assistance with fish sampling, and Tasha Harrold for management of the Mitigating the Impact of Climate-Related Challenges on Salmon Aquaculture (MICCSA) project. We also would like to thank Dr. Caballero-Solares for providing the primer pairs for viperin-b.
Supplementary Material
The Supplementary Material for this article can be found online at: https://www.frontiersin.org/articles/10.3389/fimmu.2020.01009/full#supplementary-material
References
1. Bindoff NL, Cheung WWL, Kairo JG, Arístegui J, Guinder VA, Hallberg R, et al. Changing ocean, marine ecosystems, and dependent communities. In: Pörtner H-O, Roberts DC, Masson-Delmotte V, Zhai P, Tignor M, Poloczanska E, et al., editors. IPCC Special Report on the Ocean and Cryosphere in a Changing Climate (2019).
2. Collins M, Knutti R, Arblaster J, Dufresne J-L, Fichefet T, Friedlingstein P, et al. Long-term climate change: projections, commitments and irreversibility. In: Stocker TF, Qin D, Plattner G-K, Tignor M, Allen SK, Boschung J, et al., editors. Climate Change 2013: The Physical Science Basis Contribution of Working Group I to the Fifth Assessment Report of the Intergovernmental Panel on Climate Change. Cambridge University Press: Cambridge, New York, NY (2013).
3. Butzin M, Portner HO. Thermal growth potential of Atlantic cod by the end of the 21st century. Global Change Biol. (2016) 22:4162–8. doi: 10.1111/gcb.13375
4. Portner HO, Peck MA. Climate change effects on fishes and fisheries: towards a cause-and-effect understanding. J Fish Biol. (2010) 77:1745–79. doi: 10.1111/j.1095-8649.2010.02783.x
5. Shultz AD, Zuckerman ZC, Suski CD. Thermal tolerance of nearshore fishes across seasons: implications for coastal fish communities in a changing climate. Mar Biol. (2016) 163:83. doi: 10.1007/s00227-016-2858-2
6. Ficke AD, Myrick CA, Hansen LJ. Potential impacts of global climate change on freshwater fisheries. Rev Fish Biol Fisher. (2007) 17:581–613. doi: 10.1007/s11160-007-9059-5
7. Breitburg D, Levin LA, Oschlies A, Gregoire M, Chavez FP, Conley DJ, et al. Declining oxygen in the global ocean and coastal waters. Science. (2018) 359:46. doi: 10.1126/science.aam7240
8. Diaz RJ, Rosenberg R. Spreading dead zones and consequences for marine ecosystems. Science. (2008) 321:926–9. doi: 10.1126/science.1156401
9. Rabalais NN, Diaz RJ, Levin LA, Turner RE, Gilbert D, Zhang J. Dynamics and distribution of natural and human-caused hypoxia. Biogeosciences. (2010) 7:585–619. doi: 10.5194/bg-7-585-2010
10. Stehfest KM, Carter CG, McAllister JD, Ross JD, Semmens JM. Response of Atlantic salmon Salmo salar to temperature and dissolved oxygen extremes established using animal-borne environmental sensors. Sci Rep. (2017) 7:4545. doi: 10.1038/s41598-017-04806-2
11. Burt K, Hamoutene D, Mabrouk G, Lang C, Puestow T, Drover D, et al. Environmental conditions and occurrence of hypoxia within production cages of Atlantic salmon on the south coast of Newfoundland. Aquac Res. (2012) 43:607–20. doi: 10.1111/j.1365-2109.2011.02867.x
12. Johansson D, Juell JE, Oppedal F, Stiansen JE, Ruohonen K. The influence of the pycnocline and cage resistance on current flow, oxygen flux and swimming behaviour of Atlantic salmon (Salmo salar L.) in production cages. Aquaculture. (2007) 265:271–87. doi: 10.1016/j.aquaculture.2006.12.047
13. Wade NM, Clark TD, Maynard BT, Atherton S, Wilkinson RJ, Smullen RP, et al. Effects of an unprecedented summer heatwave on the growth performance, flesh colour and plasma biochemistry of marine cage-farmed Atlantic salmon (Salmo salar). J Therm Biol. (2019) 80:64–74. doi: 10.1016/j.jtherbio.2018.12.021
14. Raida MK, Buchmann K. Temperature-dependent expression of immune-relevant genes in rainbow trout following Yersinia ruckeri vaccination. Dis Aquat Organ. (2007) 77:41–52. doi: 10.3354/dao01808
15. Makrinos DL, Bowden TJ. Natural environmental impacts on teleost immune function. Fish Shellfish Immun. (2016) 53:50–7. doi: 10.1016/j.fsi.2016.03.008
16. Bowden TJ. Modulation of the immune system of fish by their environment. Fish Shellfish Immun. (2008) 25:373–83. doi: 10.1016/j.fsi.2008.03.017
17. Sugahara K, Eguchi M. The use of warmed water treatment to induce protective immunity against the bacterial cold-water disease pathogen Flavobacterium psychrophilum in ayu (Plecoglossus altivelis). Fish Shellfish Immun. (2012) 32:489–93. doi: 10.1016/j.fsi.2011.12.005
18. Huang ZH, Ma AJ, Wang XA, Lei JL, Li WY, Wang T, et al. Interaction of temperature and salinity on the expression of immunity factors in different tissues of juvenile turbot Scophthalmus maximus based on response surface methodology. Chin J Oceanol Limn. (2015) 33:28–36. doi: 10.1007/s00343-015-4016-y
19. Ndong D, Chen YY, Lin YH, Vaseeharan B, Chen JC. The immune response of tilapia Oreochromis mossambicus and its susceptibility to Streptococcus iniae under stress in low and high temperatures. Fish Shellfish Immun. (2007) 22:686–94. doi: 10.1016/j.fsi.2006.08.015
20. Nikoskelainen S, Bylund G, Lilius EM. Effect of environmental temperature on rainbow trout (Oncorhynchus mykiss) innate immunity. Dev Comp Immunol. (2004) 28:581–92. doi: 10.1016/j.dci.2003.10.003
21. Hoare R, Hovland H, Langston AL, Imsland A, Stefansson SO, Mulcahy M, et al. Susceptibility of three different strains of juvenile Atlantic halibut (Hippoglossus hippoglossus L.) cultured at two different temperatures to Vibrio anguillarum and temperature effect on antibody response. Fish Shellfish Immun. (2002) 13:111–23. doi: 10.1006/fsim.2001.0385
22. Cecchini S, Saroglia M. Antibody response in sea bass (Dicentrarchus labrax L.) in relation to water temperature and oxygenation. Aquac Res. (2002) 33:607–13. doi: 10.1046/j.1365-2109.2002.00698.x
23. Gradil AM, Wright GM, Speare DJ, Wadowska DW, Purcell S, Fast MD. The effects of temperature and body size on immunological development and responsiveness in juvenile shortnose sturgeon (Acipenser brevirostrum). Fish Shellfish Immun. (2014) 40:545–55. doi: 10.1016/j.fsi.2014.07.036
24. Avunje S, Oh M-J, Jung S-J. Impaired TLR2 and TLR7 response in olive flounder infected with viral haemorrhagic septicaemia virus at host susceptible 15°C but high at non-susceptible 20°C. Fish Shellfish Immun. (2013) 34:1236–43. doi: 10.1016/j.fsi.2013.02.012
25. Hori TS, Gamperl AK, Booman M, Nash GW, Rise ML. A moderate increase in ambient temperature modulates the Atlantic cod (Gadus morhua) spleen transcriptome response to intraperitoneal viral mimic injection. Bmc Genomics. (2012) 13:431. doi: 10.1186/1471-2164-13-431
26. Alcorn SW, Murray AL, Pascho RJ. Effects of rearing temperature on immune functions in sockeye salmon (Oncorhynchus nerka). Fish Shellfish Immun. (2002) 12:303–34. doi: 10.1006/fsim.2001.0373
27. Polinski M, Bridle A, Nowak B. Temperature-induced transcription of inflammatory mediators and the influence of Hsp70 following LPS stimulation of southern bluefin tuna peripheral blood leukocytes and kidney homogenates. Fish Shellfish Immun. (2013) 34:1147–57. doi: 10.1016/j.fsi.2013.01.026
28. Bailey C, Segner H, Casanova-Nakayama A, Wahli T. Who needs the hotspot? The effect of temperature on the fish host immune response to Tetracapsuloides bryosalmonae the causative agent of proliferative kidney disease. Fish Shellfish Immun. (2017) 63:424–37. doi: 10.1016/j.fsi.2017.02.039
29. Dittmar J, Janssen H, Kuske A, Kurtz J, Scharsack JP. Heat and immunity: an experimental heat wave alters immune functions in three-spined sticklebacks (Gasterosteus aculeatus). J Anim Ecol. (2014) 83:744–57. doi: 10.1111/1365-2656.12175
30. Cheng AC, Cheng SA, Chen YY, Chen JC. Effects of temperature change on the innate cellular and humoral immune responses of orange-spotted grouper Epinephelus coioides and its susceptibility to Vibrio alginolyticus. Fish Shellfish Immun. (2009) 26:768–72. doi: 10.1016/j.fsi.2009.03.011
31. Raida MK, Buchmann K. Bath vaccination of rainbow trout (Oncorhynchus mykiss Walbaum) against Yersinia ruckeri: effects of temperature on protection and gene expression. Vaccine. (2008) 26:1050–62. doi: 10.1016/j.vaccine.2007.12.029
32. Pettersen EF, Bjørløw I, Hagland TJ, Wergeland HI. Effect of seawater temperature on leucocyte populations in Atlantic salmon post-smolts. Vet Immunol Immunop. (2005) 106:65–76. doi: 10.1016/j.vetimm.2005.01.001
33. Magnadottir B, Jonsdottir H, Helgason S, Bjornsson B, Jorgensen TO, Pilstrom L. Humoral immune parameters in Atlantic cod (Gadus morhua L.) - I. The effects of environmental temperature. Comp Biochem Phys B. (1999) 122:173–80. doi: 10.1016/S0305-0491(98)10156-6
34. Perez-Casanova JC, Rise ML, Dixon B, Afonso LOB, Hall JR, Johnson SC, et al. The immune and stress responses of Atlantic cod to long-term increases in water temperature. Fish Shellfish Immun. (2008) 24:600–9. doi: 10.1016/j.fsi.2008.01.012
35. Bowden TJ, Thompson KD, Morgan AL, Gratacap RML, Nikoskelainen S. Seasonal variation and the immune response: a fish perspective. Fish Shellfish Immun. (2007) 22:695–706. doi: 10.1016/j.fsi.2006.08.016
36. Le Morvan C, Troutaud D, Deschaux P. Differential effects of temperature on specific and nonspecific immune defences in fish. J Exp Biol. (1998) 201:165–8.
37. Gamperl AK, Ajiboye OO, Zanuzzo FS, Sandrelli RM, Peroni EdFC, Beemelmanns A. The impacts of increasing temperature and moderate hypoxia on the production characteristics, cardiac morphology and haematology of Atlantic Salmon (Salmo salar). Aquaculture. (2020) 519:734874. doi: 10.1016/j.aquaculture.2019.734874
38. Esteve C, Merchan R, Alcaide E. An outbreak of Shewanella putrefaciens group in wild eels Anguilla anguilla L favoured by hypoxic aquatic environments. J Fish Dis. (2017) 40:929–39. doi: 10.1111/jfd.12574
39. Abdel-Tawwab M, Monier MN, Hoseinifar SH, Faggio C. Fish response to hypoxia stress: growth, physiological, and immunological biomarkers. Fish Physiol Biochem. (2019) 45:997–1013. doi: 10.1007/s10695-019-00614-9
40. Bosch-Belmar M, Giomi F, Rinaldi A, Mandich A, Fuentes V, Mirto S, et al. Concurrent environmental stressors and jellyfish stings impair caged European sea bass (Dicentrarchus labrax) physiological performances. Sci Rep. (2016) 6:27929. doi: 10.1038/srep27929
41. Rodriguez FE, Valenzuela B, Farias A, Sandino AM, Imarai M. beta-1,3/1,6-Glucan-supplemented diets antagonize immune inhibitory effects of hypoxia and enhance the immune response to a model vaccine. Fish Shellfish Immunol. (2016) 59:36–45. doi: 10.1016/j.fsi.2016.10.020
42. Burt K, Hamoutene D, Perez-Casanova J, Gamperl AK, Volkoff H. The effect of intermittent hypoxia on growth, appetite and some aspects of the immune response of Atlantic salmon (Salmo salar). Aquac Res. (2013) 45:124–37. doi: 10.1111/j.1365-2109.2012.03211.x
43. Kvamme BO, Gadan K, Finne-Fridell F, Niklasson L, Sundh H, Sundell K, et al. Modulation of innate immune responses in Atlantic salmon by chronic hypoxia-induced stress. Fish Shellfish Immun. (2013) 34:55–65. doi: 10.1016/j.fsi.2012.10.006
44. Wang J, Lu DQ, Jiang B, Luo HL, Lu GL, Li AX. The effect of intermittent hypoxia under different temperature on the immunomodulation in Streptococcus agalactiae vaccinated Nile tilapia (Oreochromis niloticus). Fish Shellfish Immunol. (2018) 79:181–92. doi: 10.1016/j.fsi.2018.04.040
45. Niklasson L, Sundh H, Fridell F, Taranger GL, Sundell K. Disturbance of the intestinal mucosal immune system of farmed Atlantic salmon (Salmo salar), in response to long-term hypoxic conditions. Fish Shellfish Immun. (2011) 31:1072–80. doi: 10.1016/j.fsi.2011.09.011
46. Burke H, Gardner I, Farrell AP. A Review of the 2019 Newfoundland and Labrador South Coast Cultured Atlantic Salmon Mortality Event St. John's, NL, Canada: Department of Fisheris and Land Resources, Government of Newfoundland and Labrador, Special Studies and Reports (2020).
47. Soto-Dávila M, Valderrama K, Inkpen SM, Hall JR, Rise ML, Santander J. Effects of Vitamin D2 (Ergocalciferol) and D3 (Cholecalciferol) on Atlantic Salmon (Salmo salar) Primary Macrophage Immune Response to Aeromonas salmonicida subsp. Salmonicida Infection. Front Immunol. (2020) 10:3011. doi: 10.3389/fimmu.2019.03011
48. Caballero-Solares A, Hall JR, Xue X, Eslamloo K, Taylor RG, Parrish CC, et al. The dietary replacement of marine ingredients by terrestrial animal and plant alternatives modulates the antiviral immune response of Atlantic salmon (Salmo salar). Fish Shellfish Immun. (2017) 64:24–38. doi: 10.1016/j.fsi.2017.02.040
49. Eslamloo K, Kumar S, Caballero-Solares A, Gnanagobal H, Santander J, Rise ML. Profiling the transcriptome response of Atlantic salmon head kidney to formalin-killed Renibacterium salmoninarum. Fish Shellfish Immunol. (2019) 98:937–49. doi: 10.1016/j.fsi.2019.11.057
50. Smith NC, Christian SL, Taylor RG, Santander J, Rise ML. Immune modulatory properties of 6-gingerol and resveratrol in Atlantic salmon macrophages. Mol Immunol. (2018) 95:10–9. doi: 10.1142/10755
51. Marnila P, Tiiska A, Lagerspetz K, Lilius EM. Phagocyte activity in the frog rana-temporaria - whole-blood chemiluminescence method and the effects of temperature and thermal-acclimation. Comp Biochem Phys A. (1995) 111:609–14. doi: 10.1016/0300-9629(95)00054-B
52. Nikoskelainen S, Kjellsen O, Lilius EM, Schroder MB. Respiratory burst activity of Atlantic cod (Gadus morhua L.) blood phagocytes differs markedly from that of rainbow trout. Fish Shellfish Immun. (2006) 21:199–208. doi: 10.1016/j.fsi.2005.11.008
53. Ferriani VPL, Barbosa JE, Decarvalho IF. Serum hemolytic classical and alternative pathways of complement in infancy - age-related-changes. Acta Paediatr Scand. (1990) 79:322–7. doi: 10.1111/j.1651-2227.1990.tb11464.x
54. Polhill RB, Newman SL, Pruitt KM, Johnston RB. Kinetic assessment of alternative complement pathway activity in a hemolytic system 2. Influence of antibody on alternative pathway activation. J Immunol. (1978) 121:371–6.
55. Zanuzzo FS, Urbinati EC, Nash GW, Gamperl AK. Steelhead trout Oncorhynchus mykiss metabolic rate is affected by dietary Aloe vera inclusion but not by mounting an immune response against formalin-killed Aeromonas salmonicida. J Fish Biol. (2015) 87:43–53. doi: 10.1111/jfb.12690
56. Demers NE, Bayne CJ. The immediate effects of stress on hormones and plasma lysozyme in rainbow trout. Dev Comp Immunol. (1997) 21:363–73. doi: 10.1016/S0145-305X(97)00009-8
57. Vandesompele J, De Preter K, Pattyn F, Poppe B, Van Roy N, De Paepe A, et al. Accurate normalization of real-time quantitative RT-PCR data by geometric averaging of multiple internal control genes. Genome Biol. (2002) 3:research0034.1. doi: 10.1186/gb-2002-3-7-research0034
58. Guerreiro I, Perez-Jimenez A, Costas B, Oliva-Teles A. Effect of temperature and short chain fructooligosaccharides supplementation on the hepatic oxidative status and immune response of turbot (Scophthalmus maximus). Fish Shellfish Immun. (2014) 40:570–6. doi: 10.1016/j.fsi.2014.08.017
59. Shahjahan M, Uddin MH, Bain V, Haque MM. Increased water temperature altered hemato-biochemical parameters and structure of peripheral erythrocytes in striped catfish Pangasianodon hypophthalmus. Fish Physiol Biochem. (2018) 44:1309–18. doi: 10.1007/s10695-018-0522-0
60. Valenzuela A, Silva V, Tarifeno E, Klempau A. Effect of acute hypoxia in trout (Oncorhynchus mykiss) on immature erythrocyte release and production of oxidative radicals. Fish Physiol Biochem. (2005) 31:65–72. doi: 10.1007/s10695-005-5288-5
61. Valero Y, Garcia-Alcazar A, Esteban MA, Cuesta A, Chaves-Pozo E. Seasonal variations of the humoral immune parameters of European sea bass (Dicentrarchus labrax L.). Fish Shellfish Immun. (2014) 39:185–7. doi: 10.1016/j.fsi.2014.05.011
62. Salazar-Lugo R, Estrella A, Oliveros A, Rojas-Villarroel E, Villalobos L, Lemus M. Paraquat and temperature affect nonspecific immune response of neotropical freshwater fish Colossoma macropomum. Toxicol Lett. (2009) 189:S172–S3. doi: 10.1016/j.toxlet.2009.06.658
63. Huising MO, Stet RJM, Savelkoul HFJ, Verburg-van Kemenade BML. The molecular evolution of the interleukin-1 family of cytokines; IL-18 in teleost fish. Dev Comp Immunol. (2004) 28:395–413. doi: 10.1016/j.dci.2003.09.005
64. Harun NO, Zou J, Zhang YA, Nie P, Secombes CJ. The biological effects of rainbow trout (Oncorhynchus mykiss) recombinant interleukin-8. Dev Comp Immunol. (2008) 32:673–81. doi: 10.1016/j.dci.2007.10.005
65. Shi JS, Camus AC. Hepcidins in amphibians and fishes: antimicrobial peptides or iron-regulatory hormones? Dev Comp Immunol. (2006) 30:746–55. doi: 10.1016/j.dci.2005.10.009
66. Tsujita T, Tsukada H, Nakao M, Oshiumi H, Matsumoto M, Seya T. Sensing bacterial flagellin by membrane and soluble orthologs of toll-like receptor 5 in rainbow trout (Onchorhynchus mikiss). J Biol Chem. (2004) 279:48588–97. doi: 10.1074/jbc.M407634200
67. Cui HC, Yan Y, Wei JG, Huang XH, Huang YH, Ouyang ZL, et al. Identification and functional characterization of an interferon regulatory factor 7-like (IRF7-like) gene from orange-spotted grouper, Epinephelus coioides. Dev Comp Immunol. (2011) 35:672–84. doi: 10.1016/j.dci.2011.01.021
68. Chiou PP, Khoo J, Bols NC, Douglas S, Chen TT. Effects of linear cationic alpha-helical antimicrobial peptides on immune-relevant genes in trout macrophages. Dev Comp Immunol. (2006) 30:797–806. doi: 10.1016/j.dci.2005.10.011
69. Ishikawa TO, Herschman HR. Two inducible, functional cyclooxygenase-2 genes are present in the rainbow trout genome. J Cell Biochem. (2007) 102:1486–92. doi: 10.1002/jcb.21368
70. Michel V, Peinnequin A, Alonso A, Buguet A, Cespuglio R, Canini F. Effect of glucocorticoid depletion on heat-induced Hsp70, IL-1β and TNF-α gene expression. Brain Res. (2007) 1164:63–71. doi: 10.1016/j.brainres.2007.06.011
71. Leon LR. The thermoregulatory consequences of heat stroke: are cytokines involved? J Therm Biol. (2006) 31:67–81. doi: 10.1016/j.jtherbio.2005.11.023
72. Hong S, Zou J, Crampe M, Peddie S, Scapigliati G, Bols N, et al. The production and bioactivity of rainbow trout (Oncorhynchus mykiss) recombinant IL-1 beta. Vet Immunol Immunop. (2001) 81:1–14. doi: 10.1016/S0165-2427(01)00328-2
73. Martin SAM, Zou J, Houlihan DF, Secombes CJ. Directional responses following recombinant cytokine stimulation of rainbow trout (Oncorhynchus mykiss) RTS-II macrophage cells as revealed by transcriptome profiling. BMC Genomics. (2007) 8:150. doi: 10.1186/1471-2164-8-150
75. Wilkins LGE, Rogivue A, Schutz F, Fumagalli L, Wedekind C. Increased diversity of egg-associated bacteria on brown trout (Salmo trutta) at elevated temperatures. Sci Rep. (2015) 5:17084. doi: 10.1038/srep17084
76. Hagi T, Tanaka D, Iwamura Y, Hoshino T. Diversity and seasonal changes in lactic acid bacteria in the intestinal tract of cultured freshwater fish. Aquaculture. (2004) 234:335–46. doi: 10.1016/j.aquaculture.2004.01.018
77. Huyben D, Sun L, Moccia R, Kiessling A, Dicksved J, Lundh T. Dietary live yeast and increased water temperature influence the gut microbiota of rainbow trout. J Appl Microbiol. (2018) 124:1377–92. doi: 10.1111/jam.13738
78. Giatsis C, Sipkema D, Smidt H, Heilig H, Benvenuti G, Verreth J, et al. The impact of rearing environment on the development of gut microbiota in tilapia larvae. Sci Rep. (2015) 5:18206. doi: 10.1038/srep18206
79. Gomez GD, Balcazar JL. A review on the interactions between gut microbiota and innate immunity of fish. Fems Immunol Med Mic. (2008) 52:145–54. doi: 10.1111/j.1574-695X.2007.00343.x
80. De Schryver P, Vadstein O. Ecological theory as a foundation to control pathogenic invasion in aquaculture. ISME J. (2014) 8:2360–8. doi: 10.1038/ismej.2014.84
81. Rawls JF, Samuel BS, Gordon JI. Gnotobiotic zebrafish reveal evolutionarily conserved responses to the gut microbiota. Proc Natl Acad Sci USA. (2004) 101:4596–601. doi: 10.1073/pnas.0400706101
82. Yukgehnaish K, Kumar P, Sivachandran P, Marimuthu K, Arshad A, Paray BA, et al. Gut microbiota metagenomics in aquaculture: factors influencing gut microbiome and its physiological role in fish. Rev Aquacult. (2020) 1–25. doi: 10.1111/raq.12416
83. Foysal MJ, Alam M, Kawser AQMR, Hasan F, Rahman MM, Tay CY, et al. Meta-omics technologies reveals beneficiary effects of Lactobacillus plantarum as dietary supplements on gut microbiota, immune response and disease resistance of Nile tilapia (Oreochromis niloticus). Aquaculture. (2020) 520:734974. doi: 10.1016/j.aquaculture.2020.734974
84. Wang TT, Lin P, Guo SL, Wang YL, Zhang ZP, Feng JJ. Molecular characterization and expression analysis of signal transducer and activator of transcription 1 (STAT1) in Japanese eel Anguilla japonica. Fish Shellfish Immun. (2019) 86:956–64. doi: 10.1016/j.fsi.2018.12.046
85. Zanuzzo FS, Urbinati EC, Rise ML, Hall JR, Nash GW, Gamperl AK. Aeromonas salmonicida induced immune gene expression in Aloe vera fed steelhead trout, Oncorhynchus mykiss (Walbaum). Aquaculture. (2015) 435:1–9. doi: 10.1016/j.aquaculture.2014.09.010
86. Bjelland AM, Fauske AK, Nguyen A, Orlien IE, Ostgaard IM, Sorum H. Expression of Vibrio salmonicida virulence genes and immune response parameters in experimentally challenged Atlantic salmon (Salmo salar L.). Front Microbiol. (2013) 4:401. doi: 10.3389/fmicb.2013.00401
87. Kibenge FSB. Emerging viruses in aquaculture. Curr Opin Virol. (2019) 34:97–103. doi: 10.1016/j.coviro.2018.12.008
88. Collet B, Urquhart K, Monte M, Collins C, Perez SG, Secombes CJ, et al. Individual monitoring of immune response in Atlantic salmon salmo salar following experimental infection with infectious Salmon Anaemia Virus (ISAV). PLoS ONE. (2015) 10:e0137767. doi: 10.1371/journal.pone.0137767
89. McBeath AJA, Snow M, Secombes CJ, Ellis AE, Collet B. Expression kinetics of interferon and interferon-induced genes in Atlantic salmon (Salmo salar) following infection with infectious pancreatic necrosis virus and infectious salmon anaemia virus. Fish Shellfish Immun. (2007) 22:230–41. doi: 10.1016/j.fsi.2006.05.004
90. Wolf A, Hodneland K, Frost P, Hoeijmakers M, Rimstad E. Salmonid alphavirus-based replicon vaccine against infectious salmon anemia (ISA): impact of immunization route and interactions of the replicon vector. Fish Shellfish Immun. (2014) 36:383–92. doi: 10.1016/j.fsi.2013.12.018
91. LeBlanc F, Laflamme M, Gagne N. Genetic markers of the immune response of Atlantic salmon (Salmo salar) to infectious salmon anemia virus (ISAV). Fish Shellfish Immun. (2010) 29:217–32. doi: 10.1016/j.fsi.2010.03.007
92. LeBlanc F, Arseneau JR, Leadbeater S, Glebe B, Laflamme M, Gagne N. Transcriptional response of Atlantic salmon (Salmo salar) after primary versus secondary exposure to infectious salmon anemia virus (ISAV). Mol Immunol. (2012) 51:197–209. doi: 10.1016/j.molimm.2012.03.021
93. Caruffo M, Maturana C, Kambalapally S, Larenas J, Tobar JA. Protective oral vaccination against infectious salmon anaemia virus in Salmo salar. Fish Shellfish Immun. (2016) 54:54–9. doi: 10.1016/j.fsi.2016.03.009
94. Boucontet L, Passoni G, Thiry V, Maggi L, Herbomel P, Levraud JP, et al. A model of superinfection of virus-infected zebrafish larvae: increased susceptibility to bacteria associated with neutrophil death. Front Immunol. (2018) 9:1084. doi: 10.3389/fimmu.2018.01084
95. McCullers JA, Rehg JE. Lethal Synergism between influenza virus and Streptococcus pneumoniae: characterization of a mouse model and the role of platelet-activating factor receptor. J Infect Dis. (2002) 186:341–50. doi: 10.1086/341462
96. Berg J, Zscheppang K, Fatykhova D, Tonnies M, Bauer TT, Schneider P, et al. Tyk2 as a target for immune regulation in human viral/bacterial pneumonia. Eur Respir J. (2017) 50:1601953. doi: 10.1183/13993003.01953-2016
97. Busch RA. Polyvalent vaccines in fish: the interactive effects of multiple antigens. Fish Vaccinology. (1997) 90:245–56.
98. Thanasaksiri K, Hirono I, Kondo H. Temperature-dependent regulation of gene expression in poly (I:C)-treated Japanese flounder, Paralichthys olivaceus. Fish Shellfish Immun. (2015) 45:835–40. doi: 10.1016/j.fsi.2015.05.036
99. Wang J, Lu D-Q, Jiang B, Mo X-B, Du J-J, Li A-X. Influence of temperature on the vaccine efficacy against Streptococcus agalactiae in Nile tilapia (Oreochromis niloticus). Aquaculture. (2020) 521:734943. doi: 10.1016/j.aquaculture.2020.734943
100. Dios S, Romero A, Chamorro R, Figueras A, Novoa B. Effect of the temperature during antiviral immune response ontogeny in teleosts. Fish Shellfish Immun. (2010) 29:1019–27. doi: 10.1016/j.fsi.2010.08.006
101. Yang Y, Yu H, Li H, Wang AL, Yu HY. Effect of high temperature on immune response of grass carp (Ctenopharyngodon idellus) by transcriptome analysis. Fish Shellfish Immun. (2016) 58:89–95. doi: 10.1016/j.fsi.2016.09.014
102. Thanasaksiri K, Sakai N, Yamashita H, Hirono I, Kondo H. Influence of temperature on Mx gene expression profiles and the protection of sevenband grouper, Epinephelus septemfasciatus, against red-spotted grouper nervous necrosis virus (RGNNV) infection after poly (I:C) injection. Fish Shellfish Immun. (2014) 40:441–5. doi: 10.1016/j.fsi.2014.07.035
103. Hori TS, Gamperl AK, Nash G, Booman M, Barat A, Rise ML. The impact of a moderate chronic temperature increase on spleen immune-relevant gene transcription depends on whether Atlantic cod (Gadus morhua) are stimulated with bacterial versus viral antigens. Genome. (2013) 56:567–76. doi: 10.1139/gen-2013-0090
104. Kaneshige N, Jirapongpairoj W, Hirono I, Kondo H. Temperature-dependent regulation of gene expression in Japanese flounder Paralichthys olivaceus kidney after Edwardsiella tarda formalin-killed cells. Fish Shellfish Immun. (2016) 59:298–304. doi: 10.1016/j.fsi.2016.10.048
105. Zou J, Secombes CJ. Teleost fish interferons and their role in immunity. Dev Comp Immunol. (2011) 35:1376–87. doi: 10.1016/j.dci.2011.07.001
106. Hvas M, Folkedal O, Imsland A, Oppedal F. The effect of thermal acclimation on aerobic scope and critical swimming speed in Atlantic salmon, Salmo salar. J Exp Biol. (2017) 220:2757–64. doi: 10.1242/jeb.154021
107. Prophete C, Carlson EA, Li Y, Duffy J, Steinetz B, Lasano S, et al. Effects of elevated temperature and nickel pollution on the immune status of Japanese medaka. Fish Shellfish Immun. (2006) 21:325–34. doi: 10.1016/j.fsi.2005.12.009
108. Lewis JM, Hori TS, Rise ML, Walsh PJ, Currie S. Transcriptome responses to heat stress in the nucleated red blood cells of the rainbow trout (Oncorhynchus mykiss). Physiol Genomics. (2010) 42:361–73. doi: 10.1152/physiolgenomics.00067.2010
109. Li B, Sun S, Zhu J, Yanli S, Wuxiao Z, Ge X. Transcriptome profiling and histology changes in juvenile blunt snout bream (Megalobrama amblycephala) liver tissue in response to acute thermal stress. Genomics. (2018) 111:242–50. doi: 10.1016/j.ygeno.2018.11.011
110. Leal MJ, Van Eenennaam JP, Schreier AD, Todgham AE. Triploidy in white sturgeon (Acipenser transmontanus): effects of acute stress and warm acclimation on physiological performance. Comp Biochem Physiol A. (2019) 229:10–7. doi: 10.1016/j.cbpa.2018.11.006
111. Panase P, Saenphet S, Saenphet K, Pathike P, Thainum R. Biochemical and physiological responses of Nile tilapia (Oreochromis niloticus Linn.) subjected to rapid increases of water temperature. Comp Clin Path. (2019) 28:493–9. doi: 10.1007/s00580-018-2872-5
112. Hori TS, Gamperl AK, Afonso LOB, Johnson SC, Hubert S, Kimball J, et al. Heat-shock responsive genes identified and validated in Atlantic cod (Gadus morhua) liver, head kidney and skeletal muscle using genomic techniques. BMC Genomics. (2010) 11:72. doi: 10.1186/1471-2164-11-72
113. Tromp JJ, Jones PL, Brown MS, Donald JA, Biro PA, Afonso LOB. Chronic exposure to increased water temperature reveals few impacts on stress physiology and growth responses in juvenile Atlantic salmon. Aquaculture. (2018) 495:196–204. doi: 10.1016/j.aquaculture.2018.05.042
114. Eldridge WH, Sweeney BW, Mac Law J. Fish growth, physiological stress, and tissue condition in response to rate of temperature change during cool or warm diel thermal cycles. Can J Fish Aquat Sci. (2015) 72:1527–37. doi: 10.1139/cjfas-2014-0350
115. Cho HC, Kim JE, Kim HB, Baek HJ. Effects of water temperature change on the hematological responses and plasma cortisol levels in growing of red spotted grouper, Epinephelus akaara. Dev Reprod. (2015) 19:19–24. doi: 10.12717/DR.2015.19.1.019
116. Zanuzzo FS, Sabioni RE, Marzocchi-Machado CM, Urbinati EC. Modulation of stress and innate immune response by corticosteroids in pacu (Piaractus mesopotamicus). Comp Biochem Physiol A. (2019) 231:39–48. doi: 10.1016/j.cbpa.2019.01.019
117. Gallage S, Katagiri T, Endo M, Futami K, Endo M, Maita M. Influence of moderate hypoxia on vaccine efficacy against Vibrio anguillarum in Oreochromis niloticus (Nile tilapia). Fish Shellfish Immunol. (2016) 51:271–81. doi: 10.1016/j.fsi.2016.02.024
118. Andersen L, Hodneland K, Nylund A. No influence of oxygen levels on pathogenesis and virus shedding in Salmonid alphavirus (SAV)-challenged Atlantic salmon (Salmo salar L.). Virol J. (2010) 7:198. doi: 10.1186/1743-422X-7-198
119. Magnoni LJ, Novais SC, Eding E, Leguen I, Lemos MFL, Ozório ROA, et al. Acute stress and an electrolyte- imbalanced diet, but not chronic hypoxia, increase oxidative stress and hamper innate immune status in a Rainbow Trout (Oncorhynchus mykiss) isogenic line. Front Physiol. (2019) 10:453. doi: 10.3389/fphys.2019.00453
Keywords: aquaculture, global warming, fish, disease susceptibility, immune response, climate change, high temperature, hypoxia
Citation: Zanuzzo FS, Beemelmanns A, Hall JR, Rise ML and Gamperl AK (2020) The Innate Immune Response of Atlantic Salmon (Salmo salar) Is Not Negatively Affected by High Temperature and Moderate Hypoxia. Front. Immunol. 11:1009. doi: 10.3389/fimmu.2020.01009
Received: 07 March 2020; Accepted: 28 April 2020;
Published: 27 May 2020.
Edited by:
Patrick C. Hanington, University of Alberta, CanadaReviewed by:
Kim Dawn Thompson, Moredun Research Institute, United KingdomM. Carla Piazzon, Torre de la Sal Aquaculture Institute (IATS), Spain
Copyright © 2020 Zanuzzo, Beemelmanns, Hall, Rise and Gamperl. This is an open-access article distributed under the terms of the Creative Commons Attribution License (CC BY). The use, distribution or reproduction in other forums is permitted, provided the original author(s) and the copyright owner(s) are credited and that the original publication in this journal is cited, in accordance with accepted academic practice. No use, distribution or reproduction is permitted which does not comply with these terms.
*Correspondence: Fábio S. Zanuzzo, ZmFiaW96QG11bi5jYQ==; ZmFiaW9zemFudXp6b0BnbWFpbC5jb20=
†Present address: Fábio S. Zanuzzo, Department of Ocean Sciences, Memorial University, St. John's, NL, Canada