 Alice Machado1,2†
 Marie Pouzolles1†Sarah Gailhac2
 Vanessa Fritz2
 Marco Craveiro2Uriel López-Sánchez2Taisuke Kondo1Francesca Pala3Marita Bosticardo3Luigi D. Notarangelo3Vincent Petit4
 Naomi Taylor1,2*‡
 Valérie S. Zimmermann1,2*‡
- 1Pediatric Oncology Branch, Center for Cancer Research, National Cancer Institute, National Institutes of Health (NIH), Bethesda, MD, United States
- 2Institut de Génétique Moléculaire de Montpellier, University of Montpellier, CNRS, Montpellier, France
- 3Laboratory of Clinical Immunology and Microbiology, Division of Intramural Research, National Institute of Allergy and Infectious Diseases, NIH, Bethesda, MD, United States
- 4Metafora-Biosystems, Paris, France
Thymocyte differentiation is dependent on the availability and transport of metabolites in the thymus niche. As expression of metabolite transporters is a rate-limiting step in nutrient utilization, cell surface transporter levels generally reflect the cell's metabolic state. The GLUT1 glucose transporter is upregulated on actively dividing thymocytes, identifying thymocytes with an increased metabolism. However, it is not clear whether transporters of essential elements such as phosphate are modulated during thymocyte differentiation. While PiT1 and PiT2 are both phosphate transporters in the SLC20 family, we show here that they exhibit distinct expression profiles on both murine and human thymocytes. PiT2 expression distinguishes thymocytes with high metabolic activity, identifying immature murine double negative (CD4−CD8−) DN3b and DN4 thymocyte blasts as well as immature single positive (ISP) CD8 thymocytes. Notably, the absence of PiT2 expression on RAG2-deficient thymocytes, blocked at the DN3a stage, strongly suggests that high PiT2 expression is restricted to thymocytes having undergone a productive TCRβ rearrangement at the DN3a/DN3b transition. Similarly, in the human thymus, PiT2 was upregulated on early post-β selection CD4+ISP and TCRαβ−CD4hiDP thymocytes co-expressing the CD71 transferrin receptor, a marker of metabolic activity. In marked contrast, expression of the PiT1 phosphate importer was detected on mature CD3+ murine and human thymocytes. Notably, PiT1 expression on CD3+DN thymocytes was identified as a biomarker of an aging thymus, increasing from 8.4 ± 1.5% to 42.4 ± 9.4% by 1 year of age (p < 0.0001). We identified these cells as TCRγδ and, most significantly, NKT, representing 77 ± 9% of PiT1+DN thymocytes by 1 year of age (p < 0.001). Thus, metabolic activity and thymic aging are associated with distinct expression profiles of the PiT1 and PiT2 phosphate transporters.
Introduction
The thymus is critical for the differentiation of T lymphocytes, promoting the generation of a pool of functionally competent T cells that provide protection against pathogens and tumors while maintaining self-tolerance. T cell differentiation in the thymus arises from progenitor cells that are derived from bone marrow hematopoietic stem cells (HSC) [reviewed in (1–5)]. Once progenitor cells enter into the thymus, the thymic environment generally results in their acquisition of a short-lived T cell precursor phenotype [as has been previously shown for common lymphocyte progenitors; (6, 7)]. Signals mediated through Notch1 (8), IL-7R (8), stem cell factor receptor (SCFR) (9) and CXCR4 (10) regulate the survival and proliferation of early T cell progenitors prior to the β-selection checkpoint. β-selection allows the differentiation of only those precursor T cells with productive, in-frame rearrangements of the TCRβ locus. In mice, β-selection occurs at a precise stage, within CD4−CD8− double negative (DN) 3 (CD25+CD44−) thymocytes (9) whereas in humans, this step occurs in CD4+ intermediate single positive (ISP) cells as well as in double positive (DP) CD4+CD8α+CD8β+ thymocytes (11, 12). This TCR rearrangement results in a proliferative burst of murine as well as human thymocytes (13, 14), requiring an increased metabolism that is dependent on PI3K signaling downstream of Notch, IL-7, CXCR4 and the TCR (15–21).
Our understanding of the metabolic changes that regulate T cell differentiation and proliferation has generally focused on the roles of sugars, amino acids and fatty acids (22–24). However, it is clear that oxygen tension and pH balance, as well as minerals, vitamins, and electrolytes also participate to the metabolic crosstalk that occurs during T cell development. Indeed, the uptake of calcium (25–27) and iron (28) have long been known to be critical for T cell differentiation and more recently, potassium has been shown to regulate the effector function of T lymphocytes (29, 30).
The metabolic needs of proliferating cells are generally procured by an augmented entry of nutrients into the cells. Cell surface transporter expression is a rate-limiting step in nutrient entry and the induction of glucose, glutamine and other amino transporters are required for optimal T cell proliferation and effector function (31–36). In the context of differentiation within the thymus, we and others have demonstrated an upregulation of the GLUT1 glucose transporter on metabolically active murine as well as human thymocytes (14, 37, 38). Critically, the absence of thymic GLUT1 has been shown to result in a 60–70% loss of thymocytes (37). Interestingly though, the SLC1A5 glutamine transporter does not appear to be required for murine thymocyte differentiation (31–36, 39), possibly due to a redundancy with other glutamine transporters. However, the transferrin receptor, mediating iron delivery into differentiating thymocytes via transferrin, distinguishes metabolically active thymocytes and is required for thymocyte differentiation (14, 28, 40). Thus, several metabolite transporters play critical roles in the potential of an early thymocyte progenitor to differentiate to a mature T lymphocyte.
Notably though, the role of mineral transporters in T cell differentiation have not been extensively studied. Phosphorous is the sixth most abundant element in the human body and its anion phosphate is the most abundant, accounting for 1% of total body weight (41, 42). Humans take up approximately 16 mg/kg of phosphate per day from their diet via Na(+)-dependent SLC34 transporters that are expressed in the kidney and small intestine (42, 43). Transport into other cell types is regulated by the Na(+)-dependent PiT1/SLC20A1 and PiT2/SLC20A2 transporters (44, 45). Furthermore, more recently, an inorganic phosphate exporter, XPR1/SLC53A1 has also been identified (46). PiT1 and PiT2 share 60% sequence homology and in addition to a high affinity for P(i) (47, 48), they serve as retroviral receptors for the gibbon ape leukemia virus and koala endogenous retrovirus (49, 50) as well as the amphotropic murine leukemia virus (51, 52), respectively. PiT1 and PiT2 expression as well as their heterodimerization have been shown to be modulated by phosphate concentrations, at least in certain cell types (46, 53, 54).
While phosphate uptake by PiT1 and PiT2 are essential for bone homeostasis (42, 43), it is now clear that PiT1 and PiT2 play critical roles in multiple cell types. PiT1 is critical for survival as its deletion results in embryonic lethality at E12.5 due to severe anemia (55) while mutations in both PiT2 and XPR1 are associated with primary familial brain calcification (Fahr's disease) (56–59). Conditional deletions of PiT1 have revealed an important role for this transporter in cell proliferation and development (60–63), erythroid and B cell differentiation (64, 65) as well as inflammation and wound healing (66, 67). However, the thymic expression profiles of neither the PiT1 nor the PiT2 phosphate transporter are known. We hypothesized that the PiT1 and PiT2 transporters would display differential expression profiles, potentially allowing the identification of thymocytes with distinct maturation states. Here, we identify PiT2 as a marker of metabolically active thymocytes in both the murine and human thymus. In contrast, PiT1 distinguishes a CD3+DN subset of DN thymocytes that increases with age. We identify the majority of these cells as NKT thymocytes, thereby serving as a potential marker of age-related thymic atrophy. Thus, phosphate transporter expression identifies distinct thymocyte subsets, correlating murine and human thymocyte differentiation and identifying thymus populations that change as a function of age.
Methods and Materials
Mice and Cell Lines
C57Bl/6 mice were purchased from Charles River and maintained under specific pathogen-free conditions in the IGMM animal facility (Montpellier, France) or the NCI animal facility (Bethesda, MD). Rag2−/− mice as well as Pmel-1 (B6.Cg-Thy1a/Cy Tg(TcraTcrb)8Rest/J) mice on a C57Bl/6 background were purchased from Jackson Laboratories. Unless indicated, mice were between 4 and 8 weeks of age. In indicated experiments, mice were 2 weeks, 8 weeks, or 1 year of age. All experiments were approved by the local animal facility institutional review boards. Animal care and experiments were performed in accordance with National Institutes of Health (NIH) and French national guidelines.
HAP1 cells, harboring a near-haploid genome, were derived from the chronic myelogenous leukemia (CML) cell line KBM-7 (68), and a gene edited HAP1 line with a deletion of SLC20A2/PiT2 was obtained from Horizon Discovery, as described (69). BxPC3, a pancreatic cancer cell line obtained from the ATCC, was used for shRNA-mediated knockdown of PiT1, as previously described (61).
Thymocyte Preparation
Murine thymi were removed after sacrifice. Human thymi were removed during corrective cardiac surgery of pediatric patients aged 4 months−7 years at La Timone Hospital or from the pathology department of the Children's National Medical Center in Washington, DC following cardiothoracic surgery from children with congenital heart disease, as the thymic tissue is routinely removed and discarded to gain adequate exposure of the retrosternal operative field. Use of these thymus samples for this study was determined to be exempt from review by the NIH Institutional Review Board in accordance with the guidelines issued by the Office of Human Research Protections. All tissues were processed after isolation. Tissue was transferred to a sterile 10 mm2 tissue culture dish. Single cell thymocyte suspensions were generated by physical disruption of tissue and filtration through 70 μm nylon screens.
Flow Cytometry
Murine thymocytes were stained with the following directly conjugated mAbs; CD3, CD25, CD8, CD71, c-Kit, CD44, CD11b, CD19, Ter119, Gr1, PD1, CD4, TCRγδ and NK1.1 (from Becton Dickinson, BioLegend or eBiosciences). Human thymocytes were stained with the following directly conjugated mAbs; CD8α, CD4, CD33, CD19, CD56, GlyA, TCRαβ, and CD71. Cells that were not thymocytes were eliminated with a dump including mAbs against CD19, Gr1, CD11b, and Ter119 for murine samples and CD19, CD33, ahd GlyA for human samples. Soluble ligands derived from the receptor binding domains (RBDs) of the HTLV, koala endogenous retrovirus (Ko-RBD) and mouse amphotropic-MLV (A-RBD) retrovirus were used to detect expression of their respective receptors; GLUT1, PiT1, and PiT2, as previously described (46, 70, 71) (Metafora biosystems). Stained cells were analyzed by flow cytometry (FACS-Canto II or LSR II-Fortessa, Becton Dickinson, San Jose, CA) and 1–2 × 10e6 events/sample were routinely acquired. The gating strategies for human and murine thymocytes are shown in Supplementary Figure 1. When indicated, molecules of equivalent soluble fluorochrome (MESF) were evaluated by Quantum MESF beads (Bang Laboratories, Fisher Indiana). Delta geometric mean fluorescence intensity (dGeo MFI) was calculated as the Geometric MFI of specific staining minus the Geometric MFI of the FMO. Data analyses were performed using Diva (BD Biosciences), and FlowJo Mac v.10.6.2 software (Tree Star).
Statistical Analyses
Data were analyzed using GraphPad software version 8 (Graph Pad Prism, La Jolla, CA) and p-values were calculated using unpaired t-tests and one- or two-way ANOVA (Tukey's multiple comparison test), as indicated. P-values for comparisons of all conditions in the different figure panels are presented in the figure legends.
Results
Surface Expression of the GLUT1 and PiT2 Transporters Characterizes ISP Murine Thymocytes
GLUT1 has previously been shown to be expressed on metabolically active murine and human thymocytes, with cell surface levels exhibiting significant differences as compared to mRNA or even intracellular protein levels (14, 37). This is critical as it is the rapid translocation of solute carriers from intracellular stores to the cell surface that reflects the cell's response to extracellular stimuli; this has been extensively described for the insulin-mediated induction of GLUT1/GLUT4 to the cell surface within minutes of stimulation (72, 73). However, measurements of the cell surface expression of multipass transmembrane proteins such as SLC2A1/GLUT1 and the phosphate importers (PiT) have been hindered by a paucity of reliable antibodies, due to sequence conservation and poor immunogenicity of extracellular loops (74). Here, we utilized tagged receptor binding domain (RBD) fusion proteins from the HTLV (H2-RBD), Koala endogenous retrovirus (Ko-RBD) and mouse amphotropic MLV retrovirus (A-RBD) to specifically detect expression of GLUT1, PiT1, and PiT2, respectively, as previously shown (46, 69–71, 74–77). The specificity of H2-RBD binding to GLUT1 has previously been reported (74, 76) and the specificity of Ko-RBD and A-RBD to PiT1 and PiT2, respectively, were evaluated as a function of shRNA-mediated knockdown and CRISPR gene editing (Supplementary Figure 2) (69).
Within the murine thymus, analyses of immature DN, DP, and single positive CD4 and CD8 thymocytes revealed the presence of subpopulations of GLUT1+ and PiT2+ cells within the DN and CD8+ thymocyte gates (Figure 1A). In contrast, distinct subsets of PiT1+ cells were not easily detected (Figure 1A). To evaluate the identity of the GLUT1+ and PiT2+ CD8 thymocyte subset, we assessed whether these transporters were expressed in the immature CD3− population or the mature CD3+ population. As shown in Figure 1B, the vast majority of GLUT1+ as well as PiT2+ cells were immature ISP thymocytes while PiT1 expression on CD8 thymocytes was not detected (p < 0.0001). Moreover, the geometric mean of GLUT1 and PiT2 expression decreased significantly between ISP8 and SP8 thymocytes, from 699 ± 167 to 330 ± 24 and 1970 ± 277 to 680 ± 237, respectively (p = 0.003 and p < 0.0001, respectively, Figures 1B,C). Expression of the CD71 transferrin receptor is often a marker of a cell's metabolic activity and it has been shown to be co-expressed with GLUT1 in the human thymus (14, 28). We therefore evaluated transporter profiles as a function of CD71 expression in ISP8 as compared to SP8 thymocytes. Notably, CD71 expression was largely confined to the ISP subset and was co-expressed by both GLUT1+ and PiT2+ thymocytes (78 ± 4% vs. 3 ± 1%, p < 0.0001 and 80 ± 6% vs. 4 ± 2%, p < 0.0001, respectively; Figure 1D). In contrast, PiT1 was not detected on the CD71+ISP subset (2 ± 2%). Together, these results demonstrate a strong association of GLUT1 and PiT2 on metabolically active murine ISP thymocytes (Figure 1D).
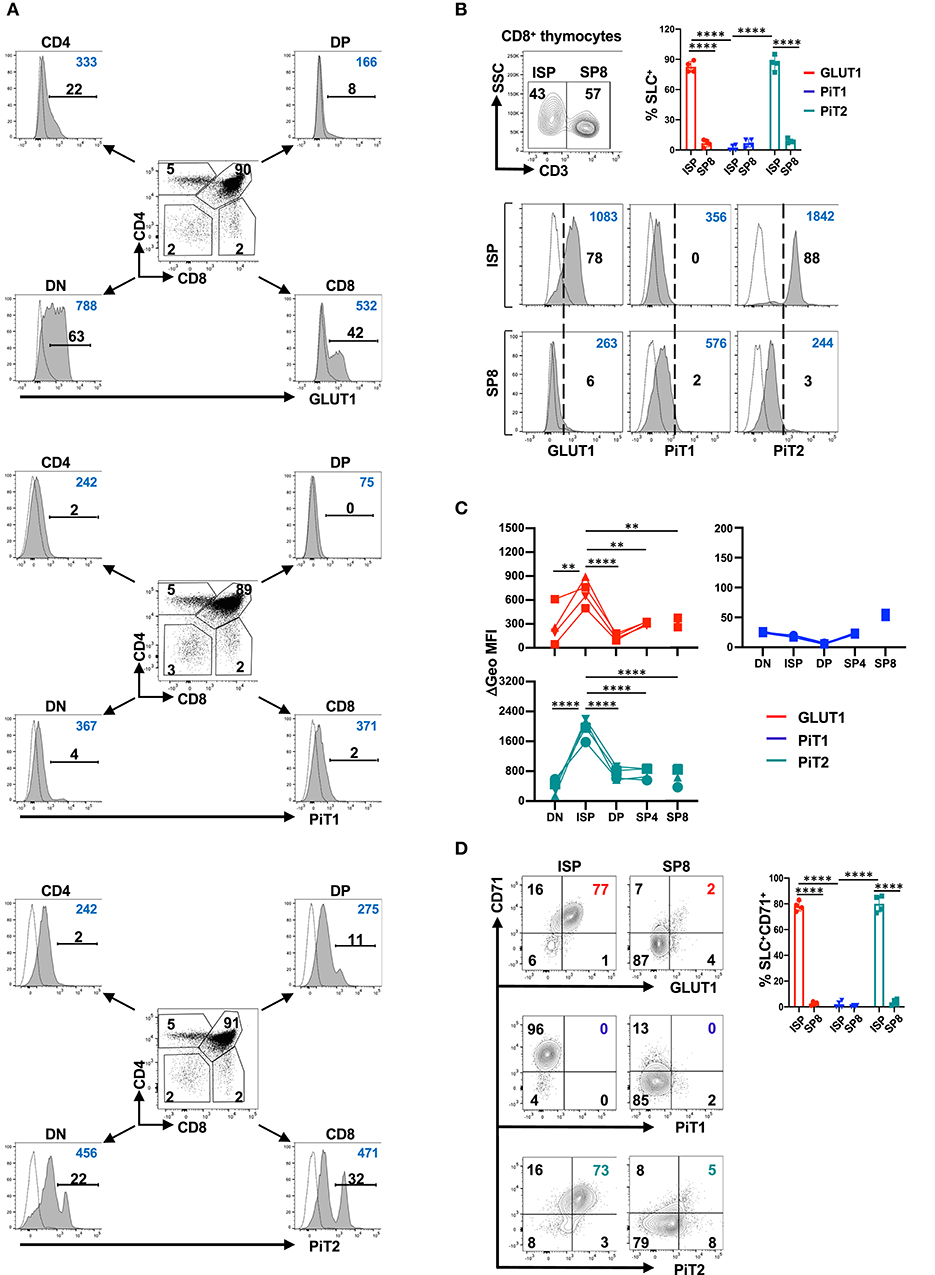
Figure 1. The PiT2 phosphate transporter is co-expressed with GLUT1 and CD71 transporters in the murine thymus. (A) Surface expression of the GLUT1 glucose transporter as well as PiT1 and PiT2 phosphate transporters were evaluated on murine thymocytes as a function of their CD4/CD8 profiles. Mean fluorescence intensity (MFI) on double negative (DN), double positive (DP), and single positive (SP) CD4 and CD8 thymocytes is shown for each transporter. Specific staining is shown in gray histograms and non-specific FMO staining is shown as dotted line histograms. The percentages of positively stained cells (black) and geometric MFIs (blue) in each histogram are indicated. Data are representative of one of eight individual thymi. (B) The distribution of CD3−CD8+ intermediate single positive (ISP) thymocytes and mature CD3+ SP8 thymocytes within the CD8+ thymocyte gate was evaluated as a function of CD3 staining and a representative dot plot is presented (top). GLUT1, PiT1 and PiT2 staining within the ISP and SP8 gates are presented relative to non-specific staining and percent staining (black) as well as geometric MFIs (blue) are indicated in each histogram (bottom). Data are representative of one of eight individual thymi and quantification of transporter (solute carrier, SLC) expression in ISP8 and SP8 thymocytes is shown. (C) Delta geometric MFIs of GLUT1 (red), PiT1 (blue) and PiT2 (green) staining in DN, ISP, DP, SP4, and SP8 subsets are presented for four individual thymi. (D) The phenotype of ISP and SP8 thymocytes was evaluated as a function of GLUT1, PiT1, and PiT2 transporters and the CD71 transferrin receptor and the percentages of cells in the different quadrants are indicated (left panel). Quantification of the percentages of solute carrier (SLC) + cells co-expressing CD71 in ISP and SP8 thymocytes are presented (n = 4, right panel). **p < 0.01; ****p < 0.0001.
While GLUT1+ and PiT2+ subsets were not clearly discerned in the CD4 gate, we specifically evaluated regulatory T cell (Treg) thymocytes in the Foxp3+CD4+ subset. Approximately 50% of Foxp3+ thymocytes were CD25− as compared to CD25+, representing immature and mature Treg subsets, respectively (78). Interestingly, while similar percentages of CD25−Foxp3+ and CD25+Foxp3+ thymocytes expressed GLUT1 (25 ± 8% of CD25− and 29 ± 7% of CD25+, respectively), PiT2 expression was significantly higher in CD25+ Treg (20 ± 7% vs. 39 ± 10%, p < 0.01, Supplementary Figure 3). The significance of PiT2 expression on CD25+Foxp3+ thymocytes remains to be determined.
PiT2 Expression Distinguishes Metabolically Active TN Thymocyte Subsets
The differentiation of CD4−CD8−CD3− (TN) thymocytes has been historically divided into four subsets on the basis of CD44 and CD25 expression, with TN1, TN2, TN3 and TN4 subsets defined as CD44+CD25−, CD44+CD25+, CD44−CD25+ and CD44−CD25−, respectively (1, 2, 4). Given the heterogeneity of PiT2 expression in the DN thymocyte subsets (Figure 1A), we specifically evaluated PiT2 levels in each of the TN subsets. As shown in Figure 2A, PiT2 levels were heterogeneous even within specific TN subsets but high levels were detected mainly within TN3 and TN4 subsets, evaluated as a function of percent positively stained thymocytes and the MFI of staining. Indeed, MFI increased significantly between TN3 and TN4 thymocytes (p < 0.05, Figure 2B); the vast majority of TN1 thymocytes were PiT2-negative, whereas TN3 and TN4 thymocytes were detected in both the PiT2-intermediate and PiT2-high gates (Figure 2C).
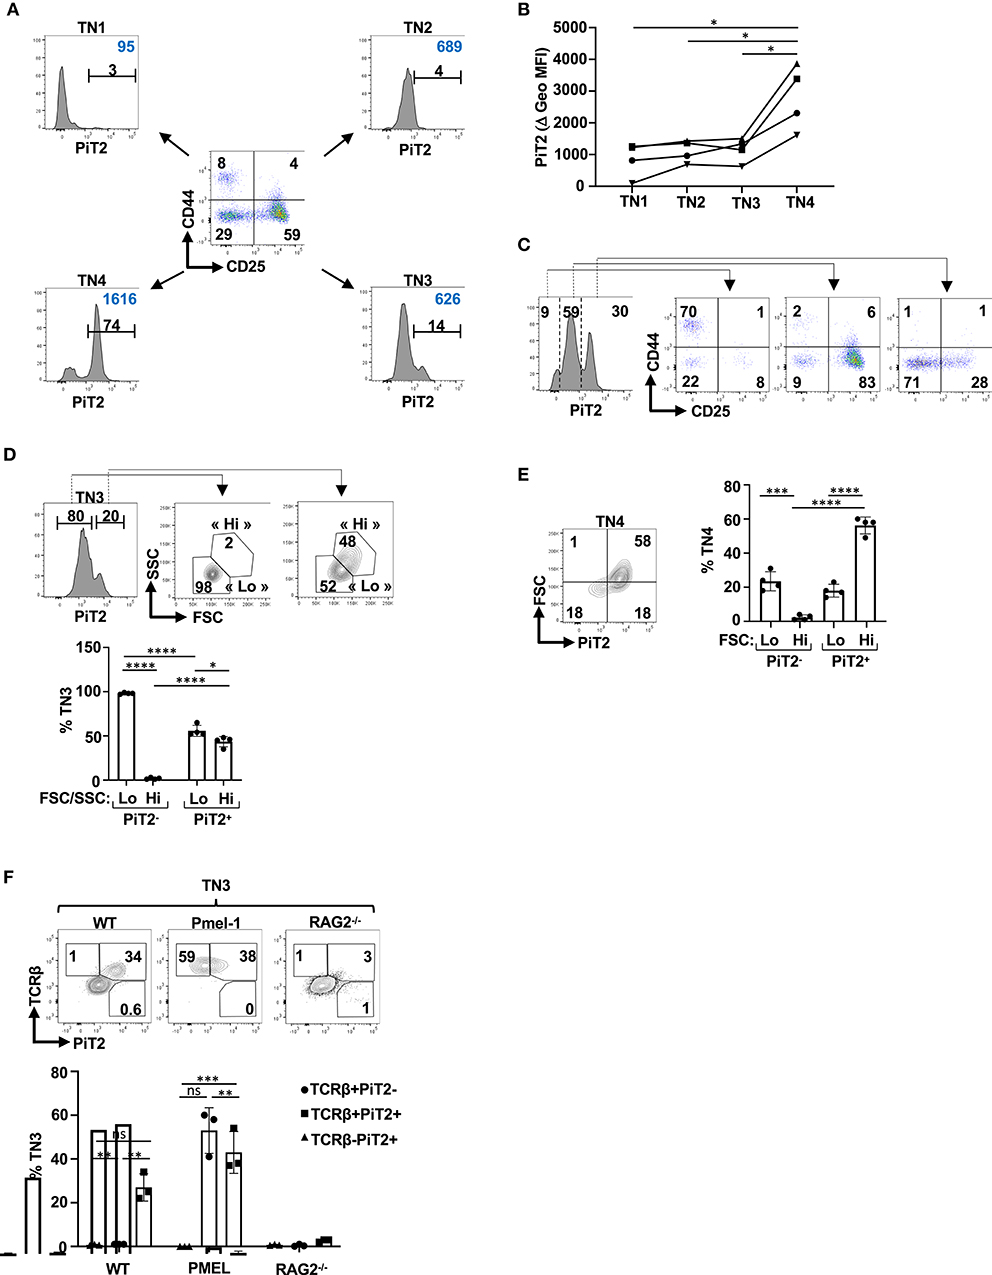
Figure 2. β selection of TN thymocytes results in the induction of the PiT2 phosphate transporter. (A) Profiles of TN thymocytes were evaluated as a function of their CD44/CD25 profiles and a representative dot plot showing the TN1 (CD44+CD25−), TN2 (CD44+CD25+), TN3 (CD44−CD25+), and TN4 (CD44−CD25−) subsets is presented. Histograms of PiT2 expression in each TN subset is shown. The percentages of positively staining cells (black) and geometric MFI (blue) are presented. (B) PiT2 staining in TN1, TN2, TN3 and TN4 thymocytes from four individual thymi are presented as a function of their geometric MFI. (C) CD44/CD25 profiles of TN thymocytes distinguished as a function of their PiT2 levels are presented. (D) TN3 thymocytes were distinguished on the basis of PiT2 expression and FSC/SSC profiles of PiT2-negative and PiT2+ cells are presented. The percentages of FSC/SSC-lo and FSC/SSC-hi subsets, used to distinguish TN3a and TN3b thymocytes, are presented (top). Quantification of the percentages of cells within the FSC/SSC-lo and FSC/SSC-hi gates are presented for PiT2-negative and PiT2-positive TN3 thymocytes (n = 4, bottom). (E) Expression of PiT2 in TN4 thymocytes was evaluated as a function of FSC and a representative plot is presented (right). Quantification of the percentages of FSC-lo and FSC-hi TN4 thymocytes are shown as a function of PiT2 expression (n = 4, right). (F) Representative histograms showing PiT2 staining on TN3 thymocytes from WT, Pmel-1 TCR transgenic and Rag2−/− thymocytes are shown as a function of TCRb expression (top panels). Quantification of the percentages of PiT2+ cells in the TCRb− and TCRb+ TN3 subsets are shown for WT, Pmel-1, and Rag2−/− mice. Statistical differences were evaluated by a 2-tailed unpaired t-test. *p < 0.05; **p < 0.01; ***p < 0.001; ****p < 0.0001.
β-selection, the first checkpoint in thymocyte development, occurs at the TN3 stage. Only TN3 thymocytes expressing a functional pre-TCR proliferate and progress to the DP stage of thymocyte differentiation (13, 79). Those TN3 and TN4 cells that have undergone a productive TCRβ gene rearrangement have been historically distinguished from the majority of TN3/TN4 cells with random TCRβ gene rearrangements by their size, monitored as a function of forward and side scatters (FSC/SSC) (13). Furthermore, TN3/TN4 thymocytes are activated through PI3K/Akt signaling (15, 17, 20, 21) resulting in the induction of metabolic transporters such as the GLUT1 glucose transporter (14) as well as chemokine receptors such as CXCR4 (14, 21). We therefore evaluated whether expression of PiT2 in TN thymocytes allows a discrimination of β-selection. Notably, 98 ± 1% PiT2-negative TN3 thymocytes were characterized as FSC/SSC-lo and <2% as FSC/SSC-hi (p < 0.0001, Figure 2D). Thus, PiT2 negative cells appear to represent a TN3a profile (FSC-lo). Interestingly though, within the PiT2+ gate, TN3 thymocytes exhibited both FSC/SSC-lo and FSC/SSC-hi profiles, with 56 ± 6% and 43 ± 4%, respectively. Furthermore, within the TN4 gate, PiT2 distinguished FSC-lo and FSC-hi cells. Within the PiT2-negative TN4 subset, only 2 ± 1% were FSC-hi while similarly to the TN3 population, PiT2+ TN4 thymocytes were both FSC-lo and FSC-hi (18 ± 4% and 56 ± 5%, respectively, Figure 2E). Thus, even though the percentages of PiT2+ cells that are FSC-hi are significantly higher than those that are FSC-lo (p < 0.0001), the presence of an FSC-lo subset suggests PiT2 expression might allow for a more rigorous identification of TN3 and TN4 thymocyte subsets that have undergone TCRβ gene rearrangement. Specifically, PiT2 expression may be a marker of those TN thymocytes that have responded to TCR/CXCR4 signaling.
To directly address this point, we evaluated PiT2 profiles within the TN subset of WT, RAG2-deficient and Pmel-1 thymi. In the absence of RAG2, thymocytes are blocked at the TN3 stage of differentiation as they are not able to rearrange a functional pre-TCR (80, 81) while Pmel-1 thymocytes, harboring a transgenic TCR against the gp100 melanoma antigen, do not need to undergo TCR rearrangement for their selection (82) (Supplementary Figure 4). Importantly, while a delineated peak of PiT2+TCRb+ TN3 thymocytes was detected in WT thymi (27 ± 6%), this was not the case in RAG2-deficient thymi (3 ± 1%, p < 0.0001; Figure 2F). Furthermore, in the Pmel-1 thymus where all TN3 thymocytes were TCRb+, a similar percentage of thymocytes as in WT mice expressed the PiT2 phosphate importer (Figure 2F). Conversely, PiT2 expression was not detected on TCRb− TN3 thymocytes in either WT or RAG2−/− mice (Figure 2F). Collectively, these data reveal the importance of the PiT2 phosphate transporter in identifying TCRb+ TN3 cells that have undergone a productive TCRβ gene rearrangement.
PiT1 and PiT2 Expression Profiles Characterize Distinct Subsets of Human Thymocytes
T cell differentiation in both mouse and humans occurs in the thymus, proceeding through discrete developmental stages [reviewed in (83)]. While many of the same markers have been used to characterize murine and human differentiation, including CD4 and CD8, some differ and the ISP stage in humans is characterized as CD3−CD4+CD8− (as compared to CD3−CD4−CD8+ in mice) (83). It was therefore important to determine whether the profiles of the PiT1 and PiT2 phosphate transporters in human thymocytes were similar to that detected in mice. Interestingly, while PiT1 was detected in only very low levels in the murine thymus, equivalent percentages of human thymocytes expressed surface GLUT1, PiT1, and PiT2 transporters (11 ± 1%, 10 ± 2%, and 10 ± 2%, respectively; Supplementary Figure 5). However, it is important to note that the profiles of expression on DN, DP, SP4, and SP8 thymocyte subsets was distinct (Figure 3A).
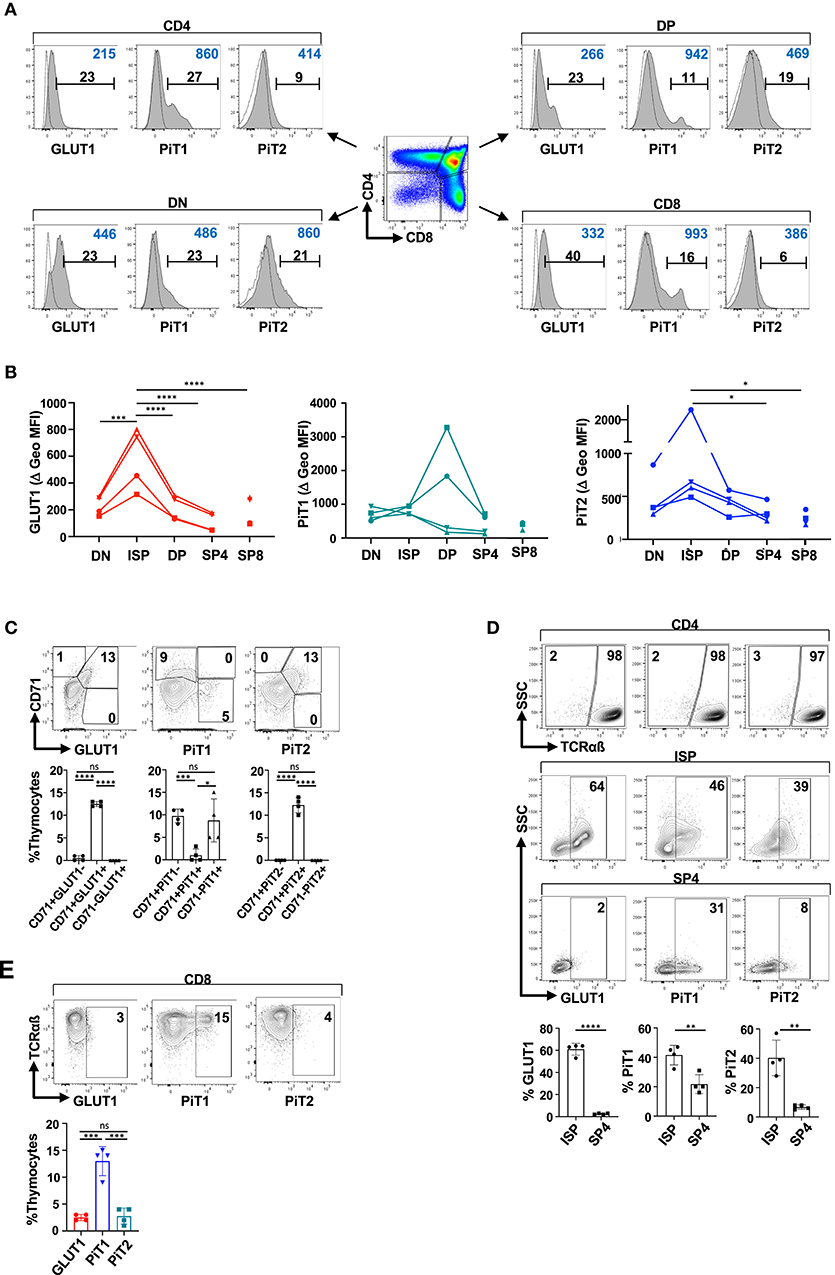
Figure 3. PiT2 expression identifies metabolically active TCRαβ− thymocytes in the human thymus. (A) Surface expression of GLUT1, PiT1, and PiT2 transporters was evaluated on freshly isolated human thymocytes and representative histograms are shown as a function of their CD4/CD8 profiles. Specific staining is shown in gray histograms and non-specific FMO staining is shown as dotted line histograms. The percentages of positively stained cells (black) and geometric MFIs (blue) in each histogram are indicated. (B) Delta geometric MFIs of GLUT1, PiT1, and PiT2 staining in DN, DP, ISP, SP4, and SP8 subsets are presented from four analyses. (C) Expression of GLUT1, PiT1, and PiT2 were evaluated as a function of the CD71 transferrin receptor and representative dot plots are presented (top). The relative percentages of thymocytes co-expressing the indicated transporter are quantified and means ±SD are shown (bottom). (D) Immature CD4+ ISPs and mature SP4 thymocytes were differentiated on the basis of TCRαβ expression (top). Expression of GLUT1, PiT1, and PiT2 within TCRαβ− ISP and TCRαβ+ SP4 thymocytes are presented (middle plots). Quantification of transporters within ISP and SP4 subsets are shown (bottom). (E) GLUT1, PiT1, and PiT2 expression were evaluated in SP8 thymocytes as a function of TCRαβ expression. Representative dot plots are presented. Statistical differences were evaluated by a 2-tailed unpaired t-test. *p < 0.05; **p < 0.01; ***p < 0.001; ****p < 0.0001.
GLUT1 and PiT2 profiles were similar in the murine thymus, reflecting metabolically active thymocytes that had undergone a productive TCRβ gene rearrangement (Figure 2). Indeed, the MFI of GLUT1 and PiT2 staining was significantly higher on ISPs than on other subsets, decreasing from 579 ± 232 to 109 ± 71 and 1103 ± 828 to 306 ± 111 between ISP4 and SP4, respectively (p > 0.0001 and p > 0.05, Figure 3B). Thus, we assessed whether GLUT1 and PiT2 expression in the human thymus was associated with expression of the CD71 transferrin receptor, as in the murine thymus (Figure 1). Indeed, as shown in Figure 3C, almost all CD71+ thymocytes were GLUT1+ and PiT2+, representing 13 ± 1% and 12 ± 2% of total thymocytes, respectively (only 0.5 ± 0.6% and 0% of all CD71+ thymocytes were GLUT1− or PiT2−, respectively). Interestingly though, only 1 ± 2% of PiT1+ thymocytes co-expressed CD71 while 9 ± 5% of PiT1+ thymocytes were CD71-negative (Figure 3C). Furthermore, within the CD4SP population, GLUT1+ and PiT2+ cells were almost exclusively within the ISP thymocyte subset (61 ± 5% and 40 ± 7%) as compared to the mature SP4 subset (3 ± 1% and 7 ± 2%, respectively; p < 0.0001 and p < 0.01, Figure 3D). Thus, similarly to the murine thymus, both GLUT1 and PiT2 expression are detected on metabolically active thymocyte subsets that have been signaled following TCRβ gene rearrangement.
In contrast with GLUT1 and PiT2, PiT1 expression was detected on mature SP4 as well as SP8 thymocytes. Within the SP8 thymocyte subset, 13 ± 3% of TCRHiSP8 thymocytes were characterized by high surface PiT1 expression, and conversely, <3% of these cells expressed GLUT1 or PiT2 (3 ± 1% and 3 ± 2%, respectively, Figure 3E). These data point to important similarities in metabolite transporter expression in human thymocytes, especially as concerns those transporters that function as biomarkers for metabolic activity. However, there are also differences in transporter profiles between the species, especially as regards PiT1 levels, that remain to be evaluated.
NKT Thymocytes Expressing the PiT1 Transporter Are a Biomarker of Thymic Aging
Thymic function declines with age, due to changes in the thymic environment itself as well as to a decrease in the entry of BM-derived precursors that support thymopoiesis (84, 85). As such, we evaluated the impact of age on thymocyte subsets and more specifically, on the expression of phosphate transporters on these subsets. As previously shown (86–88), thymocyte numbers (Figure 4A) as well as c-Kit+ early thymic precursors decreased with age, diminishing from 1.7 ± 0.2% to 0.7 ± 0.3% between 2 weeks and 1 year of age (p < 0.0001; Figure 4B).
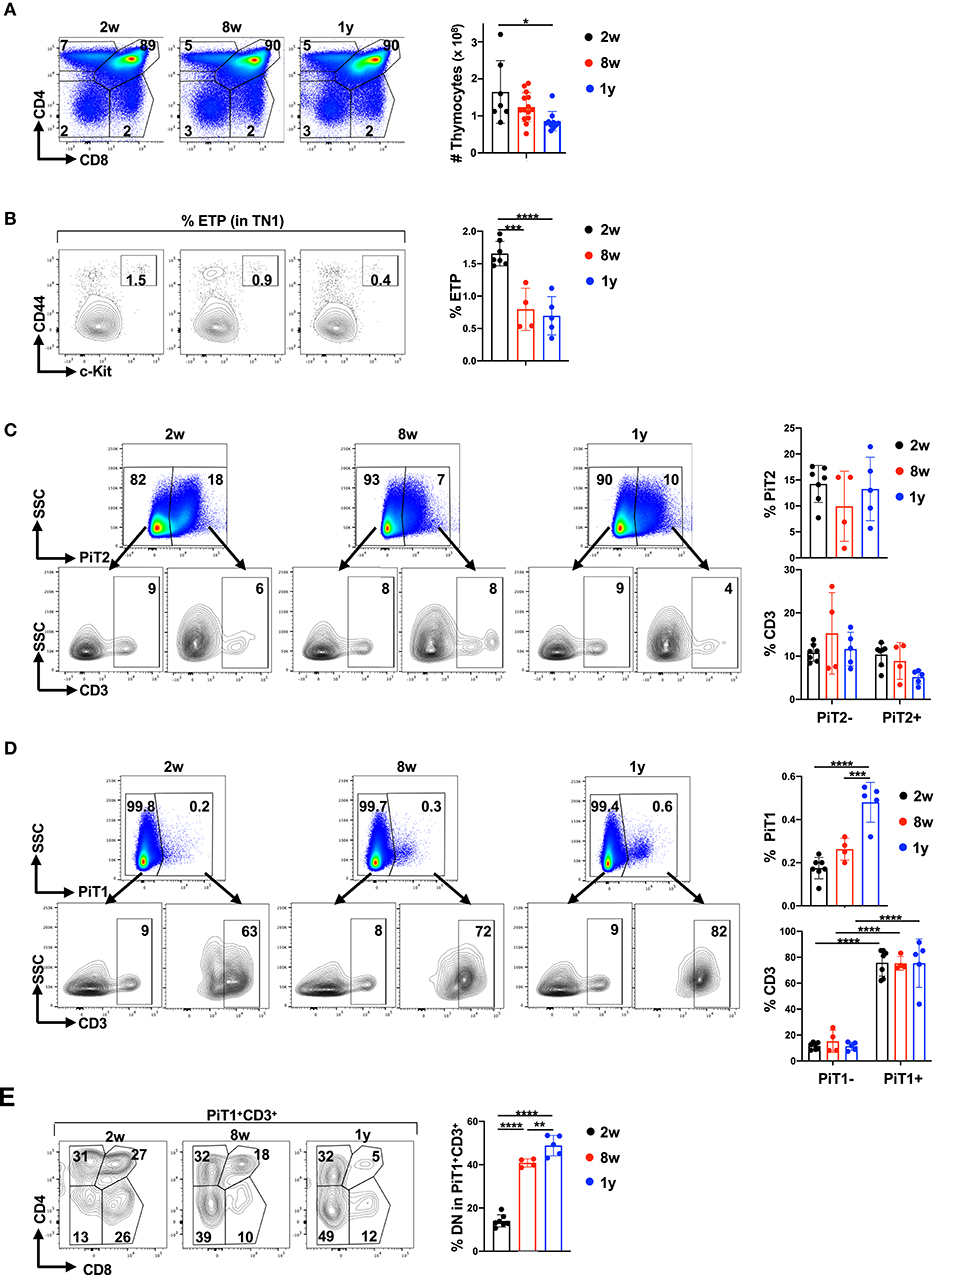
Figure 4. PiT1 but not PiT2 expression increases in CD3+DN thymocytes as a function of age. (A) Total thymocyte numbers were evaluated in mice at 2 weeks (2w), 8 weeks (8w), and 1 year (1y) of age. Representative CD4/CD8 profiles (top left) and quantification of total thymocytes (top right) are presented (n = 7–14 per age group). (B) The percentages of early thymic progenitors (ETP) within the TN1 gate were evaluated by CD44 and c-Kit expression and representative dot plots (left) as well as quantifications (right) are presented. (C) The percentages of thymocytes expressing PiT2 were evaluated as a function of age and representative plots are presented (top). The percentages of CD3+ thymocytes within the PiT2− and PiT2+ subsets are presented (bottom) and quantifications are shown (n = 4–7 per age group, left). (D) The percentages of thymocytes expressing PiT1 were evaluated as a function of age (top) and CD3− and CD3+ subsets representative plots (bottom) as well as quantifications (right) are presented. (E) The phenotype of PiT1+CD3+ thymocytes was evaluated as a function of their CD4/CD8 profiles (left) and the percentages of DN thymocytes within the PiT1+CD3+ subset is quantified for the different age groups (right). Statistical differences were evaluated by a one-way ANOVA test. *p < 0.05; **p < 0.01; ***p < 0.001; ****p < 0.0001.
Given the decreased thymopoiesis in aging mice, we hypothesized that phosphate transporter profiles in the thymus would change with age. While we did not detect significant changes in the overall percentages of PiT2+ thymocytes as a function of age (Figure 4C), the percentages of PiT2 expression in the mature CD3+ subset was decreased by 1 year of age (from 10 ± 3% to 5 ± 2%, p < 0.01, Figure 4C). However, in marked contrast, the percentages of PiT1 expression increased significantly with age, from 0.1 ± 0.03% to 0.5 ± 0.1% (p < 0.0001; Figure 4D). Moreover, at all ages, the expression of PiT1 was significantly higher in CD3+ subset as compared to the CD3− subset, with a difference of 75 ± 19 to 12 ± 4 at 1 year of age (p < 0.0001, Figure 4D). Within the CD3+PiT1+ thymocyte subset we evaluated the percentages of DN, DP and SP thymocytes and found that the percentages of PiT1+CD3+ thymocytes that were DN increased significantly over time, from 14.1 ± 2.8% to 48.9 ± 1.8%, respectively (p < 0.0001; Figure 4E). Thus, increased PiT1 expression on CD3+ thymocytes is a marker of thymic aging.
We next specifically monitored PiT1 expression in the CD3+DN thymocyte gate and found that with age, the percentages of PiT1+ thymocytes increased massively—from 8.4 ± 1.5% at 2 weeks to 22.6 ± 5.6% at 8 weeks and further increasing to 42.4 ± 9.4% at 1 year (p < 0.0001; Figure 5A). To further characterize these PiT1+CD3+DN thymocytes, we monitored expression of the CD25, CD71, PD1, and CD44 markers. Notably, PiT1+CD3+DN thymocytes were CD25-negative and were not likely to be metabolically active as they did not express the CD71 transferrin receptor (Figure 5B and Supplementary Figure 6). Indeed, in accord with a reduced metabolism in the aging thymus, the percentage of PiT1−CD3+DN expressed CD71 decreased from 26 ± 11% to 9 ± 9% between 2 weeks and 1 year of age (p < 0.05, Supplementary Figure 6). Furthermore, these cells are unlikely to represent autoreactive thymocytes that have not undergone clonal deletion because this subset of CD3+DN thymocytes has been shown to be PD1+ (89) and the PiT1+CD3+DN subset did not express detectable levels of PD1 (Figure 5B). Importantly, all thymocytes in the PiT1+CD3+DN subset co-expressed CD44, increasing from 6 ± 1% to 38 ± 11% between 2 weeks and 1 year of age (p < 0.0001, Figure 5B).
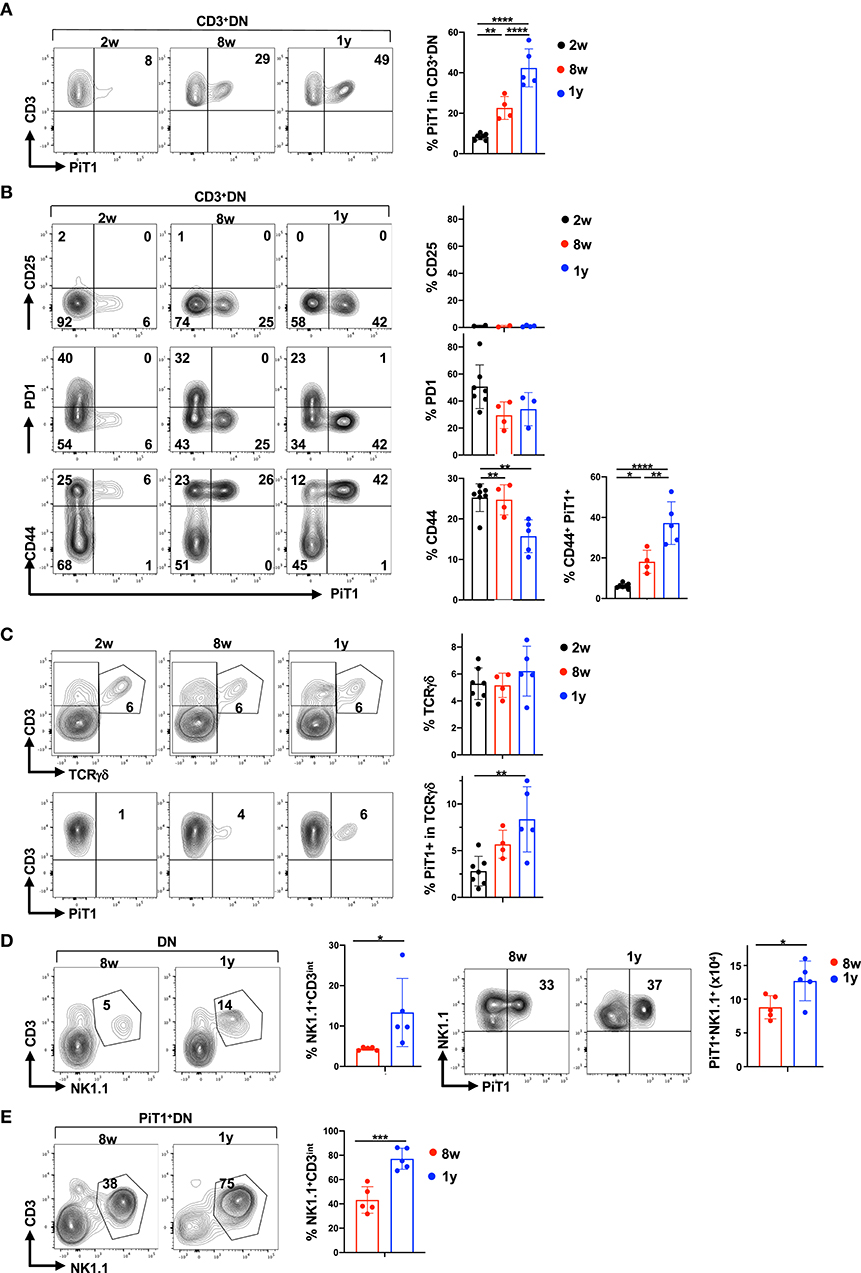
Figure 5. Thymic aging is associated with a significant increase in PiT1+ NKT thymocytes. (A) PiT1 expression in CD3+DN thymocytes is shown as a function of age (left) and quantifications in the different age groups are presented (right). (B) PiT1+CD3+DN thymocytes were evaluated as a function of CD25, CD71, PD1, and CD44 expression and representative profiles are presented (left). Quantifications of each staining profile in the different age groups are shown (right). (C) TCRγδ thymocytes were evaluated in the DN population by CD3/TCRγδ staining (top) and the percentages of PiT1 expressing TCRγδ T cells are presented (bottom). Quantifications are presented at the right. (D) NKT and NK thymocytes were evaluated in the DN population as a function of their CD3/NK1.1 staining profiles and representative plots at 8 weeks and 1 year are shown (left). Expression of PiT1 in NK1.1+ thymocytes are presented (left) and quantifications in 8 weeks and 1 year old mice are shown (n = 5). (E) The percentages of NKT thymocytes within the PiT1+DN population are shown as a function of CD3/NK1.1 staining (left) and quantifications for 8 weeks and 1 year mice are shown (n = 5, right). Statistical differences were evaluated by a one-way ANOVA test. *p < 0.05; **p < 0.01; ***p < 0.001; ****p < 0.0001.
CD44 expression is a marker in CD3+DN thymocytes of both γδ and NKT thymocytes (90–94). The percentages of thymocytes harboring a γδ TCR was not altered with age (5.5 ± 1.4%) but the percentages of PiT1+ TCR γδ thymocytes did increase, from 2.8 ± 1.6% to 8.4 ± 3.5% between 2 weeks and 1 year of age (p = 0.004; Figure 5C). Importantly though, PiT1 expression was detected on <15% of all γδ thymocytes. We therefore evaluated the evolution of NKT cells and found that they were significantly augmented in 1 year old mice, increasing from 4 ± 0.4% to 13 ± 8% (p < 0.05, Figure 5D). Moreover, despite the overall decrease in thymocyte numbers (Figure 4A), the number of PiT1+NKT increased from 3 × 10⁵ to 8 × 10⁵ (p < 0.05, Figure 5D) and NKT cells did not express either GLUT1 or PiT2 (Supplementary Figure 7A). We therefore evaluated whether NKT thymocytes accounted for a significant percentage of PiT1+DN thymocytes—while they accounted for 43 ± 11% of this subset at 8 weeks of age, the percentage increased to 77 ± 9% by 1 year of age (p < 0.001, Figure 5E). Thus, while markers of autoreactivity and metabolic activity decreased with age, PiT1 expression on γδ thymocytes and more notably on NKT cells appears to serve as phenotypic biomarkers of an aging thymus.
Discussion
Metabolite transporters of the SLC superfamily comprise more than 400 genes, regulating the uptake of nutrients, vitamins, neurotransmitters, elements and ions [reviewed in (95)]. As such, they are likely to be critical components of all cell fate decisions, governing survival, proliferation, differentiation and function. While the impact of SLCs that transport nutrients such as glucose and amino acids have been extensively evaluated in T cell differentiation and function (35–37, 39, 96, 97), studies of anion-transporting SLCs have been more limited. Moreover, it is critical to evaluate cell surface expression of metabolite transporters as their induction is often regulated by translocation from intracellular compartments rather than by increased transcription and/or translation (98–100). Here, we show that PiT1/SLC20A1 and PiT2/SLC20A2, SLCs that have been characterized as ubiquitous “housekeeping” phosphate importers, are only expressed at the cell surface of a small percentage of thymocytes. Moreover, the two importers exhibit distinct cell surface expression profiles. In contrast with PiT1, PiT2 was detected on thymocytes with high metabolic activity, concomitant with expression of the GLUT1 and CD71 transporters as well as high FSC/SSC profiles. This profile, in both the murine and human thymus, identified immature thymocytes that had undergone a productive TCRβ rearrangement. Indeed, in the absence of RAG2, PiT2 expression was not upregulated, and its induction in TCRβ+ DN thymocyes shows that it serves as a biomarker of the DN3b/DN4 switch. Expression of PiT1, on the other hand, increased with age, exhibiting a significant increase on CD3+ DN thymocytes. We identified these cells to be PiT1+CD3+NK1.1+, revealing the association of PiT1+NKT thymocytes with thymic aging.
While we did not evaluate the impact of dynamic changes in PiT1 and PiT2 levels on phosphate uptake, it is important to note that these importers can regulate cell function and differentiation in a phosphate uptake-independent manner. Specifically, PiT1-null MEFs do not exhibit altered uptake of phosphate (60) and conditional deletion of PiT1, while significantly affecting erythroid and B cell differentiation in mice, does not decrease phosphate uptake in these cells (65). Moreover, while decreased PiT1 expression in tumor cells results in attenuated proliferation and tumor growth, these effects are independent of phosphate transport activity (61). That being said, depletion of extracellular phosphate is associated with an induction of both PiT1 and PiT2 on transformed cells (57) and it is therefore interesting to speculate that intrathymic phosphate levels decrease upon thymic involution, as a function of age. In that regard, intrathymic phosphate levels may themselves impact thymic involution—deletion of the Klotho gene, mediating the role of FGF-23 in the control of phosphate (101), has been found to result in premature thymic aging (102).
While the mechanisms via which PiT1 impacts on cell cycle and hematopoietic lineage differentiation have still not been fully elucidated, it appears that the ERK1/2 pathway is involved in this process. Specifically, increases in extracellular phosphate have been shown to induce ERK1/2 signaling and upregulation of cyclin D1 (103, 104). While ERK1/2 phosphorylation has been linked to phosphate uptake, more recent data suggest that activation of this pathway is mediated by a phosphate-regulated heterodimerization of PiT1 and PiT2, independently of phosphate uptake. Indeed, deficient ERK1/2 phosphorylation in PiT-1 or PiT2-depleted cells was rescued by transport-deficient PiT mutants (53). Thus, the impact of phosphate sensing by PiT1 and PiT2, can potentially modulate thymocyte differentiation in a manner that is independent of phosphate uptake. Moreover, as robust ERK activation has been shown to be associated with thymocyte death whereas a low/brief ERK activation is associated with positive selection (105–107), it will be of much interest to study the impact of PiT2 on ERK activation in thymocytes and determine its potential role in positive selection.
Our finding that PiT1 expression profiles are altered in the aging thymus adds to our understanding of thymic involution and alterations in thymocyte subsets as a function of age. The percentage of CD3+DN cells expressing the PiT1 transporter increased by 5-fold between 2 weeks and 1 year of age. One subset of CD3+DN thymocytes represents DP thymocytes with an autoreactive TCR wherein strong TCR signaling directs them to a CD3+CD44+PD1+DN stage of differentiation (89). However, consistent with a decreased differentiation and metabolism in older mice, the percentages of these CD3+DN thymocytes expressing PD1 or the CD71 transferrin receptor was significantly diminished and they did not represent the PiT1+ subset. Interestingly though, ~50% of PD1−CD44+CD25−CD3+DN thymocytes, a subset that was previously shown to accumulate in the thymus of older mice (85, 108–111), exhibited high levels of PiT1 by 1 year of age. CD44+CD3+DN thymocytes can represent γδ or NKT thymocytes (90–94) and as such, we evaluated both these subsets. While γδ thymocytes did not increase with age, NKT cells were significantly augmented. This NKT subset was specific to the CD3+DN population as expression of NK1.1 on CD3IntCD4SP thymocytes was low (6 ± 5%), did not change with age, and did not exhibit high PiT1 expression (Supplementary Figure 7B). The significance of high PiT1 levels in this CD3+DN thymocyte subset is at present unknown but it will be of much interest to determine whether PiT1 expression on γδ or NKT thymocytes alters their function and/or can serve as a biomarker of thymic aging. Furthermore, the profile of PiT1 expression in responses to thymic insults such as irradiation and chemotherapy, resulting in alterations in the extracellular thymus niche, is not known. Indeed, the impact of toxic insults, and conversely, thymic regeneration strategies such as IL-22 or chemical castration (84, 112, 113), may alter the dynamic expression profiles of PiT1 as well as PiT2.
Differences in the profiles of the PiT1 and PiT2 transporters in the murine and human thymus suggest that they play distinct roles in thymocyte differentiation and proliferation. Conditional loss of PiT1, albeit with suboptimal deletion of the floxed allele, did not inhibit murine thymocyte differentiation (65). These data are consistent with the low-level expression of PiT1 that we detected in the thymi of young mice, and especially in immature thymocytes. In contrast with homozygous PiT1 deletion which results in embryonic lethality (55), mice with deleted PiT2 are viable and develop brain calcifications (56). The pathophysiology of these mice resembles the pathology of patients with primary familial brain calcification (PFBC). Indeed, 40% of patients with this neurodegenerative disease harbor mutations in PiT2 (58). While thymocyte differentiation has not been evaluated in these mice, the high level of PiT2 in immature thymocytes progressing through the β-selection checkpoint suggests that thymocyte differentiation would be negatively affected, as detected in mice with a conditional deletion of GLUT1 (37). In support of a potential role for PiT2 in early thymus differentiation, deletion of genes that alter thymocyte metabolism, such as apoptosis-inducing factor (AIF) (114) and SdhD (115), have resulted in a block in thymocyte differentiation, at the DN3/DN4 transition. Finally, it will be of interest to determine whether patients with PFBC exhibit decreased thymocyte differentiation, evaluated as a function of TRECs, especially given the association in several genetic immunodeficiencies with CNS involvement (116).
Our data highlight distinct profiles of PiT1 and PiT2 in murine and human thymus, revealing developmental specificities in the expression of these phosphate transporters. Furthermore, increased PiT1 levels on CD3+DN thymocytes, identified in majority as NKT thymocytes, was found to be a biomarker of thymi of >1 year of age. Our study also identifies PiT2/SLC20A2 as a member of the family of metabolite transporters that characterizes immature thymocytes with high metabolic activity and the upregulation of PiT2 at the beta-selection checkpoint is conserved between mouse and man. The list of metabolite transporters that are induced at the beta-selection checkpoint, now comprising PiT2, GLUT1 and CD71, is likely to grow—pointing to an extensive metabolic crosstalk regulating the proliferation and differentiation of immature thymocytes.
Data Availability Statement
The raw data supporting the conclusions of this article will be made available by the authors, without undue reservation.
Ethics Statement
The animal studies were reviewed and approved by the Languedoc-Rousillon Animal Care Committee, Montpellier, France and the NCI Animal Care Committee, Bethesda, MD.
Author Contributions
VZ and NT conceived and supervised the study. AM, MP, SG, VF, MC, VZ, and NT were involved in study design. AM, MP, SG, VF, MC, UL-S, VP, and VZ performed experiments. TK, FP, MB, and LN contributed to sample preparation and quality control. AM, MP, VZ, and NT wrote the manuscript and all authors critically reviewed the manuscript. All authors participated in data analysis and discussions.
Funding
Funding was obtained from the French national (ANR) research grants (PolarATTACK and GlutStem), ARC, AFM, FRM, ANRS, and Sidaction, the French laboratory consortiums (Labex) EpiGenMed and GR-EX, and the intramural NIH research program.
Conflict of Interest
VP and NT are inventors on patents describing the use of RBD ligands but NT no longer has any patent rights. VP is the co-founder of METAFORA-biosystems, a start-up company that focuses on metabolite transporters under physiological and pathological conditions.
The remaining authors declare that the research was conducted in the absence of any commercial or financial relationships that could be construed as a potential conflict of interest.
Acknowledgments
We thank all members of our lab for their scientific critique and support and are indebted to Marc Sitbon, Cédric Mongellaz, Valérie Dardalhon, Sandrina Kinet, Jawida Touhami, and Alfred Singer for their critical input. We are grateful to Metafora biosystems for their support and production of RBD ligands. We thank the La Timone pediatric cardiothoracic team and Eric Freeman from Children's National Medical Center (CNMC) for providing thymic tissue samples. The authors thank Myriam Boyer of Montpellier Rio Imaging for support in cytometry experiments. We thank Hongxia Yan, Narla Mohandas, Keith Kauffman, Shunsuke Sakai, Daniel Barber, and Gregoire Altan-Bonnet for precious support in assisting with reagents during the COVID crisis. AM, MP, VF, UL-S, and MC were supported by fellowships from the French Ministry of Health, EpiGenMed/ FRM, AFM, EpigenMed, and the Portuguese Foundation for Science and Technology, respectively.
Supplementary Material
The Supplementary Material for this article can be found online at: https://www.frontiersin.org/articles/10.3389/fimmu.2020.01562/full#supplementary-material
Supplementary Figure 1. Gating strategies for evaluation of murine and human thymocyte subsets. (A) Gating strategy for murine thymocytes showing FSC/SSC profiles, followed by SSC-W/SSC-H, FSC-W/FSC-H and Live-Dead analysis. Non-T lineage thymocyte subsets were eliminated by a ≪ Dump ≫ staining with anti- CD11b, -CD19, -Ter119, and -Gr1 mAbs. CD4/CD8 profiles as well as profiling of DN thymocytes and CD8+ thymocytes (CD3-ISP and CD3+ SP8) are shown. (B) Profiles for live freshly isolated CD4-selected T cells. For evaluation of naïve and memory CD4 T cells, CD45RA/CD45RO profiles are presented. (B) Gating strategy for human thymocytes showing FSC/SSC profiles, followed by SSC-W/SSC-H, FSC-W/FSC-H and Live-Dead analysis. Representative CD4/CD8 profiles and evaluation of CD4+ thymocytes (CD3-ISP and CD3+SP4) are shown. The percentages of cells in each gate are indicated.
Supplementary Figure 2. Specificity of retroviral envelope binding domain binding to PiT1 and PiT2 phosphate transporters. (A) BxPC3 cells were transduced with a PiT1 specific shRNA and PiT1 expression in parental and shRNA-transduced cells was monitored with the Koala retroviral envelope receptor binding domain (Ko-RBD, Metafora Biosystems). A representative histogram with non-specific binding in gray, parental in blue and shRNA knockdown in red is shown (left) and quantification from three independent experiments was evaluated by molecules of equivalent soluble fluorochrome (MESF). (B) The specificity of the amphotropic MLV RBD for evaluation of PiT2 expression was evaluated as previously reported (69), monitoring binding of the ampho-delta SU construct (A-RBD) in the parental haploid HAP1 cell line as well as following CRISPR-mediated knockout of PiT2 (HAP1- DPiT2). Representative histograms showing non-specific (line) and specific (gray) staining are presented. Note that there is an auto-fluorescence in HAP1- DPiT2 cells relative to the non-specific staining.
Supplementary Figure 3. GLUT1 and PiT1 expression profiles on Foxp3+ thymocytes. Expression of GLUT1 and PiT2 was evaluated in CD25−Foxp3+ and CD25+Foxp3+ thymocytes (left) and representative histograms are shown (middle). The percentages of cells in each gate are indicated. Quantification of GLUT1 and PiT2 detection in the CD25−Foxp3+ and CD25+Foxp3+ subsets are presented (n = 5, left).
Supplementary Figure 4. Profiles of TN thymocytes in WT, Pmel-1 and RAG2−/− mice. Expression profiles of TN thymocytes from WT, Pmel-1 and RAG2−/− mice, distinguishing TN1, TN2, TN3, and TN4 thymocytes as a function of CD44+CD25−, CD44+CD25+, CD44−CD25+, and CD44−CD25− staining, are presented.
Supplementary Figure 5. Detection of GLUT1, PiT1, and PiT2 on human thymocytes. The detection of GLUT1, PiT1, and PiT2 on human thymocytes was evaluated and representative histograms, indicating the percentages of positively stained cells, are shown (left). Quantification of percentages with horizontal lines presenting means ±SD are presented (n = 4 from three independent thymi, representative of five independent thymus specimens; right).
Supplementary Figure 6. Lack of CD71 transferrin receptor expression on PiT1+CD3+DN thymocytes. Expression of PiT1 and CD71 was evaluated on CD3+DN thymocytes from 2 weeks, 8 weeks, and 1yo mice. Representative dot plots are presented (left) and quantification of CD71 expression in the different age groups is shown (right).
Supplementary Figure 7. PiT1 but not GLUT1 or PiT2 is expressed on NK1.1+ thymocytes. (A) Expression of GLUT1, PiT1, and PiT2 were evaluated within NK1.1+ thymocytes in the DN gate and representative histograms as well as percent positively staining cells are shown (left). Quantification of GLUT1, PiT1, and PiT2 in NK1.1+ thymocytes is shown with horizontal lines presenting means ±SD (n = 5, right). (B) CD4+ thymocytes were evaluated as a function of intermediate and high CD3 expression at 8 weeks and 1 year of age (left plots), and NK1.1/PiT1 staining profiles were evaluated in both subsets (middle plots). Quantification of NK1.1 staining within the CD3intCD4+ thymocyte subset is shown (n = 5, right).
References
1. Bhandoola A, von Boehmer H, Petrie HT, Zuniga-Pflucker JC. Commitment and developmental potential of extrathymic and intrathymic T cell precursors: plenty to choose from. Immunity. (2007) 26:678–89. doi: 10.1016/j.immuni.2007.05.009
2. Kondo K, Ohigashi I, Takahama Y. Thymus machinery for T-cell selection. Int Immunol. (2019) 31:119–25. doi: 10.1093/intimm/dxy081
3. Thapa P, Farber DL. The role of the thymus in the immune response. Thorac Surg Clin. (2019) 29:123–31. doi: 10.1016/j.thorsurg.2018.12.001
4. Vicente R, Swainson L, Marty-Gres S, De Barros SC, Kinet S, Zimmermann VS, et al. Molecular and cellular basis of T cell lineage commitment. Semin Immunol. (2010) 22:270–5. doi: 10.1016/j.smim.2010.04.016
5. Yang Q, Jeremiah Bell J, Bhandoola A. T-cell lineage determination. Immunol Rev. (2010) 238:12–22. doi: 10.1111/j.1600-065X.2010.00956.x
6. Krueger A, Garbe AI, von Boehmer H. Phenotypic plasticity of T cell progenitors upon exposure to Notch ligands. J Exp Med. (2006) 203:1977–84. doi: 10.1084/jem.20060731
7. Schwarz BA, Sambandam A, Maillard I, Harman BC, Love PE, Bhandoola A. Selective thymus settling regulated by cytokine and chemokine receptors. J Immunol. (2007) 178:2008–17. doi: 10.4049/jimmunol.178.4.2008
8. Balciunaite G, Ceredig R, Fehling HJ, Zuniga-Pflucker JC, Rolink AG. The role of Notch and IL-7 signaling in early thymocyte proliferation and differentiation. Eur J Immunol. (2005) 35:1292–300. doi: 10.1002/eji.200425822
9. Rodewald HR, Fehling HJ. Molecular and cellular events in early thymocyte development. Adv Immunol. (1998) 69:1–112. doi: 10.1016/S0065-2776(08)60606-9
10. Hernandez-Lopez C, Varas A, Sacedon R, Jimenez E, Munoz JJ, Zapata AG, et al. Stromal cell-derived factor 1/CXCR4 signaling is critical for early human T-cell development. Blood. (2002) 99:546–54. doi: 10.1182/blood.V99.2.546
11. Blom B, Spits H. Development of human lymphoid cells. Annu Rev Immunol. (2006) 24:287–320. doi: 10.1146/annurev.immunol.24.021605.090612
12. Carrasco YR, Trigueros C, Ramiro AR, de Yebenes VG, Toribio ML. Beta-selection is associated with the onset of CD8beta chain expression on CD4(+)CD8alphaalpha(+) pre-T cells during human intrathymic development. Blood. (1999) 94:3491–8. doi: 10.1182/blood.V94.10.3491.422k30_3491_3498
13. Hoffman ES, Passoni L, Crompton T, Leu TM, Schatz DG, Koff A, et al. Productive T-cell receptor beta-chain gene rearrangement: coincident regulation of cell cycle and clonality during development in vivo. Genes Dev. (1996) 10:948–62. doi: 10.1101/gad.10.8.948
14. Swainson L, Kinet S, Manel N, Battini JL, Sitbon M, Taylor N. Glucose transporter 1 expression identifies a population of cycling CD4+ CD8+ human thymocytes with high CXCR4-induced chemotaxis. Proc Natl Acad Sci USA. (2005) 102:12867–72. doi: 10.1073/pnas.0503603102
15. Ahamed JA, Madhivadhani P. Costimulatory role of CXCR4 with pre-TCR and its crosstalk with PI3K in beta-selection of thymocytes. Sci Signal. (2010) 3:jc4. doi: 10.1126/scisignal.3119jc4
16. Ciofani M, Zuniga-Pflucker JC. Notch promotes survival of pre-T cells at the beta-selection checkpoint by regulating cellular metabolism. Nat Immunol. (2005) 6:881–8. doi: 10.1038/ni1234
17. Janas ML, Varano G, Gudmundsson K, Noda M, Nagasawa T, Turner M. Thymic development beyond beta-selection requires phosphatidylinositol 3-kinase activation by CXCR4. J Exp Med. (2010) 207:247–61. doi: 10.1084/jem.20091430
18. Juntilla MM, Koretzky GA. Critical roles of the PI3K/Akt signaling pathway in T cell development. Immunol Lett. (2008) 116:104–10. doi: 10.1016/j.imlet.2007.12.008
19. Kelly AP, Finlay DK, Hinton HJ, Clarke RG, Fiorini E, Radtke F, et al. Notch-induced T cell development requires phosphoinositide-dependent kinase 1. EMBO J. (2007) 26:3441–50. doi: 10.1038/sj.emboj.7601761
20. Mao C, Tili EG, Dose M, Haks MC, Bear SE, Maroulakou I, et al. Unequal contribution of Akt isoforms in the double-negative to double-positive thymocyte transition. J Immunol. (2007) 178:5443–53. doi: 10.4049/jimmunol.178.9.5443
21. Trampont PC, Tosello-Trampont AC, Shen Y, Duley AK, Sutherland AE, Bender TP, et al. CXCR4 acts as a costimulator during thymic beta-selection. Nat Immunol. (2010) 11:162–70. doi: 10.1038/ni.1830
22. Almeida L, Lochner M, Berod L, Sparwasser T. Metabolic pathways in T cell activation and lineage differentiation. Semin Immunol. (2016) 28:514–24. doi: 10.1016/j.smim.2016.10.009
23. Geltink RIK, Kyle RL, Pearce EL. Unraveling the Complex Interplay Between T Cell Metabolism and Function. Annu Rev Immunol. (2018) 36:461–88. doi: 10.1146/annurev-immunol-042617-053019
24. Yong CS, Abba Moussa D, Cretenet G, Kinet S, Dardalhon V, Taylor N. Metabolic orchestration of T lineage differentiation and function. FEBS Lett. (2017) 591:3104–18. doi: 10.1002/1873-3468.12849
25. Badou A, Jha MK, Matza D, Flavell RA. Emerging roles of L-type voltage-gated and other calcium channels in T lymphocytes. Front Immunol. (2013) 4:243. doi: 10.3389/fimmu.2013.00243
26. Dolmetsch RE, Lewis RS, Goodnow CC, Healy JI. Differential activation of transcription factors induced by Ca2+ response amplitude and duration. Nature. (1997) 386:855–8. doi: 10.1038/386855a0
27. Esser MT, Haverstick DM, Fuller CL, Gullo CA, Braciale VL. Ca2+ signaling modulates cytolytic T lymphocyte effector functions. J Exp Med. (1998) 187:1057–67. doi: 10.1084/jem.187.7.1057
28. Brekelmans P, van Soest P, Voerman J, Platenburg PP, Leenen PJ, van Ewijk W. Transferrin receptor expression as a marker of immature cycling thymocytes in the mouse. Cell Immunol. (1994) 159:331–9. doi: 10.1006/cimm.1994.1319
29. Eil R, Vodnala SK, Clever D, Klebanoff CA, Sukumar M, Pan JH, et al. Ionic immune suppression within the tumour microenvironment limits T cell effector function. Nature. (2016) 537:539–43. doi: 10.1038/nature19364
30. Vodnala SK, Eil R, Kishton RJ, Sukumar M, Yamamoto TN, Ha NH, et al. T cell stemness and dysfunction in tumors are triggered by a common mechanism. Science. (2019) 363:eaau0135. doi: 10.1126/science.aau0135
31. Carr EL, Kelman A, Wu GS, Gopaul R, Senkevitch E, Aghvanyan A, et al. Glutamine uptake and metabolism are coordinately regulated by ERK/MAPK during T lymphocyte activation. J Immunol. (2010) 185:1037–44. doi: 10.4049/jimmunol.0903586
32. Geiger R, Rieckmann JC, Wolf T, Basso C, Feng Y, Fuhrer T, et al. L-arginine modulates T cell metabolism and enhances survival and anti-tumor activity. Cell. (2016) 167:829–42.e813. doi: 10.1016/j.cell.2016.09.031
33. Hayashi K, Jutabha P, Endou H, Sagara H, Anzai N. LAT1 is a critical transporter of essential amino acids for immune reactions in activated human T cells. J Immunol. (2013) 191:4080–5. doi: 10.4049/jimmunol.1300923
34. Klysz D, Tai X, Robert PA, Craveiro M, Cretenet G, Oburoglu L, et al. Glutamine-dependent alpha-ketoglutarate production regulates the balance between T helper 1 cell and regulatory T cell generation. Sci Signal. (2015) 8:ra97. doi: 10.1126/scisignal.aab2610
35. Nakaya M, Xiao Y, Zhou X, Chang JH, Chang M, Cheng X, et al. Inflammatory T cell responses rely on amino acid transporter ASCT2 facilitation of glutamine uptake and mTORC1 kinase activation. Immunity. (2014) 40:692–705. doi: 10.1016/j.immuni.2014.04.007
36. Sinclair LV, Rolf J, Emslie E, Shi YB, Taylor PM, Cantrell DA. Control of amino-acid transport by antigen receptors coordinates the metabolic reprogramming essential for T cell differentiation. Nat Immunol. (2013) 14:500–8. doi: 10.1038/ni.2556
37. Macintyre AN, Gerriets VA, Nichols AG, Michalek RD, Rudolph MC, Deoliveira D, et al. The glucose transporter Glut1 is selectively essential for CD4 T cell activation and effector function. Cell Metab. (2014) 20:61–72. doi: 10.1016/j.cmet.2014.05.004
38. Yu Q, Erman B, Bhandoola A, Sharrow SO, Singer A. In vitro evidence that cytokine receptor signals are required for differentiation of double positive thymocytes into functionally mature CD8(+) T cells. J Exp Med. (2003). 197:475–87. doi: 10.1084/jem.20021765
39. Masle-Farquhar E, Broer A, Yabas M, Enders A, Broer S. ASCT2 (SLC1A5)-deficient mice have normal B-cell development, proliferation, and antibody production. Front Immunol. (2017) 8:549. doi: 10.3389/fimmu.2017.00549
40. Macedo MF, de Sousa M, Ned RM, Mascarenhas C, Andrews NC, Correia-Neves M. Transferrin is required for early T-cell differentiation. Immunology. (2004) 112:543–9. doi: 10.1111/j.1365-2567.2004.01915.x
41. Berner YN, Shike M. Consequences of phosphate imbalance. Annu Rev Nutr. (1988) 8:121–48. doi: 10.1146/annurev.nu.08.070188.001005
42. Farrow EG, White KE. Recent advances in renal phosphate handling. Nat Rev Nephrol. (2010) 6:207–17. doi: 10.1038/nrneph.2010.17
43. Goretti Penido M, Alon US. Phosphate homeostasis and its role in bone health. Pediatr Nephrol. (2012) 27:2039–48. doi: 10.1007/s00467-012-2175-z
44. Kavanaugh MP, Miller DG, Zhang W, Law W, Kozak SL, Kabat D, et al. Cell-surface receptors for gibbon ape leukemia virus and amphotropic murine retrovirus are inducible sodium-dependent phosphate symporters. Proc Natl Acad Sci USA. (1994) 91:7071–5. doi: 10.1073/pnas.91.15.7071
45. Olah Z, Lehel C, Anderson WB, Eiden MV, Wilson CA. The cellular receptor for gibbon ape leukemia virus is a novel high affinity sodium-dependent phosphate transporter. J Biol Chem. (1994) 269:25426–31.
46. Giovannini D, Touhami J, Charnet P, Sitbon M, Battini JL. Inorganic phosphate export by the retrovirus receptor XPR1 in metazoans. Cell Rep. (2013) 3:1866–73. doi: 10.1016/j.celrep.2013.05.035
47. Bottger P, Hede SE, Grunnet M, Hoyer B, Klaerke DA, Pedersen L. Characterization of transport mechanisms and determinants critical for Na+-dependent Pi symport of the PiT family paralogs human PiT1 and PiT2. Am J Physiol Cell Physiol. (2006) 291:C1377–87. doi: 10.1152/ajpcell.00015.2006
48. Forster IC, Hernando N, Biber J, Murer H. Phosphate transporters of the SLC20 and SLC34 families. Mol Aspects Med. (2013) 34:386–95. doi: 10.1016/j.mam.2012.07.007
49. O'Hara B, Johann SV, Klinger HP, Blair DG, Rubinson H, Dunn KJ, et al. Characterization of a human gene conferring sensitivity to infection by gibbon ape leukemia virus. Cell Growth Differ. (1990) 1:119–27.
50. Oliveira NM, Farrell KB, Eiden MV. In vitro characterization of a koala retrovirus. J Virol. (2006) 80:3104–7. doi: 10.1128/JVI.80.6.3104-3107.2006
51. Kozak SL, Siess DC, Kavanaugh MP, Miller AD, Kabat D. The envelope glycoprotein of an amphotropic murine retrovirus binds specifically to the cellular receptor/phosphate transporter of susceptible species. J Virol. (1995) 69:3433–40. doi: 10.1128/JVI.69.6.3433-3440.1995
52. van Zeijl M, Johann SV, Closs E, Cunningham J, Eddy R, Shows TB, et al. A human amphotropic retrovirus receptor is a second member of the gibbon ape leukemia virus receptor family. Proc Natl Acad Sci USA. (1994) 91:1168–72. doi: 10.1073/pnas.91.3.1168
53. Bon N, Couasnay G, Bourgine A, Sourice S, Beck-Cormier S, Guicheux J, et al. Phosphate. (Pi)-regulated heterodimerization of the high-affinity sodium-dependent Pi transporters PiT1/Slc20a1 and PiT2/Slc20a2 underlies extracellular Pi sensing independently of Pi uptake. J Biol Chem. (2018) 293:2102–14. doi: 10.1074/jbc.M117.807339
54. Kavanaugh MP, Kabat D. Identification and characterization of a widely expressed phosphate transporter/retrovirus receptor family. Kidney Int. (1996) 49:959–63. doi: 10.1038/ki.1996.135
55. Festing MH, Speer MY, Yang HY, Giachelli CM. Generation of mouse conditional and null alleles of the type III sodium-dependent phosphate cotransporter PiT-1. Genesis. (2009) 47:858–63. doi: 10.1002/dvg.20577
56. Jensen N, Schroder HD, Hejbol EK, Fuchtbauer EM, de Oliveira JR, Pedersen L. Loss of function of Slc20a2 associated with familial idiopathic Basal Ganglia calcification in humans causes brain calcifications in mice. J Mol Neurosci. (2013) 51:994–9. doi: 10.1007/s12031-013-0085-6
57. Legati A, Giovannini D, Nicolas G, Lopez-Sanchez U, Quintans B, Oliveira JR, et al. Mutations in XPR1 cause primary familial brain calcification associated with altered phosphate export. Nat Genet. (2015) 47:579–81. doi: 10.1038/ng.3289
58. Lemos RR, Ramos EM, Legati A, Nicolas G, Jenkinson EM, Livingston JH, et al. Update and mutational analysis of SLC20A2: a major cause of primary familial brain calcification. Hum Mutat. (2015) 36:489–95. doi: 10.1002/humu.22778
59. Wang C, Li Y, Shi L, Ren J, Patti M, Wang T, et al. Mutations in SLC20A2 link familial idiopathic basal ganglia calcification with phosphate homeostasis. Nat Genet. (2012) 44:254–6. doi: 10.1038/ng.1077
60. Beck L, Leroy C, Beck-Cormier S, Forand A, Salaun C, Paris N, et al. The phosphate transporter PiT1. (Slc20a1) revealed as a new essential gene for mouse liver development. PLoS ONE. (2010) 5:e9148. doi: 10.1371/journal.pone.0009148
61. Beck L, Leroy C, Salaun C, Margall-Ducos G, Desdouets C, Friedlander G. Identification of a novel function of PiT1 critical for cell proliferation and independent of its phosphate transport activity. J Biol Chem. (2009) 284:31363–74. doi: 10.1074/jbc.M109.053132
62. Byskov K, Jensen N, Kongsfelt IB, Wielsoe M, Pedersen LE, Haldrup C, et al. Regulation of cell proliferation and cell density by the inorganic phosphate transporter PiT1. Cell Div. (2012) 7:7. doi: 10.1186/1747-1028-7-7
63. Kongsfelt IB, Byskov K, Pedersen LE, Pedersen L. High levels of the type III inorganic phosphate transporter PiT1. (SLC20A1) can confer faster cell adhesion. Exp Cell Res. (2014) 326:57–67. doi: 10.1016/j.yexcr.2014.05.014
64. Forand A, Beck L, Leroy C, Rousseau A, Boitez V, Cohen I, et al. EKLF-driven PIT1 expression is critical for mouse erythroid maturation in vivo and in vitro. Blood. (2013) 121:666–78. doi: 10.1182/blood-2012-05-427302
65. Liu L, Sanchez-Bonilla M, Crouthamel M, Giachelli C, Keel S. Mice lacking the sodium-dependent phosphate import protein, PiT1 (SLC20A1), have a severe defect in terminal erythroid differentiation and early B cell development. Exp Hematol. (2013) 41:432–43 e437. doi: 10.1016/j.exphem.2013.01.004
66. Forand A, Koumakis E, Rousseau A, Sassier Y, Journe C, Merlin JF, et al. Disruption of the phosphate transporter Pit1 in hepatocytes improves glucose metabolism and insulin signaling by modulating the USP7/IRS1 interaction. Cell Rep. (2016) 17:1905. doi: 10.1016/j.celrep.2016.10.039
67. Koumakis E, Millet-Botti J, Benna JE, Leroy C, Boitez V, Codogno P, et al. Novel function of PiT1/SLC20A1 in LPS-related inflammation and wound healing. Sci Rep. (2019) 9:1808. doi: 10.1038/s41598-018-37551-1
68. Essletzbichler P, Konopka T, Santoro F, Chen D, Gapp BV, Kralovics R, et al. Megabase-scale deletion using CRISPR/Cas9 to generate a fully haploid human cell line. Genome Res. (2014) 24:2059–65. doi: 10.1101/gr.177220.114
69. Lopez-Sanchez U, Tury S, Nicolas G, Wilson MS, Jurici S, Ayrignac X, et al. Interplay between PFBC-associated SLC20A2 and XPR1 phosphate transporters requires inositol polyphosphates for control of cellular phosphate homeostasis. J Biol Chem. (2020) 295:9366–78. doi: 10.1074/jbc.RA119.011376
70. Laval J, Touhami J, Herzenberg LA, Conrad C, Taylor N, Battini JL, et al. Metabolic adaptation of neutrophils in cystic fibrosis airways involves distinct shifts in nutrient transporter expression. J Immunol. (2013) 190:6043–50. doi: 10.4049/jimmunol.1201755
71. Lopez-Sanchez U, Nicolas G, Richard AC, Maltete D, Charif M, Ayrignac X, et al. Characterization of XPR1/SLC53A1 variants located outside of the SPX domain in patients with primary familial brain calcification. Sci Rep. (2019) 9:6776. doi: 10.1038/s41598-019-43255-x
72. Imamura T, Huang J, Usui I, Satoh H, Bever J, Olefsky JM. Insulin-induced GLUT4 translocation involves protein kinase C-lambda-mediated functional coupling between Rab4 and the motor protein kinesin. Mol Cell Biol. (2003) 23:4892–900. doi: 10.1128/MCB.23.14.4892-4900.2003
73. Shepherd PR, Kahn BB. Glucose transporters and insulin action–implications for insulin resistance and diabetes mellitus. N Engl J Med. (1999) 341:248–57. doi: 10.1056/NEJM199907223410406
74. Kinet S, Swainson L, Lavanya M, Mongellaz C, Montel-Hagen A, Craveiro M, et al. Isolated receptor binding domains of HTLV-1 and HTLV-2 envelopes bind Glut-1 on activated CD4+ and CD8+ T cells. Retrovirology. (2007) 4:31. doi: 10.1186/1742-4690-4-31
75. Kim FJ, Manel N, Garrido EN, Valle C, Sitbon M, Battini JL. HTLV-1 and−2 envelope SU subdomains and critical determinants in receptor binding. Retrovirology. (2004) 1:41. doi: 10.1186/1742-4690-1-41
76. Kim FJ, Seiliez I, Denesvre C, Lavillette D, Cosset FL, Sitbon M. Definition of an amino-terminal domain of the human T-cell leukemia virus type 1 envelope surface unit that extends the fusogenic range of an ecotropic murine leukemia virus. J Biol Chem. (2000) 275:23417–20. doi: 10.1074/jbc.C901002199
77. Manel N, Kim FJ, Kinet S, Taylor N, Sitbon M, Battini JL. The ubiquitous glucose transporter GLUT-1 is a receptor for HTLV. Cell. (2003) 115:449–59. doi: 10.1016/S0092-8674(03)00881-X
78. Tai X, Singer A. Basis of Treg development in the thymus. Cell Cycle. (2014) 13:501–2. doi: 10.4161/cc.27787
79. Taghon T, Yui MA, Pant R, Diamond RA, Rothenberg EV. Developmental and molecular characterization of emerging beta- and gammadelta-selected pre-T cells in the adult mouse thymus. Immunity. (2006) 24:53–64. doi: 10.1016/j.immuni.2005.11.012
80. Godfrey DI, Kennedy J, Mombaerts P, Tonegawa S, Zlotnik A. Onset of TCR-beta gene rearrangement and role of TCR-beta expression during CD3-CD4-CD8- thymocyte differentiation. J Immunol. (1994) 152:4783–92.
81. Prockop SE, Petrie HT. Regulation of thymus size by competition for stromal niches among early T cell progenitors. J Immunol. (2004) 173:1604–11. doi: 10.4049/jimmunol.173.3.1604
82. Overwijk WW, Theoret MR, Finkelstein SE, Surman DR, de Jong LA, Vyth-Dreese FA, et al. Tumor regression and autoimmunity after reversal of a functionally tolerant state of self-reactive CD8+ T cells. J Exp Med. (2003) 198:569–80. doi: 10.1084/jem.20030590
83. Famili F, Wiekmeijer AS, Staal FJ. The development of T cells from stem cells in mice and humans. Future Sci OA. (2017) 3:FSO186. doi: 10.4155/fsoa-2016-0095
84. Chaudhry MS, Velardi E, Dudakov JA, van den Brink MR. Thymus: the next (re)generation. Immunol Rev. (2016) 271:56–71. doi: 10.1111/imr.12418
85. Palmer DB. The effect of age on thymic function. Front Immunol. (2013) 4:316. doi: 10.3389/fimmu.2013.00316
86. Aspinall R, Andrew D. Thymic involution in aging. J Clin Immunol. (2000) 20:250–6. doi: 10.1023/A:1006611518223
87. Heng TS, Goldberg GL, Gray DH, Sutherland JS, Chidgey AP, Boyd RL. Effects of castration on thymocyte development in two different models of thymic involution. J Immunol. (2005) 175:2982–93. doi: 10.4049/jimmunol.175.5.2982
88. Min H, Montecino-Rodriguez E, Dorshkind K. Reduction in the developmental potential of intrathymic T cell progenitors with age. J Immunol. (2004) 173:245–50. doi: 10.4049/jimmunol.173.1.245
89. Pobezinsky LA, Angelov GS, Tai X, Jeurling S, Van Laethem F, Feigenbaum L, et al. Clonal deletion and the fate of autoreactive thymocytes that survive negative selection. Nat Immunol. (2012) 13:569–78. doi: 10.1038/ni.2292
90. Coles MC, Raulet DH. Class I dependence of the development of CD4+ CD8- NK1.1+ thymocytes. J Exp Med. (1994) 180:395–9. doi: 10.1084/jem.180.1.395
91. Ribeiro VS, Hasan M, Wilson A, Boucontet L, Pereira P, Lesjean-Pottier S, et al. Cutting edge: Thymic NK cells develop independently from T cell precursors. J Immunol. (2010) 185:4993–7. doi: 10.4049/jimmunol.1002273
92. Ribot JC, deBarros A, Pang DJ, Neves JF, Peperzak V, Roberts SJ, et al. CD27 is a thymic determinant of the balance between interferon-gamma- and interleukin 17-producing gammadelta T cell subsets. Nat Immunol. (2009) 10:427–36. doi: 10.1038/ni.1717
93. Sumaria N, Grandjean CL, Silva-Santos B, Pennington DJ. Strong TCRgammadelta signaling prohibits thymic development of IL-17A-secreting gammadelta T cells. Cell Rep. (2017) 19:2469–76. doi: 10.1016/j.celrep.2017.05.071
94. Yoshimoto T, Paul WE. CD4pos, NK1.1pos T cells promptly produce interleukin 4 in response to in vivo challenge with anti-CD3. J Exp Med. (1994) 179:1285–95. doi: 10.1084/jem.179.4.1285
95. Zhang Y, Zhang Y, Sun K, Meng Z, Chen L. The SLC transporter in nutrient and metabolic sensing, regulation, and drug development. J Mol Cell Biol. (2019) 11:1–13. doi: 10.1093/jmcb/mjy052
96. Cretenet G, Clerc I, Matias M, Loisel S, Craveiro M, Oburoglu L, et al. Cell surface Glut1 levels distinguish human CD4 and CD8 T lymphocyte subsets with distinct effector functions. Sci Rep. (2016) 6:24129. doi: 10.1038/srep24129
97. Loisel-Meyer S, Swainson L, Craveiro M, Oburoglu L, Mongellaz C, Costa C, et al. Glut1-mediated glucose transport regulates HIV infection. Proc Natl Acad Sci USA. (2012) 109:2549–54. doi: 10.1073/pnas.1121427109
98. Brewer PD, Habtemichael EN, Romenskaia I, Mastick CC, Coster AC. Insulin-regulated Glut4 translocation: membrane protein trafficking with six distinctive steps. J Biol Chem. (2014) 289:17280–98. doi: 10.1074/jbc.M114.555714
99. Kvainickas A, Orgaz AJ, Nagele H, Diedrich B, Heesom KJ, Dengjel J, et al. Retromer- and WASH-dependent sorting of nutrient transporters requires a multivalent interaction network with ANKRD50. J Cell Sci. (2017) 130:382–95. doi: 10.1242/jcs.196758
100. Roy S, Leidal AM, Ye J, Ronen SM, Debnath J. Autophagy-dependent shuttling of TBC1D5 controls plasma membrane translocation of GLUT1 and glucose uptake. Mol Cell. (2017) 67:84–95 e85. doi: 10.1016/j.molcel.2017.05.020
102. Min D, Panoskaltsis-Mortari A, Kuro OM, Hollander GA, Blazar BR, Weinberg KI. Sustained thymopoiesis and improvement in functional immunity induced by exogenous KGF administration in murine models of aging. Blood. (2007) 109:2529–37. doi: 10.1182/blood-2006-08-043794
103. Kimata M, Michigami T, Tachikawa K, Okada T, Koshimizu T, Yamazaki M, et al. Signaling of extracellular inorganic phosphate up-regulates cyclin D1 expression in proliferating chondrocytes via the Na+/Pi cotransporter Pit-1 and Raf/MEK/ERK pathway. Bone. (2010) 47:938–47. doi: 10.1016/j.bone.2010.08.006
104. Michigami T. Extracellular phosphate as a signaling molecule. Contrib Nephrol. (2013) 180:14–24. doi: 10.1159/000346776
105. Fischer AM, Katayama CD, Pages G, Pouyssegur J, Hedrick SM. The role of erk1 and erk2 in multiple stages of T cell development. Immunity. (2005) 23:431–43. doi: 10.1016/j.immuni.2005.08.013
106. McGargill MA, Ch'en IL, Katayama CD, Pages G, Pouyssegur J, Hedrick SM. Cutting edge: extracellular signal-related kinase is not required for negative selection of developing T cells. J Immunol. (2009) 183:4838–42. doi: 10.4049/jimmunol.0902208
107. Pages G, Guerin S, Grall D, Bonino F, Smith A, Anjuere F, et al. Defective thymocyte maturation in p44 MAP kinase. (Erk 1) knockout mice. Science. (1999) 286:1374–7. doi: 10.1126/science.286.5443.1374
108. Aw D, Silva AB, Palmer DB. Is thymocyte development functional in the aged? Aging. (2009) 1:146–53. doi: 10.18632/aging.100027
109. Aw D, Silva AB, Palmer DB. The effect of age on the phenotype and function of developing thymocytes. J Comp Pathol. (2010) 142 (Suppl. 1):S45–59. doi: 10.1016/j.jcpa.2009.10.004
110. Fowlkes BJ, Pardoll DM. Molecular and cellular events of T cell development. Adv Immunol. (1989) 44:207–64. doi: 10.1016/S0065-2776(08)60643-4
111. Thoman ML. The pattern of T lymphocyte differentiation is altered during thymic involution. Mech Ageing Dev. (1995) 82:155–70. doi: 10.1016/0047-6374(95)01597-S
112. Lepletier A, Alsharif A, Chidgey AP. Inflammation and thymus ageing. Front Horm Res. (2017) 48:19–36. doi: 10.1159/000452903
113. Xiao S, Shterev ID, Zhang W, Young L, Shieh JH, Moore M, et al. Sublethal total body irradiation causes long-term deficits in thymus function by reducing lymphoid progenitors. J Immunol. (2017) 199:2701–12. doi: 10.4049/jimmunol.1600934
114. Cabon L, Bertaux A, Brunelle-Navas MN, Nemazanyy I, Scourzic L, Delavallee L, et al. AIF loss deregulates hematopoiesis and reveals different adaptive metabolic responses in bone marrow cells and thymocytes. Cell Death Differ. (2018) 25:983–1001. doi: 10.1038/s41418-017-0035-x
115. Bejarano-Garcia JA, Millan-Ucles A, Rosado IV, Sanchez-Abarca LI, Caballero-Velazquez T, Duran-Galvan MJ, et al. Sensitivity of hematopoietic stem cells to mitochondrial dysfunction by SdhD gene deletion. Cell Death Dis. (2016) 7:e2516. doi: 10.1038/cddis.2016.411
Keywords: thymus, phosphate transporters, glucose transporters, metabolism, human, mice, aging
Citation: Machado A, Pouzolles M, Gailhac S, Fritz V, Craveiro M, López-Sánchez U, Kondo T, Pala F, Bosticardo M, Notarangelo LD, Petit V, Taylor N and Zimmermann VS (2020) Phosphate Transporter Profiles in Murine and Human Thymi Identify Thymocytes at Distinct Stages of Differentiation. Front. Immunol. 11:1562. doi: 10.3389/fimmu.2020.01562
Received: 01 April 2020; Accepted: 15 June 2020;
Published: 22 July 2020.
Edited by:
Ann Chidgey, Monash University, AustraliaReviewed by:
Masahiro Ono, Imperial College London, United KingdomAnna Furmanski, University of Bedfordshire, United Kingdom
Copyright © 2020 Machado, Pouzolles, Gailhac, Fritz, Craveiro, López-Sánchez, Kondo, Pala, Bosticardo, Notarangelo, Petit, Taylor and Zimmermann. This is an open-access article distributed under the terms of the Creative Commons Attribution License (CC BY). The use, distribution or reproduction in other forums is permitted, provided the original author(s) and the copyright owner(s) are credited and that the original publication in this journal is cited, in accordance with accepted academic practice. No use, distribution or reproduction is permitted which does not comply with these terms.
*Correspondence: Naomi Taylor, dGF5bG9ybjRAbWFpbC5uaWguZ292; Valérie S. Zimmermann, dmFsZXJpZS56aW1tZXJtYW5uQGlnbW0uY25ycy5mcg==
†These authors have contributed equally to this work
‡These authors share senior authorship