 Martina Cappelletti1*
 Alessandro Presentato1
 Giorgio Milazzo1
 Raymond J. Turner2
 Stefano Fedi1
 Dario Frascari3
 Davide Zannoni1
- 1Department of Pharmacy and Biotechnology, University of Bologna, Bologna, Italy
- 2Department of Biological Sciences, University of Calgary, Calgary, Alberta, Canada
- 3Department of Civil, Chemical, Environmental and Materials Engineering, University of Bologna, Bologna, Italy
Rhodococcus sp. strain BCP1 was initially isolated for its ability to grow on gaseous n-alkanes, which act as inducers for the co-metabolic degradation of low-chlorinated compounds. Here, both molecular and metabolic features of BCP1 cells grown on gaseous and short-chain n-alkanes (up to n-heptane) were examined in detail. We show that propane metabolism generated terminal and sub-terminal oxidation products such as 1- and 2-propanol, whereas 1-butanol was the only terminal oxidation product detected from n-butane metabolism. Two gene clusters, prmABCD and smoABCD—coding for Soluble Di-Iron Monooxgenases (SDIMOs) involved in gaseous n-alkanes oxidation—were detected in the BCP1 genome. By means of Reverse Transcriptase-quantitative PCR (RT-qPCR) analysis, a set of substrates inducing the expression of the sdimo genes in BCP1 were assessed as well as their transcriptional repression in the presence of sugars, organic acids, or during the cell growth on rich medium (Luria–Bertani broth). The transcriptional start sites of both the sdimo gene clusters were identified by means of primer extension experiments. Finally, proteomic studies revealed changes in the protein pattern induced by growth on gaseous- (n-butane) and/or liquid (n-hexane) short-chain n-alkanes as compared to growth on succinate. Among the differently expressed protein spots, two chaperonins and an isocytrate lyase were identified along with oxidoreductases involved in oxidation reactions downstream of the initial monooxygenase reaction step.
Introduction
Gaseous n-alkanes ranging from ethane (C2) to n-butane (C4) are categorized as non-methane hydrocarbons. Volatile aliphatic n-alkanes comprise of gaseous and liquid n-alkanes up to n-heptane (C7). Increasing concentrations of these n-alkanes in the atmosphere is problematic because of their contributions to ozone enhancement and photochemical smog formation (Chan et al., 2006; Shennan, 2006). From a biotechnological perspective, gaseous and short-chain n-alkanes (up to C7) are inexpensive carbon sources for microbial growth and bio-production of biosurfactants and polyhydroxyalkanoates (PHAs) (Lageveen et al., 1988; Philp et al., 2002).
Aerobic bacterial metabolism of gaseous- and short-chain liquid n-alkanes has received little attention compared to that of methane (C1) and/or longer chain n-alkanes (C >12) (Kotani et al., 2006). Our present knowledge on the metabolism of short-chain n-alkanes is based on studies in Gram-negative bacteria, when the most common bacterial species isolated from natural habitats that utilize gaseous n-alkanes are Gram-positive strains belonging to the CMNR group (including Corynebacterium, Nocardia, Mycobacterium, and Rhodococcus genera). Thauera butanivorans (formerly called “Pseudomonas butanovora”) is the best characterized Gram-negative microorganism able to metabolize gaseous n-alkanes, while the majority of data on gaseous n-alkane microbial growth is based upon the microbial ability to utilize putative metabolic intermediates such as propanal, acetone, and acetal (Ashraf et al., 1994; Arp, 1999; Kulikova and Bezborodov, 2001; Sluis et al., 2002; Kotani et al., 2003; Dubbels et al., 2007; Cooley et al., 2009).
Bacteria can utilize n-alkanes as growth substrates under aerobic conditions through the use of a monooxygenase reaction. The insertion of one oxygen atom from dioxygen (O2) into the alkane is catalyzed by iron- or copper-containing monooxygenase (MO) enzymes (Hamamura et al., 1999; van Beilen and Funhoff, 2007). Among these, Soluble Di-Iron Monooxygenases (SDIMOs) are multi-component enzymes that catalyze the initial oxidation of low molecular weight alkanes and alkenes as well as chlorinated solvents, aromatic hydrocarbons and cyclic ethers (Coleman et al., 2006). Recent studies have classified these enzymes into different groups based on gene organization, substrate specificity, and sequence similarity (Coleman et al., 2006, 2011). Since SDIMOs are responsible for several bioremediation and biocatalytic processes, widening our knowledge on their genetic diversity and on the growth conditions inducing their expression is of crucial importance for microbial biotechnology.
The Gram-positive soil microorganism, Rhodococcus sp. strain BCP1, was initially described for its ability to grow on gaseous n-alkanes as inducing condition for low chlorinated compound co-metabolism (Frascari et al., 2005, 2006, 2007; Cappelletti et al., 2012; Ciavarelli et al., 2012). In a previous study we have shown that in BCP1 cells, the expression of a gene (alkB) encoding an AlkB-like monooxygenase was induced by growth on liquid n-alkanes ranging from n-hexane (C6) to n-eicosane (C20) (Cappelletti et al., 2011). Here, we focused our attention on the ability of BCP1 to grow on short-chain n-alkanes (<C7) and the genetic and metabolic aspects involved. To this end, we analyzed gaseous n-alkane oxidation products and studied O2 consumption activity induced by short-chain n-alkanes (C1–C7) and their putative metabolic intermediates. Furthermore, two gene clusters coding for two different SDIMOs were found in the genome of BCP1 and named prm and smo according to similar operons present in the database. Both prm and smo were co-transcribed as single polycistronic units. The range of n-alkanes inducing their expression and their transcriptional start sites were defined, along with the effects of alternative carbon sources on their transcriptional induction. Finally, proteomic analysis provided useful insights on enzymes of BCP1 acting downstream of the initial oxidation step of gaseous (n-butane) and liquid (n-hexane) n-alkanes.
Materials and Methods
Bacterial Strains, Growth Media, and Culture Conditions
Rhodococcus sp. strain BCP1 was grown for 2 days on 10 mL of Luria–Bertani (here indicated as LB) for the genomic DNA purification and for the precultures preparation. The growth of BCP1 on n-alkanes and their metabolic intermediates was conducted in 119-mL bottles containing 40 mL of mineral medium (MM) [composed of (in micromoles) (NH4)2SO4, 797; MgSO4·7H2O, 244; CaCl2, 132; K2HPO4, 8900; NaH2PO4 · H2O, 5355; FeSO4·7H2O, 22.6; NaNO3, 9000; MnCl2·4H2O, 1.52; ZnSO4·7H2O, 0.510; H3BO3, 1.00; Na2MoO4·2H2O, 0.450; NiCl2·2H2O, 0.144; CuCl2·2H2O, 0.100; CoCl2·6H2O, 0.100] (Frascari et al., 2006). Each bottle was inoculated with 100 μL of the BCP1 preculture and then sealed with butyl rubber stoppers and aluminum crimp seals. BCP1 cultures were incubated at 30°C with shaking at 150 rpm. In the growth experiments, for each substrate, three bottles were inoculated. Gaseous n-alkanes were added at the final aqueous concentrations of 180 μM. Liquid n-alkanes, alcohols, butyric aldehyde and butyric acid (as sodium salt) were supplied at the final concentration of 0.1% (v/v). Succinate was supplied at the final concentration of 0.1% (w/v). To determine the generation time, an aliquot of each culture of BCP1 was spread onto LB plates every 12 h and the colonies were counted after 3 days of growth at 30°C. Both viable cell counts [colony forming units (CFU) per mL] and cell densities (OD600) were measured periodically over a total time of 96 h.
E. coli DH5α was used for cloning and production of the pUC18-based plasmids i.e., upprm-pUC and upsmo-pUC (for their description see below). DH5α cells were grown on LB at 37°C with shaking at 150 rpm. When appropriate, ampicillin was added to LB at a final concentration of 50 μg/mL.
Whole Cell Experiments
Rhodococcus sp. strain BCP1 cells to be tested in the experiments for alcohol production and oxygen uptake activity were developed as follows. Five 119-mL bottles containing 40 mL of MM were prepared for each growth substrate. The cultures were grown up to a final OD600 ~ 1.0. After centrifugation, the cells were washed twice with 25 mM phosphate buffer (pH 7.2) and resuspended in 5 mL of the same buffer (herein concentrated cell suspension). Accumulation of 1- and 2-butanol was measured using 1-propanol or 2-propanol as inhibitors of butanol consumption, while the accumulation of 1- and 2-propanol was measured using 1-butanol and 2-butanol as inhibitors. The reaction mixture consisted of the substrate (n-butane or propane), competitor (5 mM), and O2-saturated phosphate buffer up to a total volume of 2 mL, inside 13.9 mL sealed serum vials. After 30 min equilibration of the reaction mixture at 30°C, the assay was initiated by the addition of the concentrated cell suspension (500 μL; around 200 mg wet mass of cells) into each sample vial. In the negative control samples, no inoculum was added. The vials were shaken at 150 rpm during the reactions. For inactivation assays, the concentrated cell suspension was added to the reaction mixture after being incubated with 5% (vol/gas-phase vol) acetylene for 30 min at 30°C with constant shaking. Liquid samples (4 μL) were removed after 15, 30, 45, and 60 min and the production of the short-chain aliphatic alcohols was determined by a gas chromatograph (GC, HP 5890) equipped with a flame ionization detector and a Supelcowax-10 column (30 m with 0.53 mm inner diameter). The GC was run at column temperature of 45°C for 5 min, then up to 200°C at 40°C/min, and with a detector temperature of 300°C. Helium was used as the carrier gas at a flow rate of 15 mL/min. Identities of products were determined by comparison of retention times and peak shapes to those of authentic compounds.
O2 consumption of BCP1 cells induced by the addition of various compounds was measured with a Clark-type O2 electrode inserted into a 1.9 mL chamber sealed with a capillary inlet through which additions were made. After BCP1 cells were grown in each condition under investigation, they were washed twice with 25 mM phosphate buffer (pH 7.2), suspended in the same buffer and shaken at 30°C for 5 h to decrease the endogenous respiration. Before being introduced into the electrode chamber, the biomass was diluted with air-saturated buffer to a final OD600 = 0.4. Cell suspensions were exposed to gases inside 13.9 mL sealed bottles, while the liquid substrates were introduced into the electrode chamber by direct addition. The reactions were carried out at Room Temperature (RT, 20–23°C) and stirred with a magnetic bar. In the inhibitory assay, an aliquot of the cell suspension from each condition of growth was incubated with acetylene (5% v/v) for 30 min before being introduced into the electrode chamber and being exposed to the substrates. The O2 consumed, expressed in nmols, was normalized to mg of proteins that was determined through method of Lowry (Lowry et al., 1951) with bovine serum albumine (BSA) as a standard. Experiments were conducted in triplicate.
Nucleotide Sequence Analysis
RAST server was used to analyze the draft genome of Rhodoccocus sp. strain BCP1 that has been recently sequenced and published (Cappelletti et al., 2013). Sequence similarity searches were performed using BLAST programs (http://www.ncbi.nlm.nih.gov/blast/blast.cgi) (Altschul et al., 1997) together with the conserved domain database (http://www.ncbi.nlm.nih.gov/cdd/), whereas multiple sequence alignments were performed with ClustalW software (http://www.ebi.ac.uk/clustalw/). Phylogenetic trees were created using Geneiuos Tree Builder tool in Geneious Pro 4.7.6 software with the following parameters: genetic distance model, Juke-Cantor; tree-building method, neighbor joining; Pseudonocardia tetrahydrofuranoxydans K1 thmA and Xanthobacter autotrophicus Py2 xamoA were used as outgroup for prmA and smoA, respectively.
Primer Extension, Reverse Transcription (RT-) PCR and Quantitative Real Time PCR (qRT-PCR) Analysis
Total RNA was extracted from 100 mL of Rhodococcus sp. strain BCP1 culture grown at 30°C on MM enriched (MMenr) with yeast extract, casamino acids, peptone (0.5 g/L each), and 1% (wt/vol) succinate, up to a final OD600 = 0.6–0.7. After cell washing in phosphate buffer (10 mM; pH 7.2), each culture was suspended in 30 mL of MM. Cell cultures were incubated for 4 h in MM at 30°C in the presence of variable substrates. For the analysis of the effect of alternative carbon sources on prmA and smoA expression, BCP1 cells were grown on MMenr medium supplied with either glucose or succinate (1% w/v each), or on LB. After cell washing, propane or n-butane (150 μM) was introduced into sealed bottles with BCP1 cells in 30 mL of MM (for cells grown on MMenr) or LB (for cells grown on LB). In addition to gaseous n-alkanes, succinate or glucose was added to MM-resuspended cells at a final concentration of 1% (w/v). After incubation with the substrates, 1/10 volume of ice-cold phenol–ethanol solution was added to each bottle to stop the RNA degradation. The cells were precipitated and stored at −80°C for later use. RNA extraction protocol was performed as previously described by Cappelletti et al. (2011). The total RNA was treated twice with 5 U of RNase-free DNase (Qiagen; 30 min at 30°C) and purified with RNeasy kit (Qiagen).
For the cDNA synthesis, 500 ng amount of total RNA was reverse-transcribed with 0.25 μg of random hexamers (Invitrogen) in 10-μL reaction mixtures. After denaturation for 3 min at 94°C and annealing for 5 min at 37°C, 1 U of avian myeloblastosis virus (AMV) reverse transcriptase (Promega) and 50 U of the RNase inhibitor RNasin (Promega) were added and reverse transcription was performed at 42°C for 1.5 h. In order to study the co-transcription of the genes composing each cluster through RT-PCR assays, 1/10 of the resultant cDNA was amplified using the sets of primers listed in Table S1 and represented in Figure S1. After an initial incubation at 94°C for 2 min, 25 cycles of the following temperature program were used: 94°C for 30 s, 60°C for 30 s, and 72°C for 30 s. In order to exclude DNA contamination, negative controls were performed by omitting the reverse transcriptase in RT-PCR experiments, which were conducted with the same temperature program and the same primer sets for 30 cycles of amplification.
In order to assess the transcriptional level of prmA and smoA genes induced by the growth on n-alkanes added alone or in the presence of alternative carbon sources, Reverse Transcriptase-quantitative PCR (RT-qPCR) experiments were performed. For this purpose, the reverse-transcribed samples were amplified using the CFX96 Real-Time System (Bio-Rad). Each 20-μl qPCR volume contained 2 μL of the reverse-transcribed RNA samples, 10 μL of SsoAdvanced universal SYBR Green supermix (Biorad), and 250 nM of each primer (forward and reverse, listed in Table S1). Thermocycling conditions were as follows: 30 s at 95°C, followed by 30 cycles of 5 s at 95°C and 5 s at 60°C. Expression of the housekeeping gene, 16S rDNA, was used as the reference gene to normalize tested genes in R. sp. strain BCP1. The relative fold change in mRNA quantity was calculated for the gene of interest in each sample using the ΔΔCt method followed by Student's one-sample t-test to evaluate whether the gene targets were differentially regulated. Data are expressed as mean ± standard deviation derived from at least three independent experiments. Differences were considered significant at P < 0.05. For each RNA preparation, at least three independent real-time PCR experiments were conducted.
The primer extension assays were performed on RNA isolated from BCP1 cells that were exposed for 4 h to butane and succinate as previously described (Roncarati et al., 2007). The primers used to map the transcriptional start sites of prmA and smoA in primer extension assays are reported in Table S1. Primer extension products were analyzed on a 6% polyacrylamide gel next to a sequence ladder generated using the same primers and pUC18-based plasmids containing prmA or smoA and their 250-bp upstream regions (upprm-pUC or upsmo-pUC, respectively). Sequencing reactions were performed with the T7 sequencing kit (USB) as previously described (Cappelletti et al., 2011).
Protein Sample Preparation and Two-Dimensional Gel Electrophoresis (2-DE) Procedure
BCP1 cells were grown in MM supplied with the carbon source under analysis to the exponential phase (OD600 = 0.6–0.7). The biomass grown on each substrate was resuspended in 5 mL lysis buffer [8 M urea, 4% 3-(3-cholamidopropyl)-dimethylammonio-1-propanesulfonate (CHAPS), 2% IPG buffer in 10 mM Tris, pH 8.5, in the presence of 1 mM phenylmethylsulfonyl fluoride (PMSF)]. The suspension was aliquoted into 2 mL-tubes containing 0.5 mL of nitric acid pre-washed quartz beads (0.2–0.8 mm diameter, MERCK KGaA, Germany). The cells were disrupted using a Precellys®24 (Bertin Technologies) bead beater for five cycles of 30 s, speed 6000 m/s. Unbroken cells and cell debris were removed by low speed centrifugation (14,000 rpm, 10 min, 4°C) and the supernatants were cleared by ultracentrifugation (32,500 rpm, 1.5 h, 4°C). The cell-free protein extracts were either stored at −80°C or used immediately for proteomic studies.
The samples to be used for two-dimensional gel electrophoresis (2-DE) were concentrated, desalted and separated from low-molecular weight inhibitors by filtration through a 10-kDa filter (centrifugal filters with 10 kDa cut off, Millipore). The liquid remaining (retentate) in the reservoir was treated with RNase and DNase I (0.1 mg/mL each) for 30 min before being subjected to two additional filtration steps. In the end, around 50 μL of purified cell extract was transferred to a new tube and the amount of total soluble protein content was estimated by the Bradford assay (Bradford, 1976) that did show compatibility with the small concentration of urea still present in the sample. A volume of sample corresponding to 300 μg of extracted protein was solubilized in urea rehydration solution [8 M urea, 2% CHAPS, 2% IPG Buffer, 0.002% bromophenol blue, 25 mM dithiothreitol (DTT)] for 30 min at RT and then applied to Immobiline DryStrip (13 cm, non-linear pH 4–7) (GE Healthcare) for isoelectric focusing (IEF). IEF in the IPG strips was carried out for a total of 29.3 kVh at 20°C under mineral oil using ETTAN IPGphor (Amersham Biosciences). After IEF, the strips were equilibrated for 30 min at RT in equilibration solution (40% glycerol, 50 mM Tris pH 8.8, 8 M urea, 2% SDS) containing 2% DTT and then in equilibration solution containing 2.5% iodoacetamide. Proteins were separated by 12% sodium dodecyl sulfate polyacrylamide gel electrophoresis (SDS-PAGE) in the second dimension using a PROTEAN II xi 2-D Cell electrophoresis system (gel size 16 × 20 cm) (BioRad). For protein spot visualization, 2-D gels were stained with Coomassie brilliant blue staining.
LC/MS/MS Analyses and Protein Identification
Protein spots were excised from Coomassie brilliant blue-stained 2-D gels, washed and prepared for LC/MS/MS analyses as described by Tremaroli et al. (2011). Tandem mass spectra (LC/MS/MS) were obtained on an Agilent 1100 Series LC/MSD ion Trap XCT Plus as previously reported (Tremaroli et al., 2011). Proteins were identified using the MASCOT search engine (www.matrixscience.com) and a BCP1 protein database that was built up in conjunction with the genome-sequencing study (Cappelletti et al., 2013). Theoretical molecular masses and isoelectric points of the proteins of interest were calculated using EXPASY tools (Bjellqvist et al., 1993).
Results
BCP1 Growth on Short-Chain n-Alkanes and on Putative Metabolic Intermediates
It has previously been reported that Rhodococcus sp. strain BCP1 has the capacity to grow on n-alkanes (Frascari et al., 2006; Cappelletti et al., 2011). Here, the analysis of BCP1 growth has been extended to C1–C7 n-alkanes along with potential intermediate metabolites of gaseous n-alkanes (1- and 2-propanol/butanol, propionic and butyric aldehydes, propionic and butyric acids, acetone, and butanone) (see Table 1). Except for C1, BCP1 cells grew on the tested short-chain n-alkanes and showed the lowest Generation Times (G) with C3–C5 n-alkanes (2.7–2.8 h). Growth of BCP1 was also seen on all the assayed potential intermediate metabolites such as alcohols and fatty acids. Better growth was observed using the propane and n-butane oxidation products containing a hydroxyl group (–OH) at the terminal position, 1-propanol and 1-butanol, than compared to the sub-terminal oxidized alcohols, 2-propanol, and 2-butanol (Table 2). Higher final OD600-values were reached by BCP1 cultures growing on butyrate and propionate than compared to butanone and acetone; these latter compounds being the oxidation products of 2-butanol and 2-propanol, respectively. Nevertheless, the substrate range experiments indicate the presence of enzymes transforming putative metabolic intermediates of both sub-terminal and terminal oxidation pathways in BCP1 metabolism of gaseous n-alkanes.
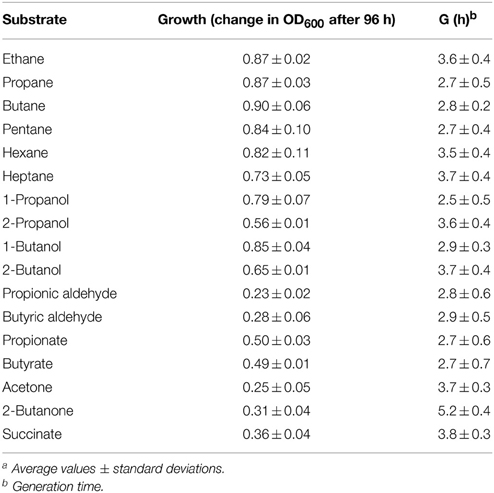
Table 1. Growth on short-chain n-alkanes by R. sp. strain BCP1a.
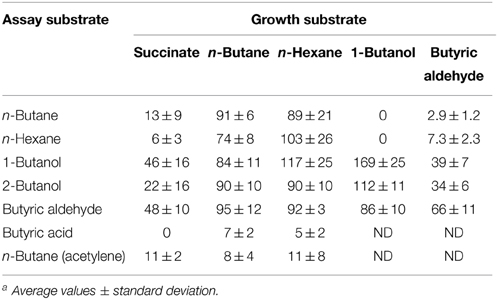
Table 2. Ability of R. sp. strain BCP1 to oxidize n-alkanes (n-butane and n-hexane) and potential intermediates of n-butane metabolism after batch growth on succinate, n-butane, n-hexane, 1-butanol, and butyric aldehyde. O2 uptake rates are expressed as nmol oxygen consumed min−1 (mg protein)−1. ND, not determined a.
In order to test the inducible nature of the enzyme systems involved in the short-chain n-alkanes metabolism, the O2 consumption activities of BCP1 cells grown on n-butane (gaseous alkane), n-hexane (liquid alkane), 1-butanol, butyric aldehyde (both C4 metabolic intermediates), and succinate (control), were determined by polarography (Table 2). The stimulation of cellular O2 uptake was measured upon addition of the same n-alkanes or the putative metabolic intermediates of n-butane metabolism. Results show that the n-alkane oxidative system was not induced in cells grown on n-butane metabolic intermediates (1-butanol, butyric aldehyde) and was only slightly induced (around 10–15% of the values obtained from cultures grown on n-alkanes) in cells grown on succinate. The addition of n-hexane stimulated O2 consumption in n-butane-grown cells and the same effect was observed with the addition of n-butane to n-hexane-grown cell suspensions. These results indicate that the monooxygenases (MO) induced by growth on either n-butane or n-hexane have a substrate range including both these short-chain n-alkanes. Cells pre-incubated with acetylene, a known MO inactivator, decreased the O2 consumption rates induced by n-alkanes by 70–75%. The constitutive metabolism of 1-butanol and butyric aldehyde was demonstrated by the O2 uptake observed with succinate-grown cells after the addition of these substrates to the cell suspensions. An increase in the level of O2 consumption induced by n-butane metabolic intermediates was detected with BCP1 cells grown on n-butane but also on n-hexane. These results suggest that the enzymatic systems acting downstream of the initial n-hexane oxidation production have a group of substrates which includes n-butane metabolic intermediates. The O2 consumption activity of 1-butanol-grown cells was substantially stimulated by the addition of either 1-butanol or 2-butanol and only slightly stimulated by the addition of butyric aldehyde (Table 2). The absence of butyric acid oxidation by n-butane- and n-hexane-grown cells might be due to the lack of induction of an uptake system for this substrate during the growth on n-alkanes (Salanitro and Wegener, 1971).
Gas-Chromatographic (GC) Analyses of Gaseous n-Alkanes Oxidation
GC analyses were performed to define the oxidation products of short-chain n-alkane metabolism by BCP1 resting cells pre-grown on either n-butane or propane. The accumulation of the C4 and C3 oxidation products in the growth medium was obtained by adding excess amounts of their structural analogs. When 1-propanol was supplied in addition to n-butane to the suspension of n-butane-grown BCP1 cells, 1-butanol accumulated and was already detected as a product of n-butane oxidation after 15 min of incubation (Figure S2). The amount of 1-butanol produced was not stoichiometrically equivalent to the amount of n-butane consumed; this was possibly due to only partial inhibition exerted by 1-propanol on the downstream oxidation steps. To determine whether n-butane undergoes subterminal oxidation in BCP1 cells, 2-propanol was supplied as competitor in addition to n-butane. As a result, no 2-butanol production was detected (Figure S2). However, when propane-grown cells were tested in the presence of propane and excess amount of either 1-butanol or 2-butanol, peaks corresponding to 1-propanol and 2-propanol were observed, respectively (Figure S2). The accumulation of the oxidation products was completely inhibited when n-butane- or propane-grown BCP1 cells were pre-treated with acetylene, a well-known monooxygenase inactivator (data not shown). The production of 1-butanol from n-butane and 1-propanol from propane indicates that the metabolism of short-chain n-alkanes undergoes terminal oxidation process in BCP1. However, the production of 2-propanol suggests that subterminal oxidation reaction can also occur.
Analyses of Two sdimo Gene Clusters in Rhodococcus sp. Strain BCP1
The analysis of the genome of BCP1 revealed two gene clusters coding for SDIMOs. Each cluster included four genes encoding the following monooxygenase components: two subunits of the hydroxylase, an effector (or coupling) protein and a reductase. The single genes were arranged differently in the two clusters and their nucleotide sequences shared 48–55% identity. Based on similarity analysis with SDIMO sequences present in the database and phylogenetic analysis of genes coding for the SDIMO alpha subunits (Figures S3, S4 in Supplementary Material), the two gene clusters were named prmABCD and smoABCD.
The BCP1 prmABCD gene covers a 4,255 bp chromosomal DNA region (Gene Accession number NZ_CM002177) comprising of the following four consecutive ORFs homolog to the propane monooxygenase (prm) gene cluster components: prmA (oxygenase large subunit), prmB (reductase), prmC (oxygenase small subunit), prmD (coupling protein). Considering the blast hits described in literature, the BCP1 prmABCD cluster has the same operon arrangement as the homologous regions from R. sp. strain RHA1 (prmABCD operon), Mycobacterium (M.) godii (mimABCD operon) and Gordonia sp. strain TY-5 (prmABCD operon) in addition to showing high similarity (80–89% nucleotide identity) to these regions. It also shares 69 and 74% similarity with the Pseudonocardia sp. strain TY-7 prm1ABCD and prm2ABCD operons, respectively. Intergenic distances between the stop codons and the start codons were 98 bp for prmA and prmB and 50 bp for prmB and prmC, whereas the 3′ terminal nucleotide of prmC and the 5′ terminal nucleotide of prmD overlapped by 4 bp. Putative Shine-Dalgarno-like ribosome binding site (RBS) sequences (AGGAGG, AGGAG, AGAAG, AAGGAG) were found upstream of prmA, prmB, prmC, and prmD. Regarding the prmABCD flanking regions, the relative position and transcription direction were maintained for some of these genes as compared to homologous regions belonging to other reference strains which have their complete genomes sequenced, i.e., Rhodococcus sp. strain RHA1, R. opacus PD630, M. smegmatis, Gordonia bronchialis (Figure 1). The conserved genes are located downstream of the prmABCD cluster and code for a metal-dependent hydrolase, a metal-sulfur cluster biosynthetic enzyme, an alcohol dehydrogenase, and a GroEL chaperon. In M. smegmatis RHA1, PD630, and BCP1, additional conserved genes code for a Fis family transcriptional regulator and an antibiotic biosynthesis monooxygenase. A gene coding for a catalase is maintained in the three Rhodoccocus spp. (Figure 1). In Rhodococcus and Mycobacterium, the Fis family transcriptional regulator gene is located upstream of prmA and transcribed in the opposite direction to prmABCD. In Gordonia, the homolog of BCP1 Fis regulator gene, is positioned downstream of the conserved region comprising the prm gene cluster, and is transcribed in the same direction (Figure 1).
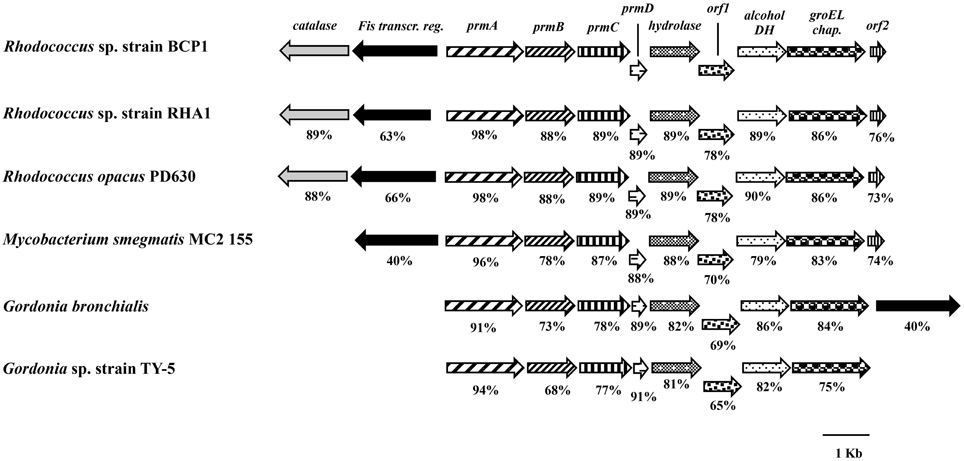
Figure 1. Organization of the prmABCD cluster and the flanking regions from R. sp. strain BCP1 and comparisons with equivalent regions from other bacteria (only homologous genes are represented). The locus tags of the genomic regions taken into consideration are as follows: KDE11336–KDE11346, R. sp. strain BCP1; RHA1_ro00439–RHA1_ro00449, R. sp. strain RHA1; OPAG_05101–OPAG_05111, R. opacus PD630; MSMEG_1970–MSMEG_1979, Mycobacterium smegmatis MC2 155; Gbro_3551–Gbro_3559, G. bronchialis; BAD03956–BAD03963, G. sp. strain TY-5. Genes are represented by arrows and homologous genes are represented by the same pattern. Full names for abbreviated genes or products are listed as follows: prmA, oxygenase large subunit; prmB, reductase; prmC, oxygenase small subunit; prmD, coupling protein; groEL chap., chaperonine beloning to GRoEL family; DH, dehydrogenase; Fis transcr. reg., transcriptional regulator belonging to Fis family; orf1, metal-sulfur cluster biosynthetic enzyme; orf2, antibiotic biosynthesis monooxygenase. Numbers underneath the arrows indicate the percentage of amino acid sequence identity between each encoded gene product and the equivalent product from R. sp. strain BCP1.
The smoABCD gene cluster in BCP1 is found on the 103,129 bp plasmid pBMC2 (Gene Accession number NZ_CM002179) and covers a 3,987 bp region (Figure 2). As inferred from both RAST annotation and BLAST analyses, the single genes code for the monooxygenase alpha subunit (SmoA), the monooxygenase beta subunit (SmoB), the coupling protein (SmoC) and the reductase (SmoD). The nucleotide sequence of smoABCD gene cluster exhibited overall identities of 85 and 81% with homologous regions from M. chubuense NBB4 and M. marinum, respectively. Notably, a few blast hits matched the amino acid sequence of SmoA with an identity score higher than 80% which underlines the scarcity of homologs to this SDIMO in the database. The intergenic distance between the stop codon of smoC and the start codon of smoD is 11 bp. smoA/smoB and smoB/smoC genes overlapping regions are of 1 and 4 bp, respectively. A putative Shine-Dalgarno-like RBS sequence (GGGAG) was found 7 bp upstream of smoA. Located upstream of smoABCD, there is a gene for long-chain fatty acid CoA ligase as well as two genes coding for two-component system regulators. The latter two genes are also maintained in the homologous region of M. chubuense NBB4 (Figure 2). Furthermore, two genes encoding a zinc-containing alcohol dehydrogenase (DH) and a cpn60-type chaperonin are located downstream of both BCP1 smoABCD and NBB4 smoABCD regions; although in BCP1, an additional gene encoding an aldehyde DH is also present (Figure 2).
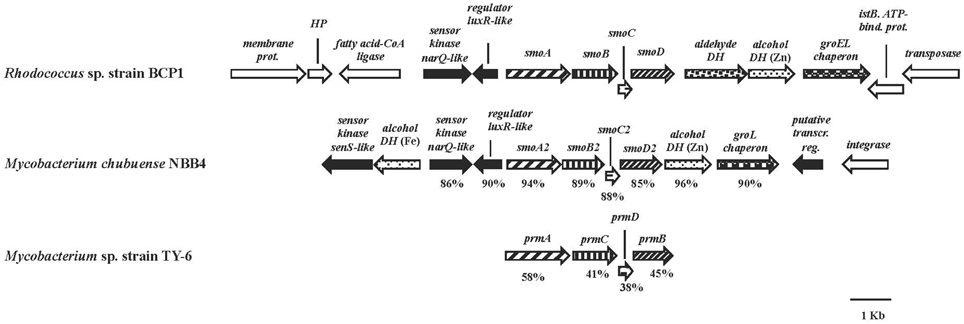
Figure 2. Organization of the smoABCD cluster and the flanking regions from R. sp. strain BCP1 and comparisons with equivalent regions from other two Mycobacterium strains. smoA2B2C2D2 and prmACDB are the only gene cluster functionally described among the best BLAST hits of BCP1 smo genes (Kotani et al., 2006; Coleman et al., 2011). The locus tags of the genomic regions taken into consideration are as follows: KDE09885–KDE09898, R. sp. strain BCP1; Mycch_5399–Mycch_5388, M. chubuense NBB4; AB250938, M. sp. TY-6. Genes are represented by arrows. Homologous genes are represented by the same pattern except for the white arrows that represent genes without homology with other genes displayed in the figure and the black arrows that represent regulatory genes. Full names for abbreviated genes or products are listed as follows: smoA/smoA2, monooxygenase alpha subunit; smoB/smoB2, monooxygenase beta subunit; smoC/smoC2, coupling protein; smoD/smoD2, reductase; prmA, propane monooxygenase hydroxylase large subunit; prmC, propane monooxygenase hydroxylase small subunit; prmD, propane monooxygenase coupling protein; prmB, propane monooxygenase reductase. Full names for abbreviations are: HP, hypothetical protein; DH, dehydrogenase; bind., binding; prot., protein; transcr. reg., transcriptional regulator. Numbers underneath the arrows indicate the percentage of amino acid sequence identity between each encoded gene product and the equivalent product from R. sp. strain BCP1.
Transcriptional Analysis of prm and smo Gene Clusters in BCP1 Cells Exposed to n-Alkanes
Information on the transcriptional inducibility of the two sdimo gene clusters and their transcriptional organization was obtained through RT-PCR experiments. To this end, the alpha subunit coding genes (prmA and smoA) as well as the entire gene clusters (prmABCD and smoABCD) were targeted in RT-PCR using RNA from BCP1 cells exposed for 4 h to gaseous n-alkanes (C1–C4) and succinate. As a result, DNA fragments with expected sizes were obtained for prmA gene and prmABCD operon using the total RNA from BCP1 cells grown on propane and n-butane (Figure 3). No transcription products were revealed from BCP1 cells exposed to methane or grown on ethane and succinate. RT-PCR products for smoA and smoABCD were detected using the RNA of BCP1 cells exposed to all the tested n-alkanes (C1–C4), but not to succinate (Figure 3). No amplification products were obtained when reverse transcriptase was omitted from the reaction mixtures (data not shown). These results qualitatively indicate that a different range of substrates induces the expression of the two sdimo gene clusters and that they are transcribed as a polycistronic unit.
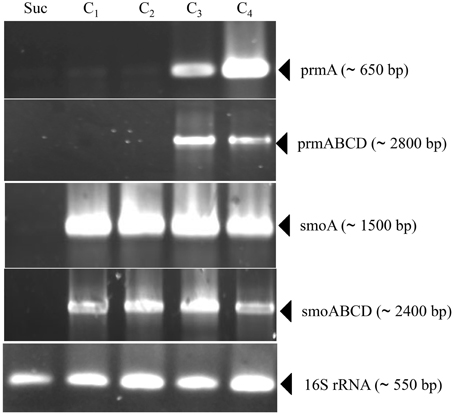
Figure 3. RT-PCR analysis of prmA, smoA, prmABCD and smoABCD from R. sp. strain BCP1. mRNA was prepared from cells of BCP1 which have been exposed for 4 h to succinate (Suc), methane (C1), ethane (C2), propane (C3), n-butane (C4). The different sets of primers that have been used to amplify a RT-PCR product for each gene (prmA and smoA) and for each gene cluster (prmABCD and smoABCD) are reported in Table S1 and represented in Figure S1. The size of each PCR product is indicated between brackets.
To quantify the differential expression of smoA and prmA genes induced by different short-chain n-alkanes, RT-qPCR experiments were carried out using RNAs extracted from BCP1 cells exposed for 4 h to short-chain n-alkanes (C1–C7) and succinate. Before using the RNA preparations for cDNA synthesis, the absence of genomic DNA was evaluated for each sample by performing RT-PCR experiments without the addition of the reverse transcriptase (see Materials and Methods). As shown in Figure 4, the mRNA level of prmA was around 1500- and 50-fold higher when grown on propane and n-butane, respectively, vs. succinate as the sole carbon source. Conversely, the prmA transcriptional level induced by the growth on C1, C2, C5–C7 n-alkanes was not significantly higher than that induced by succinate (<5-fold). The expression levels of smoA in response to the presence of n-alkanes were 20- to 85-fold higher compared to succinate (Figure 4).
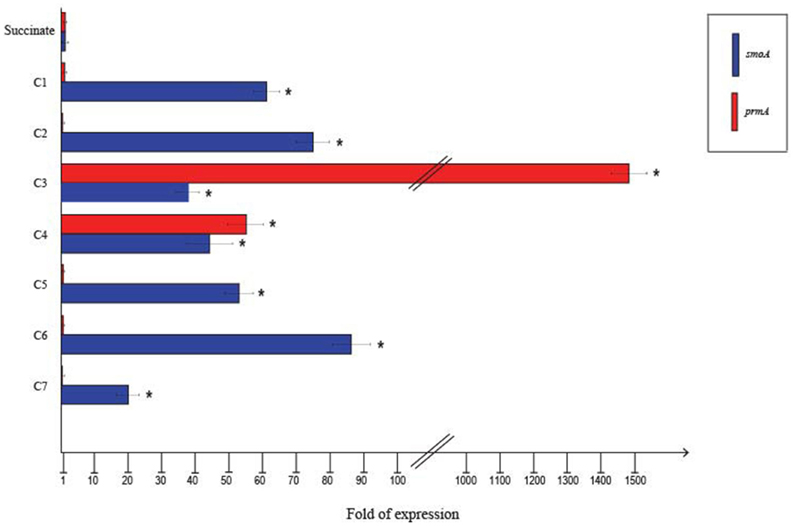
Figure 4. Fold changes in prmA and smoA genes expression induced in R. sp. strain BCP1 cells incubated with C1–C7 n-alkanes assayed by RT-qPCR. Fold increases were calculated relative to the level of BCP1 cells incubated with sodium succinate (control). Asterisks denote that the expression values obtained with short-chain n-alkanes-grown cells are statistically different from those with succinate-grown cells based upon Student's test (P < 0.05). Mean values of three independent experiments with standard deviations are presented.
RT-qPCR experiments were also carried out to evaluate the effect of alternative carbon sources on the expression of prmA and smoA (Figure 5). In the presence of glucose or when grown on LB, the expression level of both the sdimo genes was similar to that observed on succinate. When BCP1 cells were exposed to either propane or n-butane in the presence of a TCA cycle organic acid (succinate), a simple sugar (glucose) or during their growth on complete medium LB, a decrease in the transcriptional induction of both the genes was observed. In particular, when glucose was added in the presence of either propane or n-butane the expression of both prmA and smoA was completely repressed (Figure 5). The growth of BCP1 on LB in the presence of propane or n-butane repressed the smoA expression. Growth on LB with propane or n-butane also reduced the prmA expression by 8- and 2.5-fold as compared to growth on minimal medium supplied with only propane and only n-butane, respectively. The inclusion of succinate completely repressed the prmA expression in the presence of n-butane. In the presence of propane, succinate addition reduced prmA and smoA transcription by 13- and 8-fold, respectively. Therefore, a carbon catabolite repression mechanism affects the expression of the two sdimo genes depending on the type of inducer (propane or n-butane) and alternative carbon source supplied.
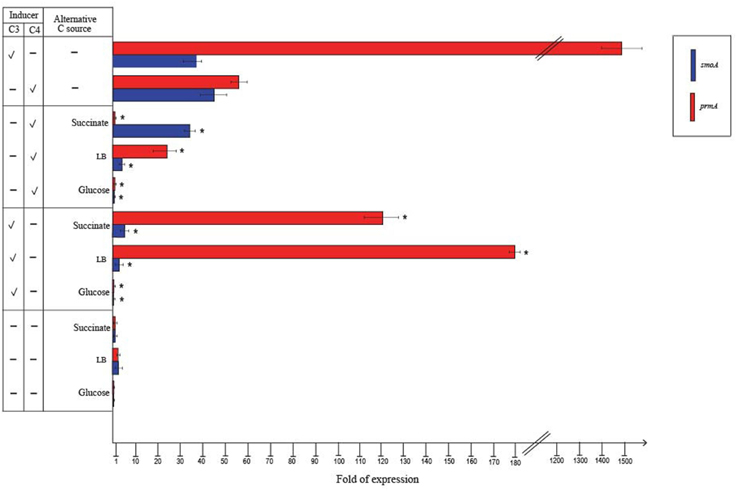
Figure 5. Fold changes in prmA and smoA genes expression induced in R. sp. strain BCP1 cells incubated with propane (C3) or n-butane (C4) (inducers) in the presence of succinate, glucose or LB (alternative carbon source) assayed by RT-qPCR. The symbols stand for: –, absence; V, presence. Fold increases were calculated relative to the level of BCP1 cells incubated with sodium succinate (control). Asterisks denote that the expression values with alternative carbon sources + inducers are statistically different from those with the only inducers based upon Student's t-test (P < 0.05). Mean values of three independent experiments with standard deviations are presented.
Analysis of the Promoters of prmABCD and smoABCD Operons
To define the transcriptional start sites (TSS) of the two sdimo operons, primer extension assays were conducted using BCP1 cells exposed to n-butane and succinate as control (Figure 6). Two different radioactively labeled oligonucleotides annealing at different positions in the 5′ region of each of the two alpha subunit coding genes were used: (A) PEprm7 and PEprm8, which mapped to nucleotides 50 and 24 downstream of the TTG codon of the prmA gene, respectively; (B) PEsmo1 and PEsmo2, which mapped to nucleotides 90 and 75 downstream of the ATG codon of the smoA gene, respectively (Table S1). The TSS determined were a cytosine 55 bp upstream of the prmA initiation codon (Figure 6A) and an adenine 49 bp upstream of the smoA initiation codon (Figure 6B).
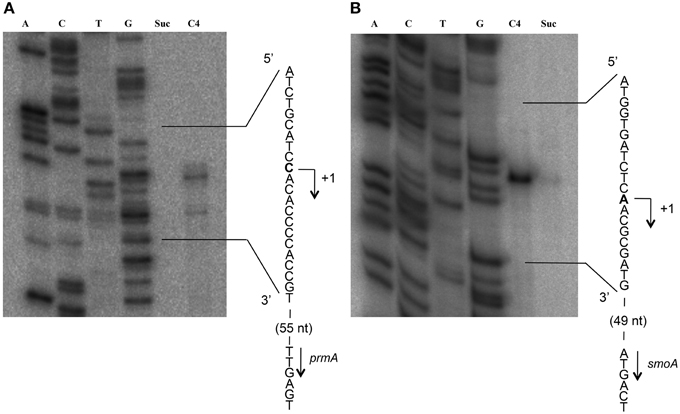
Figure 6. Identification of the transcriptional start sites of prmA (gel A) and smoA (gel B) genes in R. sp. strain BCP1. The polyacrylamide gels show the primer extension products obtained from the total RNA of BCP1 cells exposed to succinate (Suc) or n-butane (C4) using the primer PEprm7 (gel A) or PEsmo1 (gel B). Lanes A, T, C, and G in the two gels show the products of the sequencing reactions using as template the plasmid containing the upstream region of prmA (gel A) or smoA (gel B) (See Material and Methods). The deduced transcriptional start sites for the two genes are shown in bold, and the direction of transcription is indicated by an arrow on each sequence. The distances between each start site and the corresponding start codon are also indicated in parentheses.
Putative −35 and −10 hexamer identification was based on the sequences of other Rhodoccocus promoters (Veselyì et al., 2007; Tomás-Gallardo et al., 2012) and motif features such as the distance between the hexamers and the TSS. The hypothetical −10 (TTGTAT) region is depicted upstream of prmA, separated by 7 bp from the TSS (Figure 7A, Figure S5). Considering the distance of 16–18 bp between the regulatory hexamers, a −35 region (CAGATC) was also proposed for prmA in Figure 7A. In Figure 7B, hypothetical −35 (TAGTCA) and −10 (GATGGT) regions are presented for smoA gene and are separated by 17 bp. Putative CRP (catabolite repression protein) binding sites were also identified in the promoter regions of both the sdimo gene clusters under analysis (Figure 7). The putative CRP binding sites that are immediately upstream of the −35 regions of prmA and those that partially overlap the −10 region and the TSS of smoA are conserved among homologous regions (Figure S5). These results support experimental data on the transcriptional repression of prmA and smoA observed when alternative carbon sources are added along with inducers (propane or n-butane) into growth medium. Additional conserved palindromic sequences were detected covering the putative −35 boxes of both the sdimo genes (Figure 7, Figure S5). Notably, the palindromic sequence upstream of prmA gene shows some similarities with the symmetrical consensus sequence identified by Shao et al. (2008) for being a high affinity binding site for Fis regulators in E. coli (Figure 7C). Regions with peculiar features included in the BCP1 prmA promoter region are two imperfect 13 bp-direct repeat sequences (orange boxes in Figure 7A) and a palindromic sequence overlapping the −10 region (divergently oriented blue arrows in Figure 7A). It is interesting to note that these special regions are not conserved among promoters of prmA homologous genes present in the database (Figure S5).
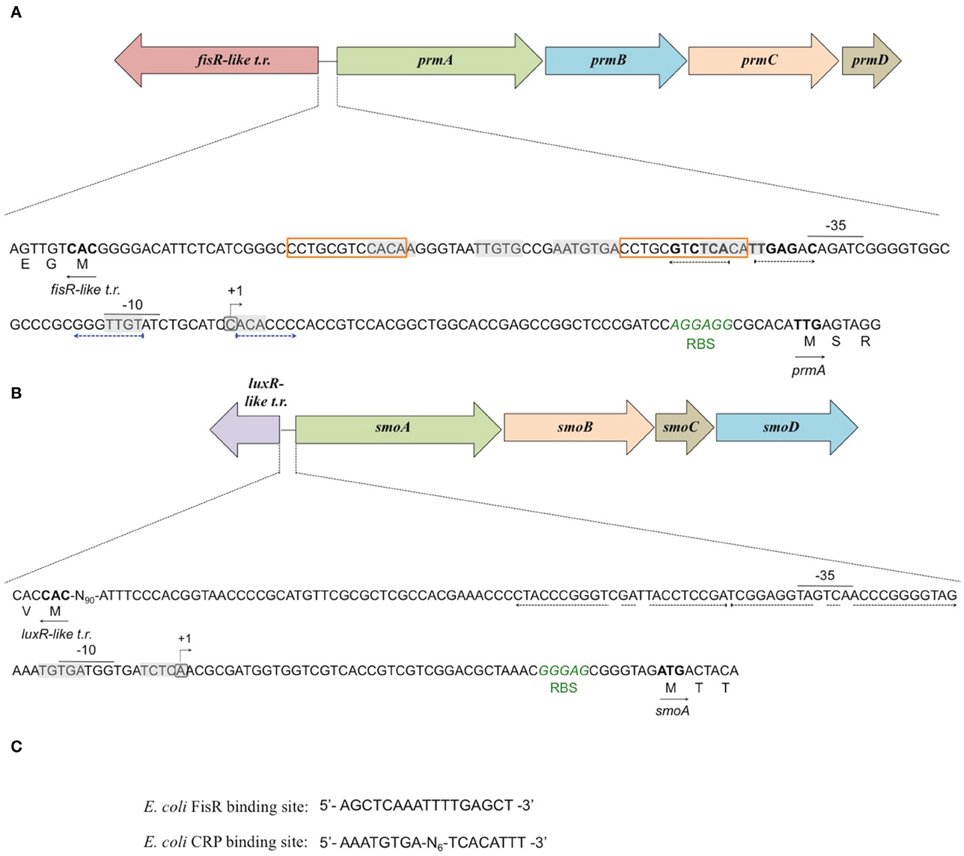
Figure 7. Analysis of the promoters of prmA (A) and smoA (B) genes in R. sp. strain BCP1. The transcriptional start sites detected by primer extension experiments for each sdimo are circled and indicated by a bent arrow. The putative −10 and −35 promoter regions as well as the ribosome-binding sites (RBS) are indicated below each sequence. The direct repeat sequences upstream of prmA gene are indicated in orange boxes (A). The putative CRP (catabolite repression protein) binding sites are shaded in gray. The nucleotides forming the inverted repeats are highlighted with divergently oriented (black or blue) arrows. The nucleotides matching the Fis regulator high affinity binding site described in E. coli (shown in C) are in bold. The translational start codon of each gene is in bold with an arrow underneath indicating the direction of transcription/translation. t.r. stands for transcriptional regulator.(C) shows the DNA sequences binding the Fis regulator and the catabolite repression protein (CRP) in E. coli.
Identification of Short-Chain n-Alkane-Induced Proteins by Two-Dimensional Electrophoretic Analysis
A proteomic approach was used to provide insights into the metabolic pathways of short-chain n-alkane catabolism in Rhodococcus sp. strain BCP1. Soluble protein extracts from cells grown with either n-butane (gaseous alkanes) or n-hexane (short-chain liquid alkane) as carbon source were compared by 2-D gel analysis. Soluble protein extract from cells grown on succinate was used as a reference. Initial data from a 2-D gel using a IPG strip from pH 3 to 10 revealed that most of the cytoplasmic proteins focused in regions corresponding to pH-values below 7 (data not shown). Consequently, IPG strips from pH 4 to 7 were used for further analysis. Representative examples of 2-D gels are shown in Figure 8. The protein patterns produced in n-butane- and n-hexane-grown cells were similar to each other, and less comparable to that obtained with succinate-grown cells.
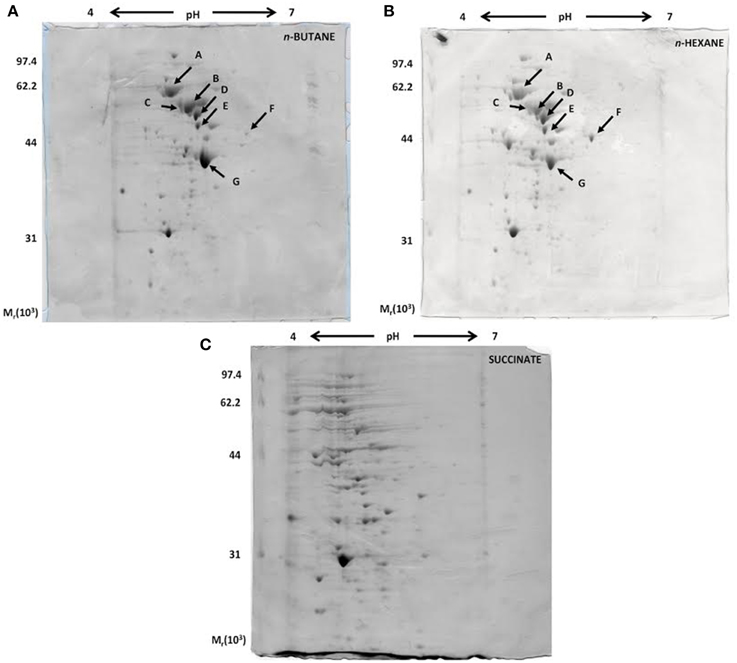
Figure 8. Coomassie blue-stained 2-D SDS-PAGE gels representing the cytoplasmic fractions of R. sp. strain BCP1 cells grown on n-butane (A), n-hexane (B), and succinate (C). The seven protein spots indicated by arrows in (A) and (B), which are missing in (C), were further analyzed.
Our present analysis has focused on the study of seven protein spots (A–G) that were induced by the growth on the two n-alkanes (Figure 8), but not on succinate. LC/MS/MS data collected on the protein content of each of the seven spots under analysis are summarized in Table S2. Interestingly, among the proteins identified, the aldehyde dehydrogenase (DH) KDE09894 and the alcohol DH KDE09895 are coded by consecutive genes located downstream of the smoABCD operon. Other alcohol and aldehyde DHs have been detected that are coded by genes with locations on the genome not related with that of monooxygenase genes described in this paper. The up-regulated proteins are involved in the terminal oxidation pathway of the n-alkanes, as well as in fatty acid metabolism, the glyoxylate bypass and protein folding.
Discussion
In this work, the Rhodococcus sp. strain BCP1 growth on short-chain n-alkanes was investigated through the analysis of the following aspects, namely: (i) the rate of cell growth; (ii) the product(s) of the initial oxidation step(s), (iii) the induction of O2 consumption, (iv) the transcriptional induction of two gene clusters coding for SDIMOs, and, finally, (v) the protein pattern induced by short-chain n-alkanes.
Under the growth conditions examined here, the strain BCP1 has shown generation times ranging from 2.7 to 4.3 h, the fastest growth rates seen on C3–C5 n-alkanes (G of 2.6–2.7 h). BCP1 cells utilize metabolic intermediates of both terminal and sub-terminal oxidation pathways of gaseous n-alkanes, although shorter generation times and higher OD600-values were observed with 1-butanol and 1-propanol compared to 2-butanol and 2-propanol (Table 1). Further, the GC-analysis revealed that 1-butanol was a product of n-butane oxidation and both 1-propanol and 2-propanol were products of propane oxidation. These results suggest the predominance of the terminal oxidation pathway in the gaseous n-alkanes metabolism of BCP1 cells (Figure 9). The capacity of generating both terminal and sub-terminal oxidation products from propane has also been reported in Rhodococcus rhodochrous PNKb1 (Perry, 1980; Woods and Murrell, 1989; Ashraf et al., 1994), while Gordonia sp. strain TY5 was shown to oxidize C3 sub-terminally to yield 2-propanol (Kotani et al., 2003). In M. vaccae JOB5, propane is metabolized via either subterminal or terminal oxidation, while n-butane is metabolized via terminal oxidation only (Phillips and Perry, 1974).
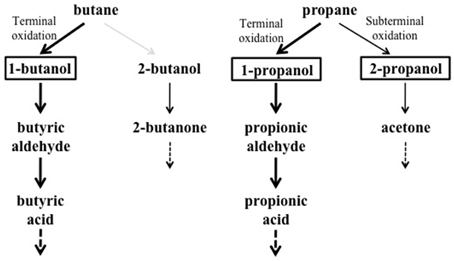
Figure 9. Putative metabolic pathways of gaseousn-alkanes in R. sp. strain BCP1 based on the growth data and oxidation products described in this work. The compounds that can be used as growth substrates by BCP1 are in bold. The detected metabolic intermediates are boxed. Thicker arrows indicate the predominance of the terminal oxidation pathways over the subterminal one suggested by BCP1 growth data (OD600 and generation time). The gray arrow indicates the lack of detection of 2-butanol among the butane oxidation products. The dashed arrows indicate that the intermediates are further metabolized.
Previous studies have shown that different types of Fe-MOs are induced during the growth of BCP1 on gaseous (propane, n-butane) and liquid (n-hexane) short chain n-alkanes (Frascari et al., 2006; Cappelletti et al., 2010, 2011). However, as shown in Table 2, quite similar O2 consumption rates were measured after the addition of either one of the two n-alkanes (n-butane or n-hexane) to n-butane- and n-hexane-grown cells. Apparently, these results indicate that monooxygenases with relaxed substrate specificity are involved in the oxidation of liquid and gaseous short chain n-alkanes.
Here, the expression of two gene clusters (prmABCD and smoABCD) detected in BCP1 genome and coding for two SDIMOs, has been analyzed. These clusters contain four genes each encoding the large and small subunits of the hydroxylase, the reductase and the coupling protein (Figures 1, 2). Interestingly, the organization of the two gene clusters is different and their similarity in terms of nucleotide sequences is low (around 50%). The prmABCD gene cluster has a chromosomal localization while smoABCD is located on pBMC2 endogenous plasmid (Cappelletti et al., 2013). This is in line with other studies reporting that large linear plasmids comprise biodegradative genes involved in catabolic functions such as oxygenases linked to hydrocarbon degradation (Masai et al., 1997; Saeki et al., 1999).
The transcription of BCP1 prmABCD and smoABCD genes is induced by the growth on n-alkanes and they are transcribed as polycistronic units. In particular, the expression of prmA was strongly induced by the growth on propane with a propane/succinate ratio close to the propane/pyruvate ratio described for prmA gene in R. jostii RHA1 (1480 vs. 2450, respectively) (Sharp et al., 2007). Here we show that BCP1 prmA expression is also induced by the growth on n-butane but not by the growth on methane, ethane, n-pentane, n-hexane, n-heptane (Figure 4). On the other hand, BCP1 smo gene cluster transcription was induced by all the n-alkanes under analysis in this study and not by succinate (Figure 4). Surprisingly, the inducing range of smoA comprises C1 that is not utilized by BCP1 for growth (Frascari et al., 2006). The homolog of smoA in Mycobacterium chubuensis NBB4 (Gene ID: Mycch_5395) was reported to be induced during the growth on acetate, ethene, and C2–C4 alkanes although no quantitative information on transcriptional level was provided (Coleman et al., 2011). In Table 3, the ability of BCP1 to grow on gaseous n-alkanes (propane, n-butane) is related to the expression of the two sdimo genes described in this work, while the growth on n-hexane is related to the expression of alkB gene reported in a previous study (Cappelletti et al., 2011).
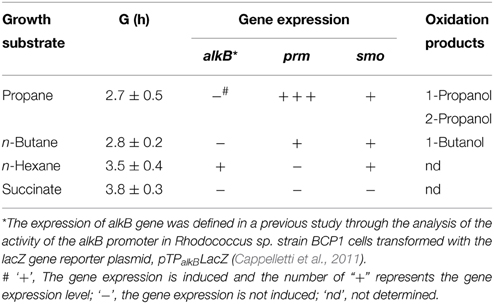
Table 3. Summary of the metabolic and genetic aspects concerning the Rhodococcus sp. strain BCP1 growth on short-chain n-alkanes or succinate.
Sugars and organic acids in a mixture with n-alkanes may result in the inhibition of the n-alkanes catabolism by carbon catabolite repression (Rojo, 2009). This is a regulatory mechanism that usually involves regulation at the level of gene expression to prevent transcription of catabolic genes (Rojo, 2009). Here, we demonstrate that the transcription of both prmA and smoA genes is subject to carbon catabolite repression when alternative substrates are added. In particular, among the tested carbon sources, glucose elicited a complete repression of the transcription of prmA and smoA (Figure 5). The growth on LB significantly repressed the transcription of smoA in the presence of either one of the two inducers (propane or n-butane) (Figure 5). The addition of succinate to the medium repressed the transcriptional induction of prmA by n-butane and partially inhibited the prmA and smoA transcription induced by propane (by 13− and 8-fold, respectively). These results are taken as evidence for the presence in BCP1 of a catabolite repression mechanism regulating the two sdimo genes transcription which depends on the carbon source and type of inducer supplied. On the contrary, the AlkB-like MO coding gene involved in C6–C20 n-alkane oxidation in BCP1 was not subject to catabolite repression by LB, succinate and glucose (Cappelletti et al., 2011). Previous studies on catabolite repression in Rhodococcus spp. mainly focused on the metabolism of aromatic compounds (Veselyì et al., 2007; Tomás-Gallardo et al., 2012; Szőköl et al., 2014). In support of the catabolite repression mechanism identified here in BCP1, the analysis of the promoters of the two gene clusters revealed the presence of conserved sequences that share high similarity with the E. coli CRP binding site (Figure 7). These conserved sequences were maintained among homologous regions in other Actinobacteria (Figure S5). Additional palindromic sequences were detected upstream of the transcriptional start sites of both the sdimo operons (Figures 7A,B). In particular, the palindromic sequence overlapping the −35 region of prmA shares similarities with regions described to bind transcriptional regulators belonging to FisR family (Shao et al., 2008). Notably, a member of this family is coded by a gene located immediately upstream of prm gene clusters.
Oxygen uptake measurements indicated that the growth of BCP1 on 1-butanol or other metabolism intermediates (butyric aldehyde, butyrate) did not stimulate oxygen consumption after the addition of n-butane suggesting their inability to induce the n-butane oxidation pathways (Table 2). Conversely, in Thauera butanovora, 1-butanol and butyric aldehyde were found to be inducers of n-butane oxidation (Sayavedra-Soto et al., 2001, 2005). The induction of O2 consumption by BCP1 n-hexane-grown cells was observed with the addition of the putative n-butane metabolic intermediates (Table 2). This finding suggests that a common enzyme apparatus is involved in the metabolic pathway downstream of the initial oxidation of the two short chain n-alkanes (n-butane and n-hexane). The same indication was provided by the proteomic analysis of the BCP1 soluble fraction. Indeed, the protein patterns induced by growth of BCP1 on n-butane and n-hexane short-chain n-alkanes were similar and distinct from the protein patterns induced by succinate (Figure 8). Among the proteins up-regulated in short-chain n-alkanes (SCnA)-grown cells, we identified three alcohol dehydrogenases (DHs) and three aldehyde DHs, which are likely to be involved in the oxidation steps occurring downstream of the monooxygenase hydroxylation (Table S2). Notably, the genes coding for the alcohol DH KDE09894 and for the aldehyde DH KDE09895 are consecutive and associated with smoABCD gene cluster in the putative endogenous plasmid pBMC2 (Figure 2). The genes encoding the alcohol DH KDE12275 and the aldehyde DH KDE12276 are also consecutive and in the same genomic region which includes the aldehyde DH KDE12286 and genes for fatty acid metabolism. Two chaperonins both belonging to Cpn60 family chaperone GroEL were also identified in SCnA-grown BCP1 cells (Table S2). In previous studies, Cpn10 chaperonins were shown to be induced in ethene- and ethane-grown NBB4 cells while Cpn 60 chaperon was constitutively expressed (Coleman et al., 2006). The involvement of GroEL chaperone proteins in the bacterial metabolism of small n-alkanes has also been reported in strain RHA1 (Sharp et al., 2007) as well as in Thauera butanovora and Methylococcus capsulatus (Csáki et al., 2003; Kurth et al., 2008).
The isocitrate lyase was strongly expressed in SCnA-grown BCP1 cells (Table S2). This is the key enzyme of glyoxylate bypass that short-circuits the citric acid cycle avoiding the CO2-releasing steps and directing acetyl-CoA to conversion to glucose (Cozzone, 1998). The induction of isocitrate lyase in n-butane-grow BCP1 cells is in line with the enzymatic activity required to metabolize the intermediates of n-butane terminal oxidation pathway, which were revealed by growth and GC assays (Table 1, Figure S2) (Vestal and Perry, 1969). The isocytrate lyase was found to be up-regulated in n-hexadecane-grown A. borkumensis cells (Sabirova et al., 2006), but not in M. chubuensis NBB4 grown on C2–C5 n-alkanes and ethene (Coleman et al., 2011).
Further studies will be aimed at defining regulatory proteins and mechanisms leading to the expression of the different MOs involved in n-alkanes oxidation and co-metabolic processes in Rhodococcus sp. strain BCP1. Apparently, the study of alkane MOs diversity and regulation is a priori necessary for the optimization of microbial transformation of hydrocarbons.
Conflict of Interest Statement
The authors declare that the research was conducted in the absence of any commercial or financial relationships that could be construed as a potential conflict of interest.
Acknowledgments
The work was supported by “Vasco e GC Rossi - Microbial Biofilm” grant (2012–2015) and by the University of Bologna (RFO grant). M. C. and A. P. were recipient of a Marco Polo Fellowship (University of Bologna). Work in Prof. Turner's lab was supported by NSERC Discovery grant. M. C. thanks M. L. Workentine and D. Roncarati for helpful discussion and assistance during proteomics and primer extension experiments, respectively. The help of several students, including S. Minguzzi, F. Mezzetti, S. Antonelli, and A. Scalzo is appreciated. The authors are grateful to Siyuan Wang for reading and correcting the English manuscript.
Supplementary Material
The Supplementary Material for this article can be found online at: http://journal.frontiersin.org/article/10.3389/fmicb.2015.00393/abstract
References
Altschul, S. F., Madden, T. L., Schaffer, A. A., Zhang, J., Zhang, Z., Miller, W., et al. (1997). Gapped BLAST and PSI-BLAST: a new generation of protein database search programs. Nucleic Acids Res. 25, 3389–3402. doi: 10.1093/nar/25.17.3389
Arp, D. J. (1999). Butane metabolism by butane-grown ‘Pseudomonas butanovora.’ Microbiology 145, 1173–1180. doi: 10.1099/13500872-145-5-1173
Ashraf, W., Mihdhir, A., and Murrell, J. C. (1994). Bacterial oxidation of propane. FEMS Microbiol. Lett. 122, 1–6. doi: 10.1111/j.1574-6968.1994.tb07134.x
Bjellqvist, B., Hughes, G. J., Pasquali, C., Paquet, N., Ravier, F., Sanchez, J. C., et al. (1993). The focusing positions of polypeptides in immobilized pH gradients can be predicted from their amino acid sequences. Electrophoresis 14, 1023–1031. doi: 10.1002/elps.11501401163
Bradford, M. M. (1976). A rapid and sensitive method for the quantitation of microgram quantities of protein utilizing the principle of protein–dye binding. Anal. Biochem. 72, 248–254. doi: 10.1016/0003-2697(76)90527-3
Cappelletti, M., Di Gennaro, P., D'Ursi, P., Orro, A., Mezzelani, A., Landini, M., et al. (2013). Genome sequence of Rhodococcus sp. strain BCP1, a biodegrader of alkanes and chlorinated compounds. Genome Announc. 9, 75. doi: 10.1128/genomeA.00657-13
Cappelletti, M., Fedi, S., Frascari, D., Ohtake, H., Turner, R. J., and Zannoni, D. (2011). Analyses of both the alkB gene transcriptional start site and alkB promoter-inducing properties of Rhodococcus sp. strain BCP1 grown on n-alkanes. Appl. Environ. Microbiol. 77, 1619–1627. doi: 10.1128/AEM.01987-10
Cappelletti, M., Fedi, S., Honda, K., Ohtake, H., Turner, R. J., and Zannoni, D. (2010). Monooxygenases involved in the n-alkanes metabolism by Rhodococcus sp. BCP1: molecular characterization and expression of alkB gene. J. Biotechnol. 150, 259–259. doi: 10.1016/j.jbiotec.2010.09.150
Cappelletti, M., Frascari, D., Zannoni, D., and Fedi, S. (2012). Microbial degradation of chloroform. Appl. Microbiol. Biotechnol. 96, 1395–1409. doi: 10.1007/s00253-012-4494-1
Chan, L. Y., Chu, K. W., Zou, S. C., Chan, C. Y., Wang, X. M., Barletta, B., et al. (2006). Characteristics of nonmethane hydrocarbons (NMHCs) in industrial, industrial-urban, and industrial-suburban atmospheres of the Pearl River Delta (PRD) region of south China. J. Geophys. Res. 111, D11304. doi: 10.1029/2005JD006481
Ciavarelli, R., Cappelletti, M., Fedi, S., Pinelli, D., and Frascari, D. (2012). Chloroform aerobic cometabolism by butane-growing Rhodococcus aetherovorans BCP1 in continuous-flow biofilm reactors. Bioprocess. Biosyst. Eng. 35, 667–681. doi: 10.1007/s00449-011-0647-3
Coleman, N. V., Bui, N. B., and Holmes, A. J. (2006). Soluble di-iron monooxygenase gene diversity in soils, sediments and ethene enrichments. Environ. Microbiol. 8, 1228–1239. doi: 10.1111/j.1462-2920.2006.01015.x
Coleman, N. V., Yau, S., Wilson, N. L., Nolan, L. M., Migocki, M. D., Ly, M. A., et al. (2011). Untangling the multiple monooxygenases of Mycobacterium chubuense strain NBB4, a versatile hydrocarbon degrader. Environ. Microbiol. Rep. 3, 297–307. doi: 10.1111/j.1758-2229.2010.00225.x
Cooley, R. B., Dubbels, B. L., Sayavedra-Soto, L. A., Bottomley, P. J., and Arp, D. J. (2009). Kinetic characterization of the soluble butane monooxygenase from Thauera butanivorans, formerly ‘Pseudomonas butanovora.’ Microbiology 155, 2086–2096. doi: 10.1099/mic.0.028175-0
Cozzone, A. J. (1998). Regulation of acetate metabolism by protein phosphorylation in enteric bacteria. Annu. Rev. Microbiol. 52, 127–164. doi: 10.1146/annurev.micro.52.1.127
Csáki, R., Bodrossy, L., Klem, J., Murrell, J. C., and Kovács, K. L. (2003). Genes involved in the copper-dependent regulation of soluble methane monooxygenase of Methylococcus capsulatus (Bath): cloning, sequencing and mutational analysis. Microbiology 149, 1785–1795. doi: 10.1099/mic.0.26061-0
Dubbels, B. L., Sayavedra-Soto, L. A., and Arp, D. J. (2007). Butane monooxygenase of ‘Pseudomonas butanovora’: purification and biochemical characterization of a terminal-alkane hydroxylating diiron monooxygenase. Microbiology 153, 1808–1816. doi: 10.1099/mic.0.2006/004960-0
Frascari, D., Pinelli, D., Nocentini, M., Fedi, S., Pii, Y., and Zannoni, D. (2006). Chloroform degradation by butane-grown cells of Rhodococcus aetherovorans BCP1. Appl. Microbiol. Biotechnol. 73, 421–428. doi: 10.1007/s00253-006-0433-3
Frascari, D., Zannoni, A., Fedi, S., Pii, Y., Zannoni, D., Pinelli, D., et al. (2005). Aerobic cometabolism of chloroform by butane-grown microorganisms: long-term monitoring of depletion rates and isolation of a high-performing strain. Biodegradation 16, 147–158. doi: 10.1007/s10532-004-4877-9
Frascari, D., Zannoni, A., Pinelli, D., and Nocentini, M. (2007). Chloroform aerobic cometabolism by butane-utilizing bacteria in bioaugmented and non-bioaugmented soil/groundwater microcosms. Process Biochem. 42, 1218–1228. doi: 10.1016/j.procbio.2007.05.018
Hamamura, N., Storfa, R. T., Semprini, L., and Arp, D. J. (1999). Diversity in butane monooxygenases among butane-grown bacteria. Appl. Environ. Microbiol. 65, 4586–4593.
Kotani, T., Kawashima, Y., Yurimoto, H., Kato, N., and Sakai, Y. (2006). Gene structure and regulation of alkane monooxygenases in propane-utilizing Mycobacterium sp. TY-6 and Pseudonocardia sp. TY-7. J. Biosci. Bioeng. 102, 184–192. doi: 10.1263/jbb.102.184
Kotani, T., Yamamoto, T., Yurimoto, H., Sakia, Y., and Kato, N. (2003). Propane monooxygenase and NAD+-dependent secondary alcohol dehydrogenase in propane metabolism by Gordonia sp. strain TY-5. J. Bacteriol. 185, 7120–7128. doi: 10.1128/JB.185.24.7120-7128.2003
Kulikova, A. K., and Bezborodov, A. M. (2001). Assimilation of propane and characterization of propane monooxygenase from Rhodococcus erythropolis 3/89. Appl. Biochem. Microbiol. 37, 164–167. doi: 10.1023/A:1002827831098
Kurth, E. G., Doughty, D. M., Bottomley, P. J., Arp, D. J., and Sayavedra-Soto, L. A. (2008). Involvement of BmoR and BmoG in n-alkane metabolism in ‘Pseudomonas butanovora.’ Microbiology 154, 139–147. doi: 10.1099/mic.0.2007/012724-0
Lageveen, R. G., Huisman, G. W., Preusting, H., Ketelaar, P., Eggink, G., and Witholt, B. (1988). Formation of polyesters by Pseudomonas oleovorans: effect of substrates on formation and composition of poly-(R)-3-hydroxyalkanoates and poly-(R)-3-hydroxyalkenoates. Appl. Environ. Microbiol. 54, 2924–2932.
Lowry, O. H., Rosebrough, N. J., Farr, A. L., and Randall, R. J. (1951). Protein measurement with the Folin phenol reagent. J. Biol. Chem. 193, 265–275.
Masai, E., Sugiyama, K., Iwashita, N., Shirnizu, S., Hauschild, J. E., Hatta, T., et al. (1997). The bphDEF meta-cleavage pathway genes involved in biphenyl/polychlorinated biphenyl degradation are located on a linear plasmid and separated from the initial bphACB genes in Rhodococcus sp. strain RHA1. Gene 187, 141–149. doi: 10.1016/S0378-1119(96)00748-2
Perry, J. J. (1980). Propane utilization by microorganisms. Adv. Appl. Microbiol. 26, 89–115. doi: 10.1016/S0065-2164(08)70331-9
Phillips, W. E., and Perry, J. J. (1974). Metabolism of n-butane and 2-butanone by Mycobacterium vaccae. J. Bacteriol. 120, 987–989.
Philp, J. C., Kuyukina, M. S., Ivshina, I. B., Dunbar, S. A., Christofi, N., Lang, S., et al. (2002). Alkanotrophic Rhodococcus ruber as a biosurfactant producer. Appl. Microbiol. Biotechnol. 59, 318–324. doi: 10.1007/s00253-002-1018-4
Rojo, F. (2009). Degradation of alkanes by bacteria. Environ. Microbiol. 11, 2477–2490. doi: 10.1111/j.1462-2920.2009.01948.x
Roncarati, D., Danielli, A., Spohn, G., Delany, I., and Scarlato, V. (2007). Transcriptional regulation of stress response and motility functions in Helicobacter pylori is mediated by HspR and HrcA. J. Bacteriol. 189, 7234–7243. doi: 10.1128/JB.00626-07
Sabirova, J. S., Ferrer, M., Regenhardt, D., Timmis, K. N., and Golyshin, P. N. (2006). Proteomic insights into metabolic adaptations in Alcanivorax borkumensis induced by alkane utilization. J. Bacteriol. 188, 3763–3773. doi: 10.1128/JB.00072-06
Saeki, H., Akira, M., Furuhashi, K., Averhoff, B., and Gottschalk, G. (1999). Degradation of trichloroethene by a linear-plasmid-encoded alkene monooxygenase in Rhodococcus corallinus (Nocardia corallina) B-276. Microbiology 145, 1721–1730. doi: 10.1099/13500872-145-7-1721
Salanitro, J. P., and Wegener, W. S. (1971). Growth of Escherichia coli on short-chain fatty acids: nature of the uptake system. J. Bacteriol. 108, 893–901.
Sayavedra-Soto, L. A., Doughty, D. M., Kurth, E. G., Bottomley, P. J., and Arp, D. J. (2005). Product and product-independent induction of butane oxidation in Pseudomonas butanovora. FEMS Microbiol. Lett. 250, 111–116. doi: 10.1016/j.femsle.2005.06.058
Sayavedra-Soto, L., Byrd, C., and Arp, D. (2001). Induction of butane consumption in Pseudomonas butanovora. Arch. Microbiol. 176, 114–120. doi: 10.1007/s002030100304
Shao, Y., Feldman-Cohen, L. S., and Osuna, R. (2008). Biochemical identification of base and phosphate contacts between Fis and a high-affinity DNA binding site. J. Mol. Biol. 380, 327–339. doi: 10.1016/j.jmb.2008.04.075
Sharp, J. O., Sales, C. M., LeBlanc, J. C., Liu, J., Wood, T. K., Eltis, L. D., et al. (2007). An inducible propane monooxygenase is responsible for N-nitrosodimethylamine degradation by Rhodococcus sp. strain RHA1. Appl. Environ. Microbiol. 73, 6930–6938. doi: 10.1128/AEM.01697-07
Shennan, J. L. (2006). Utilisation of C2–C4 gaseous hydrocarbons and isoprene by microorganisms. J. Chem. Technol. Biotechnol. 81, 237–256. doi: 10.1002/jctb.1388
Sluis, M. K., Sayavedra-Soto, L. A., and Arp, D. J. (2002). Molecular analysis of the soluble butane monooxygenase from ‘Pseudomonas butanovora.’ Microbiology 148, 3617–3629.
Szőköl, J., Rucká, L., Šimčíková, M., Halada, P., Nešvera, J., and Pátek, M. (2014). Induction and carbon catabolite repression of phenol degradation genes in Rhodococcus erythropolis and Rhodococcus jostii. Appl. Microbiol. Biotechnol. 98, 8267–8279. doi: 10.1007/s00253-014-5881-6
Tomás-Gallardo, L., Santero, E., and Floriano, B. (2012). Involvement of a putative cyclic AMP receptor protein (CRP)-like binding sequence and a CRP-like protein in glucose-mediated catabolite repression of thn genes in Rhodococcus sp. strain TFB. Appl. Environ. Microbiol. 78, 5460–5462. doi: 10.1128/AEM.00700-12
Tremaroli, V., Fedi, S., Tamburini, S., Viti, C., Tatti, E., Ceri, H., et al. (2011). A histidine-kinase cheA gene of Pseudomonas pseudoalcaligens KF707 not only has a key role in chemotaxis but also affects biofilm formation and cell metabolism. Biofouling 27, 33–46. doi: 10.1080/08927014.2010.537099
van Beilen, J. B., and Funhoff, E. G. (2007). Alkane hydroxylases involved in microbial alkane degradation. Appl. Microbiol. Biotechnol. 74, 13–21. doi: 10.1007/s00253-006-0748-0
Veselyì, M., Knoppová, M., Nesvera, J., and Pátek, M. (2007). Analysis of catRABC operon for catechol degradation from phenol-degrading Rhodococcus erythropolis. Appl. Microbiol. Biotechnol. 76, 159–168. doi: 10.1007/s00253-007-0997-6
Vestal, J. R., and Perry, J. J. (1969). Divergent metabolic pathways for propane and propionate utilization by a soil isolate. J. Bacteriol. 99, 216–221.
Keywords: Rhodococcus sp. strain BCP1, soluble di-iron monooxygenase, propane and n-butane oxidation, gaseous n-alkanes, monooxygenase gene expression
Citation: Cappelletti M, Presentato A, Milazzo G, Turner RJ, Fedi S, Frascari D and Zannoni D (2015) Growth of Rhodococcus sp. strain BCP1 on gaseous n-alkanes: new metabolic insights and transcriptional analysis of two soluble di-iron monooxygenase genes. Front. Microbiol. 6:393. doi: 10.3389/fmicb.2015.00393
Received: 08 January 2015; Accepted: 16 April 2015;
Published: 12 May 2015.
Edited by:
Florin Musat, Helmholtz Centre for Environmental Research – UFZ, GermanyReviewed by:
Jason Warren Cooley, University of Missouri, USAJohann Heider, Philipps-Universität Marburg, Germany
Copyright © 2015 Cappelletti, Presentato, Milazzo, Turner, Fedi, Frascari and Zannoni. This is an open-access article distributed under the terms of the Creative Commons Attribution License (CC BY). The use, distribution or reproduction in other forums is permitted, provided the original author(s) or licensor are credited and that the original publication in this journal is cited, in accordance with accepted academic practice. No use, distribution or reproduction is permitted which does not comply with these terms.
*Correspondence: Martina Cappelletti, Department of Pharmacy and Biotechnology, University of Bologna, Via Irnerio 42, 40126 Bologna, Italy,bWFydGluYS5jYXBwZWxsZXR0aTJAdW5pYm8uaXQ=