 Manli Yang
 Karthika Rajeeve
 Thomas Rudel
 Thomas Dandekar
- 1Department of Bioinformatics, Biocenter, University of Würzburg, Würzburg, Germany
- 2Department of Microbiology, Biocenter, University of Würzburg, Würzburg, Germany
- 3Department of Biomedicine, Aarhus University, Aarhus, Denmark
- 4European Molecular Biology Laboratory, Computational Biology and Structures Program, Heidelberg, Germany
Metabolic adaptation to the host cell is important for obligate intracellular pathogens such as Chlamydia trachomatis (Ct). Here we infer the flux differences for Ct from proteome and qRT-PCR data by comprehensive pathway modeling. We compare the comparatively inert infectious elementary body (EB) and the active replicative reticulate body (RB) systematically using a genome-scale metabolic model with 321 metabolites and 277 reactions. This did yield 84 extreme pathways based on a published proteomics dataset at three different time points of infection. Validation of predictions was done by quantitative RT-PCR of enzyme mRNA expression at three time points. Ct’s major active pathways are glycolysis, gluconeogenesis, glycerol-phospholipid (GPL) biosynthesis (support from host acetyl-CoA) and pentose phosphate pathway (PPP), while its incomplete TCA and fatty acid biosynthesis are less active. The modeled metabolic pathways are much more active in RB than in EB. Our in silico model suggests that EB and RB utilize folate to generate NAD(P)H using independent pathways. The only low metabolic flux inferred for EB involves mainly carbohydrate metabolism. RB utilizes energy -rich compounds to generate ATP in nucleic acid metabolism. Validation data for the modeling include proteomics experiments (model basis) as well as qRT-PCR confirmation of selected metabolic enzyme mRNA expression differences. The metabolic modeling is made fully available here. Its detailed insights and models on Ct metabolic adaptations during infection are a useful modeling basis for future studies.
Introduction
Chlamydia trachomatis (Ct) is one of the medically significant gram-negative species in the genus Chlamydia, an obligate intracellular pathogen in humans (Subtil and Dautry-Varsat, 2004). Ct particularly infects host epithelial cells and causes human diseases worldwide. It causes over 90 million trachoma cases annually by ocular infection and is responsible for 131 million sexually transmitted infection cases (STI) (Senior, 2012). Ct is also reported to contribute to cervical squamous cell carcinoma and co-infection with Neisseria and HIV (Chesson and Pinkerton, 2000; Belland et al., 2003).
Ct is characterized by a biphasic developmental cycle: the elementary bodies (EBs), an infectious form which is metabolically inactive, and reticulate bodies (RBs) which is a non-infectious form that is metabolically active. After internalization into the host cell, EBs differentiate into RBs in an intracellular vacuole called inclusion body. In the inclusion, RBs replicate and subsequently reorganize back to EBs (Abdelrahman and Belland, 2005). The mature EBs are released by host cell lysis, they target new host cells to start a new replicative life cycle.
Ct is well separated from other eubacteria, and its ∼1 Mb genome presents eloquent homology in both gene structure and order compared to other Chlamydia strains that infect human and animal hosts (Stephens et al., 1998; Read et al., 2000; Belland et al., 2003; Subtil and Dautry-Varsat, 2004). The reduced genome of Ct is reflected in several incomplete metabolic pathways. The pathogen encodes complete pathways, such as the glycolysis pentose phosphate pathway (PPP), the fatty acid biosynthesis and the tricarboxylic acid (TCA) cycle (Stephens et al., 1998). However, several pathways are fragmented. The Krebs cycle is incomplete and lacks citrate synthase, aconitase and isocitrate dehydrogenase (Stephens et al., 1998). The genus Chlamydia is auxotroph for nucleotides, in particular as it is not capable to synthesize phosphoribosyl pyrophosphate (PRPP), the gene encoding ribose-phosphate pyrophosphokinase (EC: 2.7.6.1) (Stephens et al., 1998; Xie et al., 2002; Hove-Jensen et al., 2017). In this context, it is puzzling why the genome encodes many enzymes in the purine and pyrimidine metabolic pathways. Chlamydia is also shown to synthesize peptidoglycans (Liechti et al., 2014, 2016) and to generate high-energy intermediates (e.g., ATP) (Subtil and Dautry-Varsat, 2004). For many of the pathways present in Ct, it is unknown whether the enzymes involved are active and the pathways are functional. Moreover, how Ct accesses required nutrients in the intracellular vacuolar inclusion with its limited permeability for small molecules is still the focus of studies (Subtil and Dautry-Varsat, 2004). Although the whole genome of many Ct strains have been sequenced and annotated (Stephens et al., 1998; Harris et al., 2012), little knowledge is available with regard to which metabolic activities of Ct operate in the host cell during infection. Moreover, the lack of effective genetic manipulation tools limits the understanding of chlamydial metabolism (Käding et al., 2014).
Many transcriptomics and proteomics studies have focused on the metabolic properties of Ct developmental forms during its biphasic life cycle. Transcriptional profiling of Ct was performed (Belland et al., 2003; Albrecht et al., 2010). Later, Omsland et al. (2012) used an axenic medium to detect transcriptional activity in Ct, but the transcriptome data of RB are not simple to interpret, as Ct is alive in the medium but is not as fully metabolically active as in the host cell. Quantitative proteome profiling was successfully performed (Saka et al., 2011; Skipp et al., 2016) but without time courses. Later Østergaard et al. (2016) reported protein profiling with time courses. A study about the biphasic metabolism of environmental chlamydia on Protochlamydia amoebophila was reported by RNA sequencing (Konig et al., 2017). In these studies, EB and RB separation is based on centrifugation. The analysis of essential metabolic pathways has not been achieved and we are still relying on the expression data of Ct genes or gene clusters.
To understand the biphasic metabolism of Ct during infection, we used genome-scale metabolic modeling with metabolic flux analysis (MFA) to study the metabolic difference between EBs and RBs during different infection stages. Extreme pathway modeling is one approach in MFA, which is based on constraints and tolerance to input data. Extreme pathway modeling is often used in microbial engineering and host-pathogen interaction to study metabolic flux changes under different conditions. In this study, we provide the first Ct metabolic model based on detailed reannotation using the protein profiling data with time courses from Østergaard et al. (2016). Using proteomics data as constraints, we furthermore analyzed the implied pathway fluxes according to the reconstructed model. The quantitative genome-scale metabolic modeling and MFA reveal metabolic differences of pathways between EB and RB during infection and provide a first complete overview on the metabolic flux changes of Ct during infection.
Materials and Methods
Genome-Scale Metabolic Network Model (GEM) Reconstruction
A genome-scale metabolic network reconstruction was based on available genome information of the model strain Chlamydia trachomatis D/UW-3/CX (accession: NC_000117) (Stephens et al., 1998), according to the metabolic databases KEGG (Kanehisa and Goto, 2000) and BRENDA (Schomburg et al., 2002), NCBI and all available literature. Additional missing enzyme activities for key pathways in addition to the genome annotation were determined by analysis of these data and experimental data (Østergaard et al., 2016). Gap filling for pathways in our model where an enzyme should be present to allow metabolic conversion was based on biochemical knowledge of complete metabolic pathways as well as data from biochemical databases and literature. If there was no data support for Ct of such a metabolic activity, the metabolic gap was not filled. Given the set of involved enzymes, all established and implied metabolites were classified into external metabolites (available metabolic sources and sinks for Ct during infection) and internal metabolites processed by the enzyme network. Our model provides both the KEGG reaction number and EC number as available, and these are provided in SBML format.
Metabolic Flux Modeling and Flux Analysis
Extreme pathways (numbering indicated by a “P” for pathways – they are inferred, no metabolomics or metabolite data) were calculated by YANA square (Pfeiffer et al., 1999; von Kamp and Schuster, 2006; Schwarz et al., 2007) and with the internal convex basis algorithm (Kaleta et al., 2006). The metabolic reactions are prepared in a stoichiometric matrix (S) with the size of m * n (S = m * n). The rows and columns of the matrix correspond to internal metabolites in the model (m) and involved reactions or enzymes (n), respectively. For each column, the entries describe a stoichiometric correlation with involved metabolites. All possible phenotypes are involved in the non-negative linear combinations of the stoichiometric matrix. The solution of the model was based on the steady state of the network, which is described by the equation: S * v = 0. The solution of this equation describes the complete set of different flux modes satisfying the equation. Each flux mode balances all internal metabolites which are involved in this specific flux mode.
After the steady state was calculated, we estimated enzyme activities from the proteomics data and calculated the optimal pathway fluxes in a dynamic state according to the different metabolic phenotypes at different time points of chlamydial infection. The original data we used were measured in Østergaard et al. (2016). In particular, the Supplementary File S1 file of this publication lists all the chlamydial proteins these authors measured and their identification. Their proteomics raw data from mass spectrometry are available at the ProteomeXchange Consortium1, data-set PXD003883.
Flux analysis is a mathematical modeling method to quantitatively simulate the flow of metabolites through the metabolic network. It is widely used in genome-scale metabolic network reconstruction (Orth et al., 2010). Metabolic reconstruction denotes here the process of setting up a metabolic model from scratch by starting from genome annotation and biochemical data to build-up (“reconstruct”) a first complete list of all metabolic enzymes, metabolites, and reactions occurring in the organism.
Based on flux constraints, the stoichiometric approach limits the solution space for the system by enumerating all available limiting pathways (called extreme pathways). Their linear combination predicts all available metabolic network states for a given set of enzymes. With experimental data (Østergaard et al., 2016), an optimized solution can be found by calculating the actual flux strengths of the involved pathways by observing that the error to the estimated enzyme activities is minimized.
These optimal pathway fluxes were calculated by using least square fitting. Our focus was the metabolic difference between EB and RB. Least square fitting by the gradient descent method was generated by YANA square to calculate the best-matched pathway fluxes, including identification of enzymes not presented in proteomic data. Extreme pathways shown are stable, balanced, limiting flux modes of the metabolic system. They represent all adaptation and metabolic pathway capabilities the Chlamydia have, even if the Ct textbook pathways are partially incomplete (e.g., TCA). Any metabolic state of the metabolic network in Ct is a linear combination of these pure pathways balancing all involved internal metabolites. These pathways are solution space limiting and hence called “extreme” pathways (or P for short). On the other hand, these calculated extreme pathways often cover only part of a textbook pathway, in the results section we refer to this situation as “contributing to a textbook pathway,” when only a subset of all enzymes used in the textbook pathway are involved in this extreme pathway. Moreover, the P numbers given in the following always refer to calculated pathways and not to any directly measured metabolites. There is no direct metabolomics data-set available or given in this study. Instead, using the proteome data as basis and qRT-PCR data for validation, we calculate fluxes according to the extreme pathway system. As these are many flux modes and as these extreme pathways are only contributing to textbook pathways but are not identical to them, it is necessary to number them.
Cell Culture and Chlamydia Infection
Human epithelial cells, HeLa229 (ATCC® CCL2.1TM) and human endothelial cells, HUVEC cells (ATCC® CRL-1730TM) were used for propagating bacteria and for basic experiments. HeLa229 cells were grown in RPMI1640 + GlutaMAXTM (GibcoTM 72400-054) with 10% heat inactivated FCS (Sigma-Aldrich F7524). HUVECs were grown in M200 media with growth supplements LSGS (Invitrogen). Chlamydia trachomatis (serovar L2/434/Bu) was used in the study. Chlamydia was prepared as previously published (Karunakaran et al., 2015). Briefly, Chlamydia were grown in HeLa229 cells at a MOI (multiplicity of infection) of 1 for 48 h. The cells were lysed using glass beads (15 mm) for 3 min and centrifuged at 2000 g for 10 min to remove the cell debris. The supernatant -containing bacteria was collected and centrifuged at 24,000 g for 30 min at 4°C. The pellet was washed and resuspended in SPG buffer [10 mM sodium phosphate (8 mM Na2HPO4-2 mM NaH2PO4), 220 mM sucrose, 0.50 mM L-glutamic acid], aliquoted and stored in −80°C. Chlamydia EBs and cell lines used in the study were verified to be free of Mycoplasma contamination via PCR. The bacteria were titrated to have a MOI of 1 and were used further in the experiments.
Quantitative Real-Time PCR
RNA was isolated from uninfected and Chlamydia infected HeLa229 cells and HUVEC cells using a RNA easy kit (Qiagen, Germany). RNA was reverse transcribed using a Revert Aid First Strand synthesis Kit (Fermentas) according to the manufacturer’s instructions and diluted 1:10 with RNase free water. qRT-PCR was performed as previously described (Karunakaran et al., 2015). Briefly, qRT-PCR reactions were prepared with Quanta SYBR (Quanta Bio) and PCR was performed on a Step One Plus device (Applied Biosystems). Data were analyzed using ΔCt method, Step One Plus software package (Applied Biosystems) and Excel (Microsoft). The endogenous control was Ct16SrRNA. Primers were designed by qPrimer Depot. The primers are listed in Table 1.
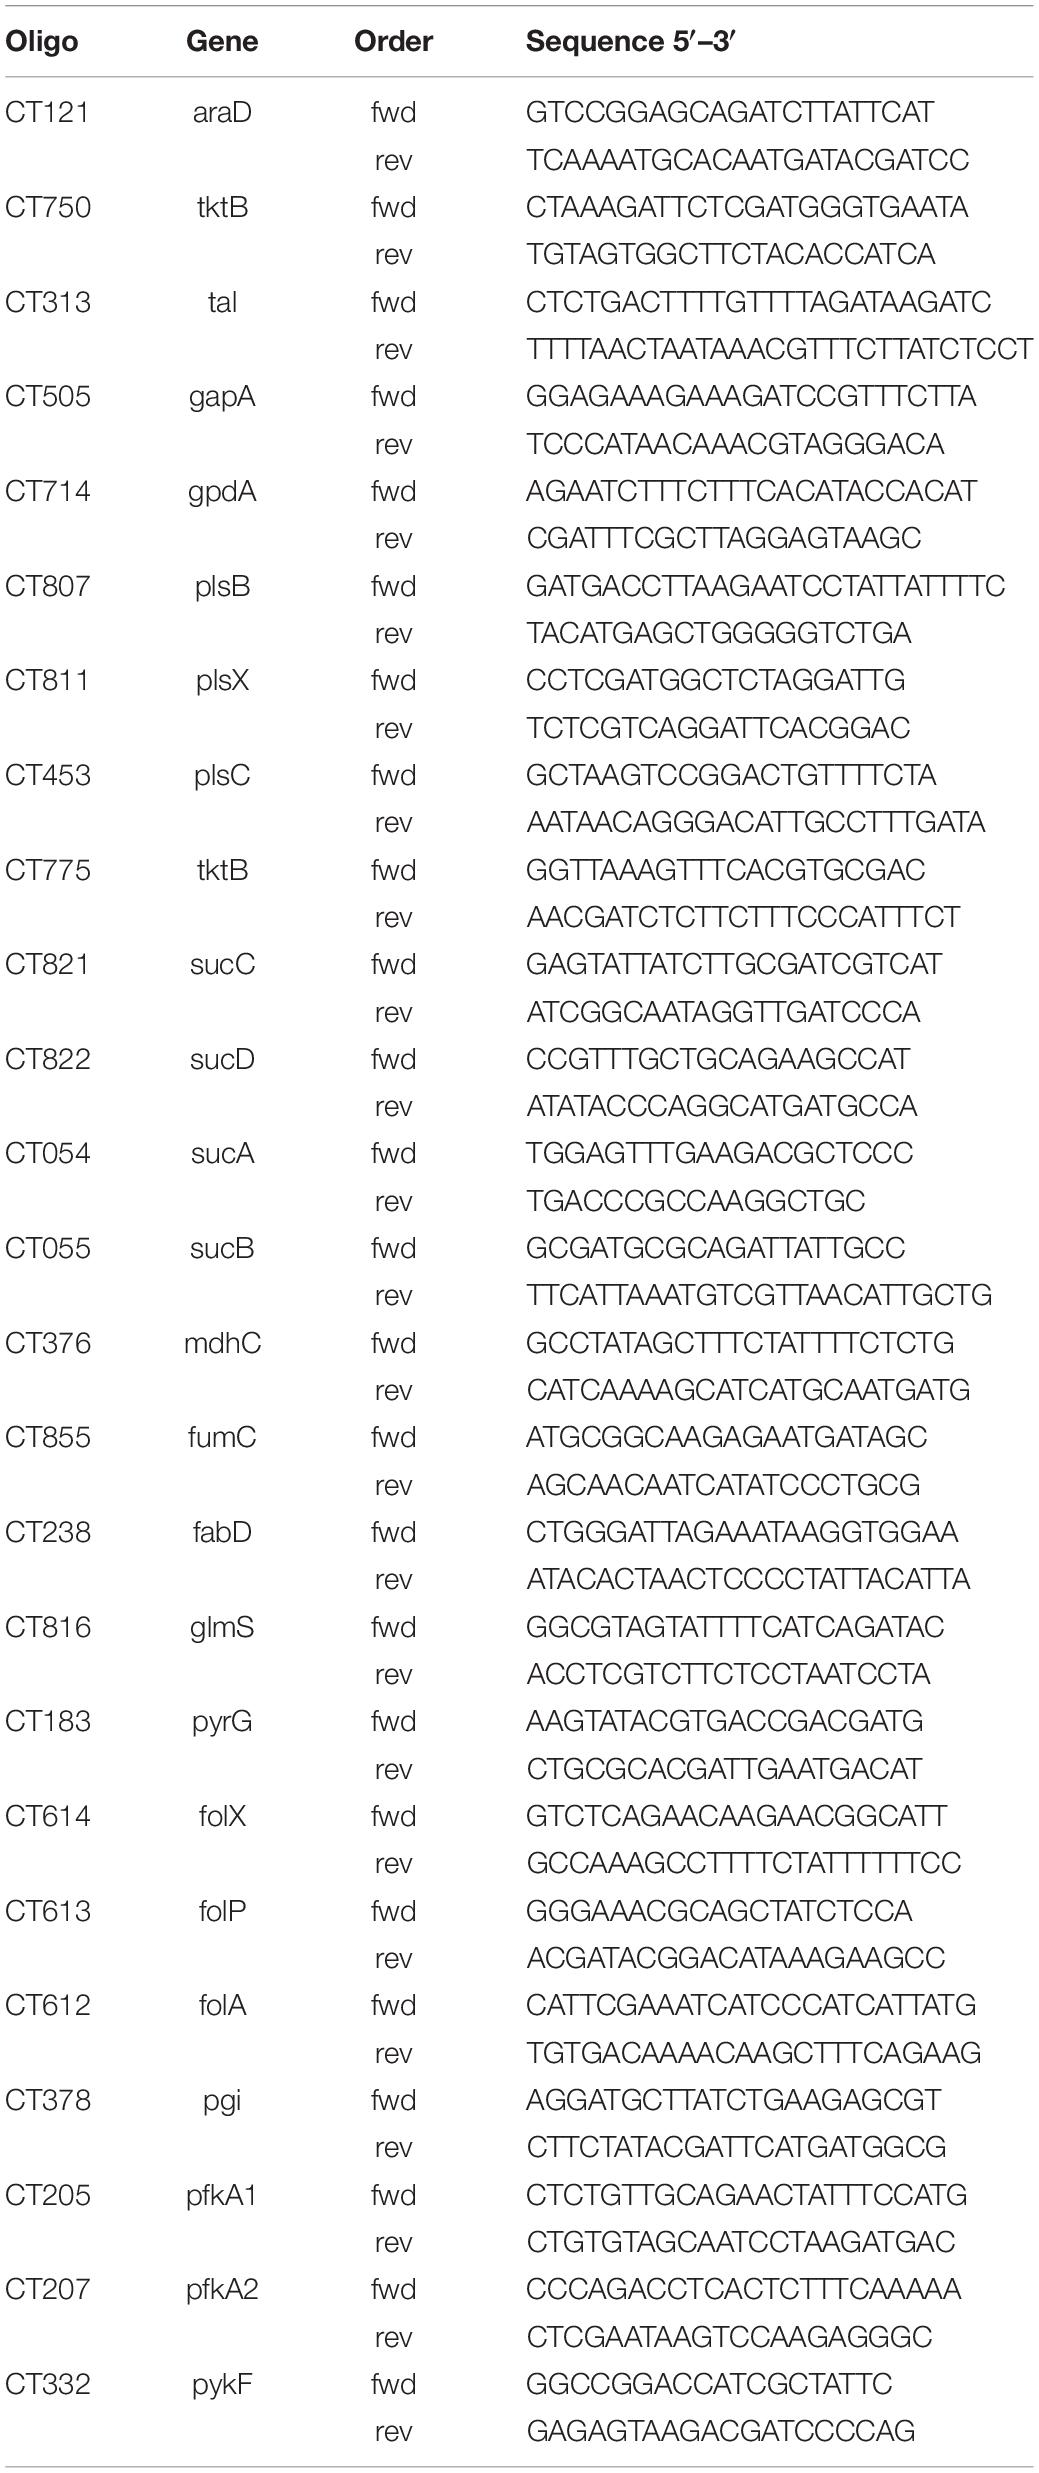
Table 1. Primers used for the PCR analysis.
Results
Reconstruction of the Genome-Scale Metabolic Model of Chlamydia trachomatis D/UW-3/CX
We initially established a genome-scale model of C. trachomatis based on genome annotation, biochemical databases (KEGG), and manual curation. It contains 321 unique metabolites and 277 chemical reactions. Theoretically, there could be more metabolites and more reactions: This depends on the number of enzymes identified from all available sources for this organism (here: Ct) and the known compounds these enzymes involve. However, we focus here on the primary metabolism and consider only those reactions relevant to the primary metabolism. Nevertheless, an extensive check of all available data is necessary for an accurate estimate (this process is called “metabolic reconstruction”):
We started with the well-annotated genome sequence of Chlamydia trachomatis D/UW-3/CX (accession: NC_000117) and compared the model to the available proteomics dataset for the curation of the annotation. The curation involved monitoring of any obvious pathway gaps and re-examining the function of the involved enzymes (full annotation given in Supplementary File S1). Transferases and oxidoreductases together constitute 64% in the metabolic network, with 72 and 37 enzymes respectively. Isomerases and ligases are less present (12 for each of them; Figure 1). Central subsystems in the primary metabolism of Ct include the metabolism of carbohydrates, energy, nucleotides, amino acids, lipids, glycans, cofactors, and vitamins. In order to maintain the accuracy of the model, some gaps were filled manually and poorly validated reactions (according to all available data; see Materials and Methods) were removed. The result is a first genome-scale metabolic model of the central and primary metabolism of Ct. The model is described in SBML (Level 2) format (Supplementary File S2), a simplified overview is visualized in Figure 2 and summary features are provided in Table 2.
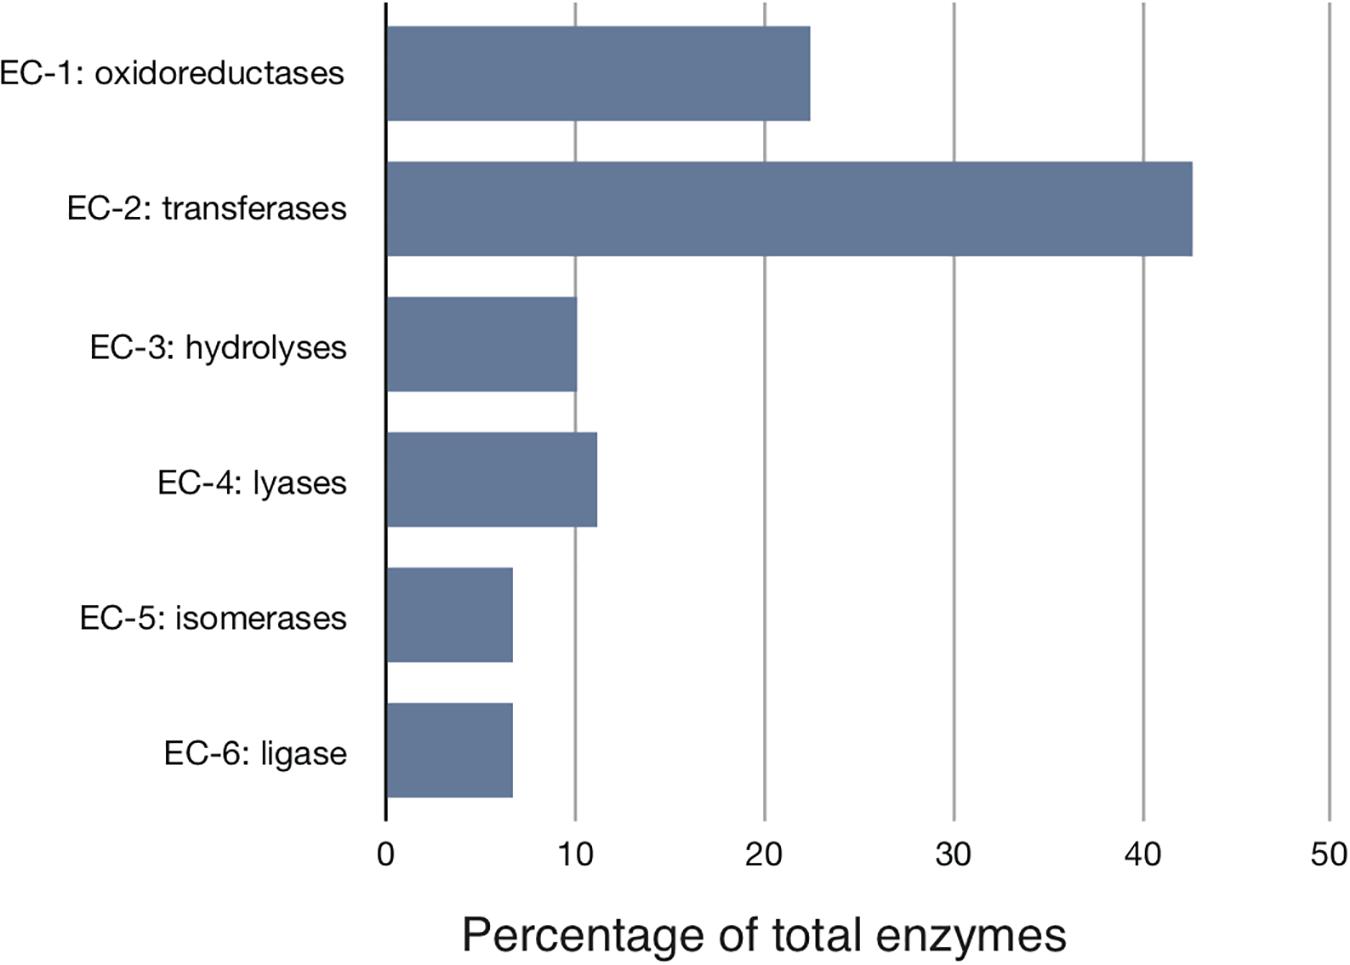
Figure 1. Distribution of the major enzyme classes in Chlamydial metabolism. Enzymes involved in the reconstructed model are classified according to the Enzyme Commission (EC) classification. Shown is the percentage of enzymes in each EC class. Transferases represent over 40% of all activities. Ct modifies host building blocks for incorporation into its own metabolism.
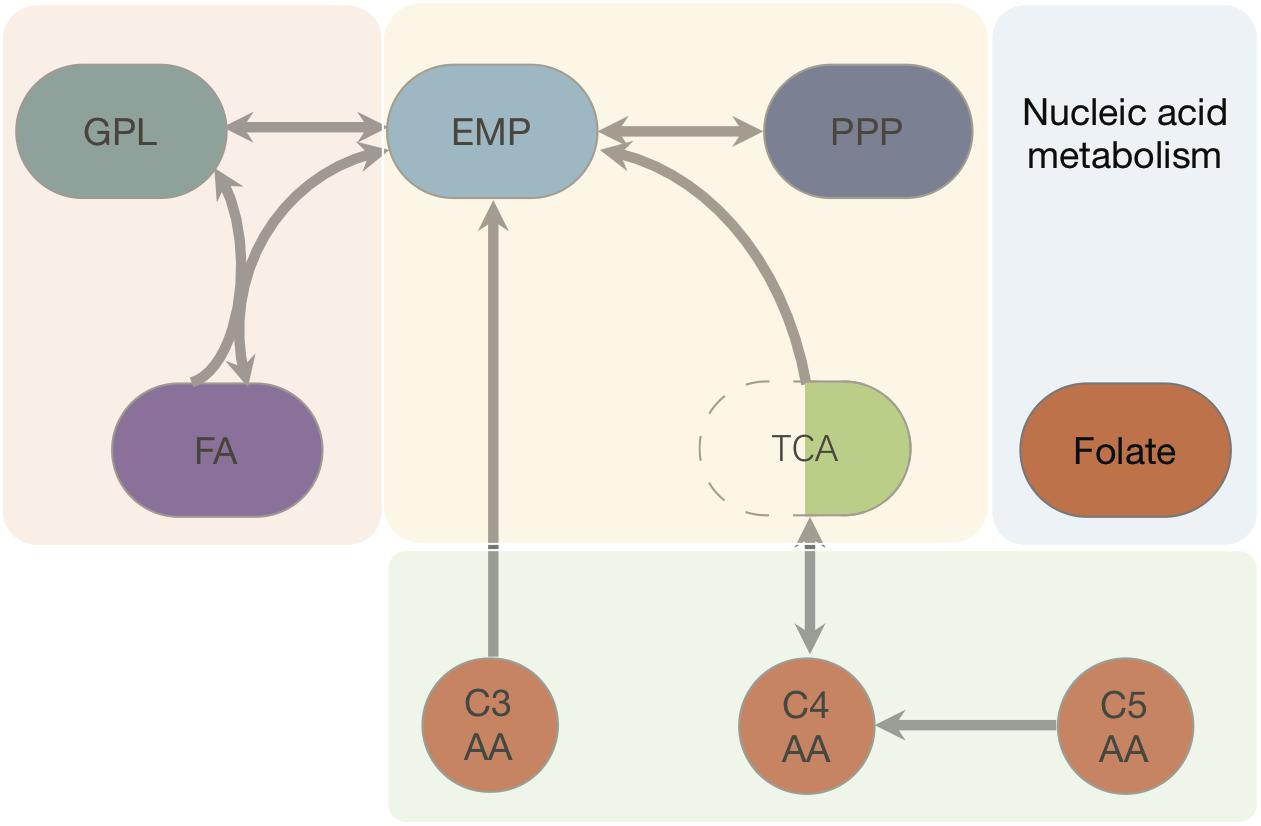
Figure 2. Pathways and fluxes in Ct. Sink and source metabolites are shown, the different pathways present in Ct are given as complete and incomplete lines. Approximate flux strength are indicated. The pathway with the strongest flux is shown as blue thick line (path from pyruvate → acetyl–CoA → malonyl–CoA = malonyl–ACP). A detailed vector graphic is given in supplement, showing all internal and external metabolites and flux strengths quantitatively.
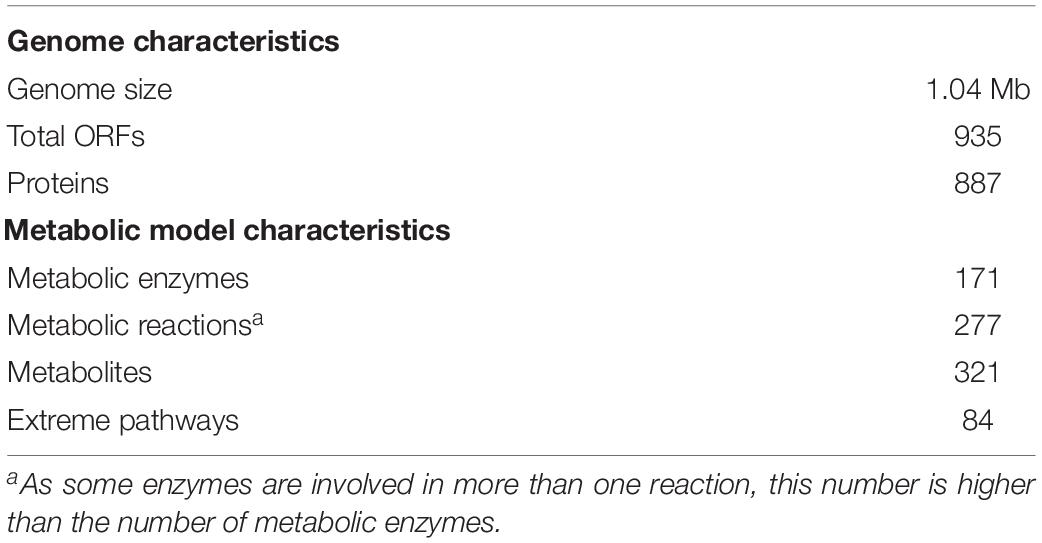
Table 2. Features of Ct genome and metabolic network model.
Metabolic Fluxes in Chlamydia Based on Extreme Pathways
The model with full annotation was next transformed into a stoichiometric matrix considering all enzymes and their reversibility while differentiating between internal metabolites and metabolic sources and drains (external metabolites). This matrix (Supplementary File S3) was next used to calculate extreme pathways using flux balance analysis using a proteome dataset as basis. 84 extreme pathways (Supplementary File S4) were calculated based on this stochiometric matrix input. From the dataset relative flux strengths for each of these pathways were calculated (Supplementary File S5) according to Kaleta et al. (2006), using the proteomics data by Østergaard et al. (2016) as an estimate for each enzyme activity (see section Materials and Methods). Supplementary File S6 visualizes the resulting quantitative fluxes as calculated (Supplementary File S5). The pathway with the strongest flux strength in the whole system starts from pyruvate (the blue line visualizes this strongest flux in Supplementary File S6). This is turned into acetyl-CoA, then into malonyl-CoA, and ends with malonyl-ACP. Three points of time were then chosen during the infection, which were 20 h post infection (hpi), 40 hpi and the lysis phase, respectively. The experimental dataset input for flux analysis was from the reported proteomics dataset (Østergaard et al., 2016). For each data group, there were given data of normalized iBAQ values on the protein abundance of EB and RB after their separation by centrifugation. As the ratio between EB and RB in the original experiment was not provided as data, we combined EB and RB’s protein normalized iBAQ data, as these were quantitative measurements (Østergaard et al., 2016).
Considering the EB + RB data together at each time point allows us to describe the general features of the Ct at that time. Roughly at 8 hpi, the EBs start to transform to RB. At 20 hpi, RBs dominate compared to EBs. During the time from 36 hpi to 40 hpi, the RB form of Ct converts back to EB. Hence, at this stage, the number of RB is supposed to decrease and the number of EB’s to increase. The comparison of the quantitative fluxes of EB, RB, and EB + RB at three different time points is a very dense, data-rich figure.
It is hence shown in detail only as Supplementary File S7 (y-axis: results of the nine different flux calculations as a heat map indicating flux strength (vertical bar on top shows intensities; x-axis gives all 84 extreme pathways calculated with their P numbers; Supplementary File S5 lists all the enzyme reactions involved in each extreme pathway according to the same numbering; fluxes are visualized in Supplementary File S6). In the following we summarize the main results of these calculations:
The extreme pathways calculated are all stable, balanced limiting flux modes of the metabolic system (see section Materials and Methods). They reveal which adaptation and metabolic pathway capabilities Chlamydia have, even if textbook pathways are partly incomplete (e.g., TCA). Any metabolic state of this network is a linear combination of these pure (solution space limiting and hence called “extreme”) pathways (see P numbers). On the other hand, these calculated pathways frequently cover only part of a textbook pathway, they only contribute to it (see above). From the modeling, we can infer that there are a few central pathways which carry most of the metabolic flux during infection, such as the strongest flux path from pyruvate to malonyl-ACP (pathway number P65), followed by the downstream part of glycolysis (pathways number P5, P34, P83), upstream part of fatty acid biosynthesis (extreme pathways number P66 and P67), and a calculated flux pathway involved in biotin metabolism (P65). Cysteine biosynthesis also presents a strong flux as calculated from the proteome data (P16). Many reactions in nucleotide metabolism present strong intensities (extreme pathways P8-P15, P31, P32, P40-45). Only medium activity was inferred from the proteome data for glycolysis and glycerophospholipid pathway (P34, P83), PPP (P84), and folate biosynthesis or conversion (P33, P51, P55). Always only very low activity was inferred for fatty acid biosynthesis (P66, P67), phenylalanine and tyrosine biosynthesis (P53, P54), and porphyrin and chlorophyll metabolism (P29).
So, based on the proteome data by Østergaard et al. (2016), the relative flux strengths were calculated. The results apply to the relative pathways within one cell, be it EB or RB. If we instead want to compare EB versus RB, we need experimental approaches, such as strong separation between EB and RB (see section Discussion). The proteome data by Østergaard et al. (2016) give a differential picture on the involved enzymes and their activity. The authors found activity of RB > EB for 90 proteins and RB < EB for 51 proteins. However, protein abundance is only an indirect measurement of enzyme activity. As there also may be technical separation problems, we considered and always give in addition the total proteome data available (EB + RB).
Central Metabolic Pathways
The central metabolic pathways present in Ct are summarized in Table 3. They are all present in Ct and represented in the metabolic model with their respective fluxes. Pathways involve the PPP, the glycolysis Emden-Meyerhof-Parnass pathway; EMP) and glycerol-phospholipid (GPL) pathway as well as fatty acid (FA) biosynthesis. Moreover, there is the citric acid or tricarboxylic acid (TCA) cycle and a cycle formed by two phosphofructokinases (pfkA_1 and pfkA_2).
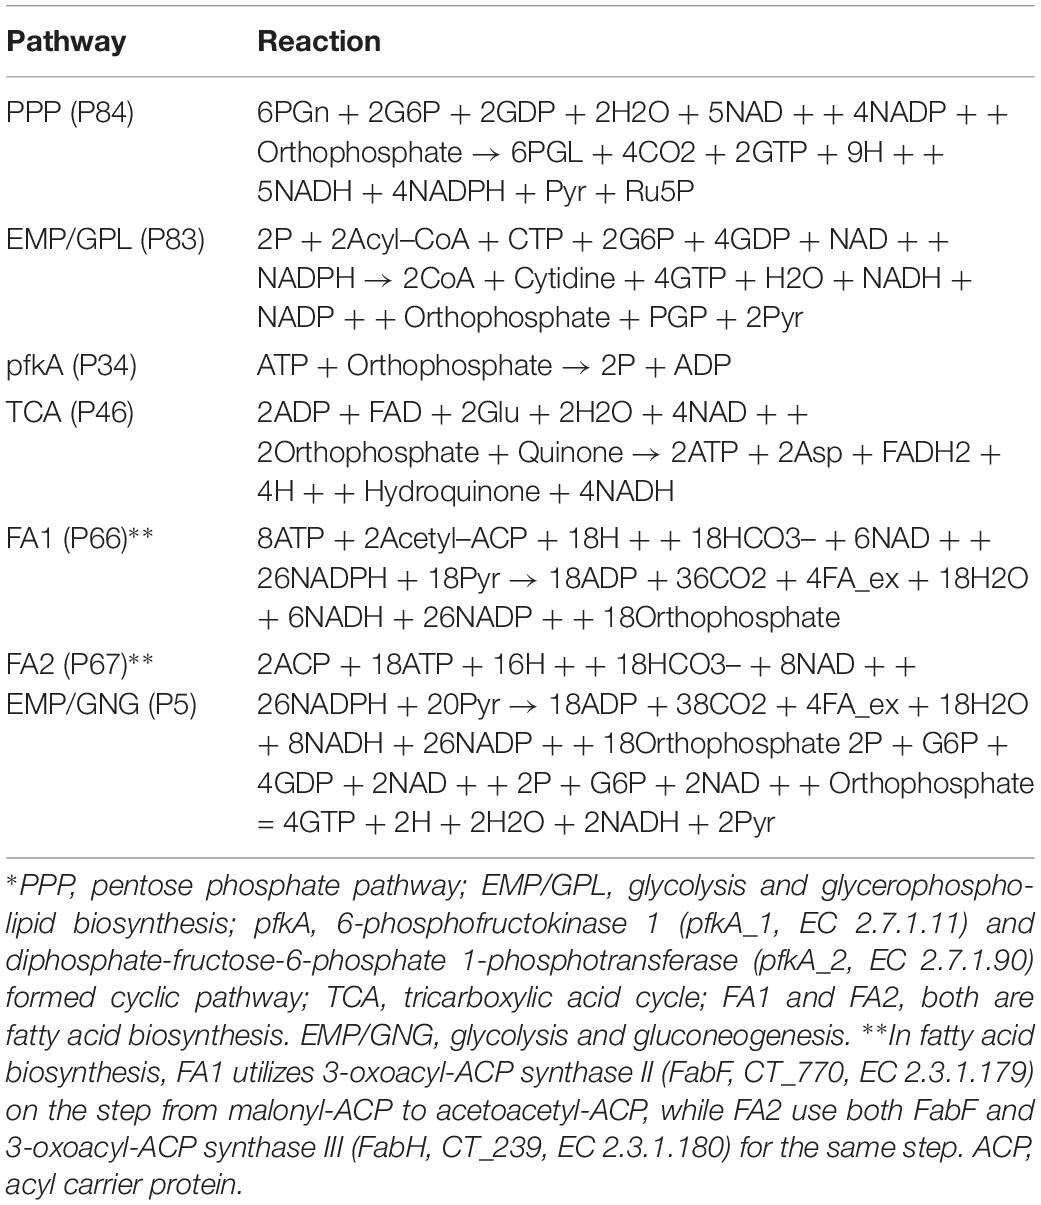
Table 3. Extreme pathways in central metabolism∗.
Figure 3 shows the pathway strength of the central metabolism of Ct during infection. Central carbohydrate pathways, such as PPP, EMP/GPL, and pfkA presented higher intensities in both EB and RB when compared to the flux carried by TCA and FA. EB shows carbohydrate pathway activity, in particular regarding PPP, EMP/GPL, and to a lesser extent even TCA. As far as can be inferred from the data provided by Østergaard et al. (2016), in RB the pathway activity distribution shifts toward EMP/GPL. The EMP/GPL pathway was much more active than the average central metabolism with an average intensity of 0.40 in EB and 0.16 in RB (Supplementary File S5). This means, in RB the flux of glycolysis is on and flows also into the GPL synthesis, which is helpful for replication. In contrast, in EB we have low metabolic activity but still some active metabolism (Grieshaber et al., 2018). Bearing this in mind, in this residual metabolism there is a sizeable fraction used for glycolysis and then channeled into GPL synthesis according to our data. This suggestion from the metabolic modeling was subsequently supported by individual measurements of the enzyme transcripts (see RT-PCR data below).
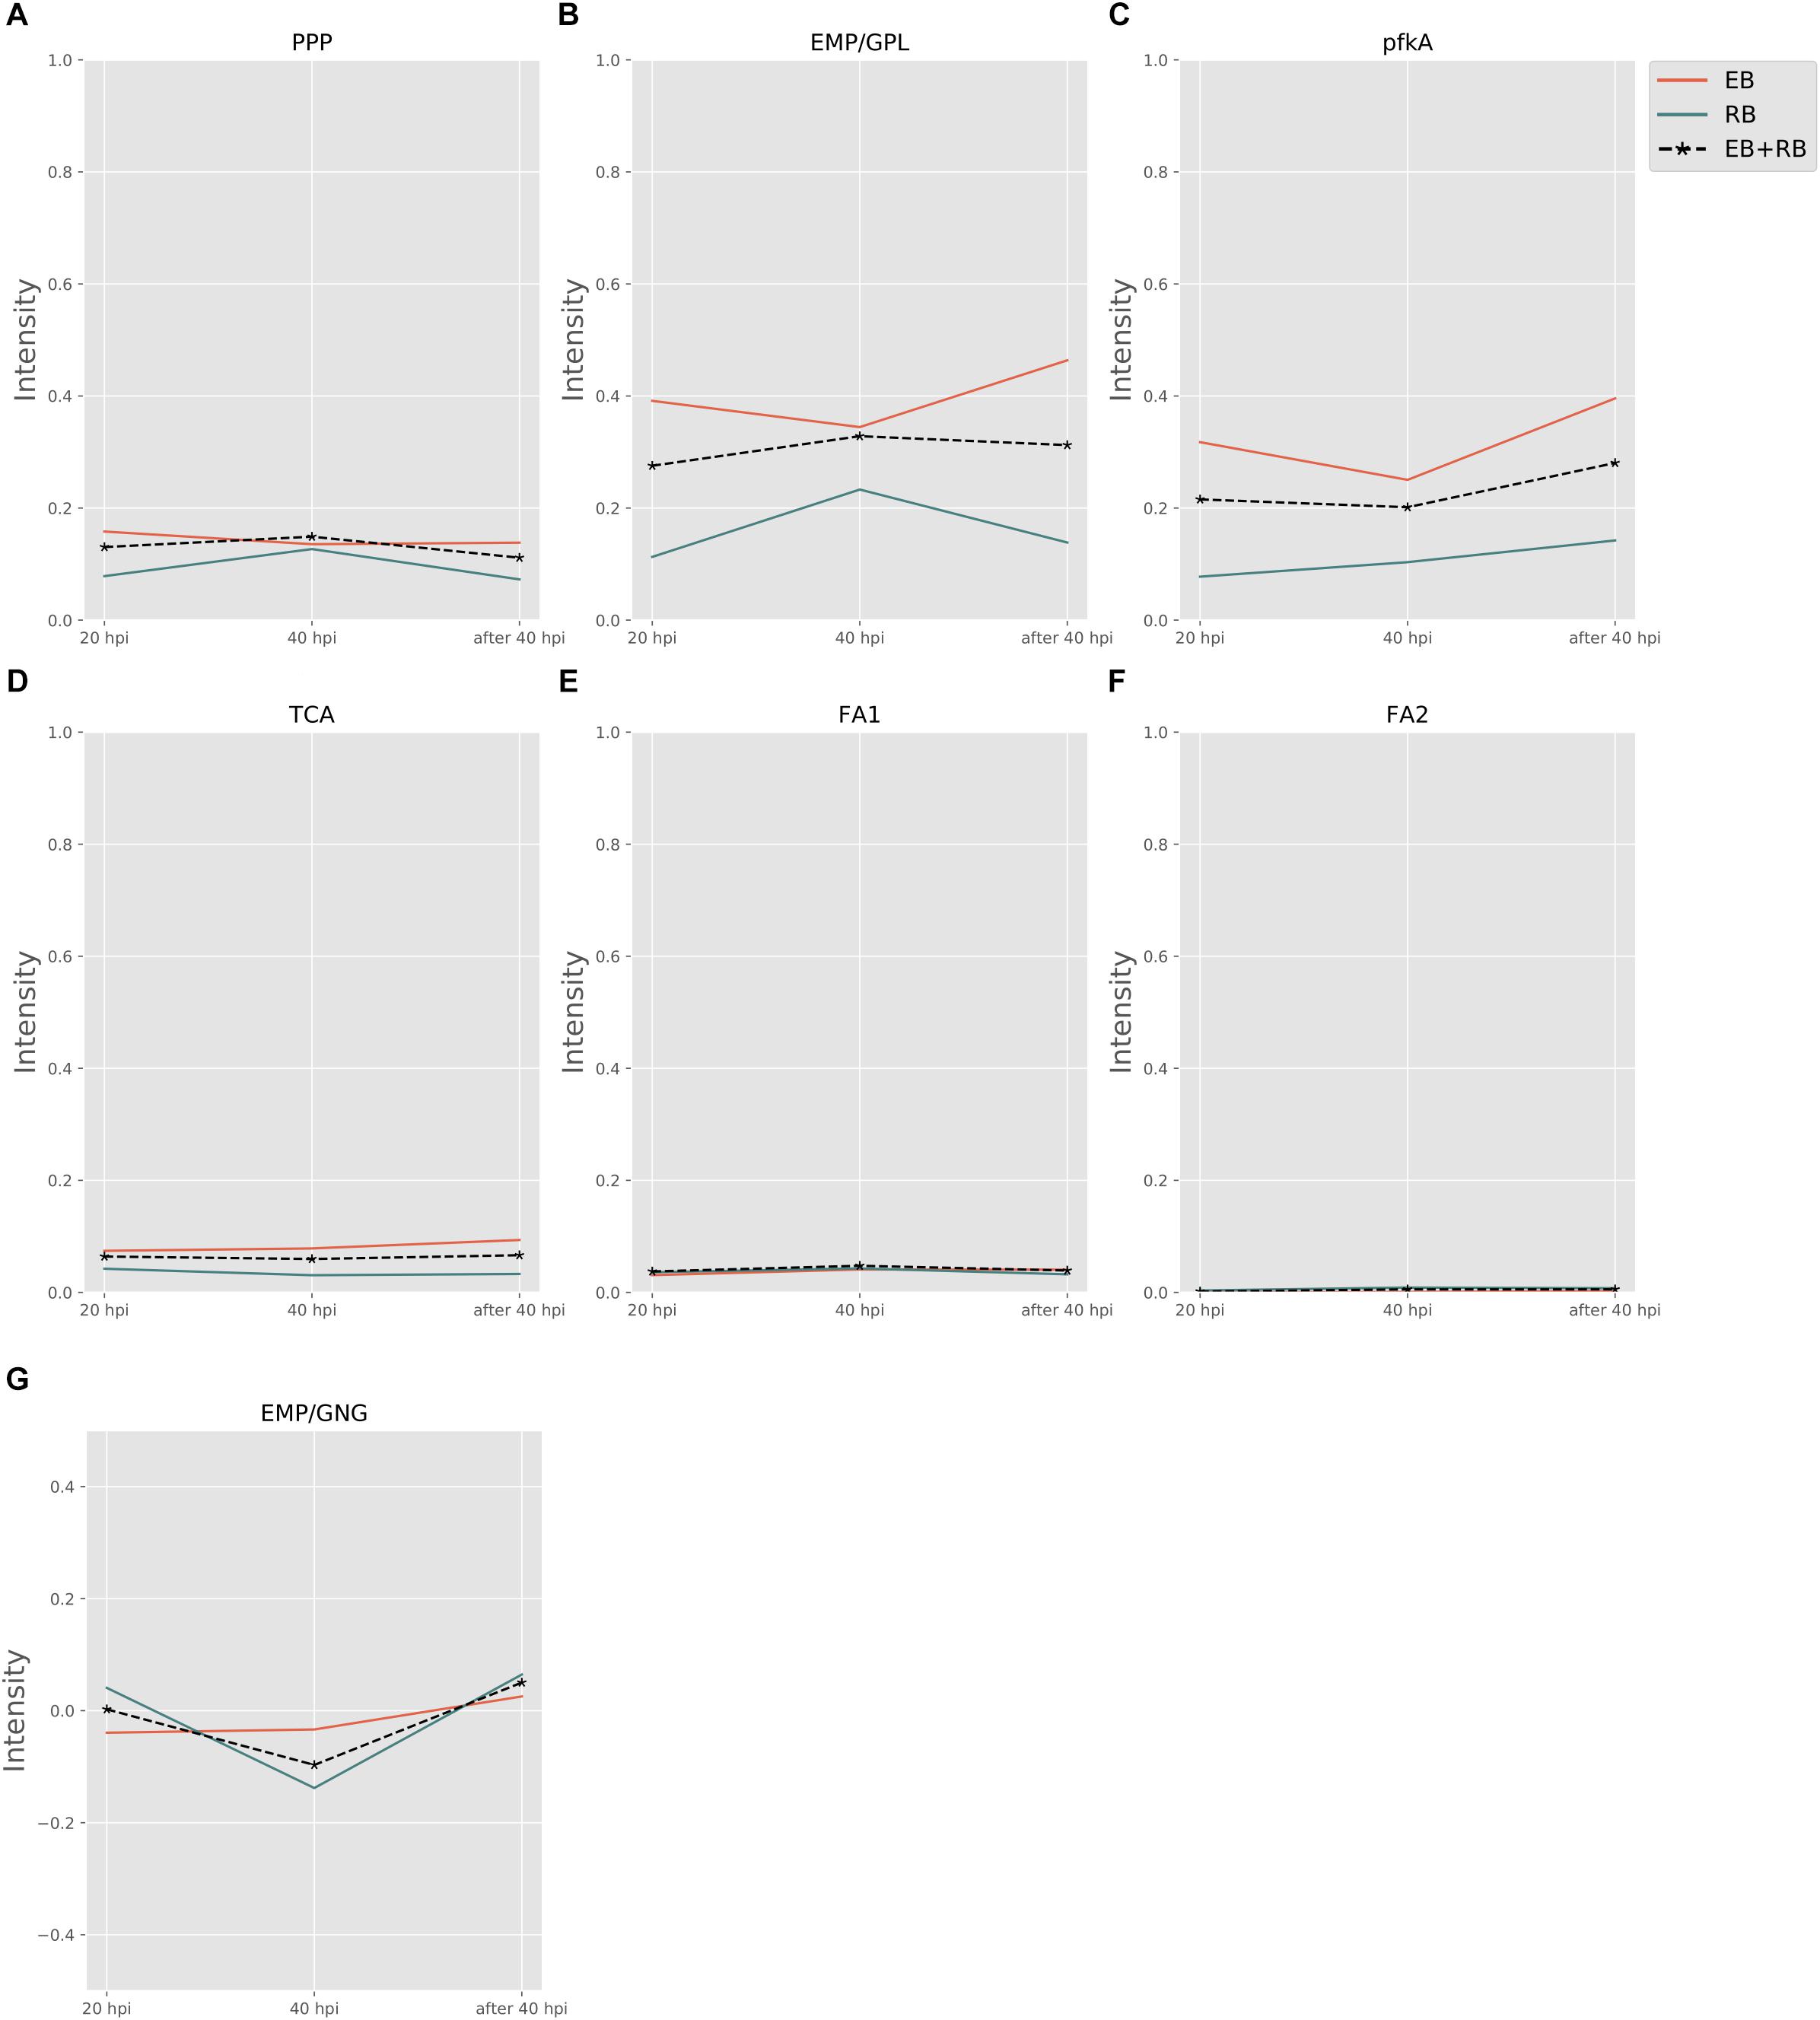
Figure 3. Pathway activity changes of central metabolism in Ct during infection. EB flux changes are given by a red solid line and RB flux changes are shown as green solid line; the average flux change during infection (combining EB and RB as present during infection in the host cells) is given as black dashed line. The time course indicates the variation over infection from 20 hpi, 40 hpi and several hours (about 8 h) later after 40 hpi respectively. Flux intensities are normalized between zero and one (fully active). (A) pentose phosphate pathway (PPP); (B) glycolysis and glycerophospholipid metabolism (EMP/GPL); (C) a cyclic pathway formed by 6-phosphofructokinase 1 and diphosphate-fructose-6-phosphate 1-phosphotransferase (pfkA); (D) tricarboxylic acid cycle (TCA); (E,F) fatty acid biosynthesis (FA1) and (FA2); and (G) gluconeogenesis (GNG).
Phosphofructokinase, as the pacemaker of glycolysis, presented an average intensity of 0.32 in EB and 0.11 in RB (Supplementary File S5). This suggests glycolysis and GPL biosynthesis, which are more active in EB than in RB, are of vital importance in Ct metabolism.
Besides the dominant glycolysis, Ct has the capability of synthesizing its own phospholipids and fatty acids (though in low intensity) in both EB and RB groups (Figure 3). Ct was reported to utilize host fatty acid for phospholipid synthesis (Yao et al., 2015), and to accumulate lipid droplets (LDs) (Kumar et al., 2006; Cocchiaro et al., 2008). Also, the pathway exhibiting the strongest strength contains the downstream of glycolysis and the upstream of fatty acid synthesis. The whole pathway of biosynthesis of fatty acid is inferred to be almost inactive, with average flux intensities below 0.04 and 0.01 in FA1 and FA2 respectively in both EB and RB groups. This suggests that Ct may acquire acyl-CoA from host LD to synthesize its own phospholipids and utilize host fatty acid directly when forming its outer membrane.
The intensity of TCA was below the total average for both EB and RB, with a value of 0.08 and 0.04 (Supplementary File S5), and presented a slight reduction in RB. This may be because Ct could take the energy source (e.g., ATP) directly from the host cell rather than rely on producing the energy independently. TCA is not much active in EB when compared to the other pathways and even less active in RB. This may also suggest that RB may take more energy from the host. Fatty acid biosynthesis has two pathways, FA1 (using 3-oxoacyl-ACP synthase II) and FA2 (using 3-oxoacyl-ACP synthase II and III). FA1 was observed to have an intensity of less than 0.04 (Supplementary File S5) on average (roughly only 10% of the flux of glycolysis in EB and 20% in RB). FA2 was almost not activated at all, though with values below 0.01 (Supplementary File S5) in both EB and RB. Nevertheless, the FA biosynthesis still shows metabolic activities during development for both EB and RB, though it is hard to tell the difference in the metabolic level between EB and RB during the time elapsing.
Not only glycolysis, but also gluconeogenesis was observed in our analysis. In Figure 3G, during the infection from 20 to 40 hpi and the lysis phase, EB steadily went from gluconeogenesis to glycolysis. RB, whose variation trend matches EB + RB’s general trend, converted from glycolysis to gluconeogenesis, and finally transformed again to glycolysis. One possibility suggested from our study is that RB could take up more carbon sources (e.g., G6P) from the host cell at 20 hpi. However, then it will probably end up in cell wall synthesis, as data by Mehlitz et al. (2017) show, where RB uses glucose-6-phosphate for cell wall biosynthesis and not for energy production. Once the transformation from RB to EB begins, carbon sources are stored for further usage. Though the values for RB (−0.14) were over three times higher than EB (−0.03) at 40 hpi (Supplementary File S5), it is still hard to conclude which form prefers gluconeogenesis because of the unknown quantitative ratio between EB and RB. Nevertheless, there is preference of glycolysis both in EB and RB at 40 hpi post.
Folate Biosynthesis Pathways
Folate pathways are also central pathways for Ct. Contributions to folate biosynthesis come from four extreme pathways (Figure 4; extreme pathways P33, P51, P55, and P56). P33 and P51 pathways convert glutamate and 4-aminobenzoic acid (PABA) to glycolaldehyde and folate (see Table 4). The flux strengths of both pathways were enriched above average for all pathways, which indicates the significance of folate biosynthesis in Ct. The difference between P33 and P51 extreme pathways was the amount of ATP and water consumed. Less ATP was required in extreme pathway P33, which is more activated in EB than in RB. In contrast, P51 displayed higher activation in RB than EB when more ATP is available. The variable trend of EB + RB presented a similar result, which increased first and then decreased like EB in P33, and steadily went down during the infection which fits for RB in P51. The ATP generated in P51 but not in P33 relied on the ATP:AMP phosphotransferase (reaction: ATP + AMP = 2ADP). This suggests RB relies more on ATP consumption when it is easier to utilize from both the host and the self-production by activated nucleotides metabolism. There are other folate-related pathways with less ATP consumption in P55 and P56 albeit with lower intensity. P55 was the transformation among folate, tetrahydrofolate, and di-hydro-folate. And P56, although not as active as P33 and P51, could be an alternative pathway for folate biosynthesis, especially for EB.
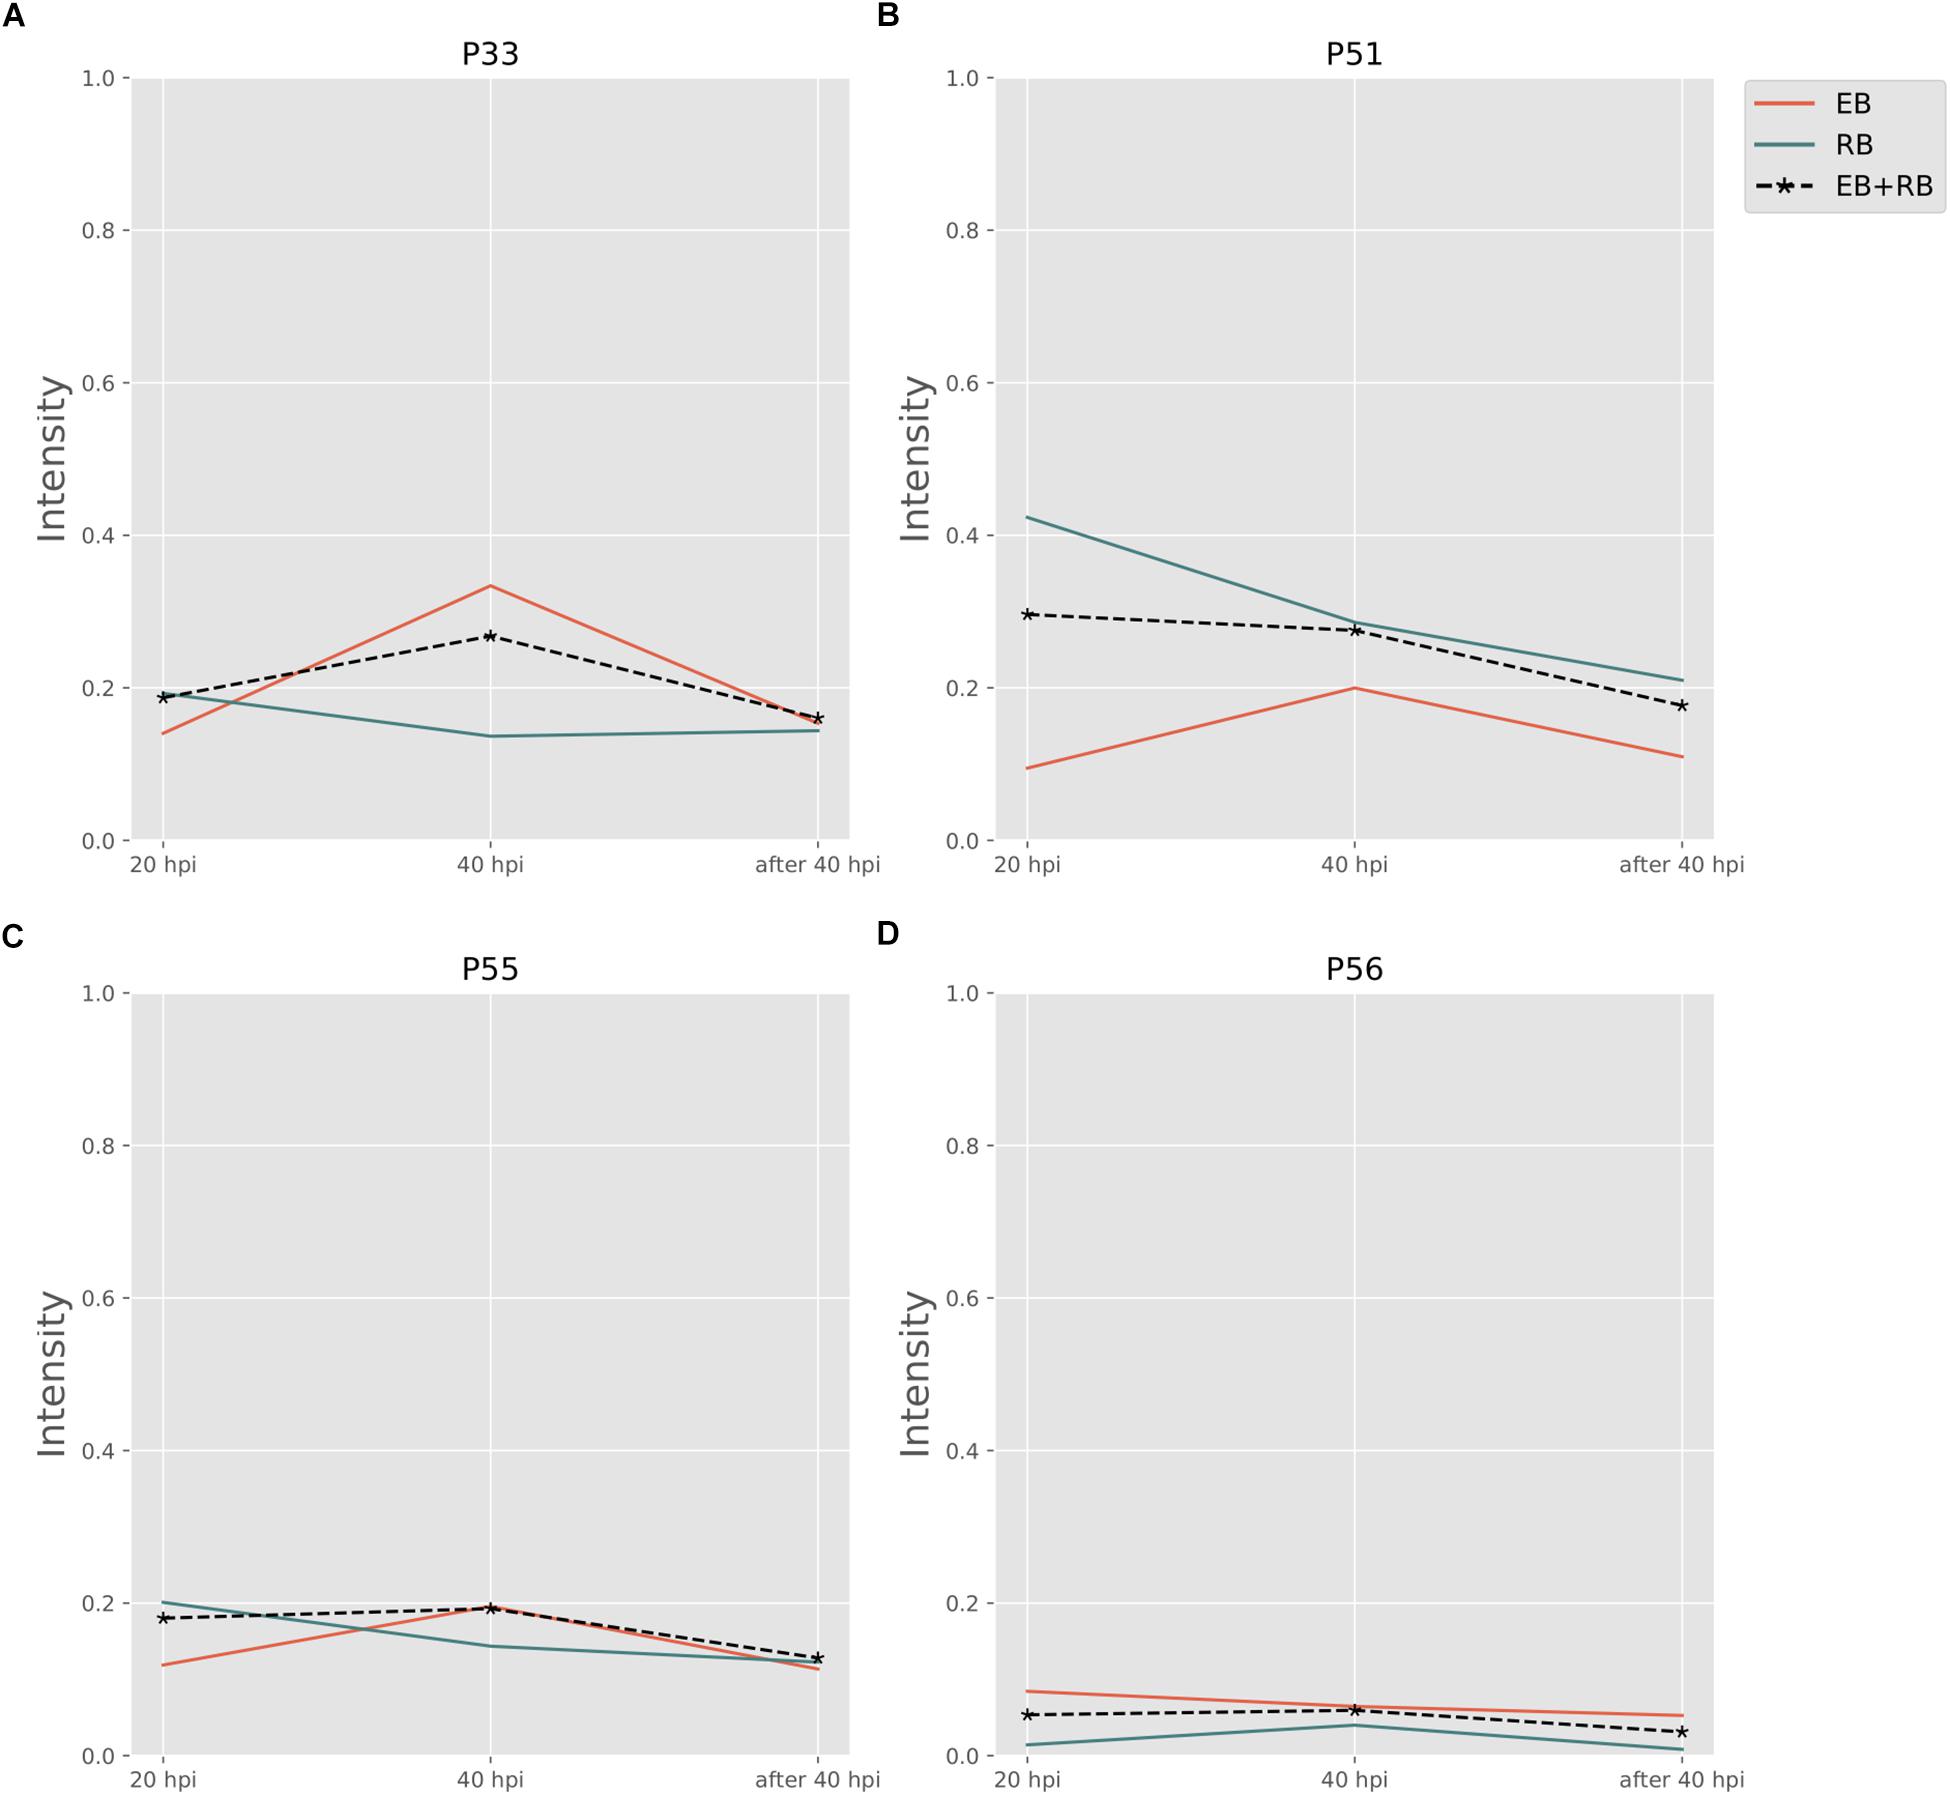
Figure 4. Pathway activity changes of Folate biosynthesis in Ct during infection. (A) P33; (B) P51; (C) P55; and (D) P56 are all extreme pathways involved in synthesizing folate. EB flux changes are given by a red solid line and RB flux changes are shown as green solid line; the average flux change during infection (combining EB and RB as present during infection in the host cells) is given as black dashed line. The time course indicates the variation over infection from 20 hpi, 40 hpi and several hours (about 8 h) later after 40 hpi respectively. Flux intensities are normalized between zero and one (fully active).
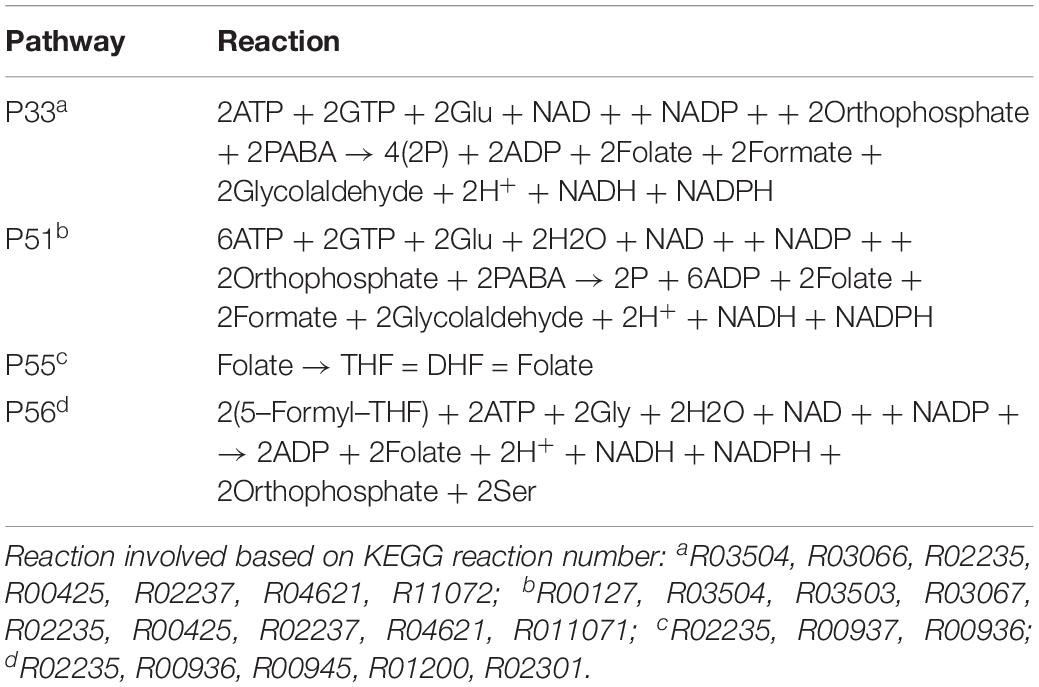
Table 4. Extreme pathways in folate biosynthesis.
Finally, the P33 and P51 pathways suggest glutamate is in great demand for Ct or at least in the folate pathways. Also, it is likely that folate metabolism is tightly correlated with the availability of carbon/nitrogen sources and energy production in Ct (Fan et al., 1992; Adams et al., 2014).
Amino Acid Metabolism
Cysteine Metabolism
Biosynthesis of cysteine is very important for forming the outer membrane of EB, because Ct contains the type three secretion system (T3SS) in the outer membrane. In order to compose T3SS, cysteine is assumed to accumulate more in the infectious form (Betts-Hampikian and Fields, 2011). In our results, intensities of cysteine synthesis pathways (Figures 5A–C) on average are higher than those of cysteine consuming pathways (Figures 5D–F). With a clear difference in fluxes, it is obvious that the formation of cysteine is much more intense in EB rather than in RB. The intensities are two to five times higher in EB when compared to RB. Our data support the hypothesis that the cysteine-rich outer membrane is constructed in EB.
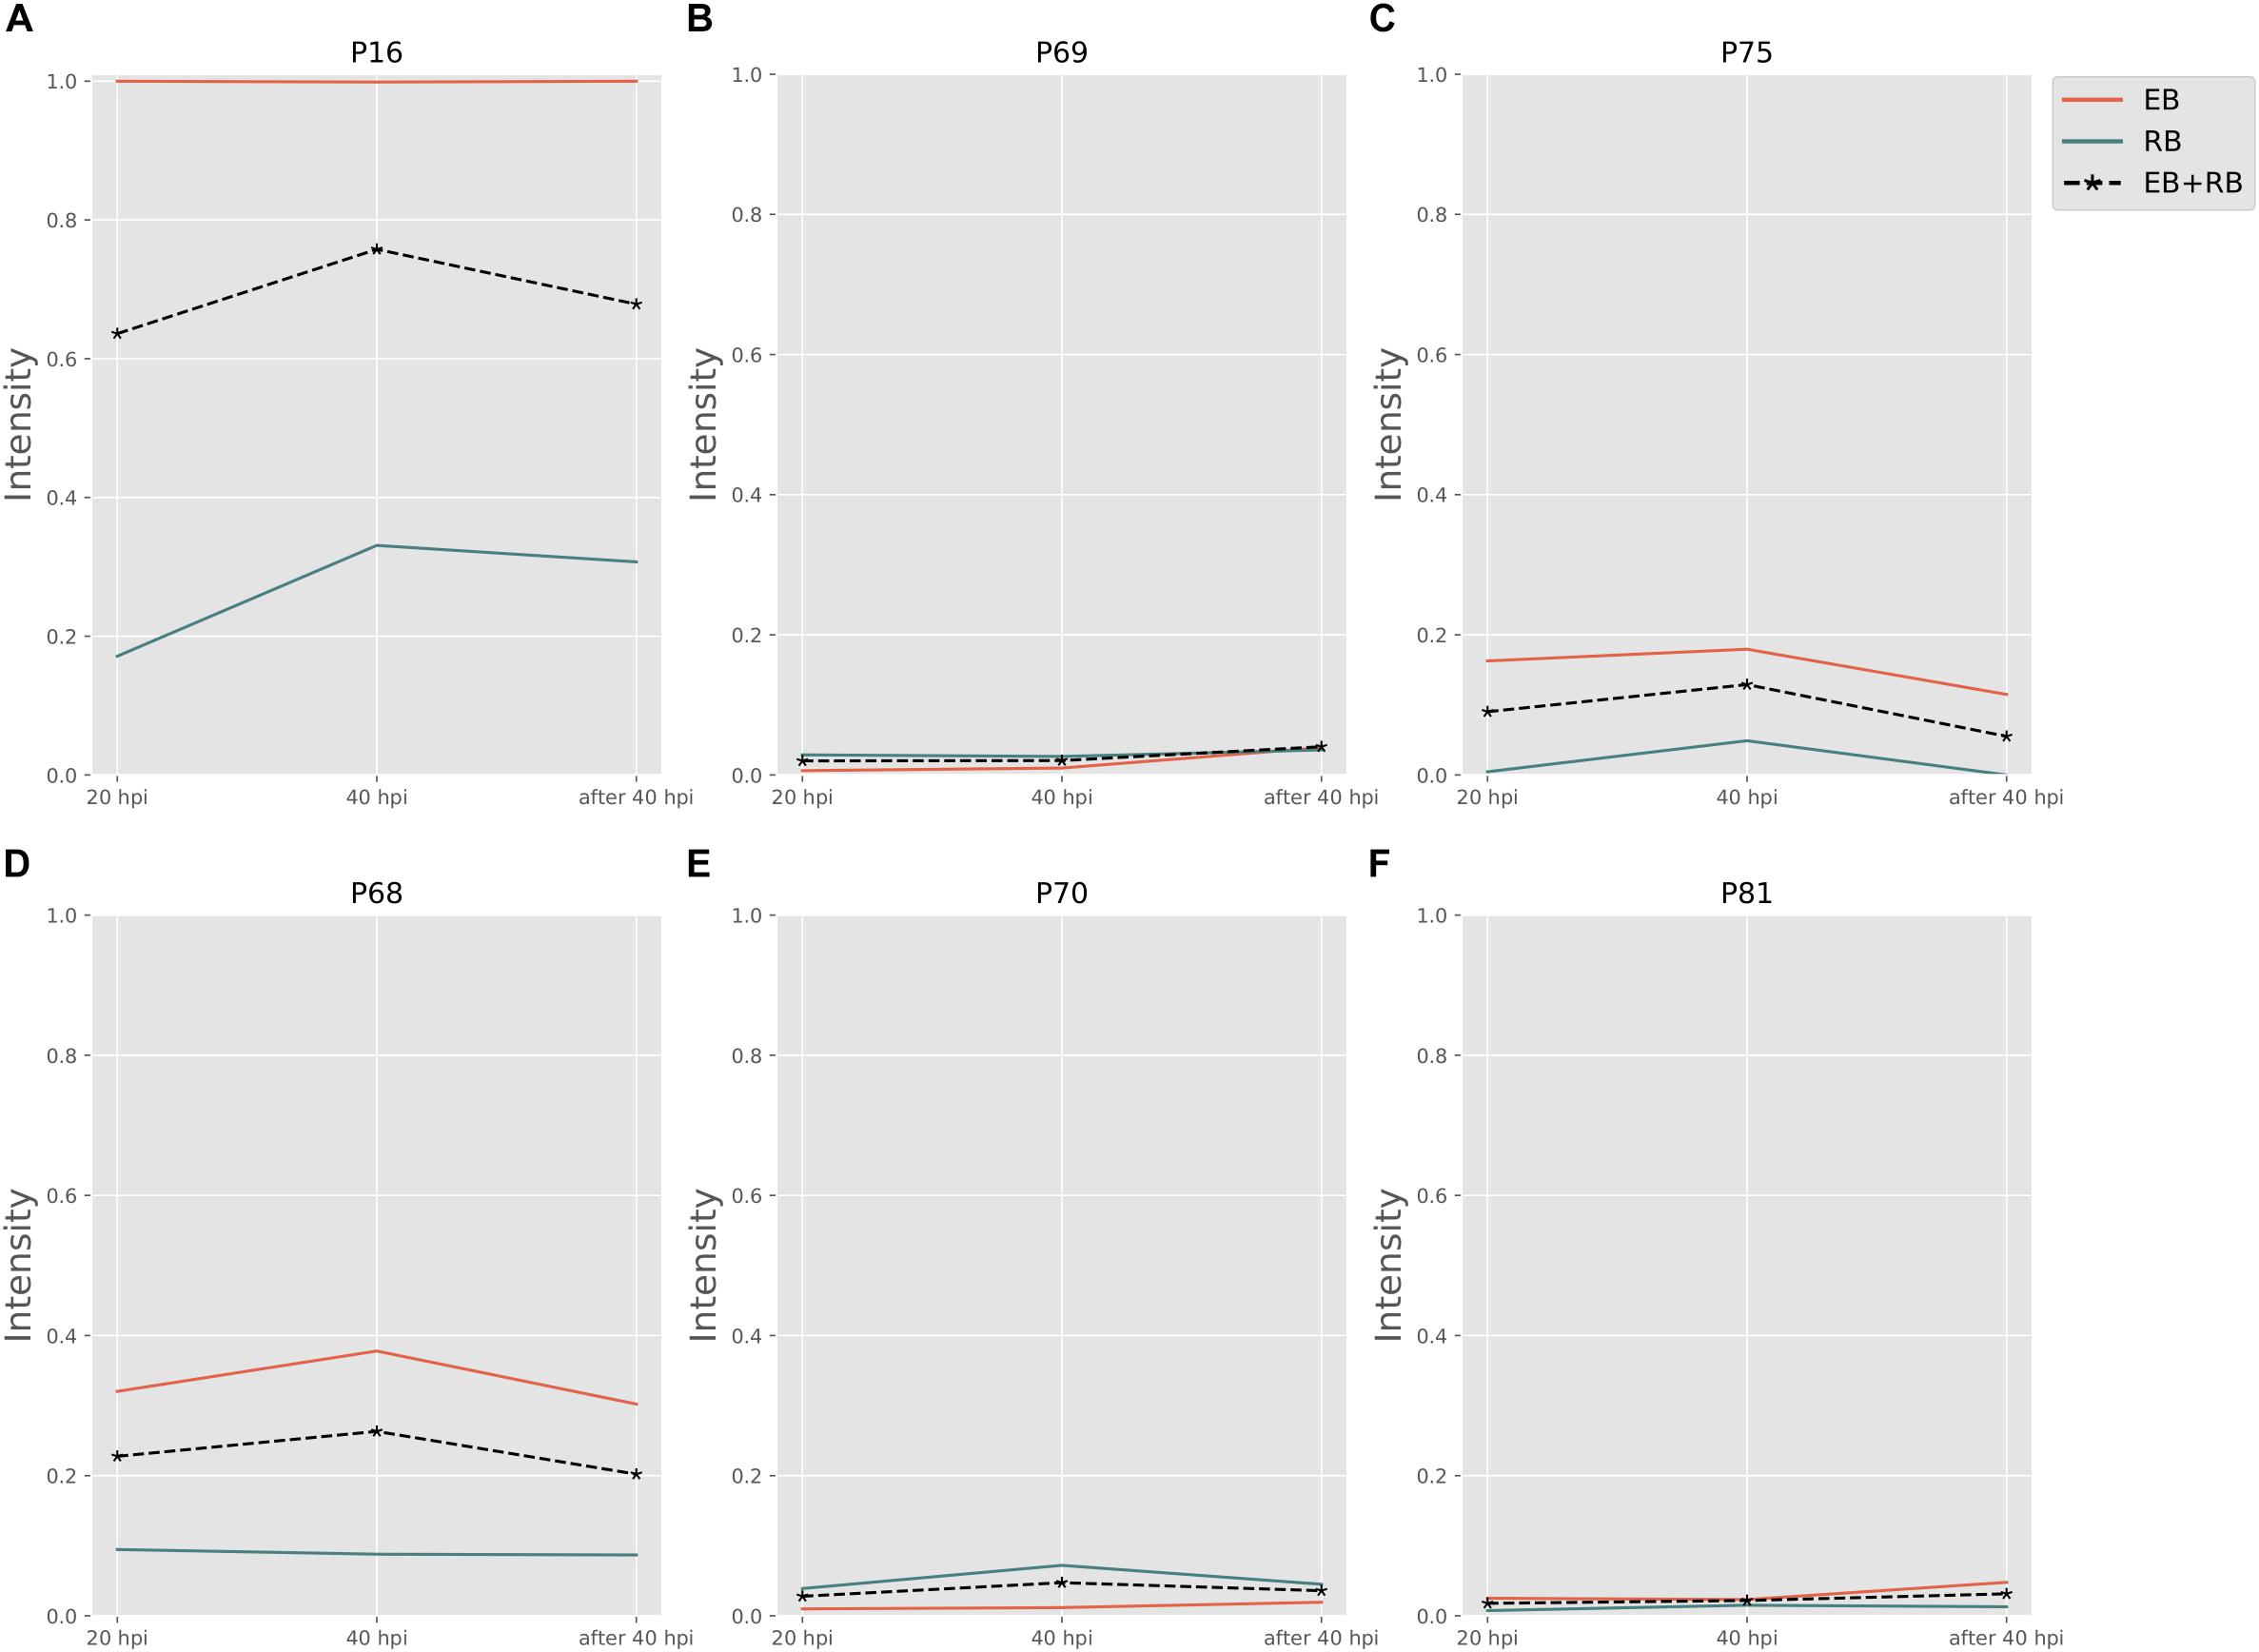
Figure 5. Cysteine and other amino acid associated activity changes in Ct during infection. (A–C) Are cysteine biosynthesis pathways; (D–F) are cysteine consumptions. EB flux changes are given by a red solid line and RB flux changes are shown as green solid line; the average flux change during infection (combining EB and RB as present during infection in the host cells) is given as black dashed line. The time course indicates the variation over infection from 20 hpi, 40 hpi and several hours (about 8 h) later after 40 hpi respectively. Flux intensities are normalized between zero and one (fully active).
Peptidoglycan Biosynthesis
The P70 pathway (Table 5) is involved in the biosynthesis of peptidoglycan (PG). The Mur genes for PG synthesis are sensitive to penicillin. However, the absence of PG in Ct was quite unusual. New cell wall labeling methods helped reveal PG for the first time (Pilhofer et al., 2013; Liechti et al., 2014). P70 flux pathway, though with weak intensity, was inferred from the calculation to be active only in RB (Figure 5E). Peptidoglycan synthesis is also known to occur only in RB:
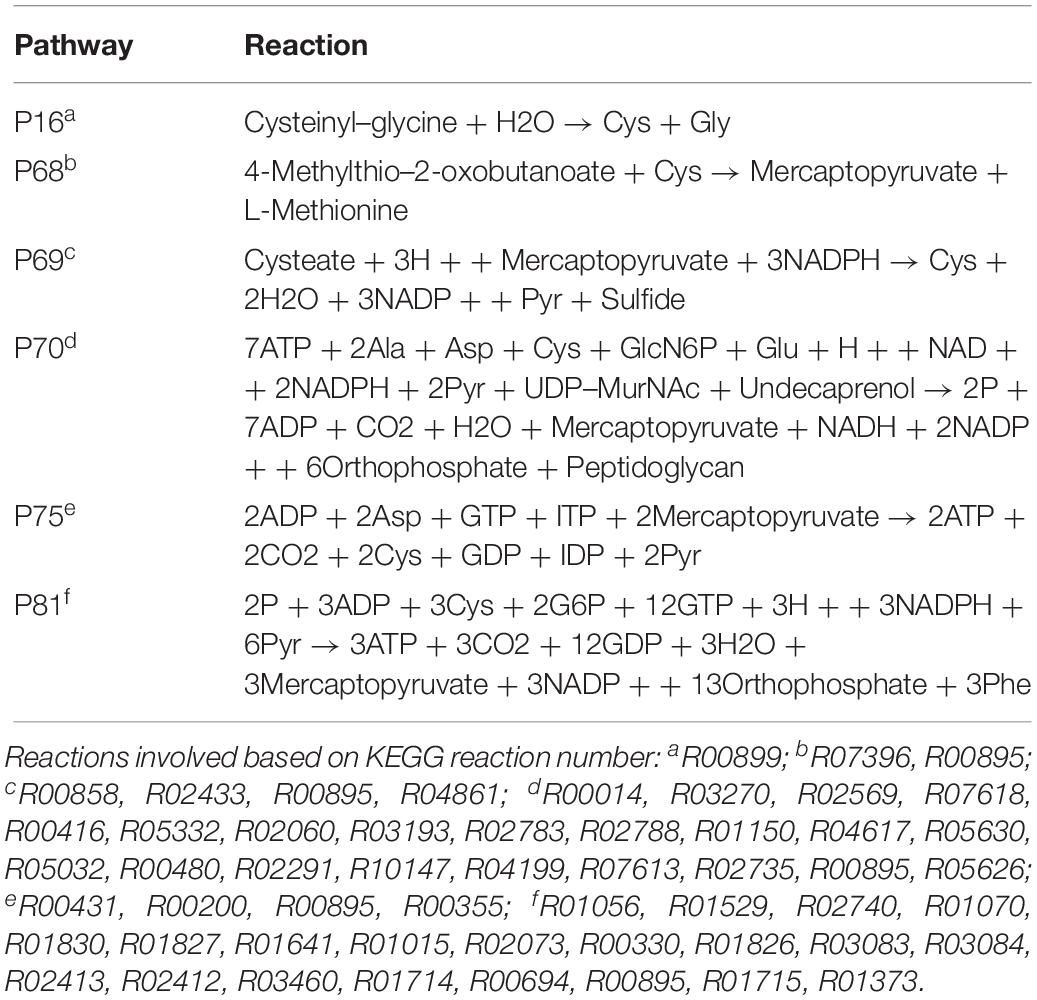
Table 5. Cysteine and other amino acid associated extreme pathways.
Uptake of Glutamate and Glutamine
The TCA cycle in Ct is incomplete and presents a modified horse shoe form providing substrate for amino acid synthesis but with a low energy yield. The reason for this is the lack of genes encoding citrate synthase, aconitate hydratase and isocitrate dehydrogenase. Substrate enters into this incomplete TCA cycle by 2-oxoglutarate and turns out to oxaloacetate. With the appearance of aspartate transaminase (EC 2.6.1.1), the oxaloacetate could exchange with aspartate accompanied by barter between glutamate and 2-oxoglutarate. However, the flux prefers to drive from glutamate to aspartate [Figure 3D and Table 3, TCA (P46)]. It is possible that the anaplerosis shown in Figure 3D is commonly completed in almost all aerobic organisms. Nevertheless, because of the low flux strengths, this unfeasible cycle is not significantly responsible for gaining chemical energy in the form of ATP.
In most microorganisms, glutamine synthetase (EC 6.3.1.2), glutaminase (EC 3.5.2.1), and glutamate synthase (EC 1.4.1.13/1.4.1.14) are important for switching between glutamate and glutamine. Normally, glutamine could be converted to glutamate after taken from the environment or host cell. Without encoding genes for these enzymes, Ct presents glutamine-fructose-6-phosphate transaminase (glmS, EC 2.6.1.16), whose protein product converts glutamine and fructose 6-phosphate to glutamate and glucosamine 6-phosphate. The existence of CTP synthase (pyrG, EC 6.3.4.2), should allow to transform glutamate into glutamine. PyrG seems not to be involved in long essential pathways such as glmS, as no full pyrimidine metabolism is formed in Ct. Both glmS and pyrG were detected with expressions in the proteomics data used (Østergaard et al., 2016).
Although glutamate and glutamine are both necessary in the metabolism of Ct, it is still unknown whether Ct imports only glutamine or both glutamine and glutamate from the host cell. Interestingly, three glutamate-related transporters, CT_216, CT_230 and CT_401 are encoded in the genome, and both CT_216 and CT_401 are expressed in the protein level (Østergaard et al., 2016). However, glutamine transporters are not confirmed yet.
Fragmented Pathways for Purine and Pyrimidine Synthesis
The biosynthesis of phosphoribosyl pyrophosphate (PRPP), an important precursor in nucleotide biosynthesis, is not available in Ct, due to the lack of PRPP synthase based on the genome (Stephens et al., 1998). Whether PRPP could be acquired through other methods of synthesis or from the host cell through a membrane transporter is still unknown. Theoretically, the central purine and pyrimidine metabolism would not be present in Ct for the lack of PRPP. However, many genes encoding enzymes involved in nucleotide acid metabolism are present in Ct’s genome which forms theoretical pathways (Figure 6). Also, some of these enzymes are detected in the proteomics and shown to be strongly up-regulated when two or three reactions form small fragments of pathways in our results (Supplementary File S5).
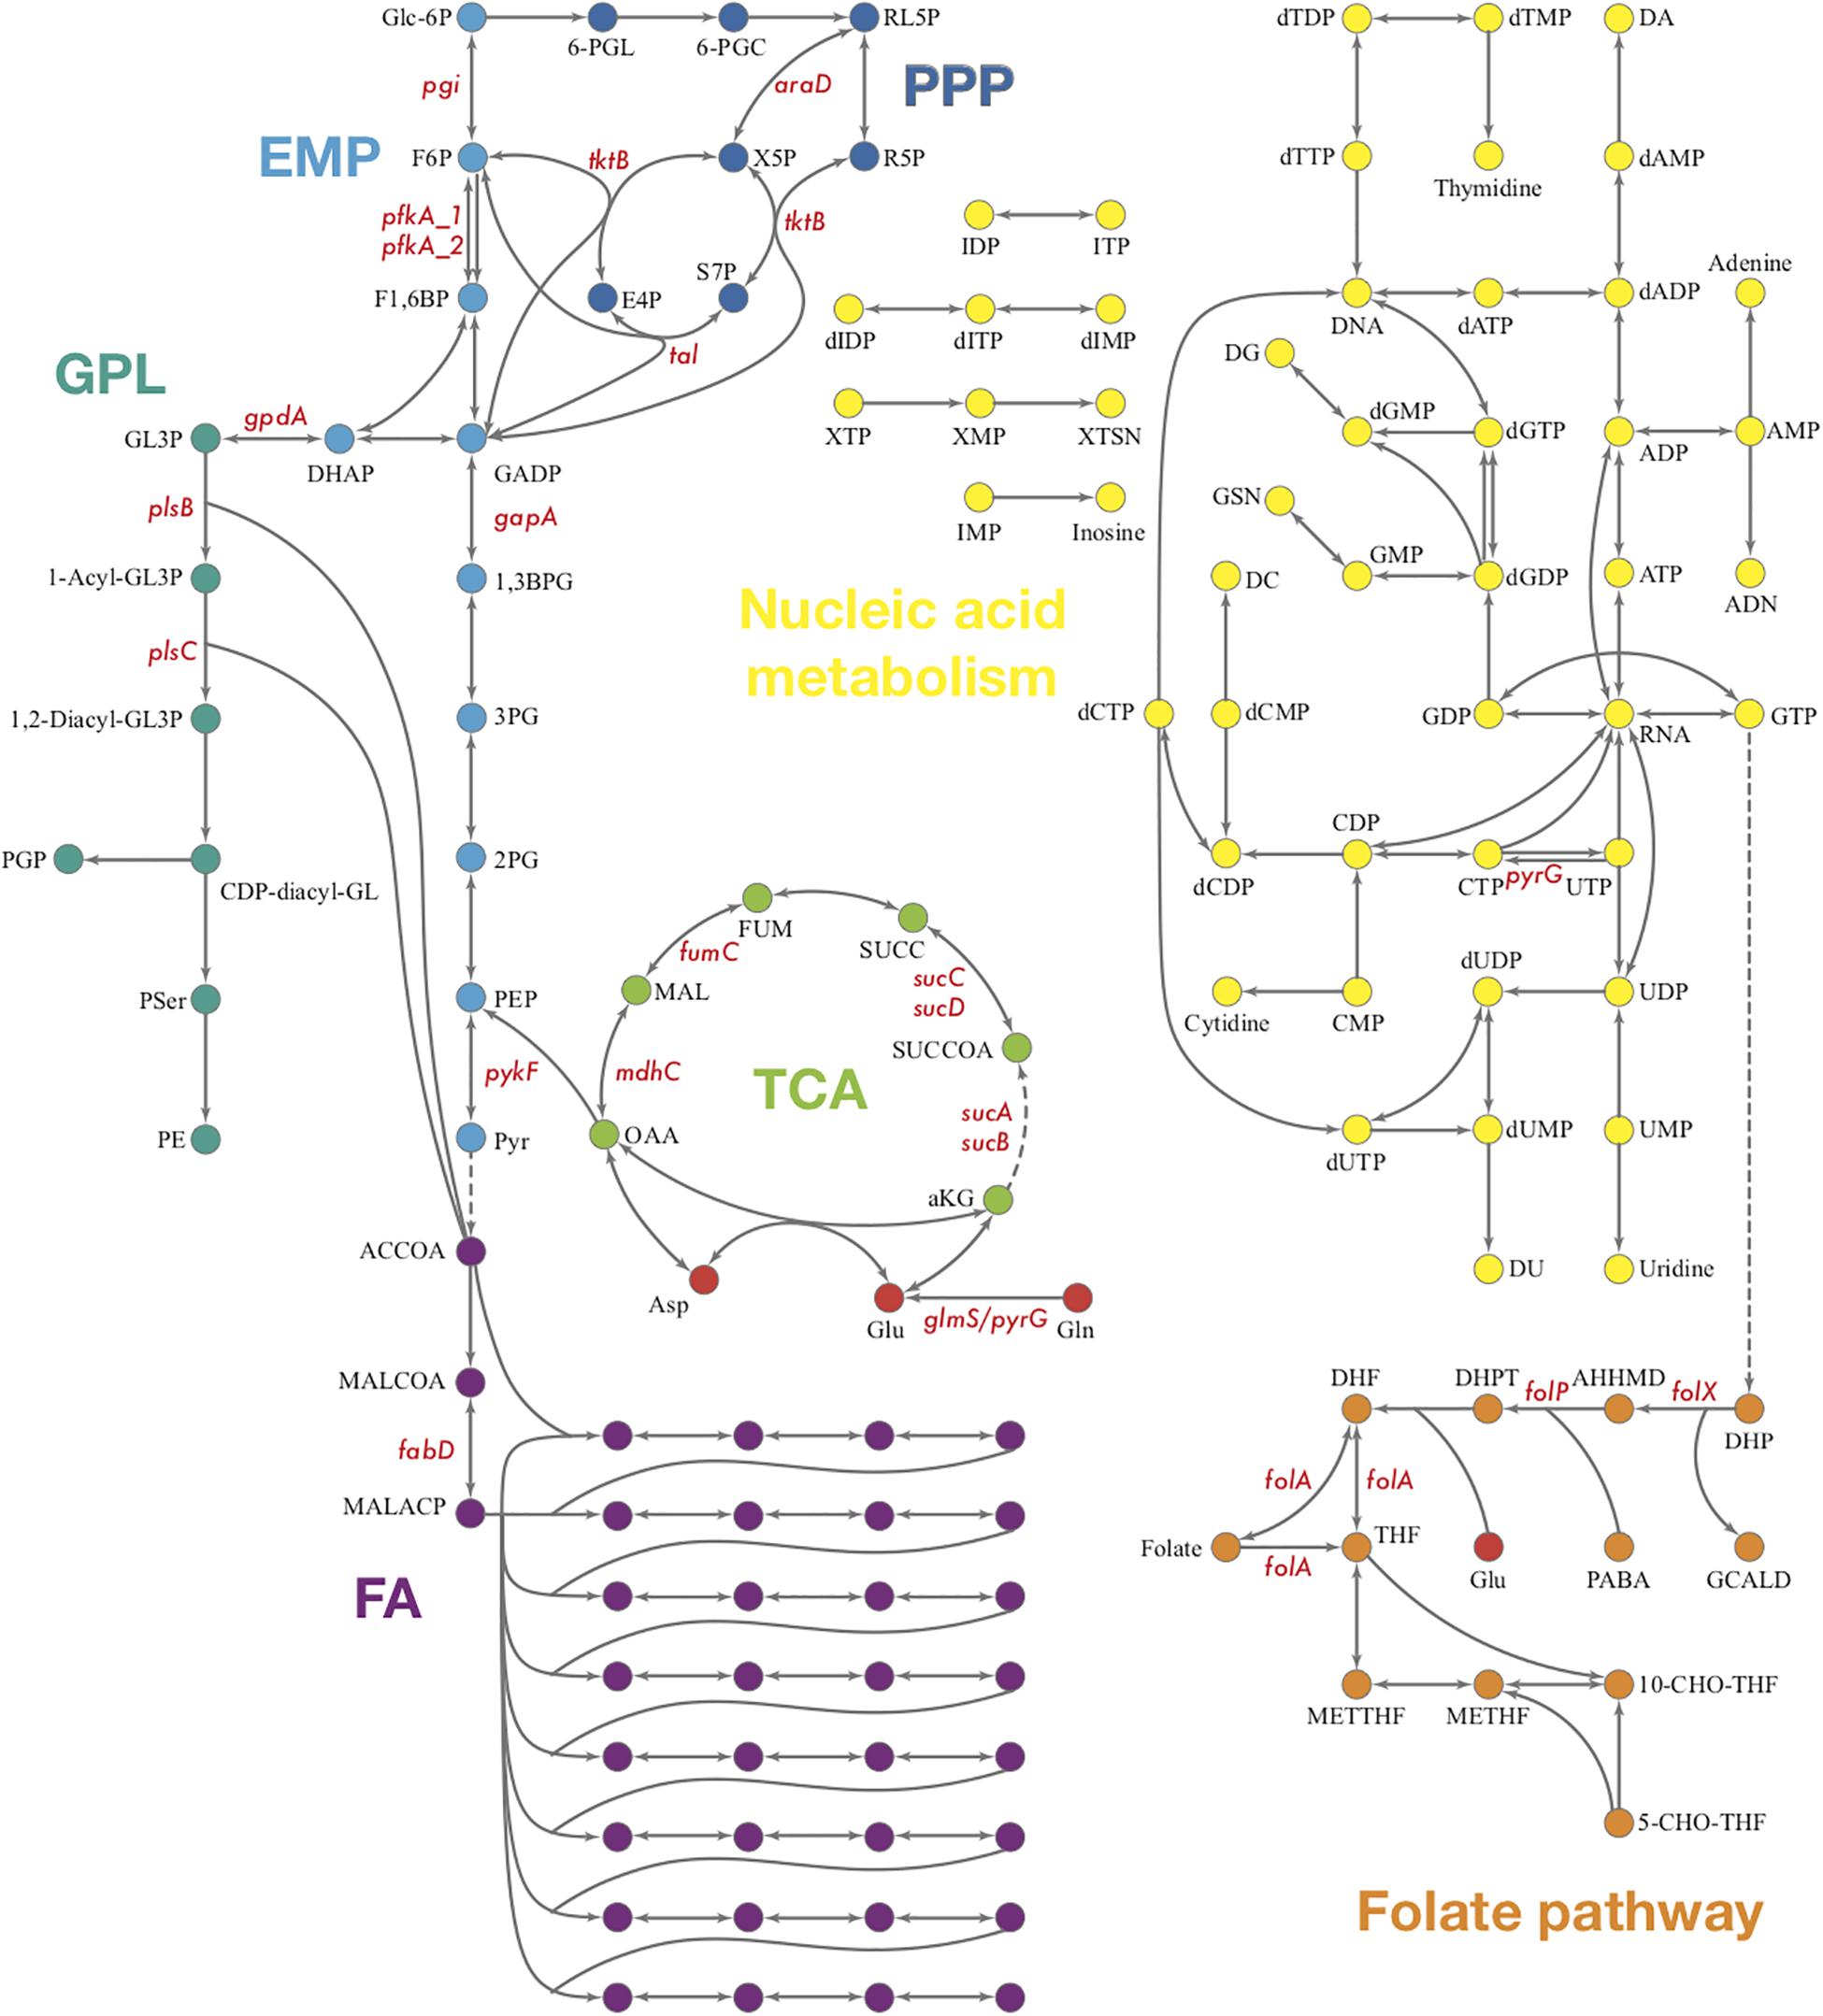
Figure 6. Overview of Ct central metabolism. The enzymes labeled in red were validated in their activity of expression by RT-qPCR. EMP, glycolysis; PPP, pentose phosphate pathway; GPL, glycerophospholipid metabolism; GNG, gluconeogenesis; TCA, tricarboxylic acid cycle; FA, fatty acid biosynthesis. araD, ribulose-phosphate 3-epimerase; tktB, transketolase; tkl, transketolase; pgi, glucose-6-phosphate isomerase; pfkA_1, 6-phosphofructokinase; gapA, glyceraldehyde 3-phosphate dehydrogenase; pykF, pyruvate kinase; pfkA_2, pyrophosphate–fructose-6-phosphate 1-phosphotransferase; gpdA, glycerol-3-phosphate dehydrogenase (NAD(P) +); plsB, glycerol-3-phosphate O-acyltransferase; plsX, glycerol-3-phosphate O-acyltransferase; plsC, 1-acyl-sn-glycerol-3-phosphate acyltransferase; mdhC, malate dehydrogenase; fumC, fumarate hydratase class II; sucC, succinyl-CoA synthetase beta subunit; sucD, succinyl-CoA synthetase alpha subunit; sucA, 2-oxoglutarate dehydrogenase; sucB, 2-oxoglutarate dehydrogenase; fabD, Malonyl CoA-acyl carrier protein transacylase; glmS, glutamine-fructose-6-phosphate aminotransferase; pyrG, CTP synthase; folX, dihydroneopterin aldolase; folP, dihydropteroate synthase; folA, dihydrofolate reductase.
Biological Validation of in silico Results in Cell Lines
To validate the results of the metabolic model, gene expression of candidate enzymes in Ct were selected and examined by RT-qPCR (Table 6). These enzymes were chosen as they cover our metabolic model well and the key changes according to our pathway model are shown in Figure 6 (enzymes shown by red lettering). Quantitative RT-PCR provided the method of choice for us as it is sensitive and fast. The measurements in triplicate are quantitatively accurate, however, as they measure only a marker of enzyme activity, i.e., the amount of mRNA present to synthesize the respective enzyme, they allow us only to validate our flux predictions by corresponding enzyme mRNA expression levels. Nevertheless, regarding bacterial metabolism, and considering the rapid turnover of bacterial enzymes, they are informative to validate our metabolic model in this sense. To achieve even more robustness in our measurements, we compare here measurements in two cellular models, HeLa229 cells and HUVECs cells (Figure 7). Keep also in mind that the flux predictions (all flux data are given in Supplementary File S5) were selected by optimally fitting the calculated fluxes to the direct protein expression data (Østergaard et al., 2016) measured in Ct.
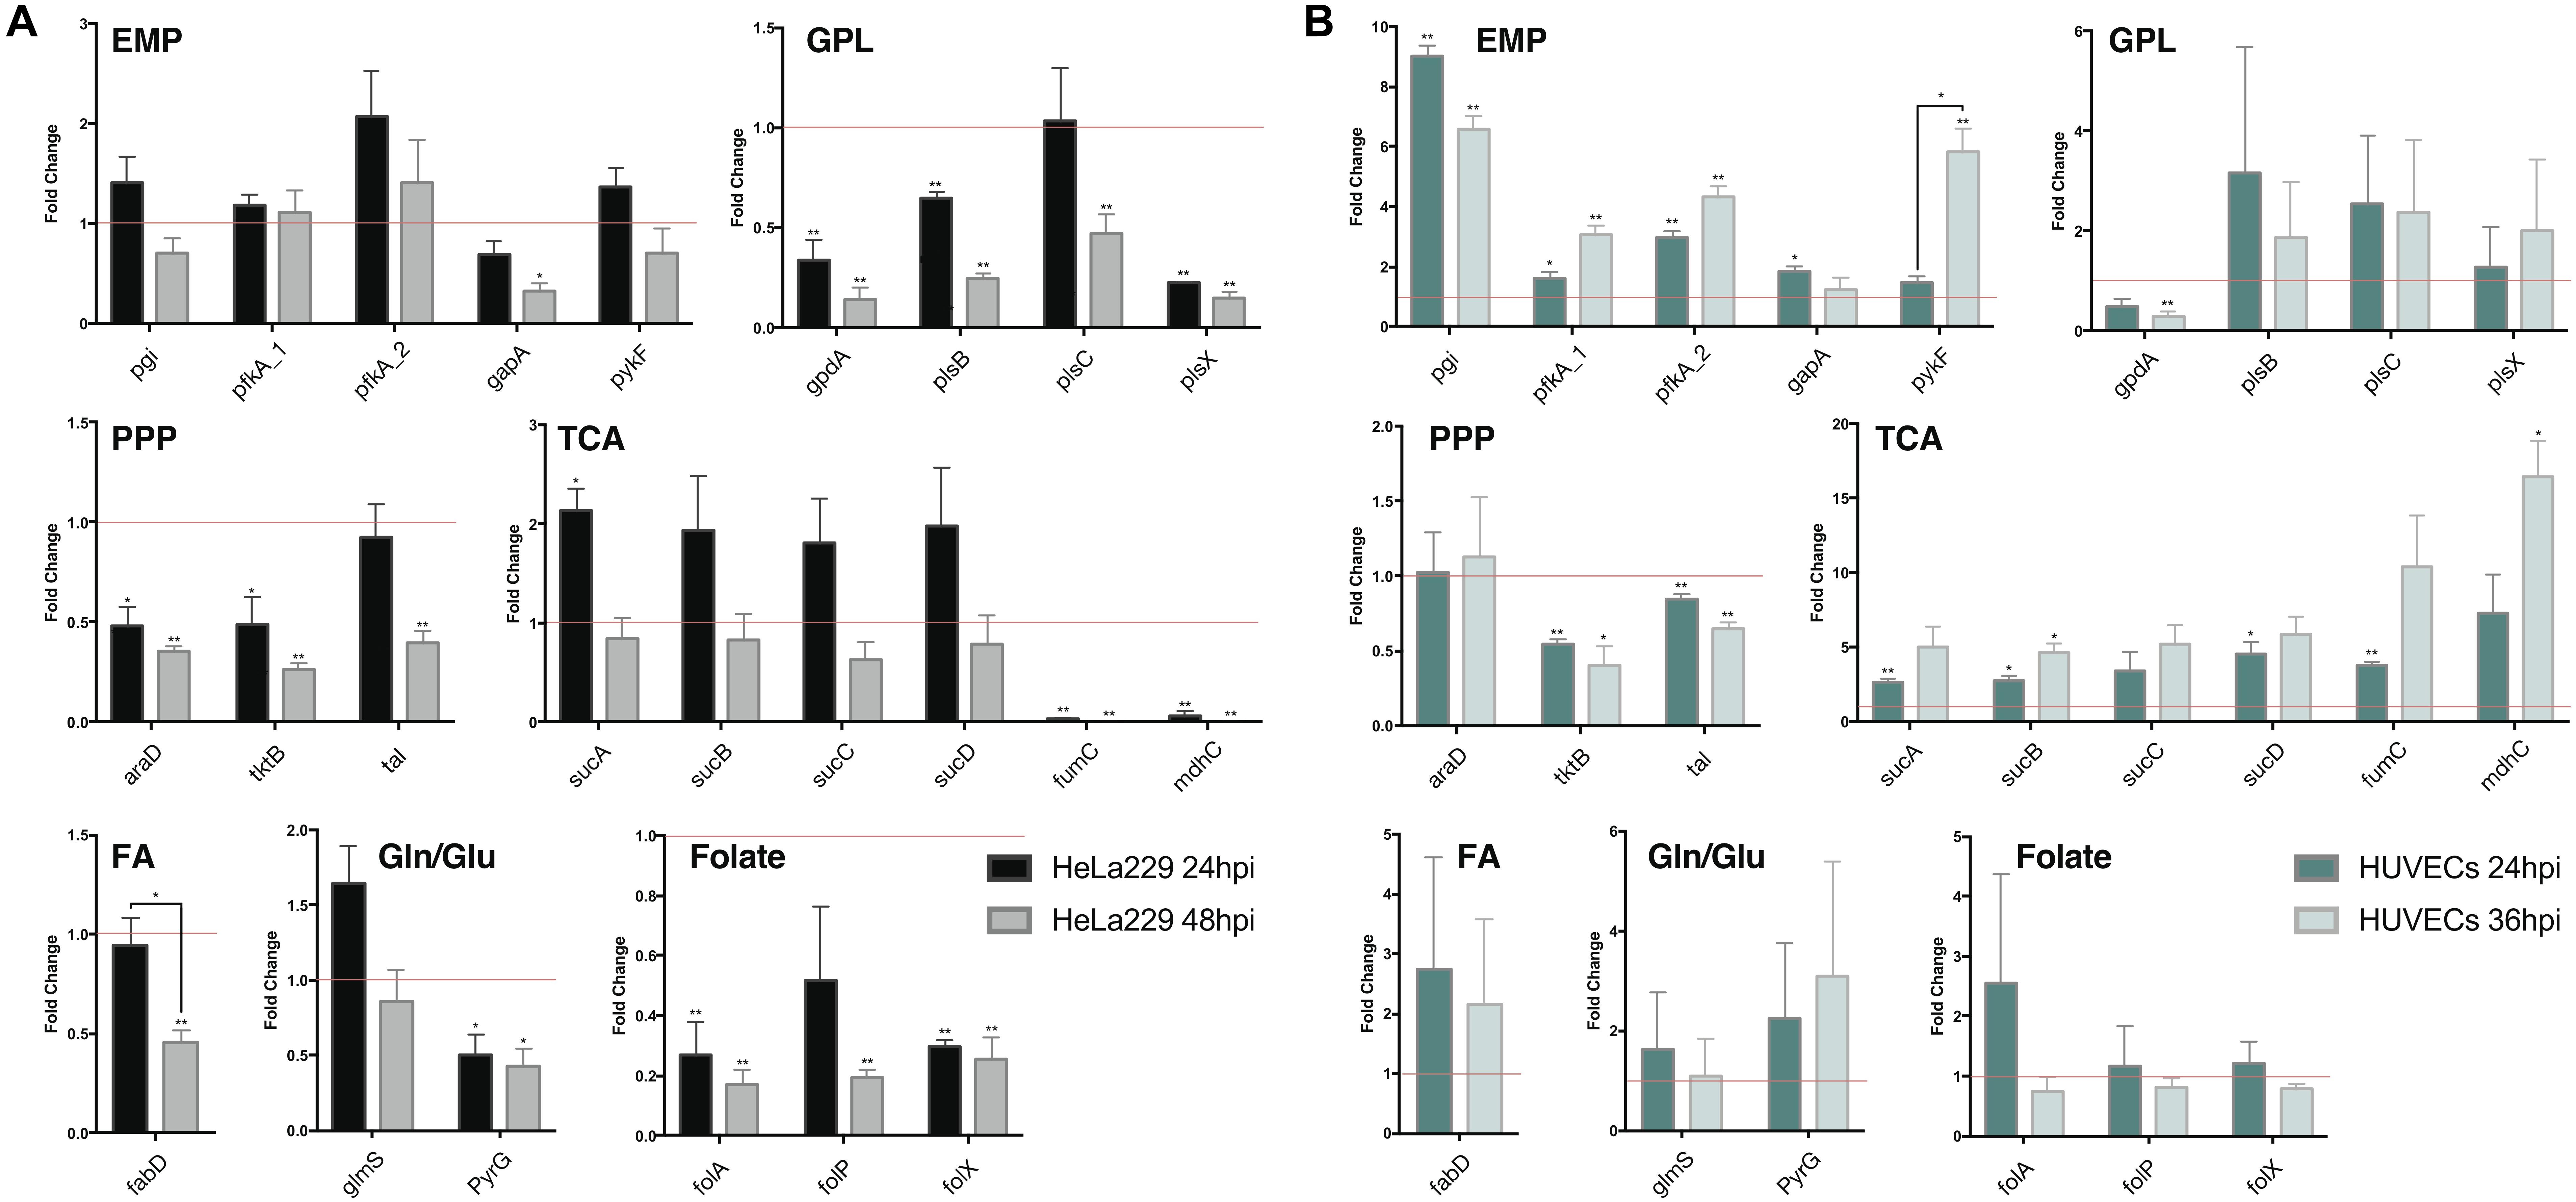
Figure 7. Quantitative RT-PCR analysis of gene expression in major metabolic pathways of Ct during infection in HeLa229 cell lines and HUVECs cell lines. The gene expression of key metabolic enzymes in Ct (shown in Figure 6) was measured at 24 hpi and 48 hpi for (A) (HeLa229), and 24 hpi and 36 hpi for (B) (HUVECs). Each gene was quantified by three independent experiments with the mean values (± SEM) compared to the expression at 12 hpi shown as a control (red line). Statistical analysis was performed by SEM and Student t-test (∗p ≤ 0.05; ∗∗p ≤ 0.01). PPP, pentose phosphate pathway; EMP, glycolysis; GPL, glycerophospholipid biosynthesis; TCA, tricarboxylic acid cycle; FA, fatty acid biosynthesis; Gln/Glu, converting glutamine to glutamate; Folate, Folate biosynthesis.
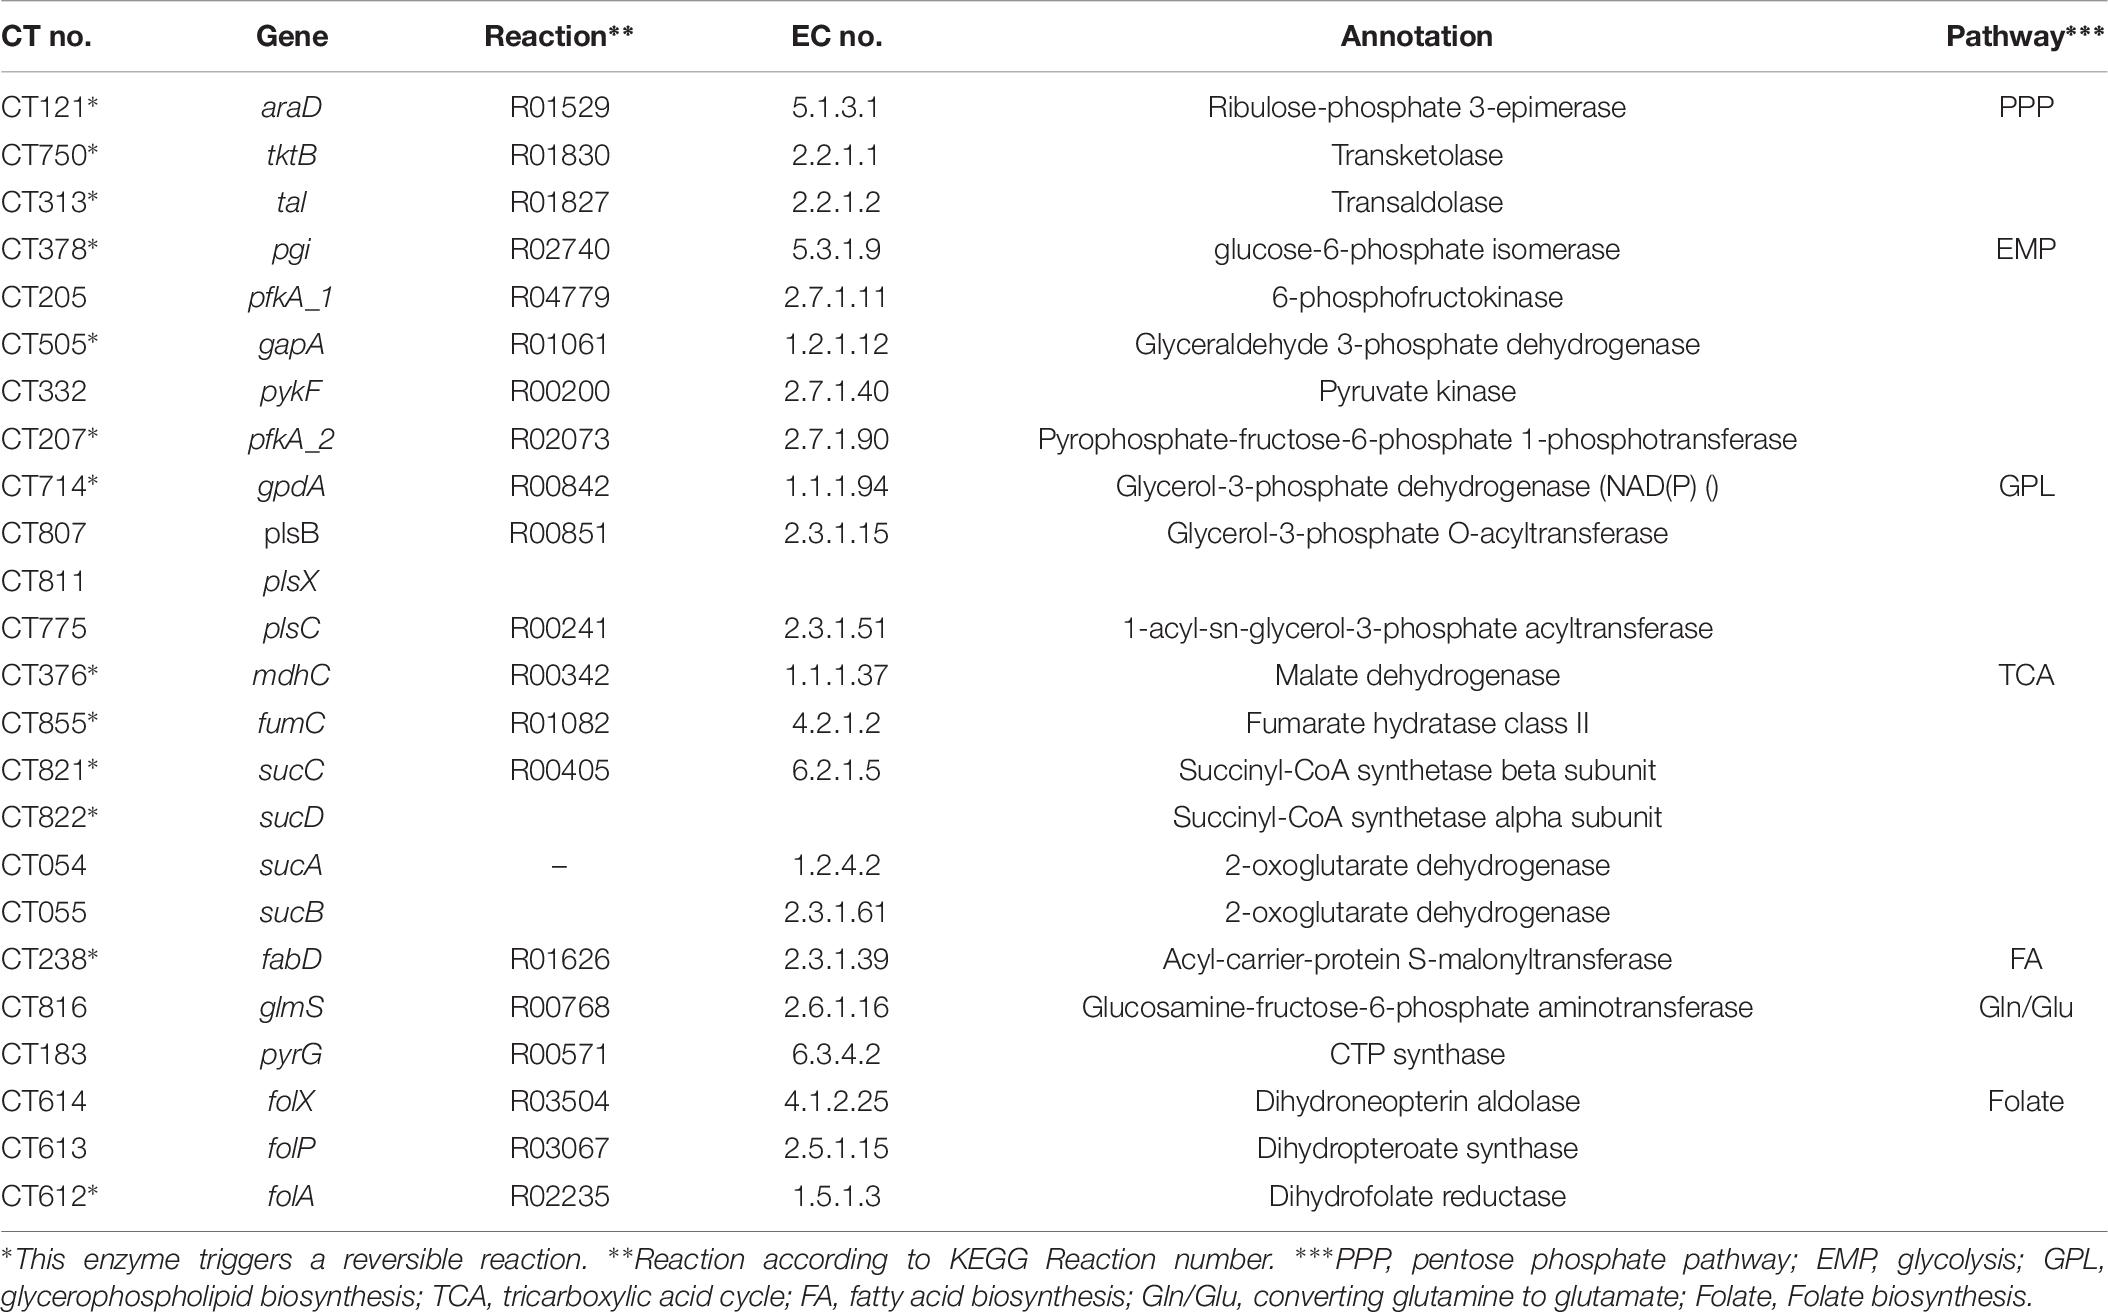
Table 6. Candidate genes for RT-qPCR validation.
In HeLa229 cells (Figure 7A), most of the enzymes in glycolysis were clearly upregulated at 24 hpi, and down regulated at 48 hpi. The two phosphofructokinases were very active, and pfkA_2, functional on reversible reactions, was expressed nearly twofold higher at 24 hpi when compared to pfkA_1, which triggers the one-way step in glycolysis. Expressions of glucose-6-phosphate isomerase (pgi) and pyruvate kinase (pykF) were slightly increased (1.25 and 1.2-fold, respectively). This indicates that glycolysis is used strongly by Ct no matter whether EB or RB. In accordance with this, the combined data (EB + RB) show an increase in glycolysis in Figure 3B. Regarding iso-enzymes, we find that from the two different forms of phosphofructokinase available to Ct, pfkA_2 is more active in the glycolysis of Ct and it uses diphosphate as substrate. In contrast, the substrate ATP is used by pfkA_1, with a different sequence and representing a different phosphofructokinase type. According to these qRT-PCR data, in the GPL pathway, the expression of most of the enzymes for phospholipid biosynthesis was reduced during infection (Figure 7, shown in red), except the 1-acyl-sn-glycerol-3-phosphate acyltransferase (plsC), which increased at 24 hpi.
According to our calculations, the biosynthesis of GPL relies more on the downstream part of glycolysis and acyl-CoA, rather than proceeding directly from GAPDH in the upstream part of glycolysis (Figure 6). Expressions of PPP-related genes were not as intense as those in glycolysis. The expression of L-ribulose-5-phosphate 4-epimerase (araD) and transketolase (tktB) decreased by nearly 50% from 12 to 24 hpi, while transaldolase (tal) was slightly reduced. Expressions of the genes in TCA shows a complex picture of comparative activities: The sucABCD exhibited about twofold upregulation at 24 hpi, while fumarate hydratase (fumC) and malate dehydrogenase (mdhC) decreased at 24 hpi and almost invisibly expressed at 48 hpi. Moreover, the malonyl-CoA-ACP transacylase (fabD) was involved in the upstream of fatty acid biosynthesis (Table 3, FA1 (as calculated for pathway P67) and FA2 (modeled pathway P68); Figure 3) and associated with the formation of glycerolipids (Table 3, EMP/GPL (calculated flux in pathway P84); Figure 3). It was slightly downregulated at 24 hpi (Figure 7A). In addition, glutamine-fructose-6-phosphate transaminase (glmS) and CTP synthase (pyrG) are able to irreversibly convert glutamine to glutamate. glmS increased its expression by more than a 1.5-fold change at 24 hpi compared to that at 12 hpi, and it was still very active even at 48 hpi, the lysis phase. pyrG presented around 50% activity in both 24 and 48 hpi when compared to the 12 hpi. We assume that both of the enzymes may be actively functional in the transfer of glutamine to glutamate. glmS could serve for both EB and RB, while pyrG is mainly activated in RBs rather than EBs. Three genes in folate biosynthesis were validated. They were significantly decreased by even more than 50% in both 24 and 48 hpi.
The human umbilical vein endothelial cells (HUVECs) were also used as the host for Ct infection to make a comparison (Figure 7B). Target genes generally exhibited more expression (and also more deviations) in HUVECs than in HeLa229. Glycolysis, the PPP, and TCA in HUVECs presented similar trends of expression when compared to these pathways in HeLa229. In glycolysis, expression of pfkA_2 was twofold higher than that of pfkA_1 at 24 hpi, and threefold higher at 24 hpi compared to 36 hpi. Unlike in HeLa229, glyceraldehyde 3-phosphate dehydrogenase (gapA) was upregulated in HUVECs and expressed two times more at 24 hpi than at 12 hpi. In the PPP, the transketolases tktB and tal showed almost the same expression, but the ribulose-phosphate 3-epimerase (araD) was slightly upregulated in HUVECs. In TCA, the succinyl-CoA synthetase (suc) genes were overexpressed in both 24 hpi and 36 hpi when compared to those in HeLa229. The other genes involved in glycerophospholipid biosynthesis, fatty acid biosynthesis, glutamine/glutamate transformation, and folate biosynthesis, showed different regulation in HUVECs than in HeLa229. The glycerol-3-phosphate acyltransferases plsB, plsC, plsX together with the acyl-carrier-protein S-malonyltransferase (fabD) highly increased the regulation at 24hpi and 36hpi, which suggested the intensive activity of synthesizing glycerophospholipid in HUVECs. The active biosynthesis was also visible by the increased regulation of the dihydrofolate reductase (folA), the dihydropteroate synthase (folP), and the dihydroneopterin aldolase (folX) for folate synthesis, which were differential expressions compared to those in HeLa229. In addition, the expression of glmS was similar in both cell lines. However, pyrG, which was downregulated in HeLa229, displayed twofold higher upregulation at both 24 and 36 hpi in HUVECs. This suggests the Ct’s pyrG may be able to convert glutamine to glutamate as well as glmS.
Discussion
Constraint-Based Metabolic Modeling Enables to Study Ct Metabolism During Infection
In this work, Ct’s genome-scale metabolic network was first reconstructed based on the constraints, with 321 unique metabolites, 171 enzymes and 277 reactions. Many efforts have been made to elucidate the metabolic properties of Chlamydia trachomatis developmental forms during its biphasic life cycle (Saka et al., 2011; Omsland et al., 2012; Käding et al., 2014; Østergaard et al., 2016). Konig et al. (2017) reported the biphasic metabolism of a chlamydial symbiont, the Protochlamydia amoebophila UWE25 whose host is Acanthamoeba, by using an RNA-Sequencing approach. For the first time, our work compared the differences between EB and RB by quantitative pathways and not only based on the view of expressed genes or gene clusters. According to our results, both EBs and RBs are metabolically dynamic. Their metabolic differentiations are highly variable based on adaptation to the human host environment. With the support of the omics data, the network analysis helps to give an overview of Ct’s metabolism according to quantitative pathways. The network was calculated to have 84 pathways and modeled for both EB and RB in the time points of 20 hpi, 40 hpi and the lysis phase respectively. According to our analysis, EB is almost static compared to RB and has its activities centered on the PPP, glycolysis and GPL biosynthesis. Tricarboxylic acid cycle and fatty acid biosynthesis are relatively ineffective. The downstream part of glycolysis and upstream part of fatty acid biosynthesis contribute an efficient metabolic flux to phospholipid metabolism. Enzymes involved in nucleic acid metabolism are strongly expressed in RB, which may offer necessary GTP and ATP for folate biosynthesis and amino acid transformation. EB and RB both have folate biosynthesis pathway active, which utilizes glutamate and PABA to form folate and glycolaldehyde. An overall more intensive flux is present in RB than EB. There is more ATP and GTP available in RB, imported from the host or generated by purine and pyrimidine metabolism.
Genome-scale metabolic modeling is a useful method for microbial engineering and studying pathogenic metabolism. From single organism such as Mycoplasma genitalium (Suthers et al., 2009) and Methicillin-resistant Staphylococcus aureus (Choe et al., 2018) up to microbial communities (Thiele et al., 2013), metabolic modeling offers a new option to take a quantitative approach to the analysis of complex biological systems via the chemical and mathematical calculation of stoichiometric matrix.
How Active Are Elementary Bodies?
Chlamydia are active in infection. This is self-evident, however, the infective EBs are much less metabolically active than the more active replicating RBs. Extracellular EB’s metabolic activity was detected by Raman micro-spectroscopy (Haider et al., 2010). Omsland et al. (2012) also found the host-free EB could respond to specific metabolites. Nevertheless, the proteomics data by Østergaard et al. (2016) suggest that there is some protein expression also in EB, though less than in RB. An important limitation of extreme pathway modeling based flux calculations is that the activities are only relative and calculated within one organism. Hence, the “stronger” activity for any pathway in EB is only relative to other pathways and the residual activity could be quite low. We provide new data from qRT-PCR in order to find out how active EBs are, however, these data apply only to mRNA expression and not to direct enzyme activity. Nevertheless, this is in agreement to what has been observed in recent studies, Grieshaber et al. (2018) show that generally EBs have lower activity compared to RBs. However, they provide unequivocal proof that there is clearly some metabolic activity in EB and they could detect protein synthesis and active translation of mRNA in EB.
Chlamydia Metabolism Adapts to Different Cell Lines
The famous HeLa229 cell line is frequently used as the host of Ct infection. This tumor-derived cell line has a high metabolic rate and a high frequency in cell division. There are many limitations in gene expression studies with HeLa cell lines. It has been noted that some metabolic activities are influenced by the host cell (Stephens, 1999; Tan and Bavoil, 2012). When in HeLa cell lines, Ct’s TCA cycle is supposed to be highly downregulated and nucleic acid metabolism is particularly enriched. The observed TCA cycle, purine, and pyrimidine metabolism is also probably due to the influence of the host HeLa cells. Hence, for comparison, the human umbilical vein endothelial cells (HUVECs) were used as the host for Ct infection. Ct generally showed more upregulated gene expressions in HUVECs than in HeLa229 cells, especially in the biosynthesis of glycerophospholipid and folate (pls and fol).
The different gene expressions in different cell lines drive unstable and unpredictable deviations especially in studying pathogen metabolism. Whether the previous metabolic observations (Käding et al., 2014) in HeLa229 cell lines reveal the real metabolism of Ct in a natural infection is still an open question. Nevertheless, one approach to improve the metabolic study of Ct infection is to use a 3D human tissue model instead of cell lines. A 3D tissue model restores more appropriately the environment for studying the infection of an obligate human pathogen, and offers safer and more efficient support for therapeutic strategies and drug design in the future when compared to animal experiments or human cell lines.
Carbon and Nitrogen Source Uptake and Energy Production
Ct lacks a clear transcriptome response during adaptive change if the carbon source is switched from glucose to glutamate or α-ketoglutarate (Nicholson et al., 2004). Gluconeogenesis is important for regenerating glucose in Ct when it encounters different substrates. However, gluconeogenesis is also a process with high energy cost. Ct may acquire ATP from the host cell by ATP/ADP transporters and is also able to generate ATP itself according to genome and proteome data. Another important metabolite is glutamate from the host cell. Glutamate is involved in generating NADH, and involves ATP or GTP for triggering folate biosynthesis from the incomplete TCA cycle in Ct.
But where does the glutamate come from? Does Ct directly take glutamate from the host by glutamate transporter, or does it take glutamine by glutamine transporter, and then converts glutamine to glutamate by enzymes? Three glutamate transporters (CT_216, CT_230 and CT_401) are encoded in the genome (Østergaard et al., 2016). Iliffe-Lee and McClarty (2000) observed the glutamate transporter gltT (CT_401) in Ct’s carbon metabolism, however, transport of glutamine is still unclear. On the other hand, two enzymes encoded by gene glmS and pyrG provide capabilities of utilizing glutamine to transfer to glutamate in both cell lines of HeLa229 and HUVECs (Figure 7). glmS is upregulated nearly twofold in both cell lines from 12 to 24 hpi, and it is still active in the late lytic phases. pyrG is downregulated in HeLa229 cell lines during infection but comparatively upregulated in HUVECs. Moreover, the CTP synthase, product of pyrG, is functionally transcribed and translated during the mid and late stage of the Ct’s life cycle (Wylie et al., 1996). According to genome information (Stephens et al., 1998) and previous observations (Weiss, 1967), Ct transporters preferentially take up glutamate – not glutamine (Østergaard et al., 2016). What should not be ignored is that the Ct-infected host cell lacks an adaptive carbon catabolite repression when the carbon source changes from glucose to glutamate (Nicholson et al., 2004). Taken together, Ct’s utilization of glutamate seems to be dependent on the conversion of glutamine by glmS and pyrG, and may also profit from the intra and extra-cellular environment via its transporters.
Our pathway modeling shows that Chlamydial pathways generate energy rich compounds (e.g., NADH and NADPH). This includes glycolysis/gluconeogenesis (P5), folate biosynthesis (P33 and P51), glycerophospholipid biosynthesis (P83), and PPP (P84). According to the available pathways, Ct has quite flexible metabolic capabilities, not only between different forms but also with regard to different carbon source utilization. The exact mechanisms of the adaptation still need further study. What we can confirm is that both EB and RB are differentially metabolically active.
Kinases and Intermediates in Central Metabolism
Two phosphofructokinases are involved in glycolysis, 6-phosphofructokinase 1 (EC 2.7.1.11), and diphosphate-fructose-6-phosphate 1-phosphotransferase (EC 2.7.1.90). These are encoded by pfkA_1 (CT_205) and pfkA_2 (CT_207) respectively. The PfkA_2 is similar to PfkA_1, but utilizes diphosphate instead of ATP to catalyze a reversible reaction. Pfk_2 has been found in higher plants, some other eukaryotes, bacteria, and archaea, however, not in Homo sapiens. In human cells, this phosphorylation reaction is catalyzed by fructose-1,6-bisphosphatase (EC 3.1.3.11) instead. Hence, Ct’s PfkA_2 may be a good drug target for treating Ct infection, as this enzyme is not present in humans.
The expression of 1,6-fructose biphosphate aldolase (EC 4.1.2.13) is also able (aldolase B) to reversibly exchange fructose 1-phosphate (F1P) with dihydroxyacetone-P (old name: glycerone-P) and glyceraldehyde. However, due to the lack of fructose kinase in Ct, F1P cannot be transformed from fructose. Instead, F1P could possibly be generated as an intermediate in glycolysis, though it is unclear whether the 1,6-fructose bisphosphate aldolase will supply this. A similar situation concerns ribose 1-phosphate produced by ribose 5-phosphate isomerase A (EC 5.3.1.6) which is encoded by rpiA (CT_213). Whether F1P and R1P exist in Ct and what their functions are is still an open question.
How general are our findings? Well, HeLa229 cells are transformed cervical epithelial cells, while Huvecs are primary endothelial cells derived from human umbilical cord. We tested infection of both these cell lines with Chlamydia trachomatis and measured different time points of the infection. The differences in the gene expression show the adaptability of the pathogen depending on the availability of the metabolites and these conclusions should be general for different serovars. Although other serovars have a different genome, their metabolic genes are highly conserved, and so is the mode of intracellular parasitism in this respect. Hence, it is reasonable to expect for these similar results regarding metabolism.
Conclusion
We have described a first model of Ct metabolism after meticulous curation of all available data (proteomics, qRT-PCR data). However, there are no direct metabolite or metabolomics data available. The model takes all extreme pathways accessible for Ct into account. It infers detailed information on the pathway changes during infection including differences between EB and RB. Ct’s major active pathways are glycolysis, gluconeogenesis, GPL biosynthesis (support from host acetyl-CoA), and the PPP, while its incomplete TCA and fatty acid biosynthesis are inferred to be less active. The modeled metabolic pathways are much more active in RB than in EB. EB and RB utilize folate to generate NAD(P)H using independent pathways. The only low metabolic activity of EB involves the carbohydrate metabolism. RB utilizes energy rich compounds to generate ATP using nucleic acid metabolism enzymes. Experimental data to infer the metabolic model include proteomics experiments (model basis) as well as RT-PCR confirmation of selected enzyme mRNA expression differences at three time points of infection. The metabolic model delivers detailed insights into Ct metabolic adaptations during infection and is made available for detailed studies in Chlamydia infection biology.
Data Availability Statement
All datasets generated for this study are included in the manuscript/Supplementary Files.
Author Contributions
MY did all the bioinformatics analyses, supervised by TD. KR did all the experiments with initial input from MY. TR provided experimental expert advice. TD provided bioinformatics expert advice. TD led and guided the study. MY and TD drafted the manuscript. All authors participated in the data analysis, refinement of the data (experiments, modeling), and manuscript writing, and agreed to the final version of the manuscript.
Funding
This work was supported by DFG (GRK 2157 3D tissue infect; project number 270563345). The funder had no role in study design, data collection and analysis, decision to publish, or preparation of the manuscript. This article was published Open Access with the help of our University Open Access fund.
Conflict of Interest
The authors declare that the research was conducted in the absence of any commercial or financial relationships that could be construed as a potential conflict of interest.
Acknowledgments
We thank DFG (GRK 2157 3D tissue infect; project number 270563345) for funding. Native speaker corrections by Dr. Ulrike Rapp-Galmiche are highly appreciated.
Supplementary Material
The Supplementary Material for this article can be found online at: https://www.frontiersin.org/articles/10.3389/fmicb.2019.02350/full#supplementary-material
FILE S1 | Genes and reactions with annotations used in the construction of the metabolic model. It includes the gene names of Ct, reaction numbers according to KEGG, EC numbers, reversibility of the reaction, and all annotations.
FILE S2 | Ct metabolic flux model in SBML (level2) format. This model was next imported into YANAsquare to calculate metabolic fluxes.
FILE S3 | Null space matrix of the Ct metabolic flux model.
FILE S4 | Stoichiometry matrix of the Ct’s metabolic flux model.
FILE S5 | Results of all extreme pathways calculated by Ct’s model with data import of proteome from Østergaard et al. (2016). It shows pathway strengths quantitatively. Positive or negative signs in the values show the direction of the reaction. Positive values indicate a forward reaction, and negative values show that the reaction goes in the reverse direction. EB1, EB2, and EB3 show the calculated pathway strengths in elementary bodies at 20 hpi, 40 hpi and after 40 hpi, respectively. RB1, RB2, and RB3 provide the same information but for reticulate bodies. The EBRB values EBRB1-3 are calculated using the sum of the proteomic values of EB and RB as data import, this calculation infers the general metabolic pathway strengths of Ct. The average strength is marked by the “AVE” tag.
FILE S6 | Steady state calculated from the reconstructed model, showing all internal and external metabolites and flux strengths quantitatively. Internal and external metabolites are shown by black balls and red cones, respectively. The pathway with the strongest flux is shown as blue thick line (path from pyruvate→acetyl-CoA→malonyl-CoA = malonyl-ACP).
FILE S7 | Pathways differentially expressed in Ct’s different forms during infection. Detailed data for the Ct mixture during infection (EB and RB) as well as for EB alone and RB alone are given and color coded according to flux intensity. Early infection is always shown at the bottom, late infection shown at the top. Shown are flux strengths for three time points: at 20 hpi (hours post infection), 40 hpi and approximately 8 hours later (40 hpi post, see section “Materials and Methods”). The bar on top illustrates the color code: maximum intensity (dark blue) is 1, minimal intensity (white) is zero. Major extreme pathways inferred involve the strongest flux path from pyruvate to malonyl-ACP (P65), followed by the downstream of glycolysis (P5, P34, and P83), upstream of fatty acid biosynthesis (P66 and P67) and involved in biotin metabolism (P65). Cysteine biosynthesis also is inferred to have a strong flux (P16). Many reactions in nucleotide metabolism are calculated to have strong intensities (P8–P15, P31, P32, and P40–45). Only medium activity was inferred for glycolysis and glycerophospholipid pathway (P34 and P83), pentose phosphate pathway (P84) and folate biosynthesis or conversion (P33, P51, and P55). Very low activity at all times was inferred for fatty acid biosynthesis (P66 and P67), phenylalanine and tyrosine biosynthesis (P53 and P54), as well as porphyrin and chlorophyll metabolism (P29).
Footnotes
References
Abdelrahman, Y. M., and Belland, R. J. (2005). The chlamydial developmental cycle. FEMS Microbiol. Rev. 29, 949–959.
Adams, N. E., Thiaville, J. J., Proestos, J., Juarez-Vazquez, A. L., McCoy, A. J., Barona-Gomez, F., et al. (2014). Promiscuous and adaptable enzymes fill “holes” in the tetrahydrofolate pathway in Chlamydia species. mBio 5:e01378-14. doi: 10.1128/mBio.01378-14
Albrecht, M., Sharma, C. M., Reinhardt, R., Vogel, J., and Rudel, T. (2010). Deep sequencing-based discovery of the Chlamydia trachomatis transcriptome. Nucleic Acids Res. 38, 868–877. doi: 10.1093/nar/gkp1032
Belland, R. J., Zhong, G., Crane, D. D., Hogan, D., Sturdevant, D., Sharma, J., et al. (2003). Genomic transcriptional profiling of the developmental cycle of Chlamydia trachomatis. Proc. Natl. Acad. Sci. U.S.A. 100, 8478–8483. doi: 10.1073/pnas.1331135100
Betts-Hampikian, H. J., and Fields, K. A. (2011). Disulfide bonding within components of the Chlamydia Type III secretion apparatus correlates with development. J. Bacteriol. 193, 6950–6959. doi: 10.1128/JB.05163-11
Chesson, H. W., and Pinkerton, S. D. (2000). Sexually transmitted diseases and the increased risk for HIV transmission: implications for cost-effectiveness analyses of sexually transmitted disease prevention interventions. J. Acquir. Immune Defic. Syndr. 24, 48–56. doi: 10.1097/00042560-200005010-00009
Choe, D., Szubin, R., Dahesh, S., Cho, S., Nizet, V., Palsson, B., et al. (2018). Genome-scale analysis of Methicillin-resistant Staphylococcus aureus USA300 reveals a tradeoff between pathogenesis and drug resistance. Sci. Rep. 8:2215. doi: 10.1038/s41598-018-20661-1
Cocchiaro, J. L., Kumar, Y., Fischer, E. R., Hackstadt, T., and Valdivia, R. H. (2008). Cytoplasmic lipid droplets are translocated into the lumen of the Chlamydia trachomatis parasitophorous vacuole. Proc. Natl. Acad. Sci. U.S.A. 105, 9379–9384. doi: 10.1073/pnas.0712241105
Fan, H., Brunham, R. C., and McClarty, G. (1992). Acquisition and synthesis of folates by obligate intracellular bacteria of the genus Chlamydia. J. Clin. Invest. 90, 1803–1811. doi: 10.1172/jci116055
Grieshaber, S., Grieshaber, N., Yang, H., Baxter, B., Hackstadt, T., and Omsland, A. (2018). Impact of active metabolism on Chlamydia trachomatis elementary body transcript profile and infectivity. J. Bacteriol. 200:e00065-18. doi: 10.1128/JB.00065-18
Haider, S., Wagner, M., Schmid, M. C., Sixt, B. S., Christian, J. G., Hacker, G., et al. (2010). Raman microspectroscopy reveals long-term extracellular activity of Chlamydiae. Mol. Microbiol. 77, 687–700. doi: 10.1111/j.1365-2958.2010.07241.x
Harris, S. R., Clarke, I. N., Seth-Smith, H. M., Solomon, A. W., Cutcliffe, L. T., Marsh, P., et al. (2012). Whole-genome analysis of diverse Chlamydia trachomatis strains identifies phylogenetic relationships masked by current clinical typing. Nat. Genet. 44, 413–419. doi: 10.1038/ng.2214
Hove-Jensen, B., Andersen, K. R., Kilstrup, M., Martinussen, J., Switzer, R. L., and Willemoes, M. (2017). Phosphoribosyl diphosphate (PRPP): biosynthesis, enzymology, utilization, and metabolic significance. Microbiol. Mol. Biol. Rev. 81, e00040-16. doi: 10.1128/MMBR.00040-16
Iliffe-Lee, E. R., and McClarty, G. (2000). Regulation of carbon metabolism in Chlamydia trachomatis. Mol. Microbiol. 38, 20–30. doi: 10.1046/j.1365-2958.2000.02102.x
Käding, N., Szaszak, M., and Rupp, J. (2014). Imaging of Chlamydia and host cell metabolism. Future Microbiol. 9, 509–521. doi: 10.2217/fmb.14.13
Kaleta, C., Centler, F., and Dittrich, P. (2006). Analyzing molecular reaction networks: from pathways to chemical organizations. Mol. Biotechnol. 34, 117–123.
Kanehisa, M., and Goto, S. (2000). KEGG: kyoto encyclopedia of genes and genomes. Nucleic Acids Res. 28, 27–30. doi: 10.1093/nar/28.1.27
Karunakaran, K., Subbarayal, P., Vollmuth, N., and Rudel, T. (2015). Chlamydia-infected cells shed Gp96 to prevent chlamydial re-infection. Mol. Microbiol. 98, 694–711. doi: 10.1111/mmi.13151
Konig, L., Siegl, A., Penz, T., Haider, S., Wentrup, C., Polzin, J., et al. (2017). Biphasic metabolism and host interaction of a Chlamydial symbiont. mSystems 2:e00202-16. doi: 10.1128/mSystems.00202-16
Kumar, Y., Cocchiaro, J., and Valdivia, R. H. (2006). The obligate intracellular pathogen Chlamydia trachomatis targets host lipid droplets. Curr. Biol. 16, 1646–1651. doi: 10.1016/j.cub.2006.06.060
Liechti, G., Kuru, E., Packiam, M., Hsu, Y. P., Tekkam, S., Hall, E., et al. (2016). Pathogenic Chlamydia lack a classical sacculus but synthesize a narrow. PLoS Pathog. 12:e1005590. doi: 10.1371/journal.ppat.1005590
Liechti, G. W., Kuru, E., Hall, E., Kalinda, A., Brun, Y. V., VanNieuwenhze, M., et al. (2014). A new metabolic cell-wall labelling method reveals peptidoglycan in Chlamydia trachomatis. Nature 506, 507–510. doi: 10.1038/nature12892
Mehlitz, A., Eylert, E., Huber, C., Lindner, B., Vollmuth, N., Karunakaran, K., et al. (2017). Metabolic adaptation of Chlamydia trachomatis to mammalian host cells. Mol. Microbiol. 103, 1004–1019. doi: 10.1111/mmi.13603
Nicholson, T. L., Chiu, K., and Stephens, R. S. (2004). Chlamydia trachomatis lacks an adaptive response to changes in carbon source availability. Infect. Immun. 72, 4286–4289. doi: 10.1128/iai.72.7.4286-4289.2004
Omsland, A., Sager, J., Nair, V., Sturdevant, D. E., and Hackstadt, T. (2012). Developmental stage-specific metabolic and transcriptional activity of Chlamydia trachomatis in an axenic medium. Proc. Natl. Acad. Sci. U.S.A 109, 19781–19785. doi: 10.1073/pnas.1212831109
Orth, J. D., Thiele, I., and Palsson, B. Ø (2010). What is flux balance analysis. Nat. Biotechno.l 28, 245–248. doi: 10.1038/nbt.1614
Østergaard, O., Follmann, F., Olsen, A. W., Heegaard, N. H., Andersen, P., and Rosenkrands, I. (2016). Quantitative protein profiling of Chlamydia trachomatis growth forms reveals defense strategies against tryptophan starvation. Mol. Cell Proteomics 15, 3540–3550. doi: 10.1074/mcp.m116.061986
Pfeiffer, T., Sanchez-Valdenebro, I., Nuno, J. C., Montero, F., and Schuster, S. (1999). METATOOL: for studying metabolic networks. Bioinformatics 15, 251–257. doi: 10.1093/bioinformatics/15.3.251
Pilhofer, M., Aistleitner, K., Biboy, J., Gray, J., Kuru, E., Hall, E., et al. (2013). Discovery of Chlamydial peptidoglycan reveals bacteria with murein sacculi but without FtsZ. Nat. Commun. 4:2856. doi: 10.1038/ncomms3856
Read, T. D., Brunham, R. C., Shen, C., Gill, S. R., Heidelberg, J. F., White, O., et al. (2000). Genome sequences of Chlamydia trachomatis MoPn and Chlamydia pneumoniae AR39. Nucleic Acids Res. 28, 1397–1406. doi: 10.1093/nar/28.6.1397
Saka, H. A., Thompson, J. W., Chen, Y. S., Kumar, Y., Dubois, L. G., Moseley, M. A., et al. (2011). Quantitative proteomics reveals metabolic and pathogenic properties of Chlamydia trachomatis developmental forms. Mol. Microbiol. 82, 1185–1203. doi: 10.1111/j.1365-2958.2011.07877.x
Schomburg, I., Chang, A., and Schomburg, D. (2002). BRENDA, enzyme data and metabolic information. Nucleic Acids Res. 30, 47–49. doi: 10.1093/nar/30.1.47
Schwarz, R., Liang, C., Kaleta, C., Kuhnel, M., Hoffmann, E., Kuznetsov, S., et al. (2007). Integrated network reconstruction, visualization and analysis using YANAsquare. BMC Bioinform. 8:313. doi: 10.1186/1471-2105-8-313
Senior, K. (2012). Chlamydia: a much underestimated STI. Lancet Infect Dis 12, 517–518. doi: 10.1016/s1473-3099(12)70161-5
Skipp, P. J., Hughes, C., McKenna, T., Edwards, R., Langridge, J., Thomson, N. R., et al. (2016). Quantitative Proteomics of the infectious and replicative forms of Chlamydia trachomatis. PLoS One 11:e0149011. doi: 10.1371/journal.pone.0149011
Stephens, R. S. (1999). Chlamydia: Intracellular Biology, Pathogenesis, and Immunity. Grand Rapids: Zondervan.
Stephens, R. S., Kalman, S., Lammel, C., Fan, J., Marathe, R., Aravind, L., et al. (1998). Genome sequence of an obligate intracellular pathogen of humans: Chlamydia trachomatis. Science 282, 754–759. doi: 10.1126/science.282.5389.754
Subtil, A., and Dautry-Varsat, A. (2004). Chlamydia: five years A.G. (after genome). Curr. Opin. Microbiol. 7, 85–92. doi: 10.1016/j.mib.2003.12.012
Suthers, P. F., Dasika, M. S., Kumar, V. S., Denisov, G., Glass, J. I., and Maranas, C. D. (2009). A genome-scale metabolic reconstruction of Mycoplasma genitalium, iPS189. PLoS Comput. Biol. 5:e1000285. doi: 10.1371/journal.pcbi.1000285
Tan, M., and Bavoil, P. (2012). Intracellular Pathogens I: Chlamydiales, Vol. 1. Washington, DC: American Society for Microbiology Press.
Thiele, I., Swainston, N., Fleming, R. M., Hoppe, A., Sahoo, S., Aurich, M. K., et al. (2013). A community-driven global reconstruction of human metabolism. Nat. Biotechnol. 31, 419–425. doi: 10.1038/nbt.2488
von Kamp, A., and Schuster, S. (2006). Metatool 5.0: fast and flexible elementary modes analysis. Bioinformatics 22, 1930–1931. doi: 10.1093/bioinformatics/btl267
Weiss, E. (1967). Transaminase activity and other enzymatic reactions involving pyruvate and glutamate in Chlamydia (psittacosis-trachoma group). J. Bacteriol. 93, 177–184.
Wylie, J. L., Berry, J. D., and McClarty, G. (1996). Chlamydia trachomatis CTP synthetase: molecular characterization and developmental regulation of expression. Mol. Microbiol. 22, 631–642. doi: 10.1046/j.1365-2958.1996.d01-1717.x
Xie, G., Bonner, C. A., and Jensen, R. A. (2002). Dynamic diversity of the tryptophan pathway in Chlamydiae: reductive evolution and a novel operon for tryptophan recapture. Genome Biol. 3, research0051.1–research0051.17.
Keywords: Chlamydia trachomatis, metabolic modeling, metabolic flux, infection biology, elementary body, reticulate body
Citation: Yang M, Rajeeve K, Rudel T and Dandekar T (2019) Comprehensive Flux Modeling of Chlamydia trachomatis Proteome and qRT-PCR Data Indicate Biphasic Metabolic Differences Between Elementary Bodies and Reticulate Bodies During Infection. Front. Microbiol. 10:2350. doi: 10.3389/fmicb.2019.02350
Received: 13 July 2019; Accepted: 26 September 2019;
Published: 15 October 2019.
Edited by:
Ulrike Kappler, University of Queensland, AustraliaReviewed by:
Wilhelmina May Huston, University of Technology Sydney, AustraliaWerner Solbach, Universität zu Lübeck, Germany
Copyright © 2019 Yang, Rajeeve, Rudel and Dandekar. This is an open-access article distributed under the terms of the Creative Commons Attribution License (CC BY). The use, distribution or reproduction in other forums is permitted, provided the original author(s) and the copyright owner(s) are credited and that the original publication in this journal is cited, in accordance with accepted academic practice. No use, distribution or reproduction is permitted which does not comply with these terms.
*Correspondence: Thomas Dandekar, ZGFuZGVrYXJAYmlvemVudHJ1bS51bmktd3VlcnpidXJnLmRl