 Jie Rang
 Haocheng He
 Shuangqin YuanJianli TangZhudong LiuZiyuan XiaTahir Ali KhanShengbiao HuZiquan YuYibo HuYunjun SunWeitao HuangXuezhi Ding
 Liqiu Xia*
- Hunan Provincial Key Laboratory for Microbial Molecular Biology, State Key Laboratory of Development Biology of Freshwater Fish, College of Life Science, Hunan Normal University, Changsha, China
Butenyl-spinosyn, a secondary metabolite produced by Saccharopolyspora pogona, exhibits strong insecticidal activity than spinosyn. However, the low synthesis capacity and unknown metabolic characteristics of butenyl-spinosyn in wild-type S. pogona limit its broad application and metabolic engineering. Here, we showed that S. pogona exhibited increased glucose consumption ability and growth rate compared with S. spinosa, but the production of butenyl-spinosyn was much lower than that of spinosyn. To further elucidate the metabolic mechanism of these different phenotypes, we performed a comparative proteomic and metabolomic study on S. pogona and S. spinosa to identify the change in the abundance levels of proteins and metabolites. We found that the abundance of most proteins and metabolites associated with glucose transport, fatty acid metabolism, tricarboxylic acid cycle, amino acid metabolism, energy metabolism, purine and pyrimidine metabolism, and target product biosynthesis in S. pogona was higher than that in S. spinosa. However, the overall abundance of proteins involved in butenyl-spinosyn biosynthesis was much lower than that of the high-abundance protein chaperonin GroEL, such as the enzymes related to rhamnose synthesis. We speculated that these protein and metabolite abundance changes may be directly responsible for the above phenotypic changes in S. pogona and S. spinosa, especially affecting butenyl-spinosyn biosynthesis. Further studies revealed that the over-expression of the rhamnose synthetic genes and methionine adenosyltransferase gene could effectively improve the production of butenyl-spinosyn by 2.69- and 3.03-fold, respectively, confirming the reliability of this conjecture. This work presents the first comparative proteomics and metabolomics study of S. pogona and S. spinosa, providing new insights into the novel links of phenotypic change and metabolic difference between two strains. The result will be valuable in designing strategies to promote the biosynthesis of butenyl-spinosyn by metabolic engineering.
Introduction
Butenyl-spinosyn and spinosyn are secondary metabolites produced by Saccharopolyspora pogona (S. pogona) and Saccharopolyspora spinosa (S. spinosa), respectively. These two metabolites share similar chemical structure and belong to a new class of highly efficient and environment-friendly antibiotic insecticides that possess broad market potential (Dhakal et al., 2017; Lawler, 2017; White et al., 2017). These two analogs consist of a 21-carbon tetracyclic lactone containing the two deoxysugars forosamine and tri-O-methyl rhamnose, and their obvious difference is whether the C-21 position of the tetracyclic lactone system is attached to ethyl group (spinosyn) or butenyl group (butenyl-spinosyn) (Hahn et al., 2006; Lewer et al., 2009). The butenyl-spinosyn biosynthetic genes were initially cloned from S. pogona by using spinosyn biosynthetic genes as probes, and its coding sequences showed 94% identity to the DNA sequence of the spinosyn biosynthetic genes (Hahn et al., 2006). The only notable difference in the sequence comparisons was the presence of one additional polyketide synthase module in the butenyl-spinosyn gene sequence (busA) that was responsible for the two additional carbons in the C-21 tail of the spinosyn. This suggested that the spinosyn biosynthetic gene cluster might have been derived as an in-frame deletion from butenyl-spinosyn biosynthetic gene cluster. The biosynthetic pathways of butenyl-spinosyn and spinosyn are very similar (Jeon et al., 2017). These two metabolites are assembled by a polyketide pathway from acetate and propionate, forming a tetracyclic lactone, in which butenyl-spinosyn needs to consume an additional acetate. A neutral sugar (rhamnose) and an amino sugar (forosamine) are then coupled at the C9 and C17 site of the tetracyclic lactone, respectively. Rhamnose is subsequently methylated by three O-methyltransferases and eventually forms the final products butenyl-spinosyn and spinosyn (Huang et al., 2009). However, in the process of butenyl-spinosyn biosynthesis, amino sugars may be replaced by other sugar groups, such as amicetose, resulting in a wider variety of derivatives (Lewer et al., 2009).
Given the importance of butenyl-spinosyn and spinosyn, their insecticidal mechanism has been extensively studied in the past decades. These metabolites can kill susceptible insects by causing rapid excitation of the insect nervous system, probably through interaction and binding at nicotinacetylcholine and δ-amino butyric acid receptors (Millar and Denholm, 2007). Although butenyl-spinosyn and spinosyn share similar synthetic route and insecticidal mechanism, butenyl-spinosyn exhibits stronger insecticidal activity and broader insecticidal spectrum than spinosyn. For example, butenyl-spinosyn demonstrates good insecticidal activity against worldwide quarantine pest codling moth and the pest insect Helicoverpa assulta (Lewer et al., 2009; ValcÁrcel et al., 2015). Spinosyn has now been commercialized in products, such as Tracer, Success, SpinTor, Conserve, and Entrust (Blanc et al., 2004; Huang et al., 2009). The low biosynthetic ability of butenyl-spinosyn in wild-type S. pogona limits its commercial application. Hence, the production of butenyl-spinosyn must be improved.
At present, methods to enhance the butenyl-spinosyn and spinosyn production of strains have been extensively studied. The cyclic AMP receptor protein (crp) gene has been overexpressed in S. spinosa, improving spinosyns yield by 1.28-fold compared with that of the wild-type strain (Xu et al., 2014). A knock-out of manB, which codes for phosphomanmomutase in S. spinosa, increases spinosyn yield by 1.8-fold compared with the original strain (Liu et al., 2017). Other genes, such as pepA (Yang et al., 2016), vhb (Luo et al., 2012), and metE (Yang et al., 2015), can also affect spinosyn biosynthesis. Li et al. found that the over-expression of pnp, which encodes for polynucleotide phosphorylase in S. pogona, can affect strain growth and butenyl-spinosyn biosynthesis (Li et al., 2018). Although these reports demonstrate that some genes play important roles in the biosynthesis of target products, their production is not remarkably increased. Therefore, new target genes that directly affect the biosynthesis of butenyl-spinosyn and spinosyn must be urgently discovered.
Primary metabolic activities, such as central carbon metabolism, amino acid metabolism, energy metabolism, purine and pyrimidine metabolism play an important role in strain growth and secondary metabolite biosynthesis (Sun et al., 2017; Schniete et al., 2018). Wang et al. (2017a) discovered that central carbon metabolism influences cellulase production in Bacillus licheniformis. Sainz et al. (2017) reported that amino acids affect the growth of Gluconobacter and Acetobacter. Acetyl-CoA, malonyl-CoA, methylmalonyl-CoA, rhamnose, forosamine and S-adenosyl methionine are important precursors for butenyl-spinosyn biosynthesis and are also available from primary metabolic pathways, such as acetyl-CoA produced by glycolysis pathway and fatty acid degradation metabolism, S-adenosylmethionine produced by the cysteine and methionine metabolism, indicating a novel link between primary metabolism and butenyl-spinosyn biosynthesis. However, the key functional genes affecting the butenyl-spinosyn biosynthesis in primary metabolism pathway have not been fully studied.
In the current study, we aimed to explore the effect of metabolic differences on strain growth, glucose consumption, phosphate utilization, and antibiotic biosynthesis by comparing the phylogenetically coherent and functionally similar strains S. pogona and S. spinosa and to identify a series of key functional genes. We first analyzed the difference on strain growth, glucose consumption, phosphate utilization, and target product production between the two strains and found that S. pogona exhibited stronger glucose and phosphate consumption ability and growth rate but showed low target product biosynthetic ability compared with S. spinosa. Proteomics and metabolomic was then used to compare the differences in gene expression and metabolite abundance between the two strains under the same growth conditions. Through Gene Ontology (GO) and Kyoto Encyclopedia of Genes and Gnomes (KEGG) database analysis, we focused on the changes in the abundance of proteins and metabolites associated with primary metabolic pathways and the synthetic pathway of target products. We found at least 48 differential abundant proteins that may greatly affect strain growth, glucose and phosphate utilization, and butenyl-spinosyn biosynthesis. Using these datasets, we over-expressed the rhamnose synthetic genes and methionine adenosyltransferase gene in S. pogona and greatly increased the production of the target product. The results observed in this paper not only aided in elucidating how the metabolic differences affect phenotypic changes in S. pogona and S. spinosa but also provided key target genes for promoting butenyl-spinosyn biosynthesis.
Materials and Methods
Bacterial Strains and Growth Conditions
The bacterial strains used in this study are listed in Table 1. All Escherichia coli strains were grown at 37°C in Luria-Bertani broth (Jira et al., 2018). The spores of S. pogona and S. spinosa and their derivatives were activated in complete synthetic medium (per liter: 10 g of glucose, 45 g of trypticase soy broth, 9 g of yeast extract, and 2.2 g of MgSO4⋅7H2O). The bacteria were cultured at 30°C for 48 h, and a 2.5 mL aliquot of the seed culture was transferred into a 300 mL baffled flask containing 50 mL of synthetic fermentation medium (SFM; per liter: 1 g of KNO3, 0.01 g of FeSO4⋅7H2O, 0.5 g of K2HPO4⋅3H2O, 0.5 g of MgSO4⋅7H2O, 20 g of glucose, 4 g of yeast extract, 4 g of tryptone; pH of 7.2) and incubated at 30°C (Yang et al., 2014). If necessary, 50 μg/mL apramycin (Apra) was added into the medium.
Table 1. Strains and plasmids used in this study.
Cultivation Profile Analysis of S. pogona and S. spinosa
To monitor the growth profile of S. pogona and S. spinosa in the SFM, the optical density of the culture at 600 nm (OD600) was analyzed to determine its cell concentration during fermentation. The cells were collected every 12 h for strain growth curve measurement by UV scanning. Supernatants were collected every 12 h during fermentation to determine the glucose concentration by using glucose assay kit (A031, Huilishengwu) until the glucose was used up. Supernatants were collected every 48 h during fermentation to determine the phosphate concentration by phosphomolybdenum blue spectrophotometry (Sun and Wang, 2014). To compare the production difference of butenyl-spinosyn and spinosyn produced by S. pogona and S. spinosa, respectively, we collected the cells at the 10th day in SFM for quantification and identification using HPLC and LC-MS/MS; sample processing and testing were conducted as described previously with slight modification (Lewer et al., 2009; Tang et al., 2011). Final culture was mixed with equal volume of acetone for 2 h, followed by centrifugation at 10,000 g for 10 min. After filtration through 0.22 μm Millipore filters, the supernatants (10 μL) were analyzed by high-performance liquid chromatography (Agilent 1290, United States) using a C18 reverse-phase column (AQ12S05-1546WT). For spinosyn, the column was developed at a flow rate of 0.5 mL/min by mobile phase methanol/acetonitrile/2% aqueous ammonium acetate (v/v/v = 45:45:10), each sample lasted 10 min with the isocratic elution (100% B) (12). While for butenyl-spinosyn, it was washed at a flow rate of 0.5 mL/min by gradient elution with mobile phase A (10 mM ammonium acetate) and mobile phase B (methanol/acetonitrile 1:1), each sample lasted 20 min with the following gradient: 60% B (2.5 min hold) ramped to a final mobile phase concentration of 100% B for 10.5 min (3 min hold). The two analogs were monitored at a wavelength of 250 nm. Then, the chromatographic peaks of the target products were verified by Thermo LTQ XL ion trap mass spectrometry in the positive spray ionization mode (Thermo Scientific, United States). The 15 μL samples (Chromatographic peak collected) were loaded onto a C18 column (LAGV-25005-102130, Thermo Scientific, United States) respectively and gradient eluted with the elution buffer at 300 μL/min. The elution buffer composed of solvent A (water, 0.1% formic acid, v/v) and solvent B (methanol, 0.1% formic acid, v/v). For spinosyn A and D, each chromatographic separation lasted 13 min with the following gradient: 50% B ramped to a final mobile phase concentration of 80% B for 6 min (2 min hold). For butenyl-spinosyn, each chromatographic separation lasted 25 min with the following gradient: 50% B (4 min hold) ramped to a final mobile phase concentration of 100% B for 15 min (4 min hold). The mass analyzer was scanned over a mass range of 80–800 m/z. Data analysis and instrument operations were performed under Xcaliber software control. The Helicoverpa armigera bioassay was used to verify whether the collected chromatographic peak had insecticidal activity as described previously (Li et al., 2018). Fermentation experiments were conducted in triplicate.
Sample Preparation for Proteome Analysis
S. pogona and S. spinosa cells were harvested (8,000 g, 10 min, 4°C) after 4 days of culture, washed four times by resuspending the cell pellet in 20 mL of fresh PBS (10 mM, pH 7.8, pre-chilled at 4°C), and quickly frozen in liquid nitrogen. Protein extraction was performed as described previously (Yang et al., 2014). Samples were prepared from three biological replicates. Each protein extract (300 μg) was reduced with 500 mM dithiothreitol (DTT) at room temperature for 60 min and then alkylated with 500 mM iodoacetamide at room temperature in the dark for 60 min. Excess iodoacetamide was quenched with 15 mM DTT for 15 min at room temperature. The sample solutions were then incubated overnight with trypsin at a trypsin/protein ratio of 1:50 (w/w) at 37°C. Tryptic peptides were desalted and concentrated on an Oasis HLB sample cartridge column (Waters Corporation, MA, United States). Subsequently, the samples were labeled with an iTraq reagent in accordance with the manufacturer’s protocol (ABSciex, Framingham, MA, United States) and then lyophilized for further 2D online LC-MS analysis.
2D-LC-MS/MS Analysis
2D chromatography was conducted on an Eksigent nanoLC-UltraTM1D System (AB SCIEX, Concord, ON, United States). The lyophilized SCX fractions were re-dissolved in 2% acetonitrile and 0.1% formic acid and then loaded on a ChromXP C18 (3 μm, 120 Å) nanoLC trap column. Online trapping and the desalting were performed at 2 μL/min for 10 min with 100% solvent A. The solvents were composed of water/acetonitrile/formic acid (A, 98%/2%/0.1%; B, 2%/98%/0.1%). An elution gradient of 5–38% acetonitrile (0.1% formic acid) in 70 min gradient was then employed on an analytical column (75 μm × 15 cm C18, 3 μm, 120 Å, ChromXP Eksigent). LC-MS/MS analysis was performed using a TripleTOF 5600 System (SCIEX, Concord, ON, United States) fitted with a Nanospray III source. Data were acquired at an ion spray voltage of 2.4 kV, a curtain gas of 30 PSI, a nebulizer gas of 5 PSI, and an interface heater temperature of 150°C. MS was operated with TOF-MS scans. For information dependent acquisition (IDA), the survey scans were acquired in 250 ms, and up to 30 product ion scans (80 ms) were collected if the threshold of 260 counts was exceeded and with a + 2 to + 5 charge state. Rolling collision energy setting was applied to all precursor ions for collision-induced dissociation. Dynamic exclusion was set to 16 s.
Protein Identification and Quantification
MS/MS data were analyzed for protein identification and quantification using the ProteinPilot software v.4.5 (Sciex Inc., United States). The utilized protein database was the protein sequence set of all Saccharopolyspora strains. False discovery rate (FDR) was estimated via a reverse database strategy, and only proteins below the threshold of 1% of FDR were further considered. The differential abundant proteins (DAPs) were defined in the iTraq experiment on the basis of the following criteria: unique peptides ≥ 1, P-value < 0.05, and fold change > 1.33 or < 0.75. Only spots present in all the replicate gels were considered for subsequent analysis. The DAPs were annotated using the GO database1, and proteins were classified based on functional annotations using the GO terms for cellular components, biological processes, and molecular functions. The metabolic pathway analysis of DAPs was conducted using the KEGG database2.
Determination of Intracellular Metabolites by UHPLCQ-TOF/MS
For metabolomic analysis, samples were collected at 4 days and from three biological replicates. The sample treatment methods used were as described by Wentzel et al. with some modifications (Wentzel et al., 2012). 10 mL of culture broth were collected and centrifuged, the samples were transferred to centrifuge tubes (1.5 mL) and mixed with 400 μL of methanol/acetonitrile (1:1, v/v). The tubes were vortexed for 30 s, incubated for 10 min at −20°C, and then centrifuged at 14,000 g for 15 min at 4°C. The supernatants were collected and dried with nitrogen, and then, the lyophilized powder was stored at −80°C prior to analysis. Lyophilized samples were reconstituted by dissolving in 100 μL of solvent mixture containing water/acetonitrile (5:5, v/v). The samples were vortexed for 1 min and centrifuged at 14,000 g for 15 min at 4°C. The supernatants were subjected to UHPLCQ-TOF/MS analysis. In parallel with the preparation of the test samples, pooled quality control (QC) samples were prepared by mixing equal amounts (30 μL) of each sample. The QC samples were utilized to monitor the UHPLC-Q-TOF/MS response in real-time.
Metabolic profiling of samples was performed on an Agilent 1290 Infinity LC system (Agilent Technologies, Santa-Clara, CA, United States) coupled with an AB SCIEX Triple TOF 5600 System (AB SCIEX, Framingham, MA, United States). Chromatographic separation was conducted on ACQUITY HSS T3 1.8 μm (2.1 × 100 mm) columns for both positive and negative models. The column temperature was set at 25°C for operation. The mobile phases of 0.1% formic acid in water (A) and 0.1% formic acid in acetonitrile (B) were used in positive ionization mode, while 0.5 mM ammonium fluoride in water (C) and acetonitrile (D) were used in negative ionization mode. In the positive (negative) model, the elution gradient initially started with 1% B (D) for 1 min, linearly increased to 100% B (D) at 8 min, was maintained for 2 min, and then returned to 1% B (D) for approximately 2 min of equilibrium. The delivery flow rate was 300 μL/min, and a 2 μL aliquot of each sample was injected onto the column. TOF/MS was performed on both ionization modes. Electrospray ionization source conditions on triple TOF were set as follows: ion source gas 1, 40 psi; ion source gas 2, 60 psi; curtain gas, 30 psi; source temperature, 650°C; ion spray voltage floating, 5000 V(+) and −4500 V (−). Information-dependent acquisition, an artificial intelligence-based product ion scan mode, was used to detect and identify MS/MS spectra. The parameters were set as follows: declustering potential, 60 V (+) and −60 V (−); collision energy, 50 V (+) and −20 V (−); exclude isotopes within 4 Da, candidate ions to monitor per cycle: 10. The analysis process was conducted with the assistance of Applied Protein Technology Co., Ltd. (Shanghai, China).
Metabolomic Data Analysis
The raw data generated by UPLC-Q-TOF/MS were converted into mzML format files using the Proteo Wizard MS converter tool and then subjected to data processing using XCMS online software3. The data were subsequently processed using XCMS software for peak alignment and data filtering. For peak picking, the following parameters were used:centWave m/z = 25 ppm, peak width = c(10,60), prefilter = c(10, 100). For peak grouping, bw = 5, mzwid = 0.025, minfrac = 0.5 were used. Compound identification of metabolites was performed by comparing of accuracy m/z value (<25 ppm), and MS/MS spectra with an in-house database established with available authentic standards. After normalized to total peak intensity, the processed data were uploaded into SIMCA-P (version 14.1, Umetrics, Umea, Sweden) for statistical analysis. Partial-least squares discrimination analysis (PLS-DA) was conducted as a supervised method to identify the important variables with discriminative power. PLS-DA models were validated based on the multiple correlation coefficient (R2) and cross-validated R2 (Q2) in cross-validation and permutation tests by applying 200 iterations (P > 0.001). The significance of the biomarkers was evaluated by calculating the variable importance in projection (VIP) score (>1) from the OPLS-DA model. For the univariate analysis, specific biomarkers were compared between S. pogona and S. spinosa by employing Student’s T-test. A p-value less than 0.05 indicated a significantly different metabolite.
Over-Expression of the Rhamnose Synthetic Genes and Methionine Adenosyltransferase Gene in S. pogona
The gene fragments gdh + kre, gtt, and epi were amplified from the genomic DNA of S. spinosa by using primer pairs P1/P2, P3/P4, and P5/P6 (Supplementary Table 1), respectively. The PCR products of gdh + kre, gtt, and epi were ligated to pMD18-T to generate the plasmids pMDGK, pMDGT, and pMDE, respectively. To construct all of the four genes in one vector, we first cloned them into a pMD18-T clone vector by restriction enzyme digestion and ligation. Subsequently, the clone was subcloned into the E. coli–Streptomyces shuttle expression vector pJN100 to obtain pJNRM. The gene fragment metK was amplified from the genomic DNA of S. pogona by using primer pairs P7/P8 (Supplementary Table 1). The PCR product of metK was ligated to pMD18-T to generate the plasmid pMDME. Subsequently, the clone was subcloned into the E. coli–Streptomyces shuttle expression vector pKCcas9dO to obtain pKCcas9-metK.
The pJNRM and pKCcas9-metK vectors were then transferred into S. pogona through protoplast transformation by employing a previously published method (Ma et al., 2014), respectively. Apramycin (50 μg/mL) was used to select transformants. The transformants named SPOG-RM and SPOG-ME were confirmed by PCR using primers for the apramycin resistance gene (Supplementary Table 1).
RNA Isolation and qRT-PCR
For RNA isolation for quantitative reverse transcription-PCR (qRT-PCR), all strains were cultivated in SFM at 30°C. Four-day cultures (1 mL) were collected, and the cells were harvested via centrifugation at 8,000 g for 5 min at 4°C. Total RNAs were separately isolated using TRIzol Reagent (Invitrogen). RNA concentration and purity were determined by measuring the ratio of OD260 nm to OD280 nm. cDNA synthesis was performed using a High-Capacity cDNA Archive kit (Fermentas) in accordance with manufacturer’s instructions. qRT-PCR amplification was performed using Power SYBRR Green PCR Master Mix (Applied Biosystems), as previously described (Yang et al., 2014). The primer sequences used in qRT-PCR were designed with Primer Premier 5.0 and are listed in Supplementary Table 1. The transcript generated from the 16S rRNA gene was used for normalization. Results are presented as the means of four replicate experiments.
Statistical Analysis
All data in this study were stated as means ± Standard deviation (SD), and analysis by Student’s t-test, with ∗p < 0.05, ∗∗p < 0.01, ns, no significant.
Results and Discussion
Qualitative and Quantitative Analyses of Butenyl-Spinosyn and Spinosyn in SFM
Butenyl-spinosyn and spinosyn were extracted from the SFM of S. pogona and S. spinosa and then examined through HPLC and LC-MS/MS in accordance with the method described above (Lewer et al., 2009; Tang et al., 2011). The results of HPLC test showed that the fermentation broth of S. spinosa had obvious chromatographic peaks at 5.5 and 6.7 min respectively (Figure 1A), while the fermentation broth of S. pogona had obvious chromatographic peaks at 5.5 min (Figure 1D), and their characteristic absorption wavelength was 250 nm. For S. spinosa, all tested samples revealed two chromatographic peaks with the same retention times as those of the standard spinosyn A and spinosyn D (Figures 1B,C). The eluent collected were further confirmed by LC-MS/MS, showing a measured m/z of 732.6 and 747.0 (M + H)+ which were consistent with the molecular formula C41H65NO10 for spinosyn A and C42H67NO10 for spinosyn D, respectively (Supplementary Figures 1, 2). For S. pogona, bioassay result showed that the collected eluent corresponding to the chromatographic peak at 5.5 min had obvious insecticidal activity against the larvae of Helicoverpa armigera (Figures 1E,F). Then, the eluent collected was separated and purified several times to obtain relatively pure chromatographic peaks, and a substance with a m/z = 650 was identified through LC-MS analysis, and a rhamnose ion fragment with a m/z = 189 can also be identified by secondary mass spectrometry analysis (Supplementary Figure 3). Compared with the structures of butenyl-spinosyn derivatives reported by Paul et al. (2014), this substance was identified as the butenyl-spinosyn components spinosyn αc. Next, the chromatographic peak area was used as a basis for comparing the production differences of butenyl-spinosyn and spinosyn. The peak area of butenyl-spinosyn in the S. pogona was 472.8 ± 59.05 mAU*s, while the total peak area of spinosyn A and D in the S. spinosa was 2330.1 ± 87.75 mAU*s. This result indicates S. pogona exhibited lower synthesis ability for butenyl-spinosyn compared with that of S. spinosa for spinosyn, although butenyl-spinosyn exhibits a strong insecticidal effect (Li et al., 2018).
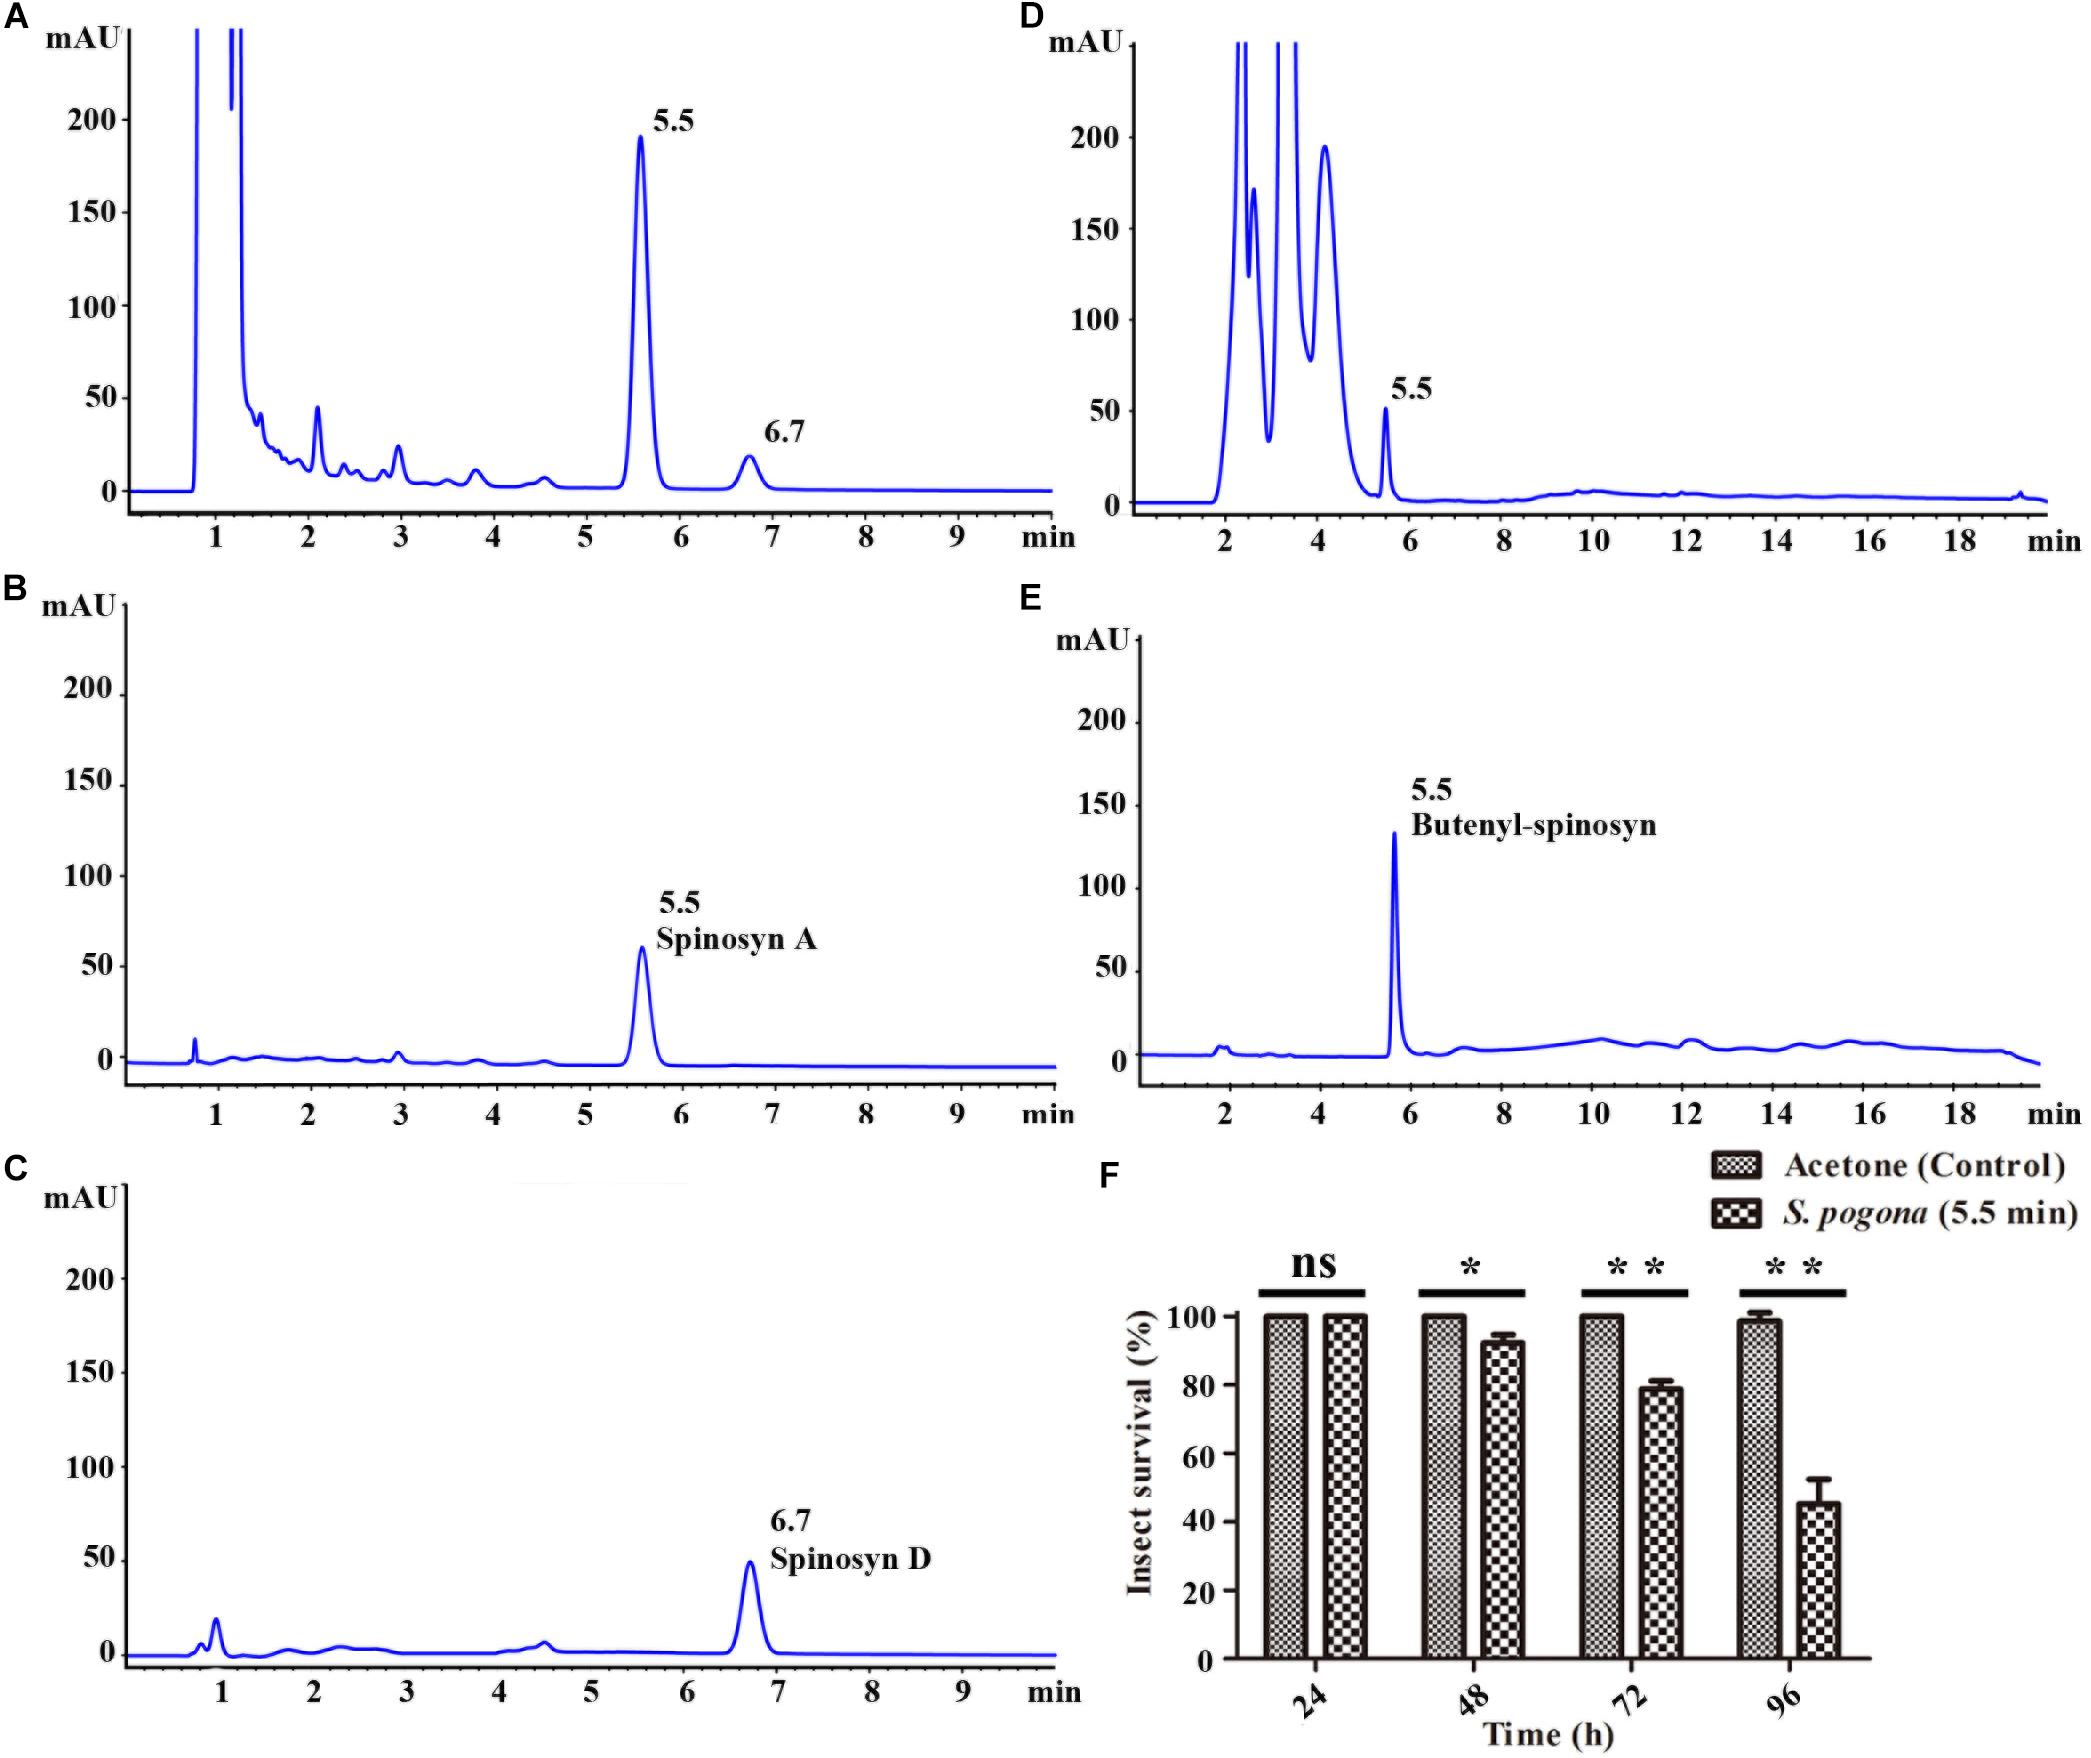
Figure 1. HPLC analysis of spinosyn and butenyl-spinosyn. (A) Fermentation broth of wild-type strain S. spinosa. (B) Standard spinosyn A. (C) Standard spinosyn D. (D) Fermentation broth of wild-type strain S. pogona. (E) Purified butenyl-spinosyn. (F) Analysis of insecticidal activity of H. armigera of the eluent collected at 5.5 min. *p < 0.05, **p < 0.01, ns, no significant.
Cultivation Profile Analysis of S. pogona and S. spinosa
Bacterial biomass and precursor supply are the main factors controlling secondary metabolite biosynthesis (Latha et al., 2017). We hypothesized that the strain growth rate and precursor supply ability of S. pogona and S. spinosa may show significant differences. Under most circumstances, glucose is the preferred carbon source for living organisms (Wu et al., 2016; Zeng et al., 2017). In the present study, we selected a glucose-rich culture medium and performed a comparative analysis of strain growth and glucose consumption in S. pogona and S. spinosa (Figure 2A). We first analyzed cell concentration by determining OD600 and found that S. pogona quickly entered the logarithmic phase at the duration of approximately 96 h. In contrast with the long logarithmic phase, a relatively short stationary phase (24 h), followed by rapid entry into the decline phase was shown by S. pogona. For S. spinosa, its growth rate was slower than that of S. pogona early in growth. However, its bacterial density decreased slowly during the recession, which the final bacterial density of S. spinosa was 1.65-fold that of S. pogona (Figure 2A). We continued to analyze glucose consumption in S. pogona and S. spinosa and found that the glucose utilization was in agreement with the growth tendency of these two strains, which was rapidly reduced during the logarithmic phase and was almost exhausted during the stationary phase. In S. pogona, however, glucose utilization was fast, and glucose was almost exhausted at 96 h, causing S. pogona to prematurely enter into the stationary and decline phases during the middle stage due to insufficient glucose (Figure 2A). In the soil-dwelling actinomycetes, the concentration of inorganic phosphate in the culture media is one of the most important nutritional factors affecting both growth and differentiation, and secondary metabolite biosynthesis (Antonio et al., 2010). We analyzed the phosphate consumption in S. pogona and S. spinosa and found that the phosphate concentration in the extracellular environment of the S. pogona was lower than that of the S. spinosa in early growth, which means that the utilization of phosphate by S. pogona is higher than S. spinosa (Figure 2B). The differences in strain growth, glucose and phosphate utilization indicated considerable metabolic differences between S. pogona and S. spinosa.
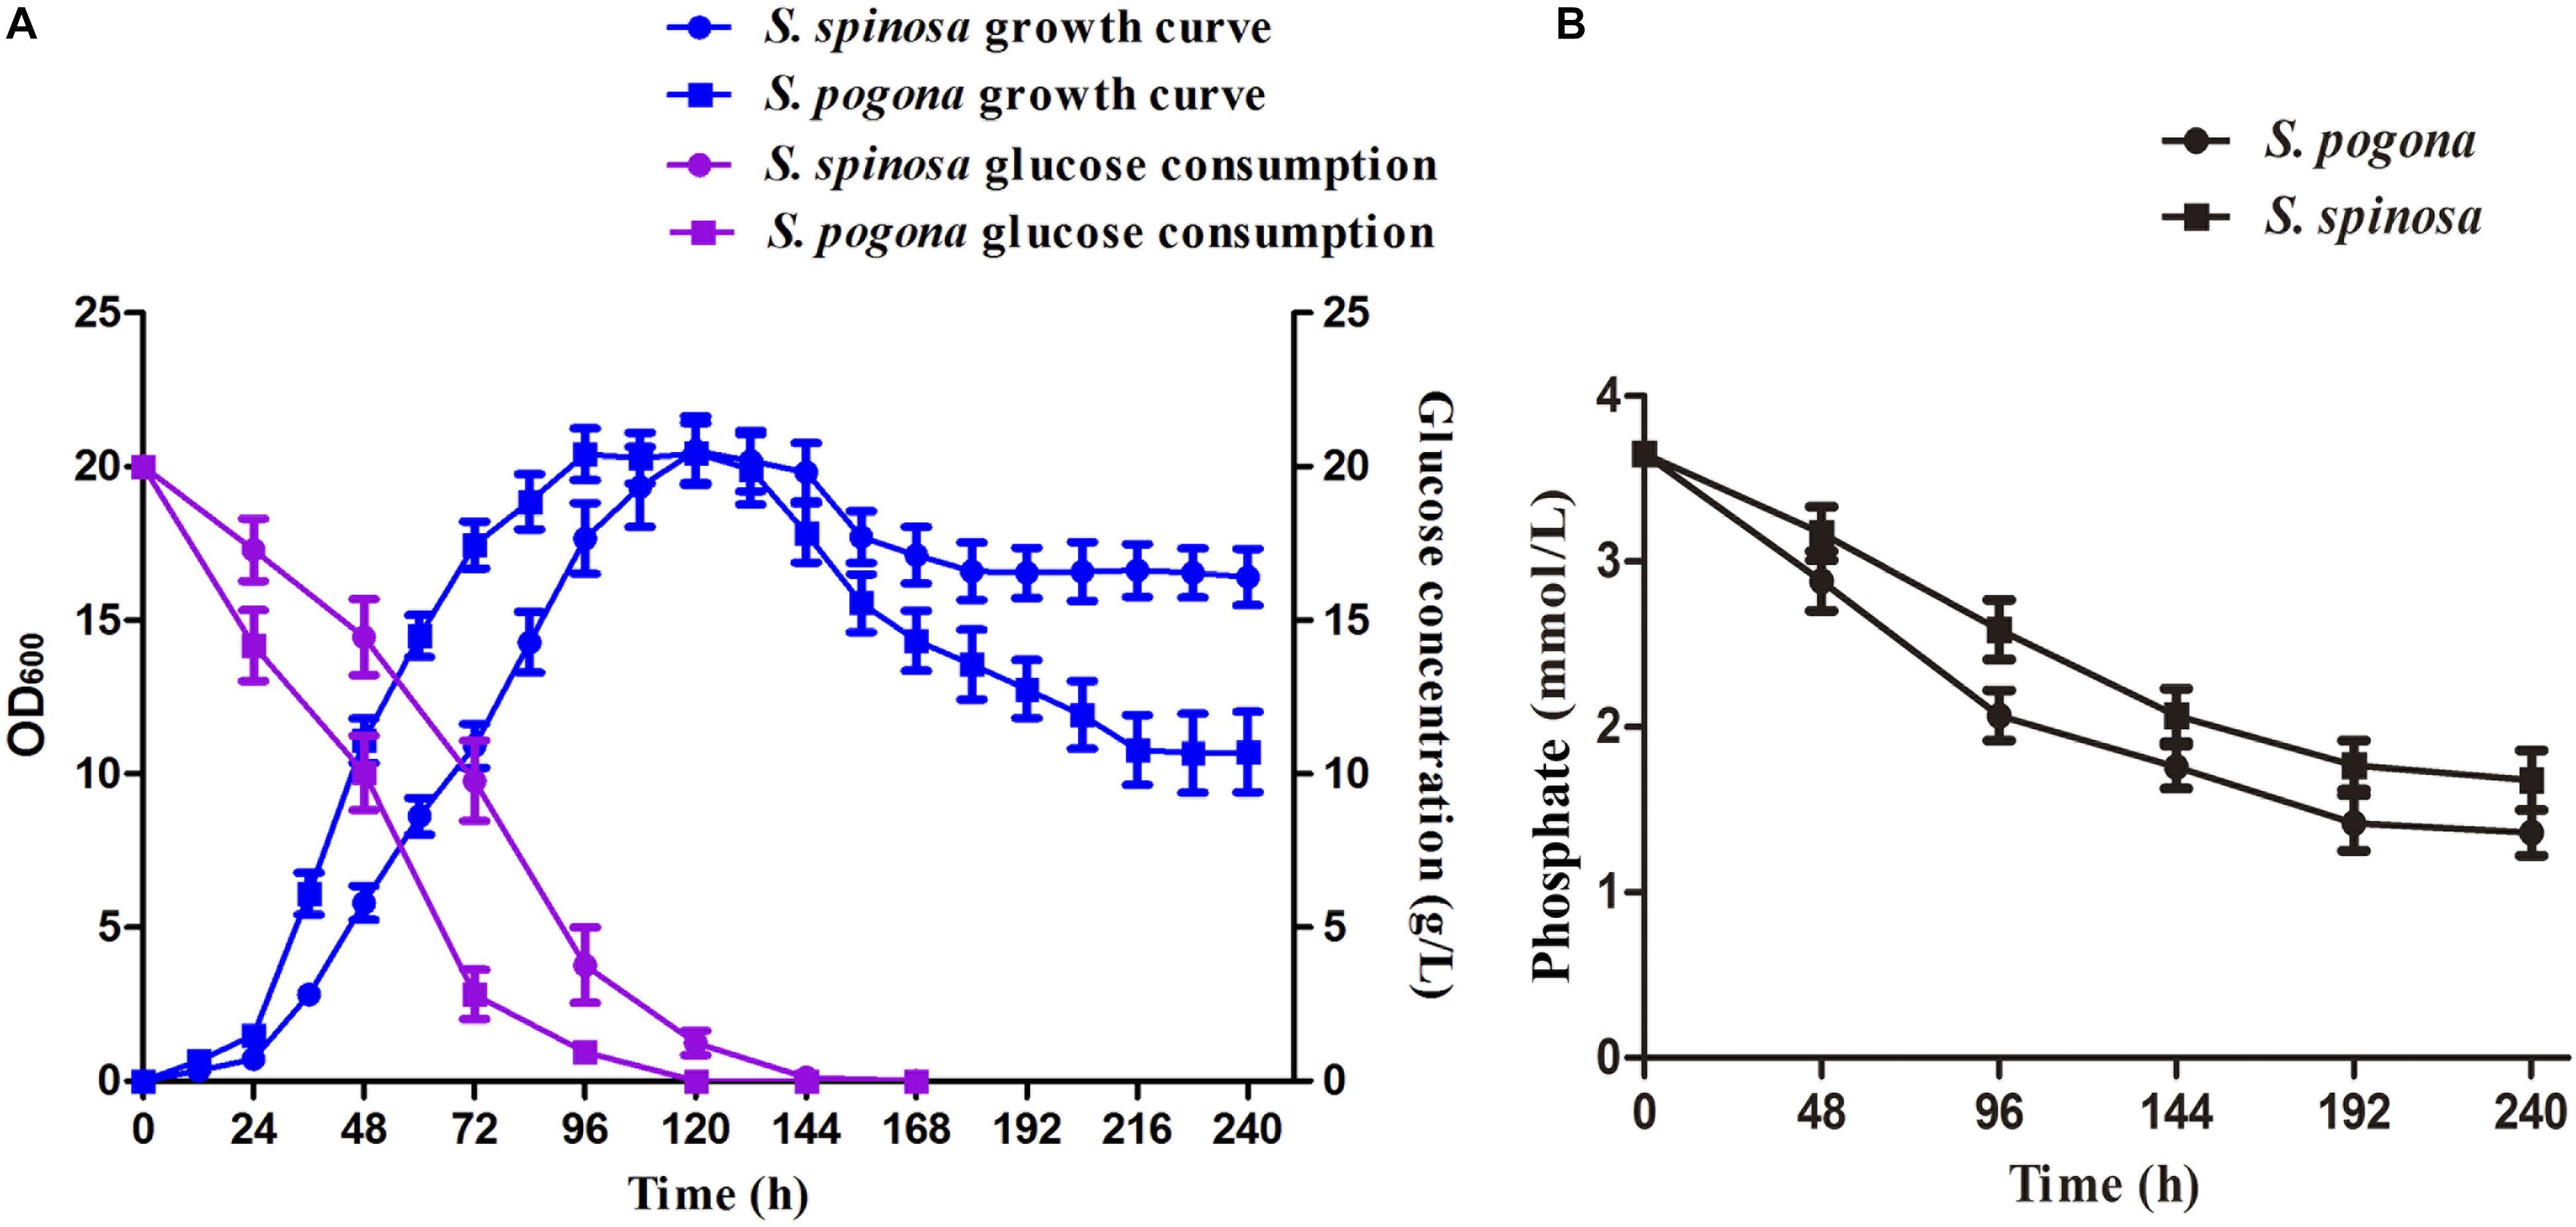
Figure 2. Comparison of growth characteristics between S. pogona and S. spinosa. (A) Growth kinetics and glucose consumption analysis. (B) Determination of phosphate in SFM.
Profiling of S. pogona and S. spinosa Proteome Under Glucose-Rich Conditions and Major Protein Expression Pattern Analysis
To further understand the causes of the phenotypic differences between S. pogona and S. spinosa, we examined the protein expression profiles in glucose-containing SFM. Samples for proteome profiling were obtained at stationary phases (4 days) to analyze the key factors affecting the phenotypic changes. Proteins isolated from three independent samples within the same phase were mixed and fragmented using trypsin. The resulting mass spectrum data were searched against the Saccharopolyspora proteome database. A total of 5,207 proteins were identified, 2,894 of which were identified in all of the samples, which were common proteins identified by S. pogona and S. spinosa, representing approximately 29.80 and 32.15% of the predicted proteome for S. pogona and S. spinosa, respectively (Data Set S1 and Supplementary Figure 4). A previous proteomics study on S. spinosa found 1,579 expressed proteins (17.54% of predicted proteome) (Yang et al., 2014), which was remarkably lower than the 2,894 expressed proteins (32.15% of predicted proteome) identified in this present study, indicating the feasibility of analytical method.
To evaluate the possible function of these proteins, we carried out GO and KEGG functional annotation analysis (Figure 3 and Supplementary Figure 5). The analysis results showed that these proteins were widely involved in metabolism, genetic information processing, and environmental information processing. To reveal the metabolic differences between S. pogona and S. spinosa from the biological system level, we estimated the abundance value of all proteins identified in this study, and the protein abundance scales are listed in Dataset S1. Some similarities and differences existed in the most highly expressed proteins between the two strains (Table 2). The most abundant protein in S. pogona and S. spinosa was the chaperonin GroEL, which assists in protein folding to ensure the success of important biological processes and respectively accounts for 4.35 and 6.41% of the species’ non-redundant proteome. In the present study, other proteins, including elongation factor Tu, aconitate hydratase AcnA, and F0F1 ATP synthase subunit alpha/beta, were also highly expressed in S. pogona and S. spinosa, indicating that these two strains exhibited strong metabolism and translation abilities. However, among the top 15 high-abundance proteins, five unique proteins were observed in each strain (Table 2). These proteins included type I glutamate-ammonia ligase, a hypothetical protein (WP_029535058.1), ATP-dependent Clp protease ATP-binding subunit, phosphopyruvate hydratase, and polynucleotide phosphorylase in S. pogona and cyclic nucleotide-binding domain-containing protein, methionine adenosyltransferase, type I glyceraldehyde-3-phosphate dehydrogenase, molecular chaperone DnaK, and NDMA-dependent alcohol dehydrogenase in S. spinosa. The differential expression of these high-abundance proteins likely affected the phenotypic changes between the two strains. For example, methionine adenosyltransferase (metK) can catalyze L-methionine conversion into S-adenosyl-L-methionine, which is an important source for butenyl-spinosyn and spinosyn methylation (Yang et al., 2015). However, its detection abundance of in S. spinosa was remarkably higher than that of S. pogona (2.41-fold), which may ultimately affect the biosynthesis of target products. These high-abundance proteins play a role in key metabolic pathways, such as glycolysis, tricarboxylic acid (TCA) cycle, oxidative phosphorylation, and RNA degradation, as well as basic cell function and maintenance.
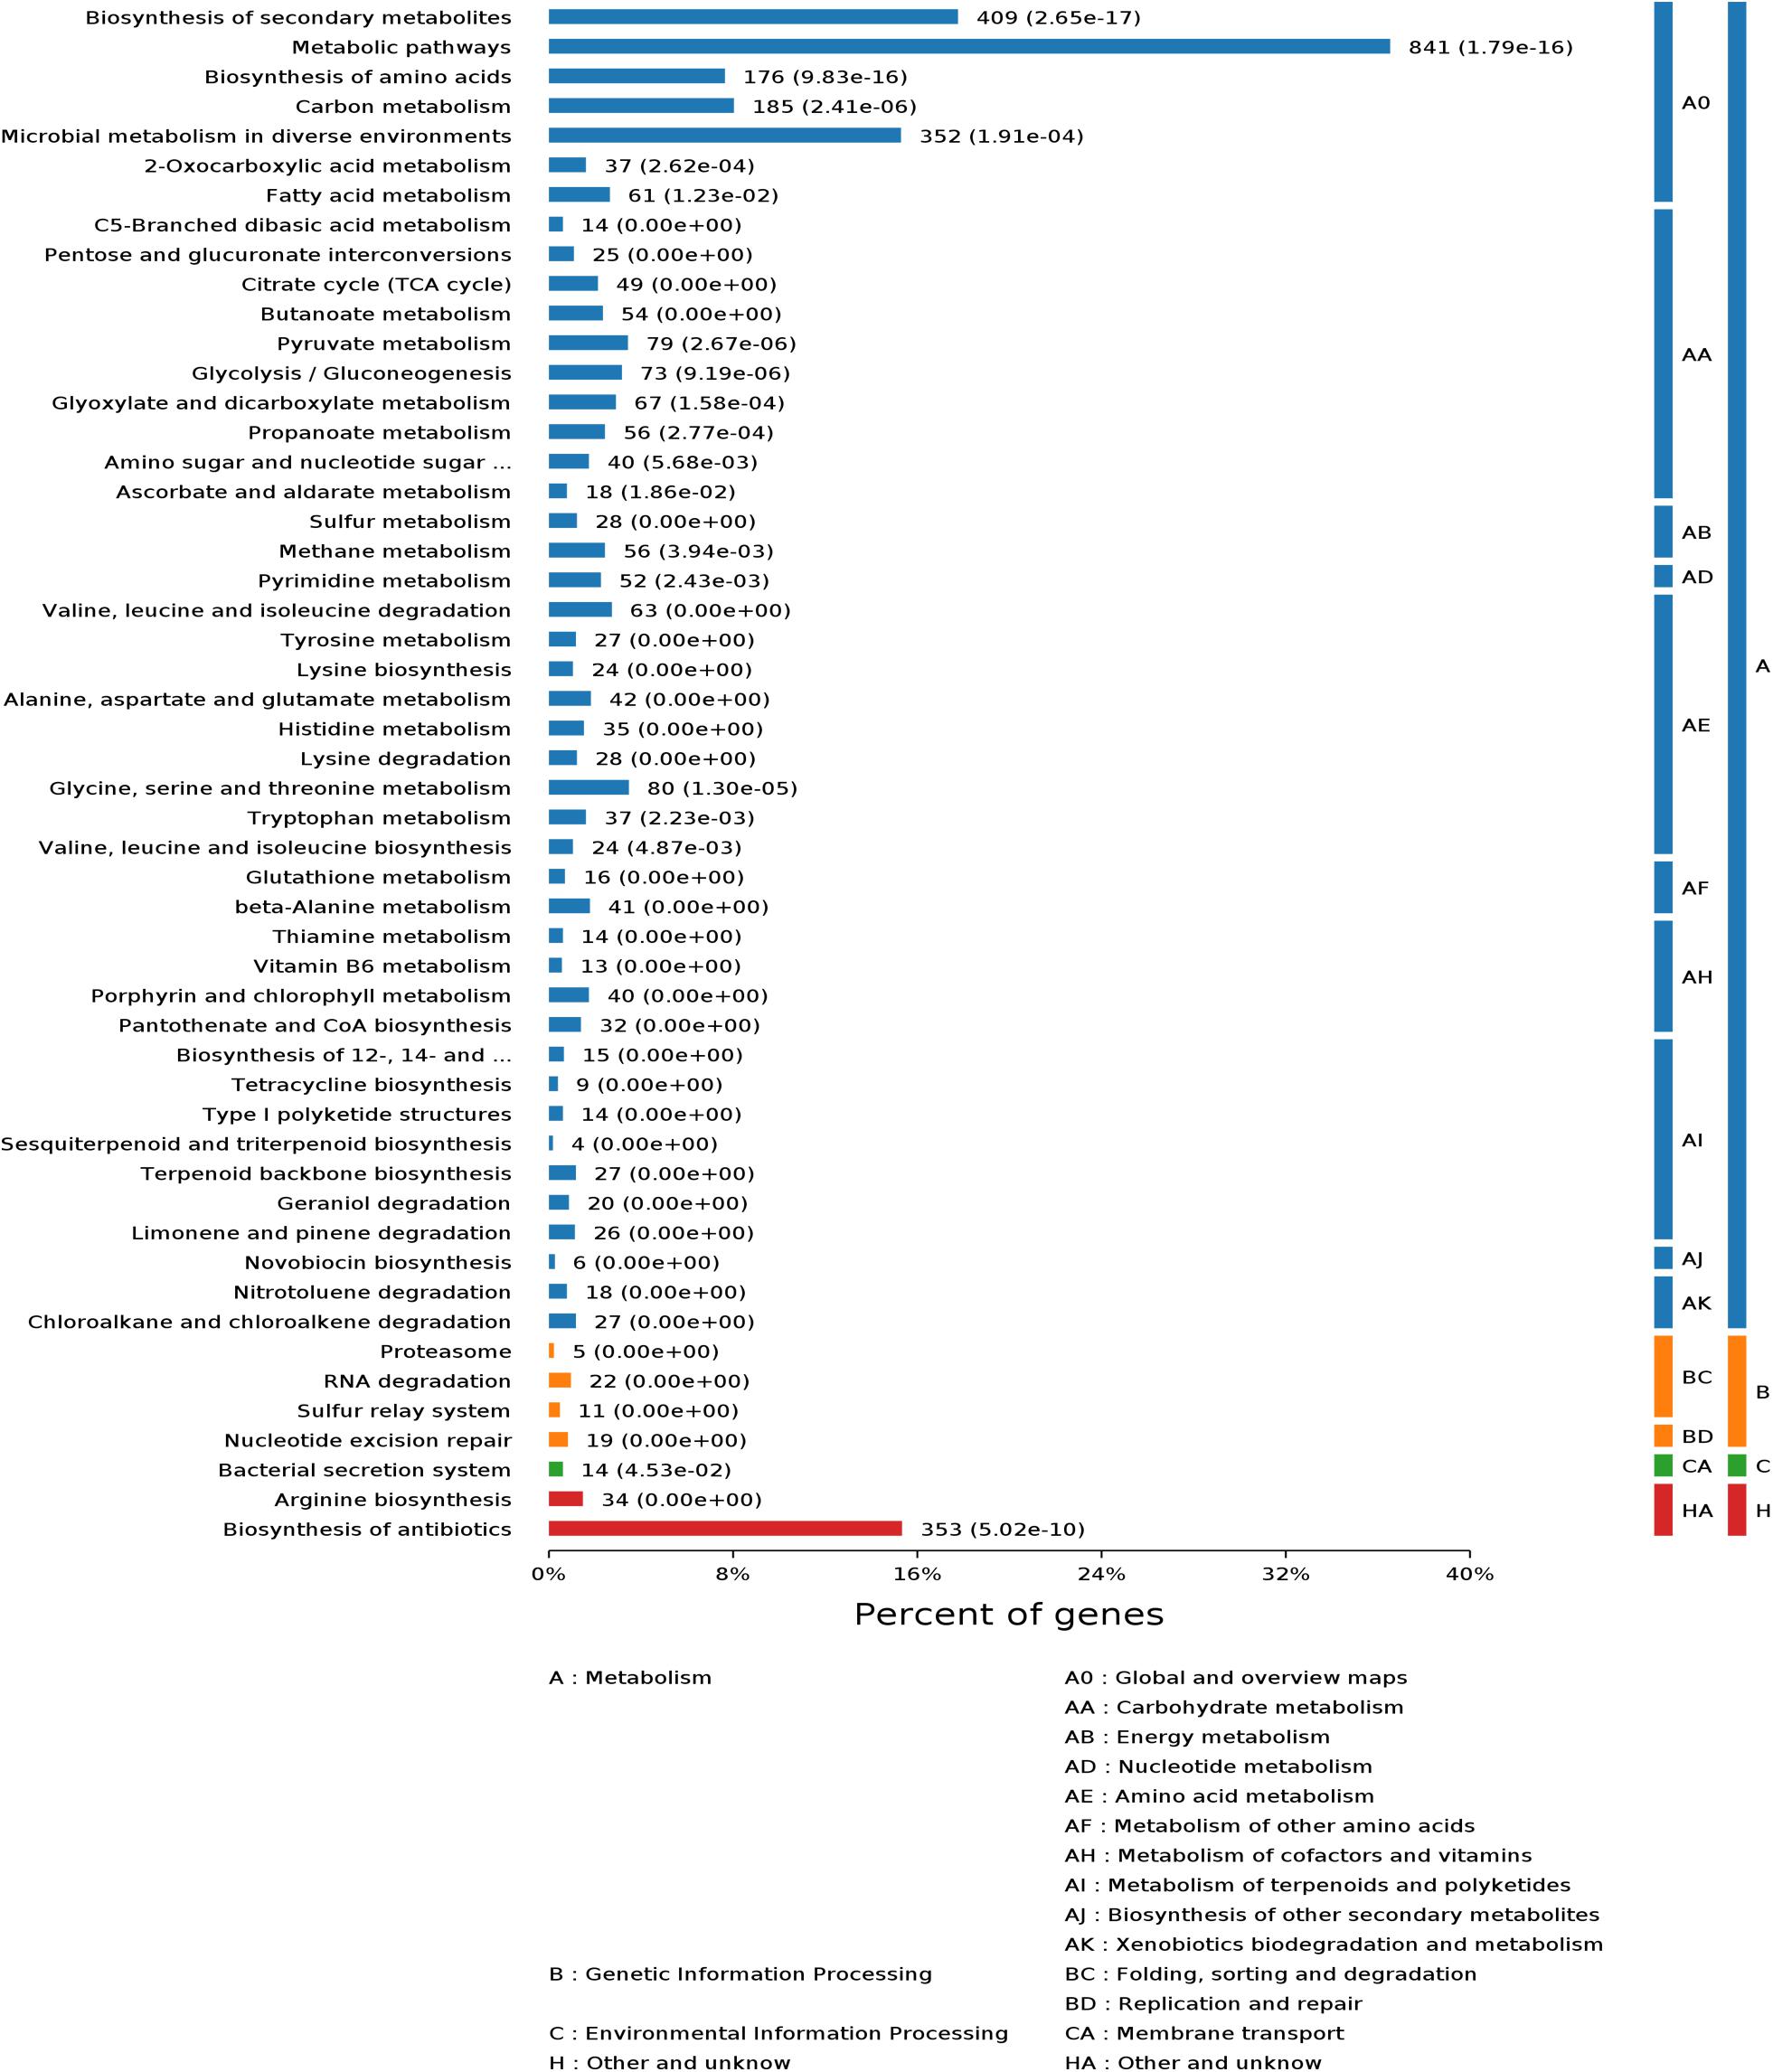
Figure 3. Kyoto encyclopedia of genes and genomes (KEGG) functional classification of the common proteins in S. pogona and S. spinosa. The number of genes associated with each pathway is indicated.
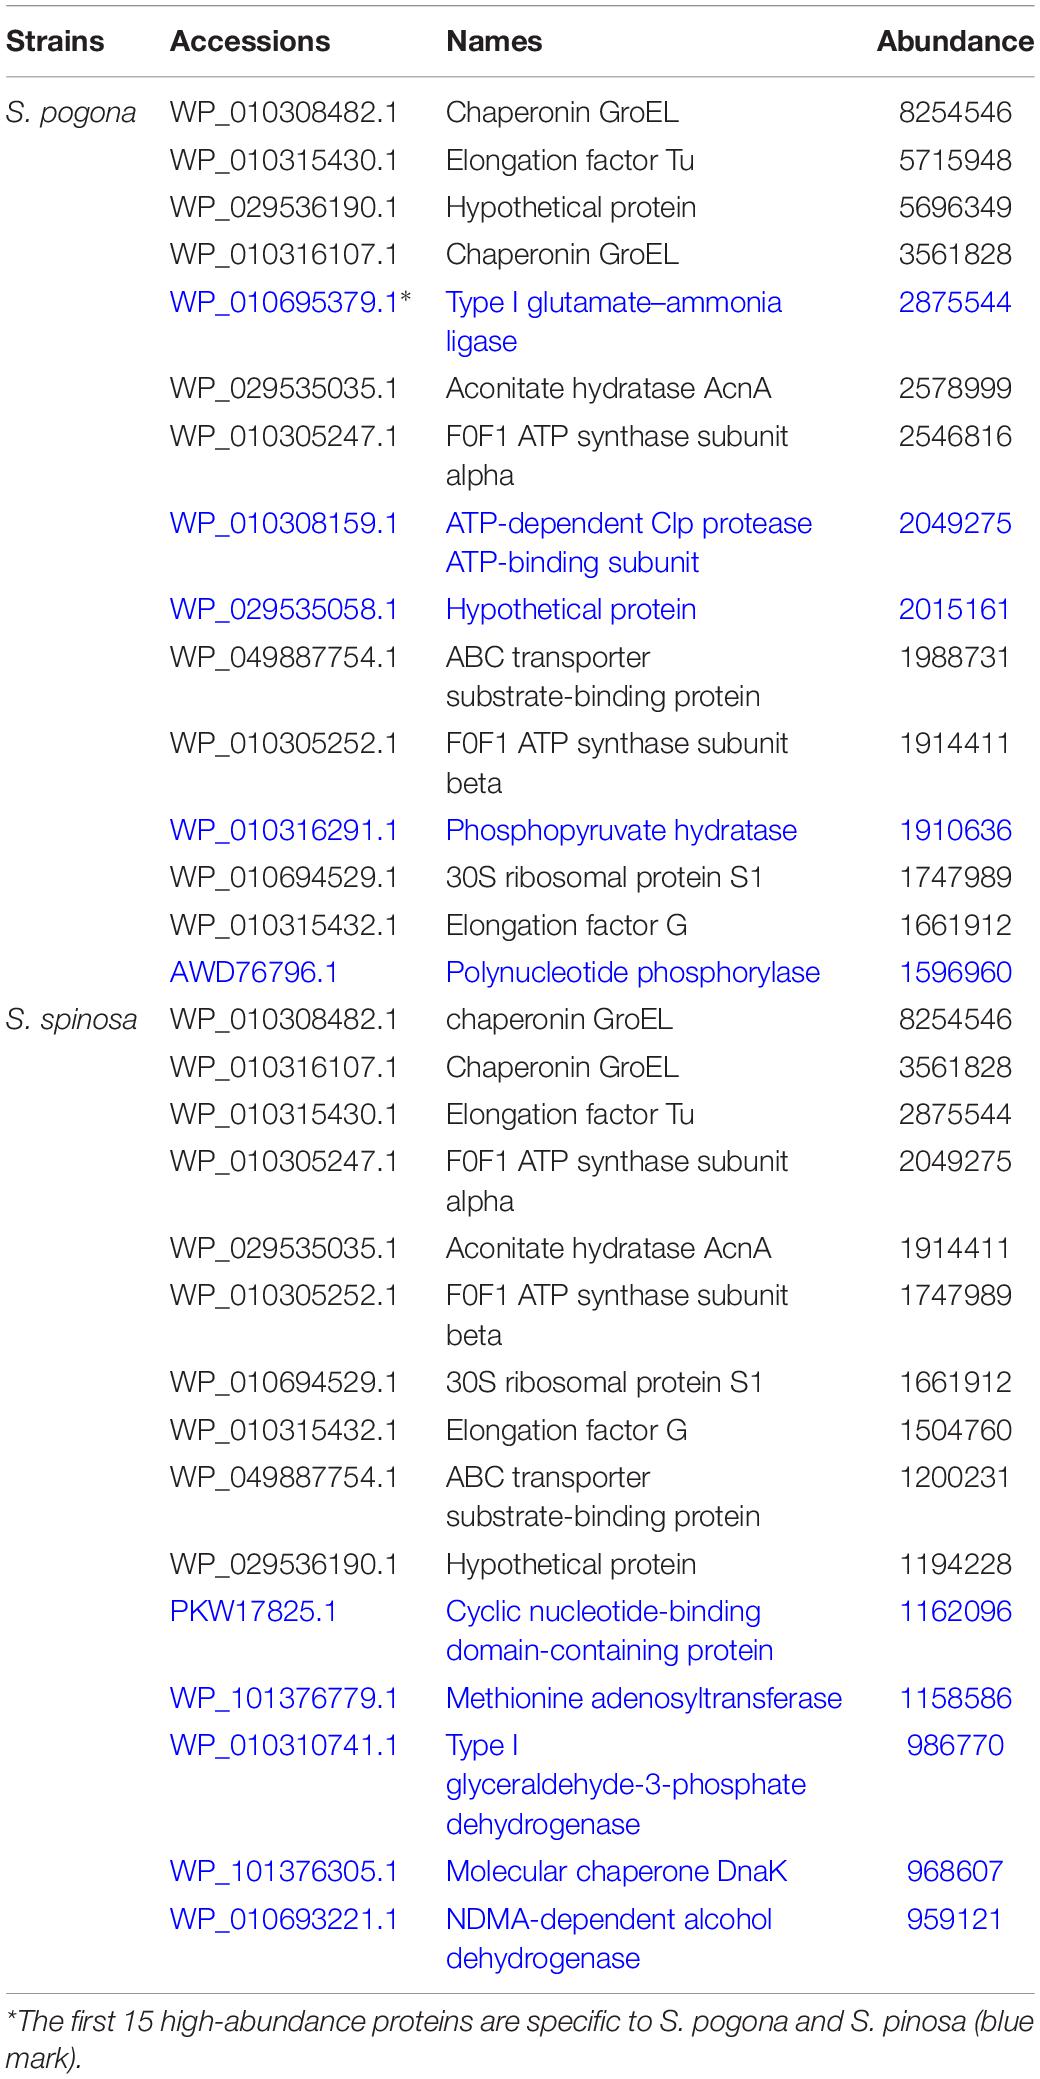
Table 2. Most highly expressed proteins from S. pogona and S. spinosa under glucose-rich conditions.
Metabolomic Analysis of the Key Metabolites and Pathways Associated With Strain Growth Development and Target Products Biosynthesis
In order to analyze whether the changes of metabolite abundance related to strain growth development and target products biosynthesis were consistent with the changes of proteins, detection of intracellular metabolome was carried out by UHPLCQ-TOF/MS (Fu et al., 2019). In this study, the samples at stationary phases (4 days) were also used for metabolomic profiling to analyze the correlation with proteomic data. As a result, 235 intracellular metabolites were identified and quantified by UHPLCQ-TOF/MS, including sugars, amino acids, organic acids, fatty acids, phospholipids and their derivatives (Data Set S2). Next, PLS-DA modeling was employed to evaluate the relationship between metabolite expression and sample difference (Sindt et al., 2018). The R2(X), R2(Y), and Q2 of PLS-DA model for positive and negative ion scanning were 0.779, 1, 0.994, and 0.771, 1, 0.993, respectively, highlighting the reliability of the PLS-DA analysis (Figures 4A,B). To further identify which metabolites were closely associated with the sample difference, the VIP was generated by OPLS-DA analysis. A higher VIP score suggested that the metabolites contributed more significantly to sample difference (Wang et al., 2017b). A total of 150 identified metabolites were selected (VIP score > 1, Fold change > 1.5 and < 0.67, and p < 0.05) for further investigation. Abundances of all the metabolites are shown in Figure 4C by the heat map. These metabolites were mainly involved in glycolysis, TCA cycle, fatty acid degradation metabolism, amino acid metabolism, purine and pyrimidine metabolism, and most of them were related to the synthesis of acetyl-CoA, rhamnose, forosamine and S-adenosyl-L-methionine. In addition, we found that the detection abundance of phospholipid molecules involved in cell membrane composition in S. pogona was mostly higher than that of the S. spinosa, such as phosphorylcholine (4.57), 1-oleoyl-sn-glycero-3-phosphocholine (6.77), glycerophosphocholine (3.42), phosphatidylethanolamine (1.83), etc. (Data Set S3). These detection results effectively reflected the difference in metabolic pathways between the S. pogona and S. spinosa.
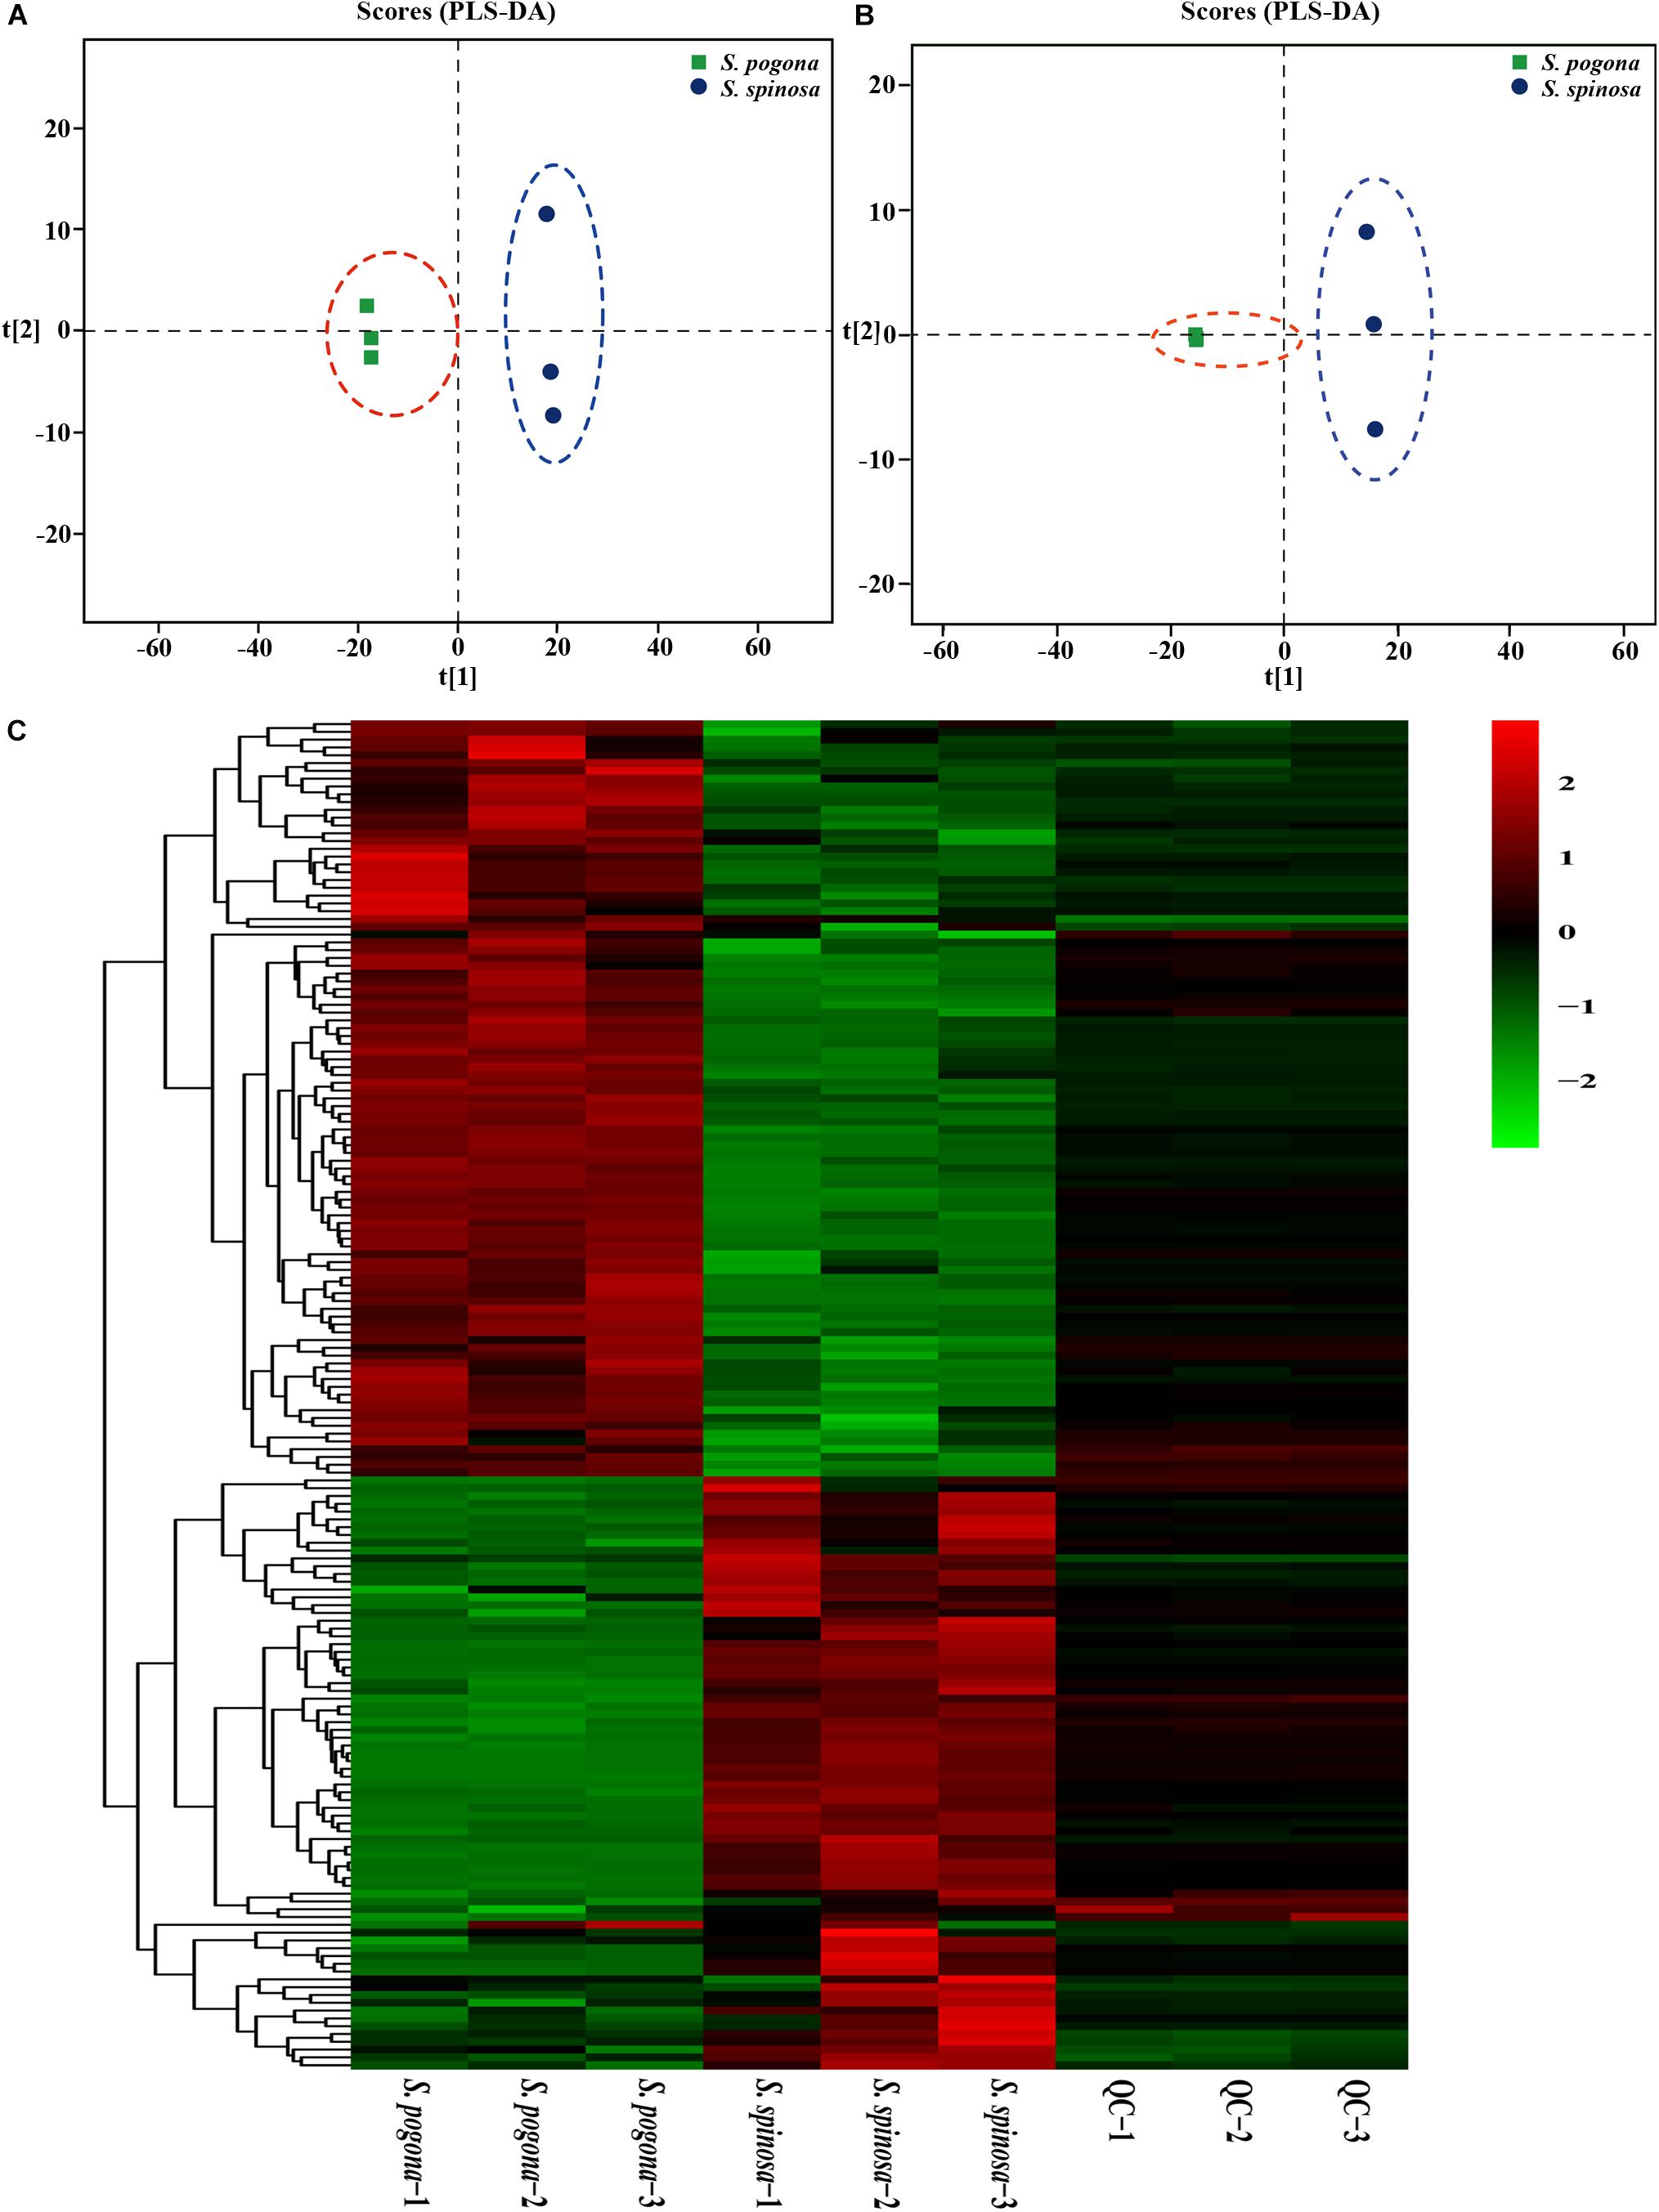
Figure 4. PLS-DA and heatmap analysis of intracellular metabolites from S. pogona and S. spinosa. (A) PLS-DA score graph of positive ion model. (B) PLS-DA score graph of negative ion model. (C) Heatmap analysis of significantly different metabolites in different samples.
Central Carbon Metabolism
Central carbon metabolism is one of the most basic cellular pathways that occur in all living organisms, and metabolite interconversion at the phosphoenolpyruvate–pyruvate–oxaloacetate node involves a set of reactions that connect the major pathways of carbon metabolism (Sauer and Eikmanns, 2005; Wittmann et al., 2012). These reactions are responsible for the distribution of carbon flux among catabolism, anabolism, and cellular energy supply (Chubukov et al., 2014). The current study presents an overview of the central carbon metabolic pathway and changes in the expression levels of proteins involved in key metabolism, as shown in Figure 5. Most proteins involved in central carbon metabolism could be identified from the shotgun proteomic data (Data Set S4). Cells convert extracellular glucose into the available phosphorylated glucose, glucose 6-phosphate, via two pathways. First is direct phosphorylation, in which glucose is transported into cells through the phosphotransferase system (PTS); second is the entry of glucose into cells via the ATP-binding cassette (ABC) transport system, followed by the phosphorylation of glucose by glucokinase (Zhou et al., 2015; Xia et al., 2017). In the present study, PTS enzyme I (ptsI), phosphocarrier protein Hpr (ptsH), PTS glucose transporter IIA/IIBC (PTS IIA/IIBC), multiple sugar transport system ATP-binding protein (msmX), and glucokinase (ppgK) were identified in S. pogona and S. spinosa during glucose fermentation. The abundance of HPr and multiple sugar transport system ATP-binding protein in S. pogona was higher than that of S. spinosa, indicating that both strains have developed ways of glucose transport by PTS and the ABC transport system. Furthermore, the ability of S. pogona to transport and phosphorylate glucose was stronger than that of S. spinosa, which was kept in line with the rapid glucose consumption rate and the improvement of cell growth. In addition, the expression abundance of the proteins related to the transport of fructose, mannose and other sugars in S. pogona was also higher than that of S. spinosa, indicating that the potential ability of S. pogona to transport other sugars was probably stronger than that of S. spinosa (Data Set S1).
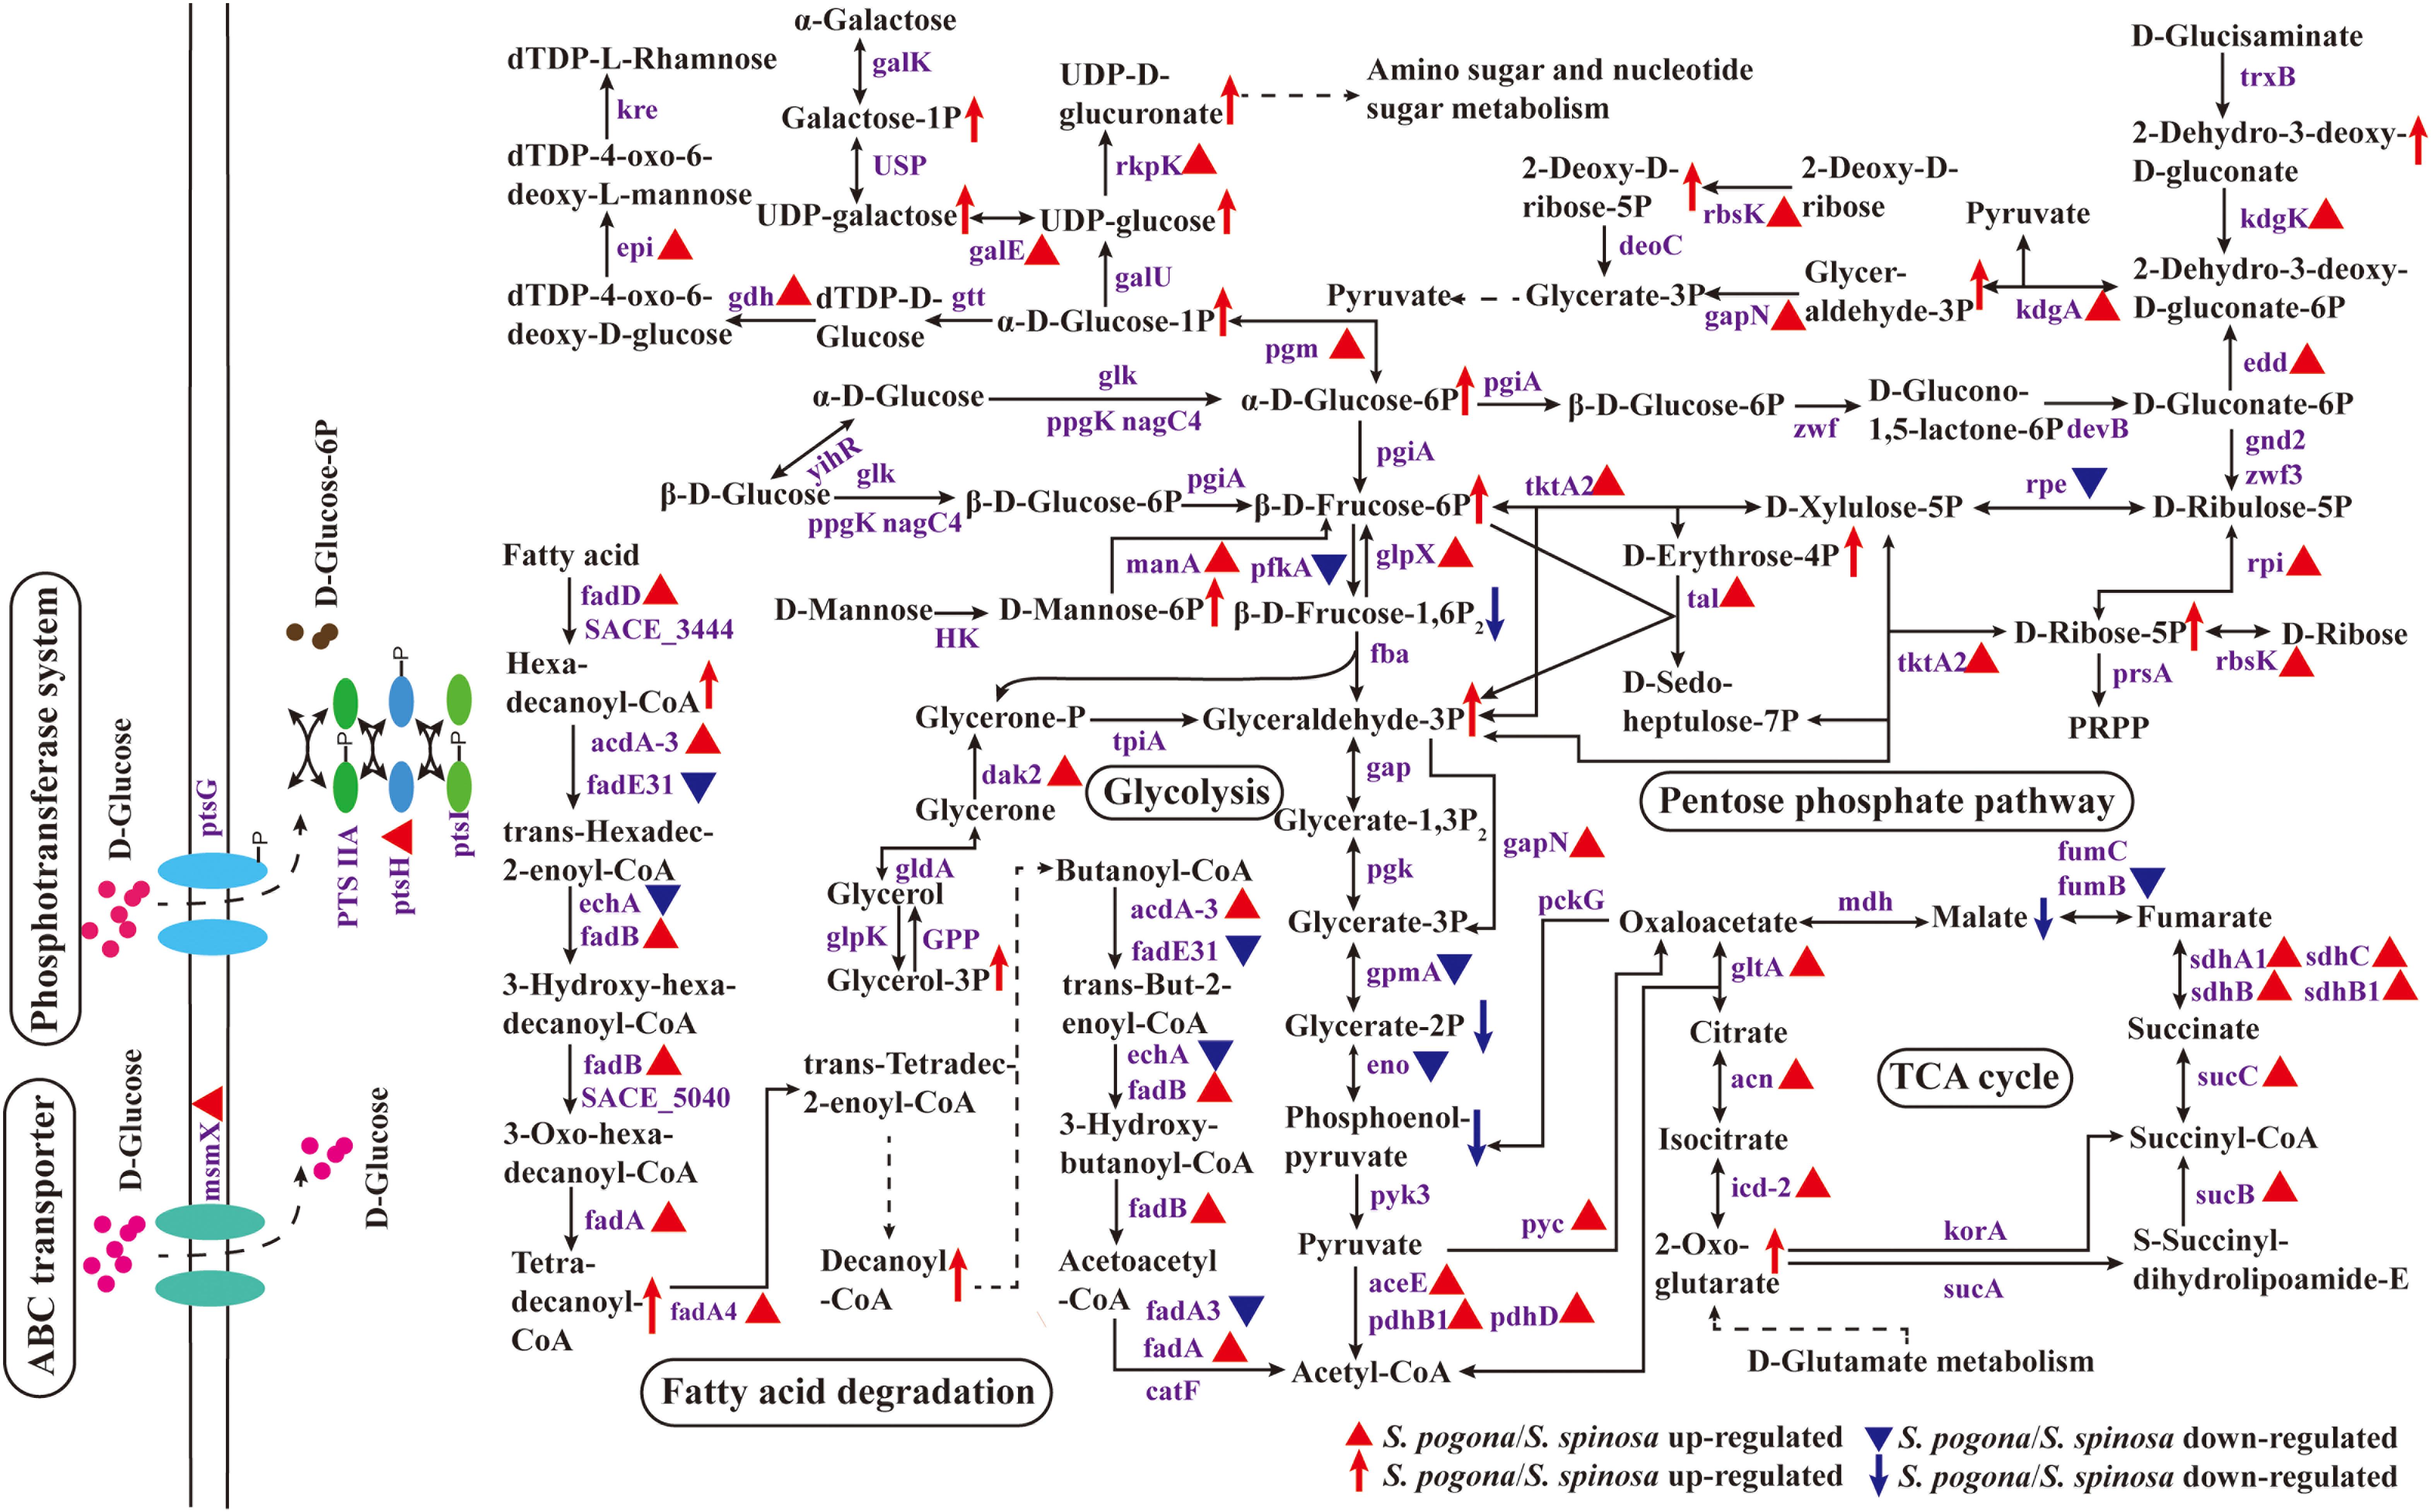
Figure 5. Protein and metabolite changes of the central carbon metabolic pathway in S. pogona and S. spinosa. The protein changes are from iTraq-labeled identification results. The proteins indicated in triangle pattern (red or blue) represent significant differences in S. pogona. The metabolite changes are from metabolomic analysis results. The metabolites indicated in arrow (red or blue) represent significant differences in S. pogona. TCA cycle, citrate cycle; PTS system, phosphotransferase system; P, phosphate; PRPP, 5-phospho-alpha-D-ribose 1-diphosphate.
Three common alternative routes for glucose catabolism occur in bacteria: the Embden-Meyerhof-Parnas (glycolysis) pathway, Entner-Doudoroff (ED) pathway, and pentose phosphate (PP) pathway (Nikel et al., 2015; Seol et al., 2016; Sánchez-Pascuala et al., 2017). The glycolysis and PP pathways are nearly ubiquitous in the bacterial kingdom (Romano and Conway, 1996). In the current study, S. pogona and S. spinosa could catabolize glucose into acetyl-CoA via the complete glycolysis and PP pathways, and all of the proteins involved in these two pathways could be detected. Throughout the glycolysis process, the abundance of 6-phosphofructokinase (pfkA) in S. pogona was lower than that of S. spinosa; this enzyme is involved in the conversion of fructose-6-phosphate to fructose-1,6-bisphosphate and is a rate-limiting enzyme for glycolysis (Suo et al., 2018). The abundance of fructose-1,6-bisphosphatase (glpX) was higher than that of S. spinosa; this enzyme is involved in the conversion of fructose-1,6-bisphosphate to fructose-6-phosphate and reduce substrate metabolism flow to glycolysis (Gutka et al., 2017). Meanwhile, fructose-6-phosphate, as shown in the metabolomic analysis, it had a higher abundance in S. pogona, and the fructose-1,6-bisphosphate had a lower abundance in S. pogona, which was consistent with the abundance variation of 6-phosphofructokinase and fructose-1,6- bisphosphatase in S. pogona. Two other enzymes in glycolysis, namely, phosphoglycerate mutase (gpmA) and enolase (eno) (Nikel et al., 2015), were also observed, and their abundance in S. pogona was lower than that in S. spinosa. Moreover, their catalytic products, such as glycerate-2-phosphate and phosphoenolpyruvate, have a low abundance in S. pogona. The data indicate that the ability of S. pogona to utilize glucose by glycolysis on the 4th day was weaker than that of S. spinosa, which is probably caused by the low glucose concentration in the extracellular environment of S. pogona. Even so, the expression abundances of enzymes involved in the conversion of pyruvate to acetyl-CoA or oxaloacetate in S. pogona, such as pyruvate dehydrogenase (aceE, pdhB1 and pdhD) and pyruvate carboxylase (pyc), was higher than that of S. spinosa, indicating that S. pogona has a strong ability to metabolize pyruvate. The PP pathway is the second important pathway for glucose metabolism, and its initial substrate is glucose 6-phosphate. In fast-growing cells, the PP pathway plays crucial roles in anabolic reactions, converting glucose 6-phosphate into glyceraldehyde 3-phosphate and ribose 5-phosphate or producing NADPH for the synthesis of acetyl-CoA, nucleotides, and other metabolites (Seol et al., 2016). The pathway can be divided into oxidation and non-oxidation stages. In oxidation stage, glucose 6-phosphate undergoes two-step dehydrogenation reaction to form ribulose 5-phosphate, CO2 and two molecules of NADPH, of which glucose-6-phosphate dehydrogenase (zwf) and 6-phosphogluconate dehydrogenase (zwf3) are the rate-limiting enzymes of this stage (Matsushika et al., 2012). However, the abundance of these proteins did not remarkably change in our comparative proteomic data, suggesting that these two strains showed the same ability to metabolize glucose through the oxidation stage of PP pathway. In non-oxidation stage, it is mainly involved in the mutual conversion of different carbon number compounds, in which transketolase (tktA2) and transaldolase (tal) play important roles in the above reactions (Tittmann, 2014). Surprisingly, the expression abundance of these two enzymes in S. pogona was significantly higher than that of S. spinosa. Moreover, some of the intermediate metabolites that occur in the non-oxidation phase have a higher abundance in S. pogona, such as erythrose-4-phosphate, ribose-5-phosphate and glyceraldehyde-3-phosphate, which indicated that the ability of different carbon number compounds mutual conversion through the non-oxidation stage of PP pathway in S. pogona was higher than that of S. spinosa. Unexpectedly, we also detected 6-phosphogluconate dehydratase (edd) and 2-dehydro-3-deoxy-D-gluconate aldolase (kdgA) in the proteomic data of S. pogona and S. spinosa, which were characteristic enzymes of the ED pathway that takes only four steps to convert glucose to pyruvate (Flamholz et al., 2013). Moreover, the abundance of 6-phosphogluconate dehydratase and 2-dehydro-3-deoxy-D-gluconate aldolase in S. pogona was higher than that of S. spinosa, indicating the strong ability of S. pogona to catabolize glucose through the ED pathway. Therefore, comparative proteomic analysis revealed three glucose metabolism modes in both S. pogona and S. spinosa, demonstrating their strong basal metabolic capacity. However, the ability of the two strains in glycolysis, PP pathway and ED pathway were remarkably different in a selected period, causing their specific phenotypic changes. For example, the growth rate of S. pogona was stronger than that of the S. spinosa in early growth.
Ribokinase (rbsK) was also identified in our proteomic data. Ribokinase is one of the principal enzymes in carbohydrate metabolism, catalyzing D-ribose and 2-deoxy-D-ribose to produce ribose-5-phosphate and 2-deoxy-D-ribose-5-phosphate, respectively, eventually generating glyceraldehyde-3-phosphate into glycolysis; this pathway may be used as an alternative route in central carbon metabolism (Paul et al., 2014; Zhou et al., 2019). We found that the abundance of ribokinase in S. pogona was higher than that of S. spinosa. Meanwhile, its catalytic products, such as ribose-5-phosphate and 2-deoxy-D-ribose-5-phosphate, have a higher abundance in S. pogona. The results suggest that the extracellular glucose deficiency of S. pogona improves the utilization of cells to intracellular D-ribose and 2-deoxy-D-ribose due to the absence of a “glucose effect” (Alba et al., 2016). The ribose-5-phosphate and 2-deoxy-D-ribose-5-phosphate generated can be used to produce glyceraldehyde 3-phosphate and NTP/dNTP via the PP pathway and via purine and pyrimidine metabolism to compensate for the shortage of glucose to complete normal metabolism.
In addition to catabolism through glycolysis and PP pathway, glucose-6-phosphate can also be converted into glucose-1-phosphate for anabolism, including polyketide sugar unit biosynthesis, N-glycan biosynthesis and peptidoglycan biosynthesis (Patel et al., 2019). In this study, the abundance of phosphoglucomutase (pgm) in S. pogona was higher than that of S. spinosa; this enzyme is involved in the conversion of glucose-6-phosphate to glucose-1-phosphate, and its catalyzed product, glucose 1-phosphate, also has a high abundance in S. pogona. Figure 5 showed that glucose-1-phosphate can synthesize dTDP-L-rhamnose successively with the participation of glucose-1-phosphate thymidylyltransferase (gtt), dTDP-glucose-4,6-dehydratase (gdh), dTDP-4-keto-6-deoxy-D-glucose epimerase (epi) and dTDP-4-dehydrorhamnose reductase (kre), and can also synthesize UDP-D-glucuronate successively with the participation of UTP-glucose-1-phosphate uridylyltransferase (galU) and UDP-N-acetyl-D-glucosamine dehydrogenase (rkpK), in which dTDP-L-rhamnose is an important precursor of target products and cell wall synthesis, while UDP-D-glucuronate is an important substrate for amino sugar and nucleotide sugar metabolism. In the above biological processes, the expression abundance of dTDP-glucose-4,6-dehydratase, dTDP-4-keto-6-deoxy-D-glucose epimerase and UDP-N-acetyl-D-glucosamine dehydrogenase in S. pogona was higher than that in S. spinosa. In addition, UDP-glucose and UDP-D-glucuronate also have a high detection abundance in S. pogona, indicating that S. pogona has a strong ability to use glucose for anabolism during the analysis period. We also found that enzymes and intermediate metabolites associated with the metabolism of mannose, galactose, and glycerol 3-phosphate had high abundance in S. pogona, such as mannose-6-phosphate isomerase (manA), UDP-glucose 4-epimerase (galE), dihydroxyacetone kinase (dak2), D-mannose 6-phosphate, galactose 1-phosphate, UDP-galactose and glycerol 3-phosphate, which effectively reflected the difference on metabolic capacity between the two strains.
Fatty acid degradation metabolism and TCA cycle are important metabolic pathways for the synthesis of acetyl-CoA and other intermediate precursors, respectively (Edmunds et al., 2014; Vuoristo et al., 2017; Richie et al., 2018). Bacteria use several mechanisms for activating exogenous fatty acids, one of the most important of which is the conversion of exogenous fatty acids to acyl-CoA, which is then broken down by β-oxidation to produce acetyl-CoA (Kallscheuer et al., 2017). The proteomic data in the present study showed that the abundance of acyl-CoA synthetase (fadD), acyl-CoA dehydrogenase (acdA-3), enoyl-CoA hydratase (fadB), and acetyl-CoA acyltransferase (fadA, fadA4) in S. pogona were higher than that in S. spinosa. Meanwhile, hexadecanoyl-CoA, tetradecanoyl-CoA and decanoyl-CoA had a higher abundance in S. pogona, which was consistent with the abundance variation of acyl-CoA synthetase and acetyl-CoA acyltransferase in S. pogona. Since acyl-CoA synthetase is the core enzyme for fatty acid degradation metabolism, this result suggests the strong ability of S. pogona to metabolize exogenous fatty acids by β-oxidation. The acetyl-CoA produced from fatty acid β-oxidation and pyruvate metabolism will enter the TCA cycle to produce energy and several metabolic precursors for cell growth and the synthesis of other metabolites. Citrate synthase (gltA), isocitrate dehydrogenase (icd-2), and 2-oxoglutarate dehydrogenase (sucB) are the rate-limiting enzymes of TCA cycle and were detected in our proteomic data. The abundance of these three rate-limiting enzymes in S. pogona was higher than that in S. spinosa. The same finding was observed for other enzymes involved in the TCA cycle, such as aconitate hydratase (acn), succinyl-CoA synthetase (sucC), and succinate dehydrogenase (sdhA1, sdhB, sdhB1, and sdhC). In addition, we also found that 2-oxoglutarate has a high abundance in S. pogona. This result suggests the strong ability of S. pogona to produce energy and metabolic precursors by using acetyl-CoA, although the concentration of fumarate hydratase (fumB) and its catalytic product malate is low. S. pogona showed stronger metabolic capacity than S. spinosa in fatty acid metabolism and TCA cycle because it rapidly absorbs and utilizes nutrients in the environment early in growth. It suggests that the metabolic flux flowing through the TCA cycle in S. pogona is increased compared with the S. spinosa, which may cause the acetyl-CoA produced by the glycolysis, fatty acid degradation and other metabolic pathways to flow more into the TCA cycle, and ultimately limits the biosynthesis of butenyl-spinosyn. These results can be used to explain why S. pogona exhibited a rapid growth rate but low butenyl-spinosyn production.
Amino Acid Metabolism
Amino acid metabolism plays an important role in cell growth and secondary metabolite biosynthesis (Ljungdahl and Daignan-Fornier, 2012; Sainz et al., 2017). To further understand how amino acid metabolism functions in target product biosynthesis, we analyzed the expression of enzymes for amino acid metabolism and the detection abundance of intermediate metabolites (Figure 6, Data Set S2 and S4). Figure 6 shows that leucine, valine, isoleucine, methionine, serine, alanine, phenylalanine, lysine, and tryptophan can be directly converted into important precursors of target product biosynthesis, such as acetyl-CoA, methylmalonyl-CoA, and S-adenosyl-L-methionine. Histidine, tyrosine, asparagine, aspartate, cysteine, glycine, threonine, glutamate, and glutamine indirectly synthesize these important precursors. However, arginine and proline cannot be converted to these precursors. This means that amino acid metabolism is also an important source of precursors for the biosynthesis of target products. We found that the amino acid metabolism ability of S. pogona overall was stronger than that of S. spinosa, indicating that S. pogona demonstrated a stronger synthetic ability to convert amino acids into acetyl-CoA and other key precursors compared with S. spinosa. For example, the abundance of enzymes (ilvE, bkdA, acdA-3, fadB, fadA, fadA4, pccB, and aldA) involved in the leucine to acetyl-CoA, valine to (R)-methylmalonyl-CoA, and isoleucine to (S)-methylmalonyl-CoA pathways in S. pogona was remarkably higher than that in S. spinosa (Schertl et al., 2017). Meanwhile, leucine (0.36) and isoleucine (0.71) were detected at lower concentrations in S. pogona than in S. spinosa. This result indicates that S. pogona can rapidly convert the above amino acids into acetyl-CoA and methylmalonyl-CoA. However, we found that the abundance of homocysteine methyltransferase (metE) and methionine adenosyltransferase (metK), two key enzymes involved in the S-adenosine methionine synthesis (Yang et al., 2015), was remarkably lower in S. pogona than in S. spinosa, with a detection abundance of only 52 and 54%, respectively. This result may lead to insufficient S-adenosine methionine synthesis in S. pogona. As shown in the metabolome analysis, the detection abundance of S-adenosine methionine in S. pogona was also lower than that of S. spinosa, therefore, insufficient supply of S-adenosine methionine was one of the important factors resulting in the low butenyl-spinosyn yield. Further experiments are required to verify the role of S-adenosine methionine on butenyl-spinosyn biosynthesis.
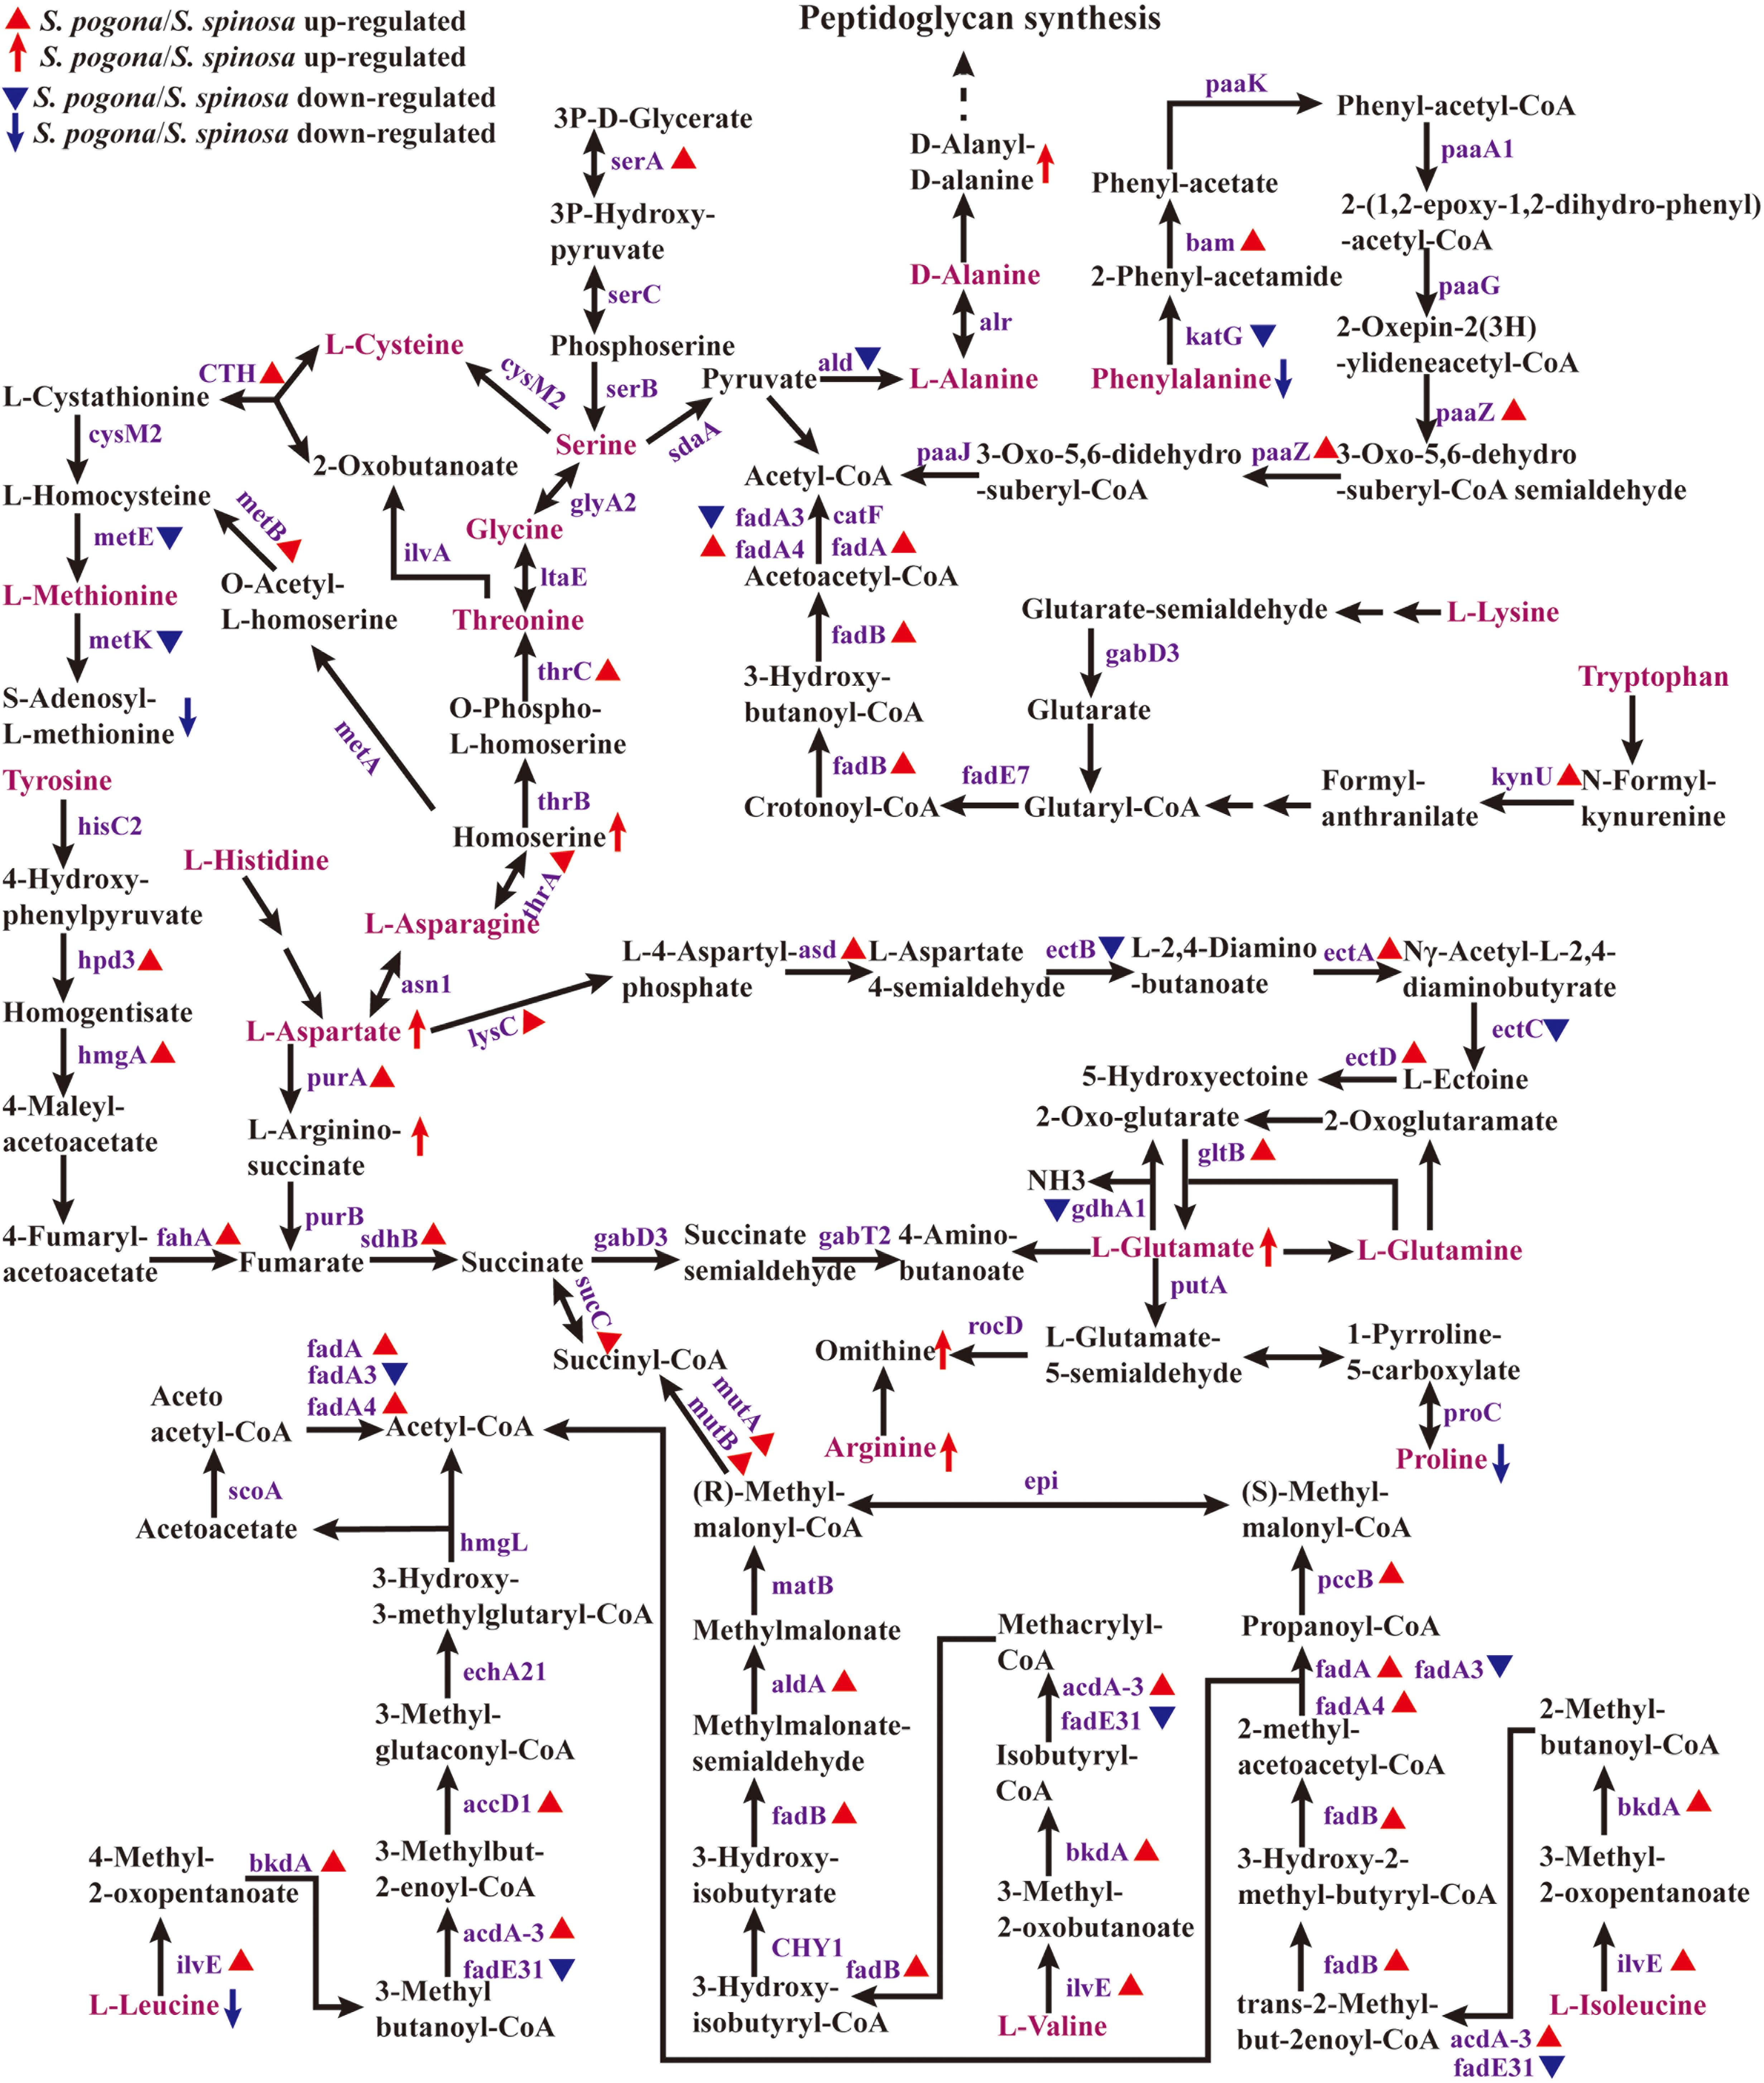
Figure 6. Protein and metabolite changes of the amino acids metabolism in S. pogona and S. spinosa. The protein changes are from iTraq-labeled identification results. The proteins identified are indicated in purple. The proteins indicated in triangle pattern (red or blue) represent significant differences in S. pogona. The metabolite changes are from metabolomic analysis results. The metabolites indicated in arrow (red or blue) represent significant differences in S. pogona. The multistep reaction is indicated in consecutive arrows. P, phosphate.
Energy Metabolism
Most of the intermediate precursors and reducing power generated by central carbon and amino acid metabolism follow the oxidative phosphorylation pathway for ATP synthesis (Daniel, 2019). We detected the complete oxidative phosphorylation pathway (complex I–V) at the protein level and the complex I-, III-, and IV-generated proton gradient using the appropriate substrate (Data Set S2 and Figure 7). The proton gradient generated can be used to create ATP via complex V (Daniel, 2019). Based on the comparative proteomic analysis, the abundance of most enzymes identified in S. pogona, such as NADH dehydrogenase (nouA/C/E/H/J/K/L/M/N, ndh), succinate dehydrogenase (sdhA1/B/B1/C), polyphosphate kinase (ppk), inorganic pyrophosphatase (ppa), and ATP synthase (atpA/C/H), was higher than that in S. spinosa and showed an increased energy production capacity. NAD + /NADH ratio and total NAD(H) play important roles for whole-cell biochemical redox transformations. As shown in the previously described central carbon metabolism process, four reactions that generate reducing power (NADH and FADH2) occur in the TCA cycle: isocitrate to 2-oxo-glutarate (NADH), 2-oxo-glutarate to succinyl-CoA (NADH), succinate to fumarate (FADH2), and malate to oxaloacetate (NADH) (Vuoristo et al., 2017). The abundance of enzymes (icd-2, sucB, and sdhA1/B/B1/C) involved in the conversion of isocitrate to 2-oxo-glutarate, 2-oxo-glutarate to succinyl-CoA, and succinate to fumarate in S. pogona was remarkably higher than that in S. spinosa, implying the strong ability of S. pogona to produce reducing power. We hypothesized that the increased NADH level induces the elevated expression of oxidative phosphorylation-related enzymes in S. pogona, which was consistent with the quantitative proteomic analysis.
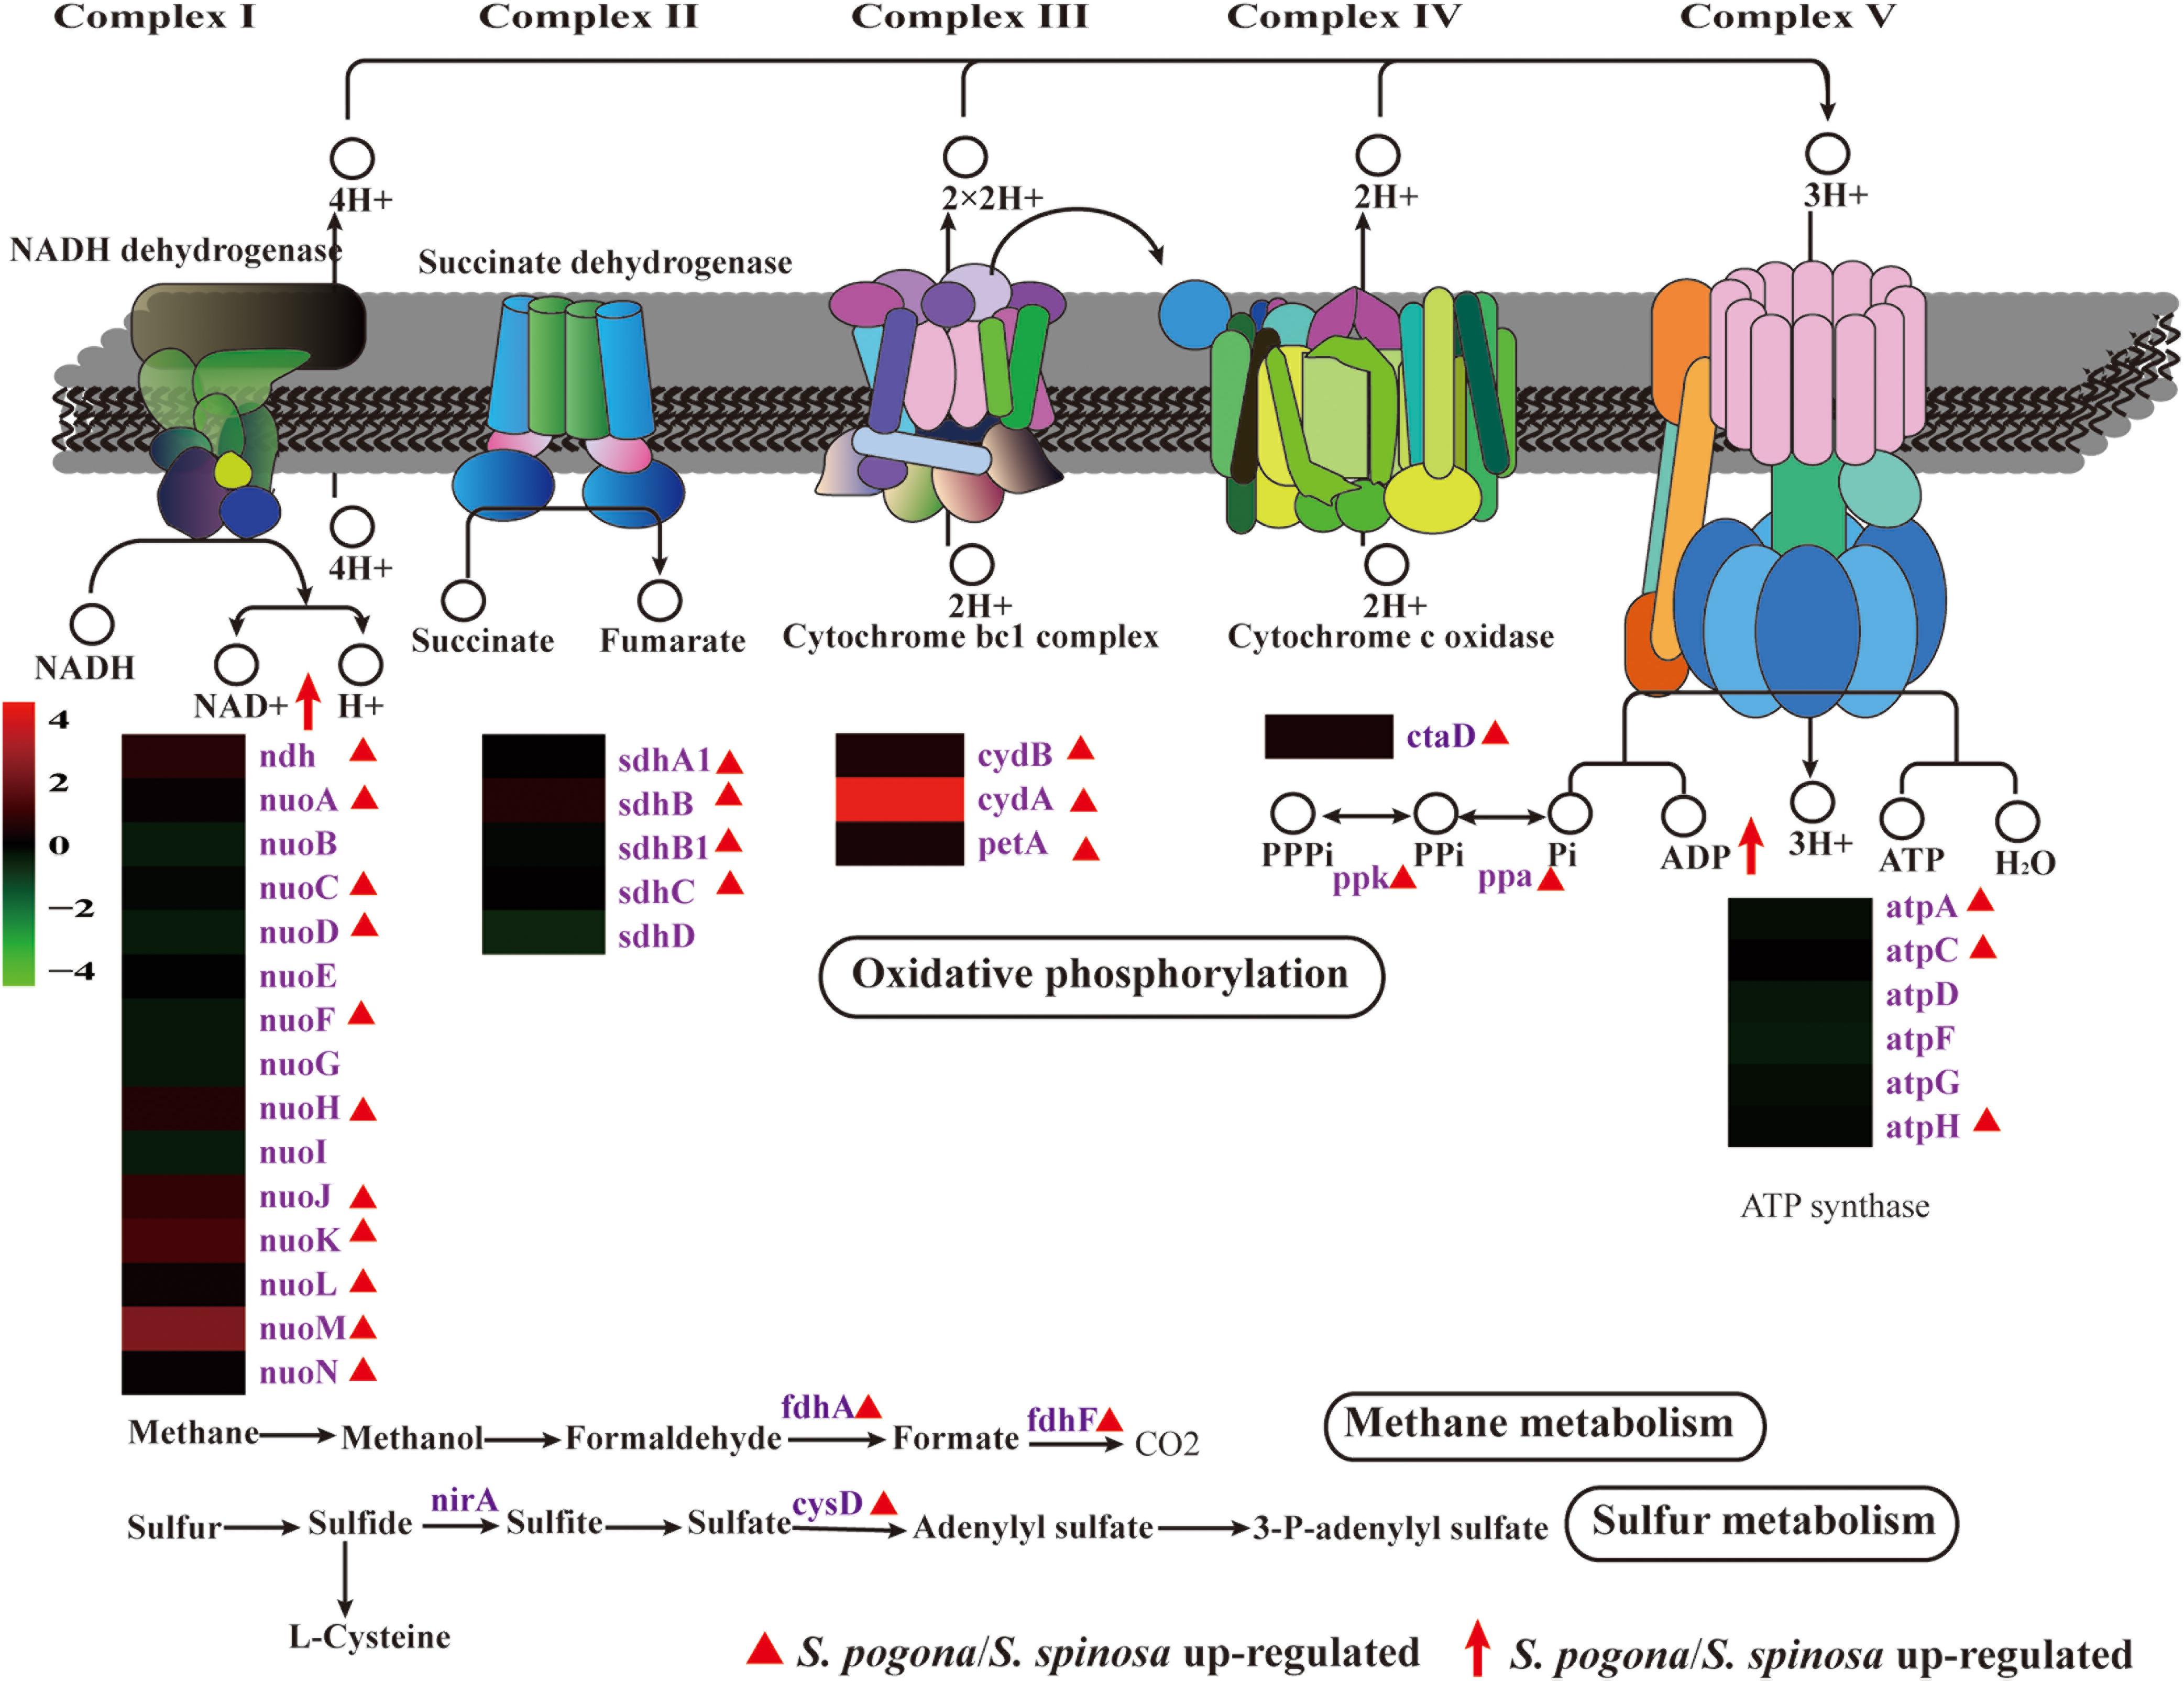
Figure 7. Protein and metabolite changes of energy metabolism in S. pogona and S. spinosa. The protein changes are from iTraq-labeled identification results. The proteins identified are indicated in purple. The proteins indicated in triangle pattern (red) represent significant differences in S. pogona. The metabolite changes are from metabolomic analysis results. The metabolites indicated in arrow (red) represent significant differences in S. pogona.
Unexpectedly, methane and sulfur metabolism are the other energy metabolism mechanisms found in our proteomic data based on KEGG pathway analysis (Figure 7) (Hakobyan et al., 2018; Qian et al., 2019). The enzymes formaldehyde dehydrogenase (fdhA), formate dehydrogenase (fdhF), and sulfate adenylyltransferase (cysD), which are involved in methane metabolism and sulfur metabolism, were identified, indicating that in addition to using organic carbon to generate energy, utilizing inorganic carbon (methane) and inorganic sulfur to produce energy in S. pogona and S. spinosa is highly possible.
Nucleotide Metabolism
Nucleotide metabolism plays an important role in the synthesis of genetic materials, energy supply, metabolic regulation, as a messenger molecule and the formation of coenzymes, including purine nucleotide metabolism and pyrimidine nucleotide metabolism (Kalia et al., 2013; Jenal et al., 2017). The synthesis of nucleotides in an organism can be through two pathways, one is de novo synthesis (primary) and the other is remediation synthesis (Wang, 2016). Figure 8 showed the gradual synthesis of nucleotides based on ribose 5-phosphate. In this study, it was found that most of the enzymes involved in nucleotide metabolism and their catalytic products had high abundance in S. pogona. IMP dehydrogenase (guaB3) catalyzes the redox reaction between inosine monophosphate (IMP) and xanthosine 5′-phosphate (XMP), carbamoyl-phosphate synthase (carA/carB) catalyzes the synthesis of carbamoyl-phosphate, which belongs to the rate-limiting enzyme of purine and pyrimidine nucleotide metabolism respectively (Rubio et al., 1998; Pimkin and Markham, 2009). The two enzymes as well as the relevant metabolites, such as xanthosine 5′-phosphate, L-glutamine and dihydroorotate, were all present at higher abundance in S. pogona, indicating that S. pogona has strong nucleotide metabolism ability. Moreover, in the previous analysis of the PP pathway, it was determined that enzymes involved in the synthesis of ribose 5-phosphate, such as ribose 5-phosphate isomerase (rpi), ribokinase and transketolase, had a higher expression abundance in S. pogona, making its ribose 5-phosphate abundance much higher than that of S. spinosa, so as to meet the needs of its vigorous nucleotide metabolism.
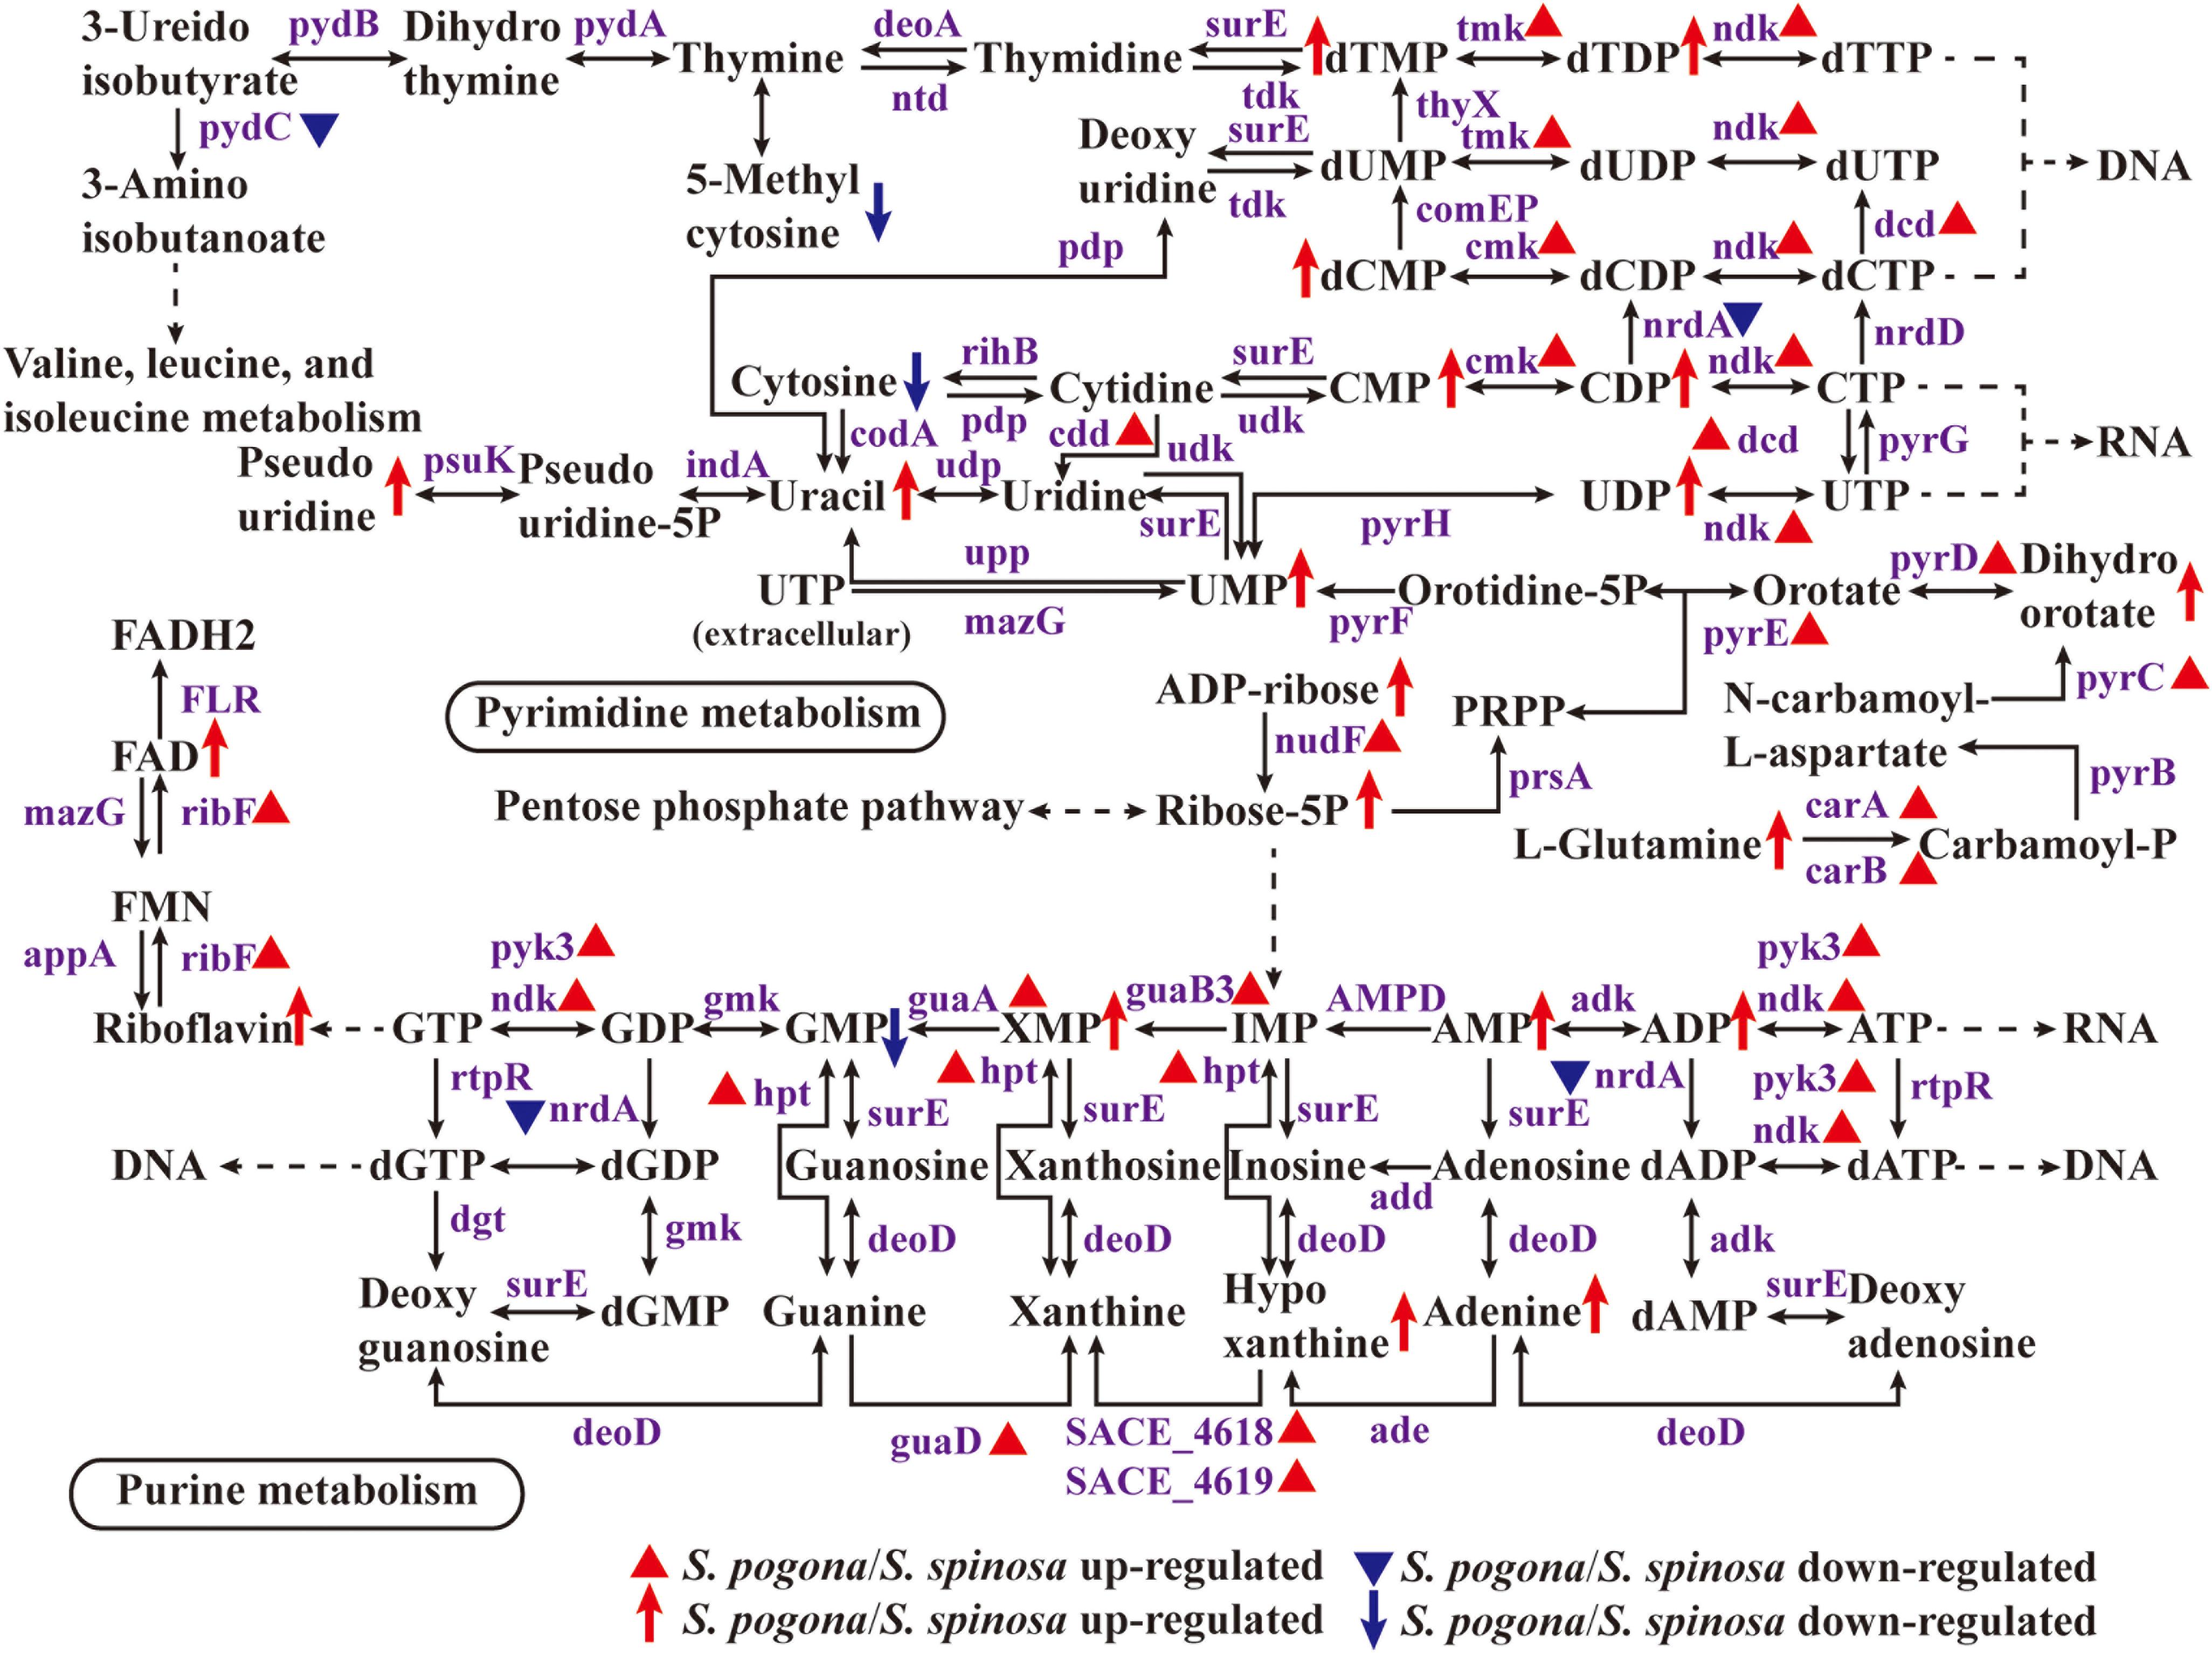
Figure 8. Protein and metabolite changes of nucleotide metabolism in S. pogona and S. spinosa. The protein changes are from iTraq-labeled identification results. The proteins identified are indicated in purple. The proteins indicated in triangle pattern (red or blue) represent significant differences in S. pogona. The metabolite changes are from metabolomic analysis results. The metabolites indicated in arrow (red or blue) represent significant differences in S. pogona.
Differential Analysis in the Expression of Proteins Directly Involved in Butenyl-Spinosyn Biosynthesis
In addition to metabolic pathways associated with precursor synthesis, the differential expression of the enzyme involved in the butenyl-spinosyn biosynthesis was also analyzed in this study (Table 3). In our shotgun proteomic data, 12 gene expression products directly related to the biosynthesis of butenyl-spinosyn were detected. These products were mainly involved in intramolecular C–C bond formation (busJ, L), rhamnose attachment and methylation (busG, H, I, K), forosamine biosynthesis (busP, S), and rhamnose biosynthesis (gtt, gdh, epi, and kre) (Huang et al., 2009). However, other proteins related to the biosynthesis of the butenyl-spinosyn could not be detected because of their low abundance. The expression abundance of these 12 proteins was much lower than that of certain high-abundance proteins, such as the molecular chaperone GroEL. For example, the expression abundance of BusI and BusP, the proteins with the highest and lowest abundance, were only the 1 and 0.05% that of GroEL, respectively. This result is a possible reason for the low butenyl-spinosyn synthesis rate in wild-type S. pogona.
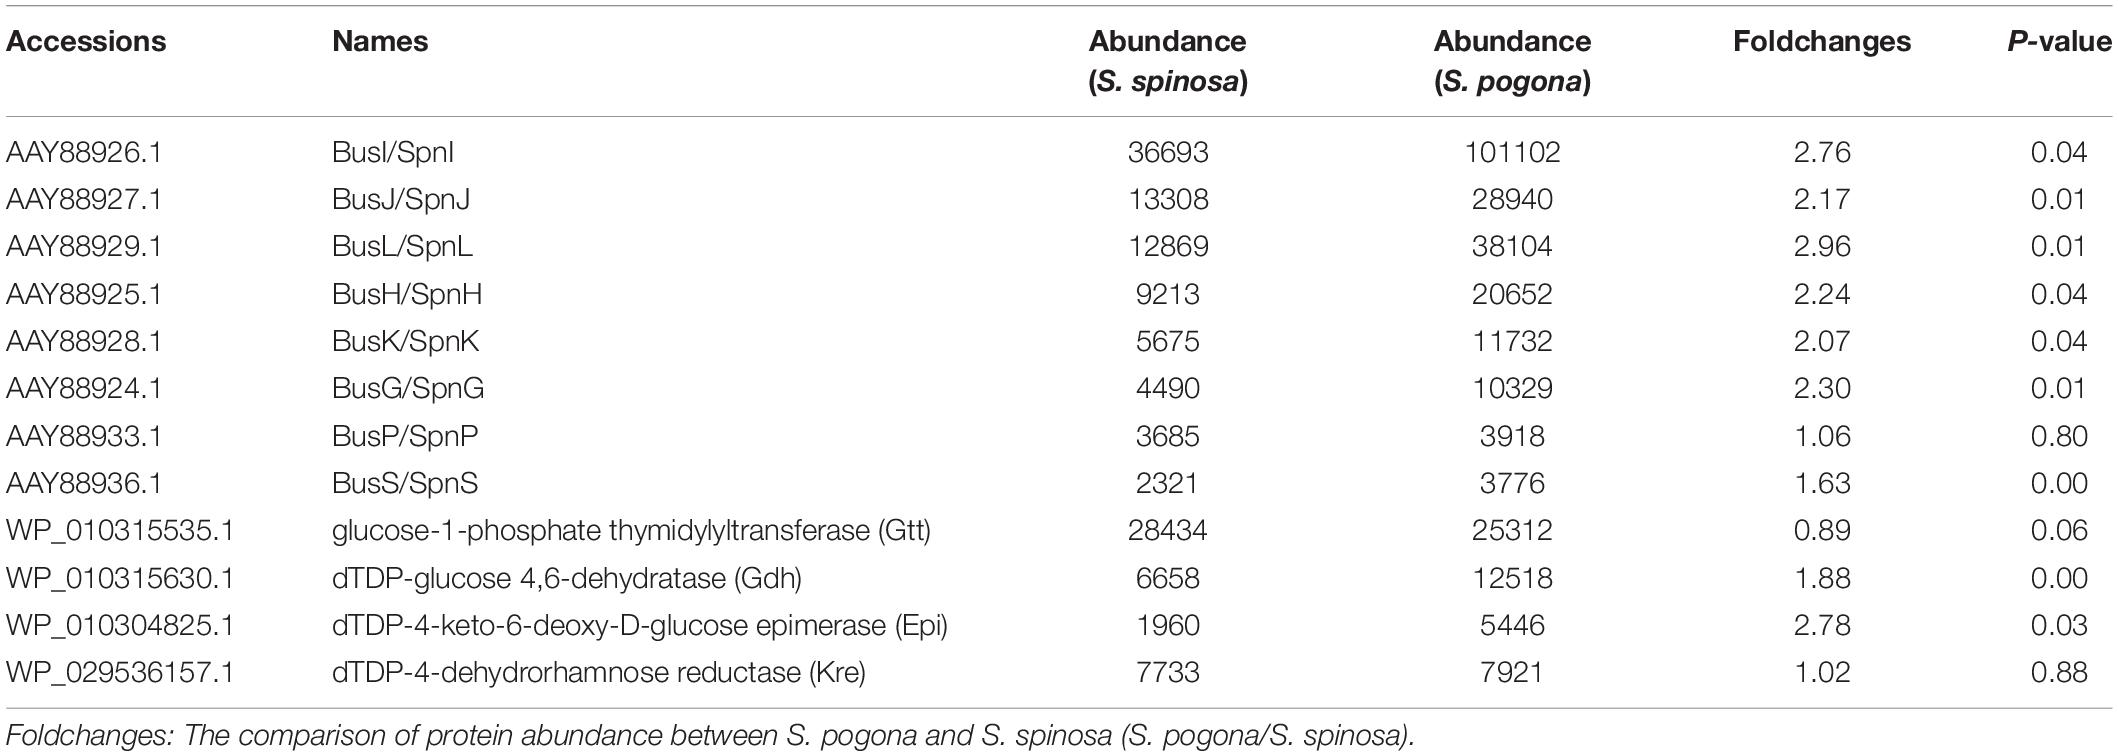
Table 3. Proteins directly associated with butenyl-spinosyn or spinosyn biosynthesis identified by iTraq-labeled proteomic analysis.
Effect of the Over-Expression of the Rhamnose Synthetic Genes and Methionine Adenosyltransferase Gene on the Butenyl-Spinosyn Biosynthesis
Rhamnose and S-adenosyl methionine are the precursors of butenyl-spinosyn biosynthesis. Meanwhile, the former is also participated in cell wall synthesis, and the latter is a direct donor of methyl groups. However, the proteomic results in the present study showed that the expression abundance of rhamnose synthetic genes (gtt, gdh, epi, and kre) and metK involved in the biosynthesis of rhamnose and S-adenosyl methionine was low compared to other high-abundance proteins (Table 3). Therefore, the lack of rhamnose and S-adenosyl methionine supply is likely to limit the butenyl-spinosyn biosynthesis. To confirm the conjecture, we over-expressed the entire rhamnose synthetic genes and metK in S. pogona, respectively, and then evaluated the resulting mutants SPOG-RM and SPOG-ME for discernable phenotypes (Supplementary Figures 6–8). The butenyl-spinosyn was also extracted from the mutants and then examined through HPLC in accordance with the method described above. The total peak area of butenyl-spinosyn reached 1220.7 ± 181.68 mAU*s in SPOG-RM and 1432.4 ± 164.24 mAU*s in SPOG-ME, and their production were enhanced by 2.69- and 3.03-fold compared with the original strain, respectively, which was consistent with our speculation (Figures 9A–C). We also analyzed the expression levels of rhamnose synthetic genes in SPOG-RM and metK in SPOG-ME. The qRT-PCR results showed that the transcript levels of gdh, kre, epi, and gtt in SPOG-RM were 14. 0-, 11. 9-, 26. 8-, and 54.1-fold higher than those in S. pogona, respectively, and the transcript level of metK in SPOG-ME was 7.3-fold higher than that in S. pogona (Figure 9D). The finding was also in agreement with the high fermentation observed in mutants. On the basis of metabolic pathway analysis and engineering modification, we believe that the insufficient supply of the synthetic units rhamnose and S-adenosine methionine is an important factor limiting butenyl-spinosyn biosynthesis.
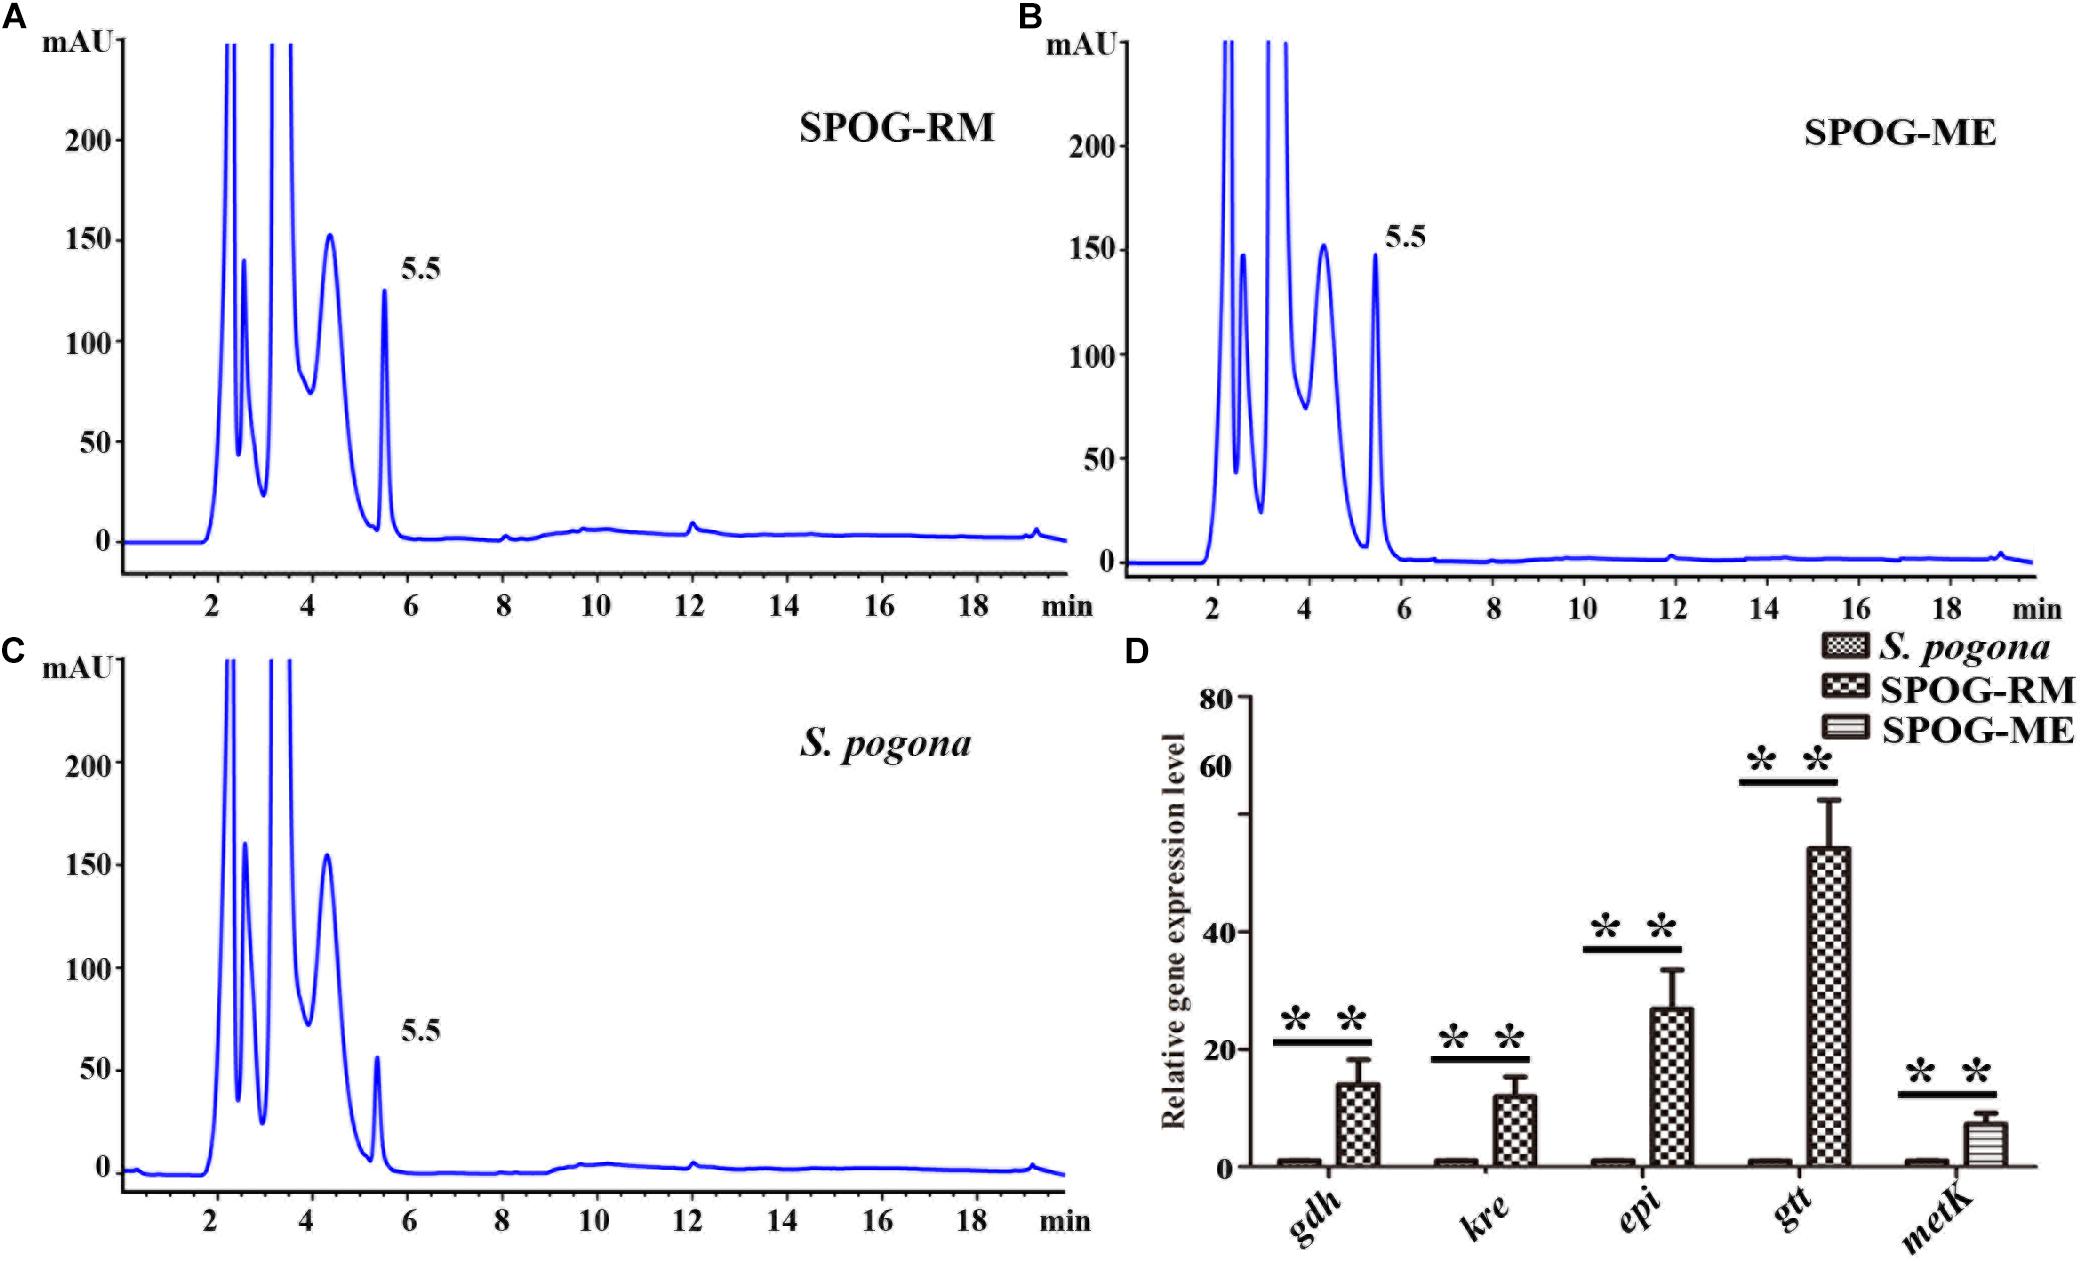
Figure 9. The over-expression of rhamnose synthetic genes and metK promote butenyl-spinosyn biosynthesis. (A) Fermentation broth of mutant SPOG-RM. (B) Fermentation broth of mutant SPOG-ME. (C) Fermentation broth of S. pogona. (D) Transcript analyses of rhamnose biosynthetic genes and metK. The cells of the different strains were cultured in SFM and incubated at 30°C for 4 days. Total RNA were then isolated and used for qRT-PCR assays. The control strain was the wild-type S. pogona. The ratio for the control strain was arbitrarily set to “1”. The 16s RNA served as the normalization control. Error bars were calculated from four independent determinations of mRNA abundance in each sample. The ** represents the P-value less than 0.01.
Conclusion
This study was the first to conduct a comparative analysis of S. pogona and S. spinosa. The results may contribute to our understanding of the biosynthetic mechanism of butenyl-spinosyn and spinosyn. Strain OD600 value, glucose consumption, phosphate utilization, and target product yield analysis indicated that S. pogona exhibited faster growth rate and glucose and phosphate utilization rate but lower target product biosynthetic ability compared with S. spinosa. Comparative proteomic and metabolomic analysis revealed the difference on central carbon metabolism, amino acid metabolism, energy metabolism, purine and pyrimidine metabolism, and the biosynthetic gene cluster expression of the target products between S. pogona and S. spinosa. These results suggest that S. pogona demonstrates high-efficiency glucose transport ability via the PTS and ABC transporter system, allowing its faster glucose utilization rate compared with that of S. spinosa. S. pogona showed strong ability for fatty acid metabolism, TCA cycle, amino acid metabolism, energy metabolism, purine and pyrimidine metabolism, allowing its vigorous basic metabolism to promote its rapid growth. However, this metabolic feature also led to insufficient precursors and energy supply of S. pogona during the butenyl-spinosyn biosynthesis, which not only caused its premature entry to the stationary and decline growth periods but also reduced its butenyl-spinosyn biosynthetic ability. The ability of S. pogona to participate in the synthesis of precursors, such as rhamnose and S-adenosyl methionine, was weaker than that of S. spinosa, thus affecting the precursor supply of butenyl-spinosyn biosynthesis. Proteomic data also showed that the overall expression level of the butenyl-spinosyn synthetic gene cluster was very low, which may greatly affect biosynthetic ability. The over-expression experiment of rhamnose synthetic genes and metK confirmed the reliability of this conjecture. We propose that the metabolic pathways associated with the supplies of rhamnose and S-adenosyl methionine, which were selected based on the results of quantitative proteomic and metabolomic data, require further research on their regulatory mechanism on butenyl-spinosyn biosynthesis. Studies on the genetic modification of their corresponding genes are useful to understand the key nodes and regulatory networks of primary metabolism and butenyl-spinosyn and spinosyn biosynthesis.
Data Availability Statement
All datasets generated for this study are included in the article/Supplementary Material.
Author Contributions
LX conceived the project. LX and JR generated the concepts and designed the research. JR, HH, SY, JT, and SH performed S. pogona and S. spinosa iTraq-based quantitative proteomic sample preparation and bioinformatics analysis. JR, HH, ZL, and ZX conducted mutants construction. JR, XD, HH, and ZY employed butenyl-spinosyn and spinosyn HPLC and MS analysis. HH, SH, TK, YH, and WH performed mutant strain physiological and biochemical assay. JR and LX wrote the manuscript. All authors discussed the results and approved the final manuscript.
Funding
This work was supported by funding from the National Natural Science Foundation of China (31770106 and 3107006), the National Basic Research Program of China (2012CB722301), the National High Technology Research and Development Program of China (2011AA10A203), the Cooperative Innovation Center of Engineering, New Products for Developmental Biology of Hunan Province (20134486), and the Key Research and Development Program of Hunan Province (2019NK2192).
Conflict of Interest
The authors declare that the research was conducted in the absence of any commercial or financial relationships that could be construed as a potential conflict of interest.
Acknowledgments
We thank Shanghai Applied Protein Technology, Co. for providing technical support.
Supplementary Material
The Supplementary Material for this article can be found online at: https://www.frontiersin.org/articles/10.3389/fmicb.2020.00396/full#supplementary-material
Footnotes
- ^ http://www.geneontology.org/
- ^ http://www.genome.jp/kegg/
- ^ https://xcmsonline.scripps.edu/landing_page.php?pgcontent=mainPage
References
Alba, R. R., Diana, R., Beatriz, R. V., Víctor, Tierrafría, Romina, R. S., Daniel, S. G., et al. (2016). Transcriptomic analysis of a classical model of carbon catabolite regulation in Streptomyces coelicolor. BMC Microbiol. 16:77. doi: 10.1186/s12866-016-0690-y
Antonio, R. G., Barreiro, C., and Solalanda, A. (2010). Genome-wide transcriptomic and proteomic analysis of the primary response to phosphate limitation in Streptomyces coelicolor M145 and in a DeltaphoP mutant. Proteomics 7, 2410–2429. doi: 10.1002/pmic.200600883
Blanc, M. P., Panighini, C., Gadani, F., and Rossi, L. (2004). Activity of spinosad on stored-tobacco insects and persistence on cured tobacco stripst. Pest Manag. Sci. 60, 1091–1098. doi: 10.1002/ps.930
Chubukov, V., Gerosa, L., Kochanowski, K., and Sauer, U. (2014). Coordination of microbial metabolism. Nat. Rev. Microbiol. 12, 327–340. doi: 10.1038/nrmicro3238
Daniel, J. K. (2019). Energy metabolism, oxygen flux, and iron in bacteria: the mössbauer report. J. Biol. Chem. 294, 63–64. doi: 10.1074/jbc.h118.006703
Dhakal, D., Pokhrel, A. R., Jha, A. K., Thuan, N. H., and Sohng, J. K. (2017). Saccharopolyspora species: laboratory maintenance and enhanced production of secondary metabolites. Curr. Protoc. Microbiol. 44, .10H1.1–.10H.1.113. doi: 10.1002/cpmc.21
Edmunds, L. R., Sharma, L., Kang, A., Lu, J., Vockley, J., Basu, S., et al. (2014). c-Myc programs fatty acid metabolism and dictates acetyl-CoA abundance and fate. J. Biol. Chem. 289, 25382–25392. doi: 10.1074/jbc.M114.580662
Flamholz, A., Noor, E., Bar-Even, A., Liebermeister, W., and Milo, R. (2013). Glycolytic strategy as a tradeoff between energy yield and protein cost. Proc. Natl. Acad. Sci. U.S.A. 110, 10039–10044. doi: 10.1073/pnas.1215283110
Fu, X. Z., Guo, X. X., Wu, S. W., Lin, Q., Liu, L. H., Liang, H. R., et al. (2019). Non-targeted UHPLC-Q-TOF/MS-based metabolomics reveals a metabolic shift from glucose to glutamine in CPB cells during ISKNV infection cycle. Metabolites 9:E174. doi: 10.3390/metabo9090174
Gutka, H. J., Wolf, N. M., Bondoc, J. M. G., and Movahedzadeh, F. (2017). Enzymatic characterization of fructose 1,6-bisphosphatase II from Francisella tularensis, an essential enzyme for pathogenesis. Appl. Biochem. Biotechnol. 183, 1439–1454. doi: 10.1007/s12010-017-2512-6
Hahn, D. R., Gustafson, G., Waldron, C., Bullard, B., Jackson, J. D., and Mitchell, J. (2006). Butenyl-spinosyns, a natural example of genetic engineering of antibiotic biosynthetic genes. J. Ind. Microbiol. Biotechnol. 33, 94–104. doi: 10.1007/s10295-005-0016-9
Hakobyan, A., Liesack, W., and Glatter, T. (2018). Crude-MS strategy for in-depth proteome analysis of the methane-oxidizing methylocystis sp. strain SC2. J. Proteome Res. 17, 3086–3103. doi: 10.1021/acs.jproteome.8b00216
Huang, K. X., Xia, L. Q., Zhang, Y. M., Ding, X. Z., and Zahn, J. A. (2009). Recent advances in the biochemistry of spinosyns. Appl. Microbiol. Biotechnol. 82, 13–23. doi: 10.1007/s00253-008-1784-8
Jenal, U., Reinders, A., and Lori, C. (2017). Cyclic di-GMP: second messenger extraordinaire. Nat. Rev. Microbiol. 15, 271–284. doi: 10.1038/nrmicro.2016.190
Jeon, B. S., Ruszczycky, M. W., Russell, W. K., Lin, G. M., Kim, N., Choi, S. H., et al. (2017). Investigation of the mechanism of the SpnF-catalyzed [4+2]-cycloaddition reaction in the biosynthesis of spinosyn A. Proc. Natl. Acad. Sci. U.S.A. 114, 10408–10413. doi: 10.1073/pnas.1710496114
Jira, J., Rezek, B., Kriha, V., Artemenko, A., Matolínová, I., Skakalova, V., et al. (2018). Inhibition of E. coli growth by nanodiamond and graphene oxide enhanced by luria-bertani medium. Nanomaterials 8:E140. doi: 10.3390/nano8030140
Kalia, D., Merey, G., Nakayama, S., Zheng, Y., Zhou, J., Luo, Y., et al. (2013). Nucleotide, c-di-GMP, c-di-AMP, cGMP, cAMP, (p)ppGpp signaling in bacteria and implications in pathogenesis. Chem. Soc. Rev. 42, 305–341. doi: 10.1039/c2cs35206k
Kallscheuer, N., Polen, T., Bott, M., and Marienhagen, J. (2017). Reversal of β-oxidative pathways for the microbial production of chemicals and polymer building blocks. Metab. Eng. 42, 33–42. doi: 10.1016/j.ymben.2017.05.004
Latha, S., Sivaranjani, G., and Dhanasekaran, D. (2017). Response surface methodology: a non-conventional statistical tool to maximize the throughput of Streptomyces species biomass and their bioactive metabolites. Crit. Rev. Microbiol. 43, 567–582. doi: 10.1080/1040841X.2016.1271308
Lawler, S. P. (2017). Environmental safety review of methoprene and bacterially- derived pesticides commonly used for sustained mosquito control. Ecotoxicol. Environ. Saf. 139, 335–343. doi: 10.1016/j.ecoenv.2016.12.038
Lewer, P., Hahn, D. R., Karr, L. L., Duebelbeis, D. O., Gilbert, J. R., Crouse, G. D., et al. (2009). Discovery of the butenyl-spinosyn insecticides: novel macrolides from the new bacterial strain Saccharopolyspora pogona. Bioorg. Med. Chem. 17, 4185–4196. doi: 10.1016/j.bmc.2009.02.035
Li, L., Rang, J., He, H. C., He, S. Y., Liu, Z. D., Tang, J. L., et al. (2018). Impact on strain growth and butenyl-spinosyn biosynthesis by overexpression of polynucleotide phosphorylase gene in Saccharopolyspora pogona. Appl. Microbiol. Biotechnol. 102, 8011–8021. doi: 10.1007/s00253-018-9178-z
Liu, H. X., Cai, M., Zhang, Y. H., Xiao, J., Ding, X. Z., Sun, Y. J., et al. (2017). Impact on strain phenotypes and spinosad biosynthesis by disruption of phosphomannomutase gene in Saccharopolyspora spinosa. Chin. J Biol. Control 31, 134–141.
Ljungdahl, P. O., and Daignan-Fornier, B. (2012). Regulation of amino acid, nucleotide, and phosphate metabolism in Saccharomyces cerevisiae. Genetics 190, 885–929. doi: 10.1534/genetics.111.133306
Luo, Y. S., Kou, X. X., Ding, X. Z., Hu, S. B., Tang, Y., Li, W. P., et al. (2012). Promotion of spinosad biosynthesis by chromosomal integration of the Vitreoscilla hemoglobin gene in Saccharopolyspora spinosa. Sci. China Life Sci. 55, 172–180. doi: 10.1007/s11427-012-4276-0
Ma, Z., Liu, J. X., Lin, X. Z., Shentu, X. P., Bian, Y. L., and Yu, X. P. (2014). Formation, regeneration, and transformation of protoplasts of Streptomyces diastatochromogenes 1628. Folia Microbiol. 59, 93–97. doi: 10.1007/s12223-013-0271-5
Matsushika, A., Goshima, T., Fujii, T., Inoue, H., Sawayama, S., and Yano, S. (2012). Characterization of non-oxidative transaldolase and transketolase enzymes in the pentose phosphate pathway with regard to xylose utilization by recombinant Saccharomyces cerevisiae. Enzyme Microb. Technol. 51, 16–25. doi: 10.1016/j.enzmictec.2012.03.008
Millar, N. S., and Denholm, I. (2007). Nicotinic acetylcholine receptors: targets for commercially important insecticides. Invert. Neurosci. 7, 53–66. doi: 10.1007/s10158-006-0040-0
Nikel, P. I., Chavarría, M., Fuhrer, T., Sauer, U., and de Lorenzo, V. (2015). Pseudomonas putida KT2440 strain metabolizes glucose through a cycle formed by enzymes of the entner-doudoroff, embden-meyerhof-parnas, and pentose phosphate pathways. J. Biol. Chem. 290, 25920–25932. doi: 10.1074/jbc.M115.687749
Patel, V., Black, K. A., Rhee, K. Y., and Helmann, J. D. (2019). Bacillus subtilis PgcA moonlights as a phosphoglucosamine mutase in support of peptidoglycan synthesis. PLoS Genet. 15:e1008434. doi: 10.1371/journal.pgen.1008434
Paul, R., Dandopath, P. M., Banerjee, R., and Sen, U. (2014). Crystallization and preliminary X-ray analysis of a ribokinase from Vibrio cholerae O395. Acta. Crystallogr. F Struct. Biol. Commun. 70, 1098–1102. doi: 10.1107/S2053230X14014411
Pimkin, M., and Markham, G. D. (2009). Inosine 5’-monophosphate dehydrogenase. Adv. Enzymol. Relat. Areas Mol. Biol. 76, 1–53.
Qian, Z., Tianwei, H., Mackey, H. R., van Loosdrecht, M. C. M., and Guanghao, C. (2019). Recent advances in dissimilatory sulfate reduction: from metabolic study to application. Water Res. 150, 162–181. doi: 10.1016/j.watres.2018.11.018
Richie, D. L., Wang, L., Chan, H., De Pascale, G., Six, D. A., Wei, J. R., et al. (2018). A pathway-directed positive growth restoration assay to facilitate the discovery of lipid a and fatty acid biosynthesis inhibitors in Acinetobacter baumannii. PLoS One 13:e0193851. doi: 10.1371/journal.pone.0193851
Romano, A. H., and Conway, T. (1996). Evolution of carbohydrate metabolic pathways. Res. Microbiol. 147, 448–455. doi: 10.1016/0923-2508(96)83998-2
Rubio, V., Llorente, P., and Britton, H. G. (1998). Mechanism of carbamoyl phosphate synthetase from Escherichia coli–binding of the ATP molecules used in the reaction and sequestration by the enzyme of the ATP molecule that yields carbamoyl phosphate. Eur. J. Biochem. 255, 262–270. doi: 10.1046/j.1432-1327.1998.2550262.x
Sainz, F., Mas, A., and Torija, M. J. (2017). Effect of ammonium and amino acids on the growth of selected strains of Gluconobacter and Acetobacter. Int. J. Food Microbiol. 242, 45–52. doi: 10.1016/j.ijfoodmicro.2016.11.006
Sánchez-Pascuala, A., de Lorenzo, V., and Nikel, P. I. (2017). Refactoring the embden-meyerhof-parnas pathway as a whole of portable glucobricks for implantation of glycolytic modules in gram-negative bacteria. ACS Synth. Biol. 6, 793–805. doi: 10.1021/acssynbio.6b00230
Sauer, U., and Eikmanns, B. J. (2005). The PEP-pyruvate-oxaloacetate node as the switch point for carbon flux distribution in bacteria. FEMS Microbiol. Rev. 29, 765–794. doi: 10.1016/j.femsre.2004.11.002
Schertl, P., Danne, L., and Braun, H. P. (2017). 3-Hydroxyisobutyrate dehydrogenase is involved in both, Valine and Isoleucine degradation in Arabidopsis thaliana. Plant Physiol. 175, 51–61. doi: 10.1104/pp.17.00649
Schniete, J. K., Cruz-Morales, P., Selem-Mojica, N., Fernández-Martínez, L. T., Hunter, I. S., Barona-Gómez, F., et al. (2018). Expanding primary metabolism helps generate the metabolic robustness to facilitate antibiotic biosynthesis in Streptomyces. MBio 9:e2283-17. doi: 10.1128/mBio.02283-17
Seol, E., Sekar, B. S., Raj, S. M., and Park, S. (2016). Co-production of hydrogen and ethanol from glucose by modification of glycolytic pathways in Escherichia coli- from Embden-Meyerhof-Parnas pathway to pentose phosphate pathway. Biotechnol. J. 11, 249–256. doi: 10.1002/biot.201400829
Sindt, N. M., Robison, F., Brick, M. A., Schwartz, H. F., Heuberger, A. L., and Prenni, J. E. (2018). MALDI-TOF-MS with PLS modeling enables strain typing of the bacterial plant pathogen Xanthomonas axonopodis. J. Am. Soc. Mass Spectrom. 29, 413–421. doi: 10.1007/s13361-017-1839-0
Sun, D., Liu, C., Zhu, J., and Liu, W. (2017). Connecting metabolic pathways: sigma factors in Streptomyces spp. Front. Microbiol. 8:2546. doi: 10.3389/fmicb.2017.02546
Sun, H. B., and Wang, X. F. (2014). Determination of phosphate in diuranate by phosphomolybdenum blue spectrophotometry. Uranium Min. Metall. 33, 106–110.
Suo, Y., Fu, H., Ren, M., Liao, Z., Ma, Y., and Wang, J. (2018). Enhanced butyric acid production in Clostridium tyrobutyricum by overexpression of rate-limiting enzymes in the Embden-Meyerhof-Parnas pathway. J. Biotechnol. 27, 14–21. doi: 10.1016/j.jbiotec.2018.02.012
Tang, Y., Xia, L. Q., Ding, X. Z., Luo, Y. S., Huang, F., and Jiang, Y. W. (2011). Duplication of partial spinosyn biosynthetic gene cluster in Saccharopolyspora spinosa enhances spinosyn production. FEMS Microbiol. Lett. 325, 22–29. doi: 10.1111/j.1574-6968.2011.02405.x
Tittmann, K. (2014). Sweet siblings with different faces: the mechanisms of FBP and F6P aldolase, transaldolase, transketolase and phosphoketolase revisited in light of recent structural data. Bioorg. Chem. 57, 263–280. doi: 10.1016/j.bioorg.2014.09.001
ValcÁrcel, F., SÁnchez, J. L., Jaime, J. M., Basco-Basco, P. I, Guajardo, S. C., Cutuli, M. T., et al. (2015). Control of tick infestations in Oryctolagus cuniculus (Lagomorpha: Leporidae) with spinosad under laboratory and field conditions. J. Med. Entomol. 52, 207–213. doi: 10.1093/jme/tju018
Vuoristo, K. S., Mars, A. E., Sanders, J. P. M., Eggink, G., and Weusthuis, R. A. (2017). Metabolic engineering of TCA cycle for production of chemicals. Trends Biotechnol. 34, 191–197. doi: 10.1016/j.tibtech.2015.11.002
Wang, J., Liu, H. H., Huang, D., Jin, L. N., Wang, C., and Wen, J. P. (2017a). Comparative proteomic and metabolomic analysis of Streptomyces tsukubaensis reveals the metabolic mechanism of FK506 overproduction by feeding soybean oil. Appl. Microbiol. Biotechnol. 101, 2447–2465. doi: 10.1007/s00253-017-8136-5
Wang, J., Liu, S., Li, Y., Wang, H., Xiao, S., Li, C., et al. (2017b). Central carbon metabolism influences cellulase production in Bacillus licheniformis. Lett. Appl. Microbiol. 66, 49–54. doi: 10.1111/lam.12813
Wang, L. (2016). Mitochondrial purine and pyrimidine metabolism and beyond. Nucleosides Nucleotides Nucleic Acids 35, 578–594. doi: 10.1080/15257770.2015.1125001
Wentzel, A., Sletta, H., Stream, C., Ellingsen, T. E., and Bruheim, P. (2012). Intracellular metabolite pool changes in response to nutrient depletion induced metabolic switching in Streptomyces coelicolor. Metabolites 2, 178–194. doi: 10.3390/metabo2010178
White, W. H., Riggs, K. L., Totten, M. L., Snyder, D. E., McCoy, C. M., and Young, D. R. (2017). Initial evaluations of the effectiveness of spinetoram as a long-acting, oral systemic pulicide for controlling cat flea (Ctenocephalides felis) infestations on dogs. Vet. Parasitol. 15, 25–31. doi: 10.1016/j.vetpar.2016.11.018
Wittmann, C., Meza, E., Becker, J., Bolivar, F., and Gosset, G. (2012). Consequences of phosphoenolpyruvate: sugar phosphotranferase system and pyruvate kinase isozymes inactivation in central carbon metabolism flux distribution in Escherichia coli. Microb. Cell Fact. 11:127. doi: 10.1186/1475-2859-11-127
Wu, G., Zhi, W. B., Hu, Y. H., Liang, M. M., and Yang, W. G. (2016). Comparative proteomic analysis of Streptomyces aureochromogenes under different carbon sources and insights into polyoxin production. Appl. Biochem. Biotechnol. 180, 491–503. doi: 10.1007/s12010-016-2112-x
Xia, T., Sriram, N., Lee, S. A., Altman, R., Urbauer, J. L., Altman, E., et al. (2017). Glucose consumption in carbohydrate mixtures by phosphotransferase-system mutants of Escherichia coli. Microbiology 163, 866–877. doi: 10.1099/mic.0.000480
Xu, M., Wu, Y., Yang, Y., and Xia, L. Q. (2014). Impact on strain growth and spinosad biosynthesis by overexpression of cyclic AMP receptor protein gene in Saccharopolyspora spinosa. Scientia. Agricultura. Sinica. 47, 3577–3587.
Yang, Q., Ding, X. Z., Liu, X. M., Liu, S., Sun, Y. J., Yu, Z. Q., et al. (2014). Differential proteomic profiling reveals regulatory proteins and novel links between primary metabolism and spinosad production in Saccharopolyspora spinosa. Microb. Cell Fact. 13:27. doi: 10.1186/1475-2859-13-27
Yang, Q., Li, Y. L., Yang, H. J., Rang, J., Tang, S. J., He, L., et al. (2015). Proteomic insights into metabolic adaptation to deletion of metE in Saccharopolyspora spinosa. Appl. Microbiol. Biotechnol. 99, 8629–8641. doi: 10.1007/s00253-015-6883-8
Yang, Y., Luo, L. G., Xu, M., and Xia, L. Q. (2016). Disruption of leucyl aminopeptidase gene affects phenotypes and second metabolite production of Saccharopolyspora spinosa. Wei Sheng Wu Xue Bao 56, 629–642. Chinese,
Zeng, X., Zhao, J., Chen, X., Mao, Z., and Miao, W. (2017). Insights into the simultaneous utilization of glucose and glycerol by Streptomyces albulus M-Z18 for high e-poly-L-lysine productivity. Bioprocess Biosyst. Eng. 40, 1775–1785. doi: 10.1007/s00449-017-1832-9
Zhou, W., Tsai, A., Dattmore, D. A., Stives, D. P., Chitrakar, I., D’alessandro, A. M., et al. (2019). Crystal structure of E. coli PRPP synthetase. BMC Struct. Biol. 19:1. doi: 10.1186/s12900-019-0100-4
Keywords: Saccharopolyspora pogona, Saccharopolyspora spinosa, butenyl-spinosyn, spinosyn, comparative proteomic analysis, metabolic pathway, rhamnose synthetic genes, metK
Citation: Rang J, He H, Yuan S, Tang J, Liu Z, Xia Z, Khan TA, Hu S, Yu Z, Hu Y, Sun Y, Huang W, Ding X and Xia L (2020) Deciphering the Metabolic Pathway Difference Between Saccharopolyspora pogona and Saccharopolyspora spinosa by Comparative Proteomics and Metabonomics. Front. Microbiol. 11:396. doi: 10.3389/fmicb.2020.00396
Received: 10 January 2020; Accepted: 26 February 2020;
Published: 18 March 2020.
Edited by:
Miguel A. Aon, National Institute on Aging (NIA), United StatesReviewed by:
Alberto A. Iglesias, National University of the Littoral, ArgentinaGennaro Agrimi, University of Bari Aldo Moro, Italy
Copyright © 2020 Rang, He, Yuan, Tang, Liu, Xia, Khan, Hu, Yu, Hu, Sun, Huang, Ding and Xia. This is an open-access article distributed under the terms of the Creative Commons Attribution License (CC BY). The use, distribution or reproduction in other forums is permitted, provided the original author(s) and the copyright owner(s) are credited and that the original publication in this journal is cited, in accordance with accepted academic practice. No use, distribution or reproduction is permitted which does not comply with these terms.
*Correspondence: Liqiu Xia, eGlhbHFAaHVubnUuZWR1LmNu