 Víctor Fernández-Juárez1*
 Antoni Bennasar-Figueras2
 Antoni Sureda-Gomila3
 Guillem Ramis-Munar4
 Nona S. R. Agawin1*
- 1Marine Ecology and Systematics (MarES), Department of Biology, University of the Balearic Islands, Palma, Spain
- 2Grup de Microbiologia, Department of Biology, University of the Balearic Islands, Palma, Spain
- 3Research Group on Community Nutrition and Oxidative Stress, University of the Balearic Islands and CIBEROBN (Fisiopatología de la Obesidad y la Nutrición), Palma, Spain
- 4Cellomic Unit of University Institute of Research in Health Sciences of the Balearic Islands, Palma, Spain
Diazotrophs or N2-fixers are one of the most ecologically significant groups in marine ecosystems (pelagic and benthic). Inorganic phosphorus (PO43–) and iron (Fe) can limit the growth and N2-fixing capacities of cyanobacteria. However, studies investigating co-limitation of these factors are lacking. Here, we added different concentrations of PO43– and Fe in two cyanobacterial species whose relatives can be found in seagrass habitats: the unicellular Halothece sp. (PCC 7418) and the filamentous Fischerella muscicola (PCC 73103), grown under different nitrate (NO3–) concentrations and under N2 as sole N source, respectively. Their growth, pigment content, N2-fixation rates, oxidative stress responses, and morphological and cellular changes were investigated. Our results show a serial limitation of NO3– and PO43– (with NO3– as the primary limiting nutrient) for Halothece sp. Simultaneous co-limitation of PO43– and Fe was found for both species tested, and high levels of Fe (especially when added with high PO43– levels) inhibited the growth of Halothece sp. Nutrient limitation (PO43–, Fe, and/or NO3–) enhanced oxidative stress responses, morphological changes, and apoptosis. Furthermore, an extensive bio-informatic analysis describing the predicted Pho, Fur, and NtcA regulons (involved in the survival of cells to P, Fe, and N limitation) was made using the complete genome of Halothece sp. as a model, showing the potential of this strain to adapt to different nutrient regimes (P, Fe, or N).
Introduction
Diazotrophs or N2-fixers, one of the most important ecological groups, are microorganisms capable of converting atmospheric dinitrogen gas (N2) into a readily usable form of dissolved inorganic nitrogen, i.e., ammonia (NH3). This process is carried out through the nitrogenase protein complex (encoded by nifH, nifD, and nifK) by nitrogenase-containing autotrophic and heterotrophic bacteria (Hoffman et al., 2014). Biological N2-fixation is an essential process in the marine N-cycle, providing new N to the oceans and compensating ocean denitrification (Sohm et al., 2011). In coastal benthic communities (e.g., Mediterranean seagrass Posidonia oceanica communities), N2-fixers are also important sources of new N, potentially supplying the entire demand of N of the associated plants (Agawin et al., 2016, 2017). These benthic communities can harbor a high diversity of N2-fixing cyanobacteria among which are different groups of cyanobacteria that can be classified as unicellular, filamentous heterocyst forming, and filamentous non-heterocyst forming (Zehr, 2011).
Factors affecting the growth and abundance of cyanobacteria include both abiotic [e.g., macronutrients (e.g., phosphorus, P, and nitrogen, N), micronutrients (e.g., iron, Fe), light, and temperature] and biotic factors (e.g., viral cell lysis or grazing) (Sohm et al., 2011; Zehr, 2011). The nutrients P, N, and Fe are suggested to be the most important liming nutrients for cyanobacterial growth (Mills et al., 2004; Browning et al., 2017). Phosphorus (P) has key structural (i.e., for nucleic acids and for the cell membranes of most bacteria) and functional roles in various metabolic processes and limiting concentrations of P affect photosynthesis, respiration, and activities of ATP-dependent enzymes (Tripathi et al., 2013; Santos-Beneit, 2015). Nitrogen is essential for protein synthesis, and limiting concentrations of N can reduce cellular growth rates and contribute to the phenomenon called chlorosis, which causes degradation of phycobiliproteins and can lead to posterior downregulation of photosynthesis (Richaud et al., 2001; Klotz et al., 2015). Iron (Fe) is also important for photosynthesis and growth (Sunda and Huntsman, 2015); however, cells must maintain a state of homeostasis since elevated Fe-intracellular concentrations can enhance oxidative stress via Fenton and Haber–Weiss reactions (Kranzler et al., 2013). Under Fe limitation, cyanobacteria can import Fe into the cells through various high-affinity Fe transporters (Kranzler et al., 2014) or through the liberation of low-molecular-weight Fe chelators (e.g., siderophores) (Kranzler et al., 2013). In order to survive and adapt in limiting nutrient conditions, cyanobacteria must trigger molecular mechanisms by transcription factors (TFs). The most well-studied TFs in marine bacteria are PhoB, ferric uptake (Fur), and global nitrogen (NtcA) regulators involved in the acquisition of P, Fe, and N, respectively (Baichoo and Helmann, 2002; Yuan et al., 2006; Llacer et al., 2010). The PhoB, together with PhoR, an inner-membrane histidine kinase, forms a two-component regulatory system (Santos-Beneit, 2015). These TFs are activated or repressed to adapt to a changing environment (e.g., changes in nutrient concentrations) and recognize consensus sequences called transcriptional binding sites (TBS), namely, the PHO box, Fur, and NtcA boxes (Baichoo and Helmann, 2002; Yuan et al., 2006; Llacer et al., 2010), which control the expression of specific genes. The genes controlled by these TFs (PhoB, Fur, or NtcA) are part of what is known as the Pho, Fur, and NtcA regulons, and their prediction can help us understand how cells may adapt and survive under limiting concentrations of P, Fe, and N, respectively.
The demand for P, Fe, and N for N2-fixing cyanobacteria may be different from that for non-N2-fixing bacteria. Generally, cyanobacteria have elevated ratio of nitrogen (N):phosphorus (P) (a molar ratio above 25 compared with the general Redfield ratio of 16 in marine phytoplankton) (Redfield, 1934; Geider and La Roche, 2002; Quigg et al., 2011). For cyanobacteria, Fe requirements are 10-fold higher than in non-photosynthetic bacteria (Kranzler et al., 2013). For cyanobacterial N2-fixers, Fe is even more important, as Fe is an important structural component of the nitrogenase complex (i.e., nifH) (Hoffman et al., 2014). N2-fixation also requires a large amount of photosynthetically derived energy, which in turn is P-dependent (Sañudo-Wilhelmy et al., 2001). While non-N2-fixing cyanobacteria are usually limited by N, N2-fixing cyanobacteria can use ubiquitous atmospheric N2, conferring them a competitive advantage over non-N2-fixing cyanobacteria in N-limited waters (Sohm et al., 2011). Usually, under limiting concentrations of inorganic N (e.g., NH3 and NO3–), N2-fixation is stimulated, while high concentrations of inorganic N inhibit N2-fixation (Manhart and Wong, 1980; Nelson et al., 1982; Knapp, 2012). In a previous study, the P-requirements of Halothece sp. PCC 7418 increased in N-limited conditions (i.e., when N2-fixation was stimulated), consequently activating their P-acquisition mechanisms [i.e., alkaline phosphatase activity (APA) and P-uptake], which were in turn controlled by Fe availability (Fernández-Juárez et al., 2019). How the concentrations of P and Fe (and their interacting effects) affect the different groups of N2-fixing cyanobacteria grown in differing N conditions remains to be investigated.
Here, we investigated the response to different concentrations of PO43– and Fe, in a multi-factorial design, of two species of N2-fixing cyanobacteria: the unicellular Halothece sp. PCC 7418 and the filamentous heterocyst-forming Fischerella muscicola PCC 73103, grown under different nitrate (NO3–) concentrations and under N2 as sole N source, respectively. Relatives of these two cyanobacteria have been previously found in association with the seagrass P. oceanica (Supplementary Material, Supplementary Figure S1, Agawin et al., 2017). The responses were measured in terms of physiological and molecular parameters (growth, pigment content, N2-fixation rates, oxidative stress, morphology, and apoptosis). To understand how Halothece sp. (PCC 7418) adapts in nutrient limiting environments, an extensive in silico analysis was done, taking as a model the complete genome of Halothece sp. to predict the Pho, Fur, and NtcA boxes, and the Pho, Fur, and NtcA regulons, respectively.
Materials and Methods
Strains and Growth Conditions
N2-fixing bacterial strains (Halothece sp. PCC 7418 and F. muscicola sp. PCC 73103) were obtained from Pasteur Culture Collection of Cyanobacteria (PCC). Experiments were conducted in 250-ml acid-clean quartz Erlenmeyer flasks filled with 150 ml of their corresponding culture media. We used ASN-III + Turks Island salts 4× medium and BG110 culture medium for Halothece sp. and F. muscicola, respectively (Stanier et al., 1979). These media were supplemented with 0.1–0.3% (p/v) glucose, and cells were cultivated under aerobic condition in 12:12-h light–dark cycle at 25°C and under continuous low-intensity fluorescent light (≅30 μE m–2 s–1) in a rotatory shaker (120 rpm). The batch cultures were maintained for over 10–14 days for each experiment, and the initial inoculum of cells was added at the exponential phase [O.D.750 nm/975 nm ≅ 0.2 (Halothece sp.)/1.0 (F. muscicola)] from their original culture medium. All samples were manipulated in a class-100 clean hood to avoid Fe contamination. The subcultures for seeding were centrifuged and washed with their corresponding medium without PO43–, Fe, and NO3–.
For Halothece sp., three conditions were established for PO43– concentrations: [Low PO43–] (0.1 μM), [Medium PO43–] (1 μM), and [High PO43–] (45 μM). Furthermore, three conditions for Fe were also established: [Low Fe] (2 nM), [Medium Fe] (20 nM), and [High Fe] (7.5 μM). These PO43– and Fe concentrations were combined in nine experimental conditions ([Low PO43––Low Fe], [Low PO43––Medium Fe], [Low PO43––High Fe], [Medium PO43––Low Fe], [Medium PO43––Medium Fe], [Medium PO43––High Fe], [High PO43––Low Fe], [High PO43––Medium Fe], and [High PO43––High Fe]) (Supplementary Table S1). The solutions of PO43–, Fe, and NO3– were prepared from dipotassium phosphate (K2HPO4), ferric citrate (C6H5FeO7), and sodium nitrate (NaNO3), respectively. As reference for the nutrient concentrations for [Low PO43–] and [Low Fe], we followed the surface water concentrations of the Mediterranean Sea (Statham and Hart, 2005; Powley et al., 2017), while for [High PO43–] and [High Fe], we followed the optimal concentrations of ASN-III + Turks Island salts 4× medium. We performed two sets of experiments following Fernández-Juárez et al. (2019): under 4.4 mM of NO3– (optimal concentration) and 0.15 mM of NO3– (referred to from now on as [Low NO3–] and represents the minimum amount of NO3– in which Halothece sp. grew with maximal N2-fixation rates). The cells were incubated for 10 days in these experiments (Supplementary Table S1). After these experiments, we selected the experimental conditions – [Low PO43––Low Fe], [Low PO43––High Fe], [High PO43––Low Fe], and [High PO43––High Fe] – in which Halothece sp. cells were grown under extremely limiting NO3– concentrations (6.66 nM), following NO3– concentrations in the Mediterranean Sea as reference (Powley et al., 2017; Supplementary Table S1). The cultures were maintained over 12 days. To check the reversibility of the phenotypic characteristics of the cells, we re-inoculated with PO43–, Fe, and/or NO3– in optimal concentrations (PO43–: 45 μM, Fe: 7.5 μM, and NO3–: 4.4 mM) at day 12. Inorganic phosphorus (PO43–) was added to [Low PO43––Low Fe], and NO3– was added to [High PO43––High Fe] in extremely limiting NO3– treatments; and PO43– and Fe were added to [Low PO43––Low Fe] in optimal NO3– treatments. These cultures were maintained for over 4 days more (Supplementary Table S1).
For F. muscicola, PO43– and Fe were added in nine combination treatments as previously described for Halothece sp. but using 180 μM for [High PO43–] and 30 μM for [High Fe]. These optimal concentrations for PO43– and Fe are recommended for BG110 medium (Stanier et al., 1979). These PO43– and Fe combinations were performed without any combined N source, and cultures were maintained over 14 days.
All cultures with their respective treatment conditions were performed in duplicate, and growth, pigment content, N2-fixation rates, reactive oxygen species (ROS) production and morphological and/or cellular response (e.g., apoptosis) were measured. For Halothece sp., subsamples of the culture (1.5 ml) were taken from the culture flasks at the final stage of the experiment and were counted through flow cytometric analysis to normalize the results per cell and for the phenotype recovery experiments. For F. muscicola, results were normalized per total chlorophyll (Chl).
Growth Measurement
The growth of Halothece sp. and F. muscicola was measured by optical density (O.D.) using a quartz cuvette and read in Cary Eclipse spectrometer. Growth measurements were measured in Halothece sp. every 2 days at 750 nm. In F. muscicola, we measured O.D. at 975 nm (maximum O.D. of the cells), and this was measured every 2–4 days. Growth rate (μ, day–1) and generation time (Tg, days) were calculated following the formula described in Widdel (2010) and Ng et al. (2015):
where O.D.f is the O.D. at the final time (Tf) and O.D.i is the O.D. at the initial time (Ti) of the exponential phase of the growth curve.
To evaluate the type of co-limitation of the growth response of N and P (simultaneous co-limitation, independent co-limitation, or serial limitation), we followed the log ratio effect-size criteria based on the mean treatment and control response in Harpole et al. (2011) and Hedges et al. (1999). We calculated the following log growth response ratios as follows:
For Halothece sp., N0P0 represents the growth rate under extremely limiting NO3– conditions at [Low PO43–], N1P0 is the growth rate under [Low NO3–] or optimal NO3– at [Low PO43–] conditions, N0P1 is the growth rate under extremely limiting NO3– conditions at [High PO43–], and N1P1 is the growth rate under combinations of under [Low NO3–] or optimal NO3– at [High PO43–] conditions. Responses = 0 are responses identical to control values (no response), >0 are positive responses, and <0 are negative responses. The critical threshold value, representing the minimum significant treatment responses at p = 0.05 relative to N0P0, was calculated to graphically determine the nature of co-limitation. To choose this critical threshold value, we used the T-score criteria, in which those values that surpass the critical T-score were considered statistically significant (Supplementary Material, Harpole et al., 2011). We also evaluated the type of co-limitation growth response of PO43– and Fe under NO3– optimal and [Low NO3–] conditions, substituting Fe for N in the eqs. 3–5 above, with Fe0P0 representing the growth rate under [Low Fe] at [Low PO43–] conditions. For F. muscicola, we could only evaluate the nature of P and Fe co-limitation because all the treatments were incubated with no added combined N source.
Monod kinetic models were performed with data of the initial concentrations of PO43–, Fe, and NO3– (Monod, 1949). The Monod growth curves for Halothece sp. were plotted against different concentrations of NO3– and PO43– incubated at different PO43– ([Low PO43–], [Medium PO43–], and [High PO43–]) and Fe ([Low–Medium Fe] and [High Fe]) concentrations, respectively. The Monod growth curves for F. muscicola incubated at different Fe concentrations ([Low–Medium Fe] and [High Fe]) were also plotted against different concentrations of PO43–. Monod kinetic parameters were calculated from plotted hyperbolic functions of the Monod equation:
where Q is the concentration of NO3– or PO43–, Qmin is the minimal concentration of NO3– or PO43– for growth, and μ′max is the maximum specific growth rate. Half-velocity constant (Kμ) was calculated as the concentration at half of the μ′max (Monod, 1949).
Abundance Measurement of Halothece sp. Using Flow Cytometry
Halothece sp. cells at the end of the different experiments were fixed with glutaraldehyde 25% (v/v) in H2O (Sigma-Aldrich) [final concentration 0.05% (v/v)] and were counted in a Becton Dickinson FACSVerse cytometer (Becton and Dickinson, Franklin Lakes, NJ, United States). Fluorescent beads, BD FACSuiteTM CS&T research beads (Becton and Dickinson and Company BD Biosciences, San Jose, CA, United States), were used as internal standard to calibrate the instrument. To count Halothece sp. cells, we selected fluorescein isothiocyanate (FITC) (488-nm excitation, 530/30-nm emission) and phycoerythrin (PE) (488-nm excitation, 576/26-nm emission) combination fluorescence signals, which show clearly the population of the cells, recording for each sample a total of 10 × 103 cells.
Pigment Measurement in Fischerella muscicola
Chlorophyll (Chla, Chlb, and total Chl) and phycobiliprotein [R-PE and R-phycocyanin (R-PC)] content for F. muscicola were measured and calculated following Porra et al. (1989) and Sobiechowska-Sasim et al. (2014). Briefly, for chlorophyll measurements, 5-ml samples of the cultures were filtered through MFV5-025 glass microfiber filters (MFV5-025, FilterLab), grounded, and extracted with 4 ml of acetone 80% for 2 h. After extraction, cells and filter debris were discarded by centrifugation, and the supernatant was read at 647 and 664 nm in quartz cuvette in a Cary Eclipse spectrometer. For phycobiliproteins, 5-ml samples of the culture were filtered as described above, grounded, and extracted in a buffer medium composed of 0.25 M of Trizma base, 10 mM of disodium EDTA, and 2 mg ml–1 of lysozyme. After extraction, cells and filter debris were centrifuged, and supernatants were read at 564, 618, and 750 nm in quartz cuvette in a Cary Eclipse spectrometer.
N2-Fixation Rate Measurement by Acetylene Reduction Assay
N2-fixation rates of Halothece sp. (pmol N2-fixed cell–1 h–1) and F. muscicola (nmol N2-fixed nmol total Chl–1 h–1) were measured through acetylene reduction assay (ARA) at the end of the experiments, following the method of Agawin et al. (2014). Halothece sp. N2-fixing activities were measured under known N2-fixing conditions (i.e., anaerobic condition and during the dark photoperiod and in [Low NO3–]) (Reddy et al., 1993). For F. muscicola, measurements of N2-fixation rates were performed under aerobic conditions during both light and dark photoperiods. Samples of known volume of the cultures (10 ml) were filtered through 0.45-μm GF/F filters (MFV5-025, FilterLab), these filters were incubated with acetylene at 20% (v/v) final concentration injected in each vial using gas-tight Hamilton syringes, and ethylene production was measured (after 3 h of incubation) by gas chromatographic (GC) methods. Ethylene and acetylene were determined using a GC (model HP-5890, Agilent Technologies) equipped with a flame ionization detector (FID). The column was a Varian wide-bore column (ref. CP7584) packed with CP-PoraPLOT U (27.5-m length, 0.53-mm inside diameter, 0.70-mm outside diameter, 20-μm film thickness). Helium was used as carrier gas at a flow rate of 30 ml min–1. Hydrogen and airflow rates were set at 30 and 365 ml min–1, respectively. The split flow was used so that the carrier gas flow through the column was 4 ml min–1 at a pressure of 5 psi. Oven, injection, and detector temperatures were set at 52, 120, and 170°C, respectively. Before passing the samples in the GC, standard ethylene and acetylene were ran, and their retention times noted. Ethylene produced was calculated using the equations in Stal (1988). The acetylene reduction rates were converted to N2-fixation rates (nmol ml–1 h–1) using a factor of 4:1 (Jensen and Cox, 1983).
Measurement of Reactive Oxygen Species Production
The ROS production was measured using the molecular probe 2′,7′-dichlorofluorescein diacetate (DCFH-DA; Sigma) in culture media (ASN-III + Turks Island salts 4× or BG110), which was added to a 96-well microplate (Thermo Scientific) containing cyanobacterial samples (final concentration of probe at 15 μg ml–1). Within the cells, H2O2 production oxidizes DCFH-DA to 2′,7′-dichlorofluorescein (DCF) whose green fluorescence can be measured at 25°C in a FLx800 Microplate Fluorescence Reader (BioTek Instruments, Inc.) for 1 h with an excitation of 480 nm and emission of 530 nm. The measurements (the slope of the linear regression obtained) were expressed as arbitrary units (AU) per cell–1. DCFH-DA was added in ASN-III + Turks Island salts 4× or BG110 without cells as blanks under the same conditions as above.
Microscopy and Morphological Studies
Autofluorescence, morphological changes, and DCF oxidized by ROS were observed with a confocal microscope (Leica TCS SPE, Leica Microsystems). Samples were placed onto a clean glass microscope slide, and 40× and 100× objective lens were used to visualize the cells. Images were processed using the software Leica application suite (Leica Microsystems). Autofluorescence was detected with an excitation of 532 nm and an emission of 555- to 619-nm wavelengths. For visualization of DCF oxidized by ROS, we used excitation of 488 nm and emission of 493- to 562-nm wavelengths. Cell apoptosis for F. muscicola was observed with Alexa Fluor 488 annexin V/Dead Cell Apoptosis Kit (Thermo Fisher), in which apoptotic cells were detected when the exposed phosphatidylserine of these cells conjugates with annexin. Annexin was detected and visualized at excitation of 530–570 nm and emission of 488-nm wavelengths.
Bio-Informatic in silico Analysis
The TBSs (PHO box, Fur, and NtcA boxes) for SphR (i.e., PhoB), ferric uptake regulator (Fur), and global nitrogen regulator (NtcA) already described in cyanobacteria were explored and downloaded from RegPrecise (May, 2020), a web resource for collection, visualization, and analysis of transcriptional regulons reconstructed by comparative genomics (Novichkov et al., 2013). From this database, multifasta files were generated for each TBS, including several genera of cyanobacteria (Cyanothece, Gloeobacter, Microcystis, Nostoc, Prochlorococcus, Synechococcus, Synechocystis, Thermosynechococcus, and Trichodesmium). We obtained three separated multifasta files (one for each TBS type) that contained 77 sequences for PHO box, 167 sequences for Fur boxes, and 228 sequences for NtcA boxes (Supplementary Material). For the prediction of the TBS (PHO box, Fur, and NtcA boxes) for Halothece sp., we used a user-friendly web interface for prediction of prokaryote promoter elements and regulons, PePPER, using the DNA motif build and search platform1 (de Jong et al., 2012). Position frequency matrices (PFMs; using MEME and subsequently transposed to a MOODS compatible PWM format) were made from each multifasta file (Supplementary Material). The PFMs generated were searched in the whole genome of Halothece sp. PCC 7418 (GenkBank: NC_019779.1), obtaining 804 hits for SphR (PhoB), 822 hits for Fur, and 238 hits for NtcA. The corresponding hits were manually explored with UGENE (Golosova et al., 2014). We selected the potential TBS on the basis of their relative positions to the genes (a maximum of −800 bp upstream or +40 bp downstream). DNA sequence logos were generated with WebLogo (Crooks et al., 2004) to graphically indicate the relative frequency of each amino at each position, i.e., predicting the consensus sequences for Pho, Fur, and NtcA boxes. Finally, the genes detected as associated to PHO box, Fur, and NtcA boxes were annotated and submitted to EggNOG v5.0 for further identification of orthology relationships and for functional analysis to describe the Pho, Fur, and NtcA regulons, respectively (Huerta-Cepas et al., 2018).
Statistical Analysis
Non-parametric test, Kruskal–Wallis analysis followed by an unpaired two-samples Wilcoxon test was used to study the effect of the nutrient treatment conditions to growth, pigment concentrations, N2-fixation rates, and ROS production. Spearman’s correlation was used to determine the relationships between growth and N2-fixation rates. The statistical analyses were performed using the SPSS program version 21 (IBM Corp year 2012).
Results
Effect of Varying Nutrient Concentrations (P, Fe, and/or N) on Halothece sp. and Fischerella muscicola
Growth of Halothece sp. Under Different Concentrations of NO3–
The decreasing concentrations of inorganic nitrogen (i.e., NO3–) negatively affected the growth of Halothece sp. PCC 7418 (Kruskal–Wallis, H = 24.55, 2 d.f., p = 0.045, Table 1). Average growth rates (μ, of all the combinations of different PO43– and Fe concentrations) under optimal, low, and extremely limiting NO3– conditions were 0.33 ± 0.017 day–1 (Tg, 2.18 days), 0.24 ± 0.023 day–1 (Tg, 3.37 days), and 0.046 ± 0.0075 day–1 (Tg, 16.52 days), respectively. Under extremely limiting NO3– conditions, the growth of the unicellular cyanobacteria dramatically decreased with rates eight times lower than in optimal NO3– conditions, and cells were not able to overcome the latent growth phase in the cultures (Table 1).
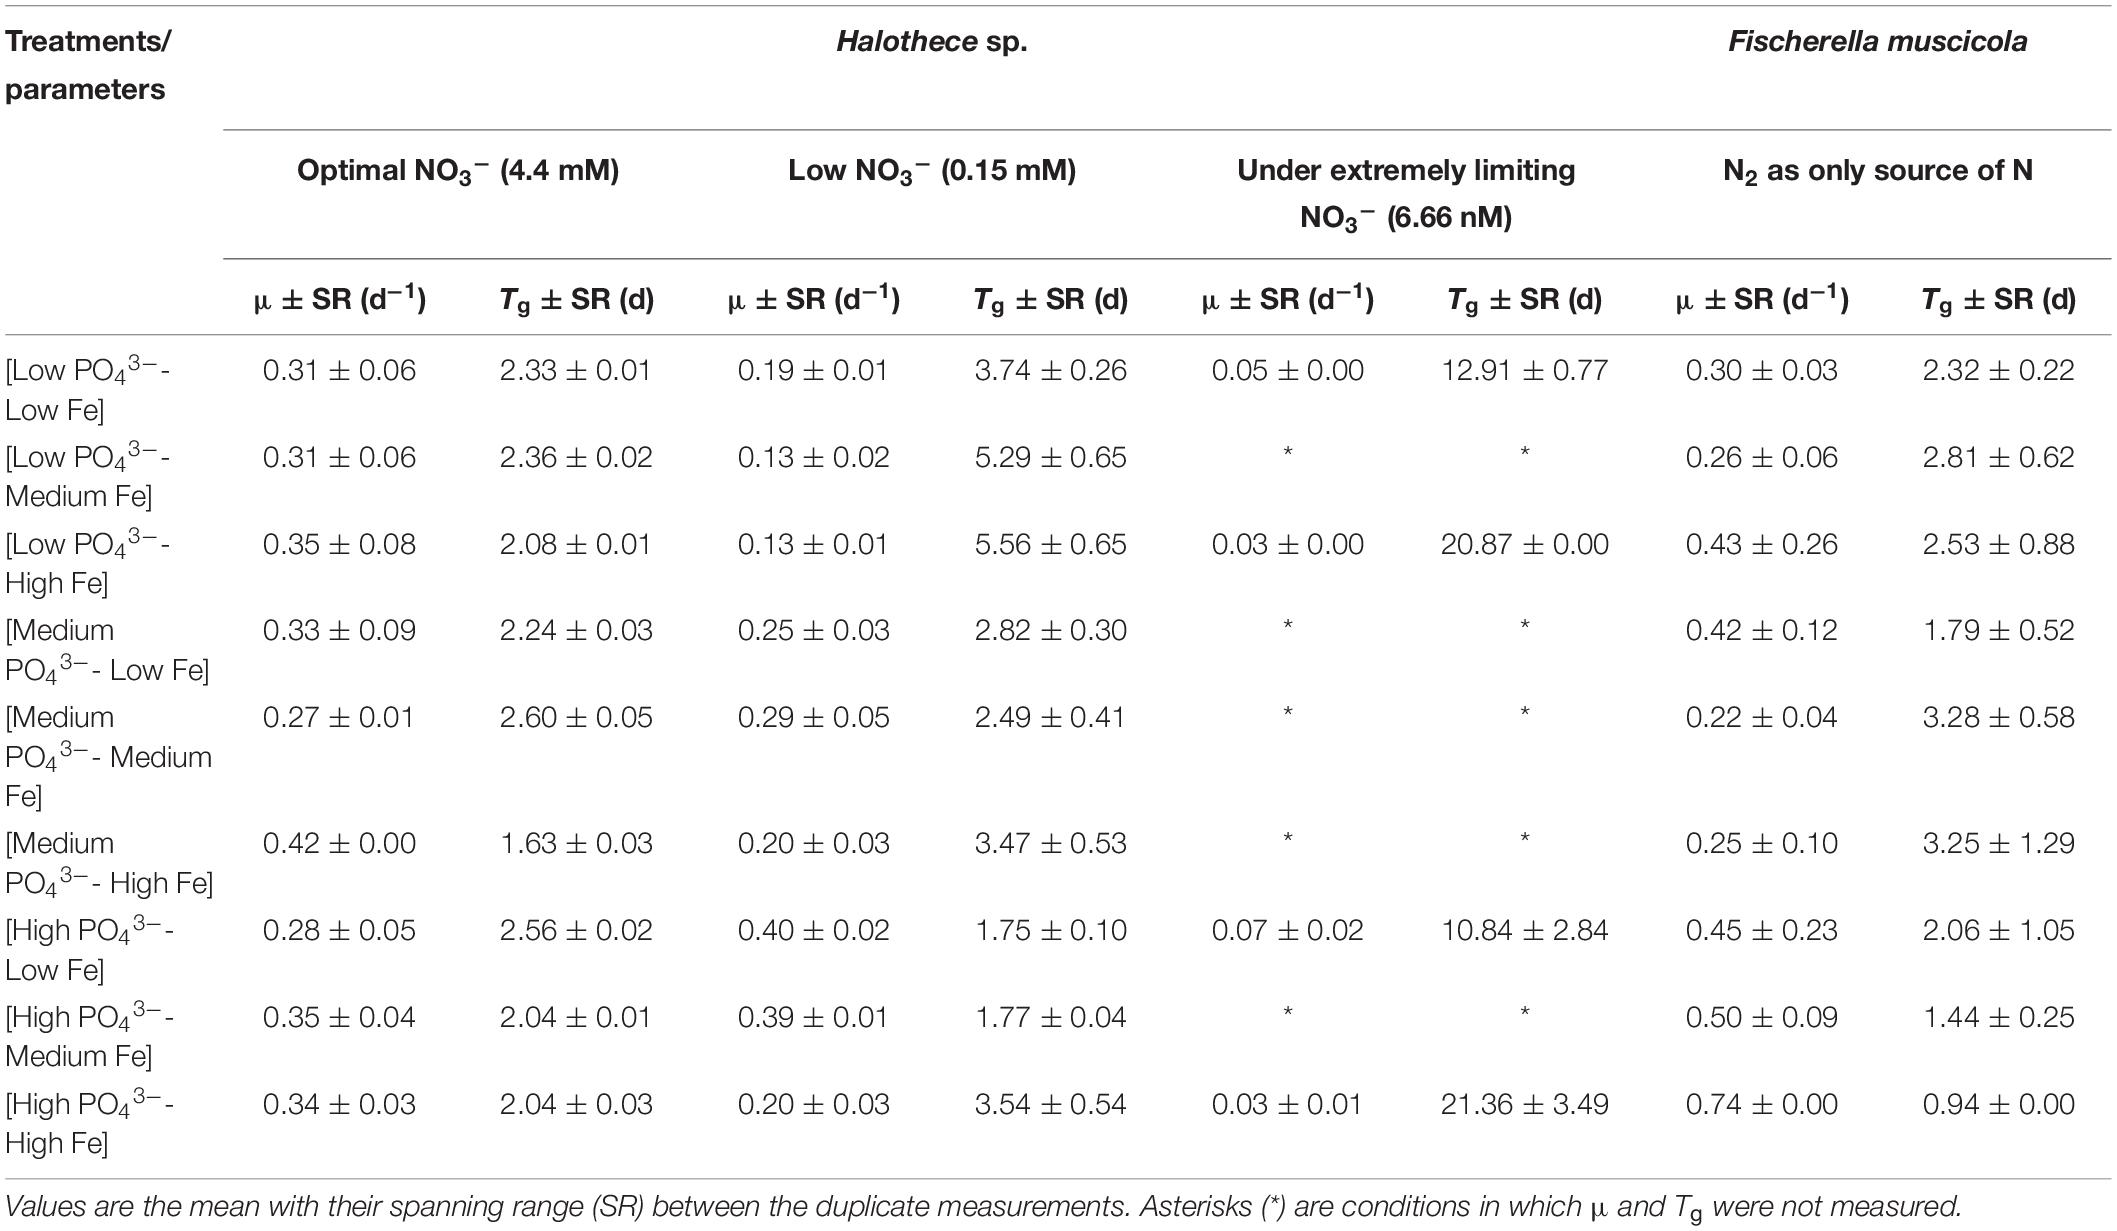
Table 1. Growth rate (μ) and generation time (Tg) for Halothece sp. (at different NO3– concentrations) and Fischerella muscicola at different combinations of PO43– and Fe concentrations.
Growth of Halothece sp. Under Different PO43– and Fe Concentrations
No significant differences in growth of Halothece sp. were observed among different combination conditions of PO43– and Fe under optimal NO3– (Kruskal–Wallis, H = 7.21, 8 d.f., p = 0.51, Table 1; and H = 9.02, 8 d.f., p = 0.34, Figure 1A). On the contrary, under [Low NO3–] conditions, significant differences were found (Kruskal–Wallis, H = 15.83, 8 d.f., p = 0.045, Figure 1B). Under [Low NO3–], at high concentrations of PO43–, μ was generally higher than at medium and low concentrations (Table 1 and Figure 1B) except when it was combined with high Fe levels (Table 1 and Figure 1B), showing that high Fe levels had a negative impact on their growth at [High PO43–] (Figure 1B).
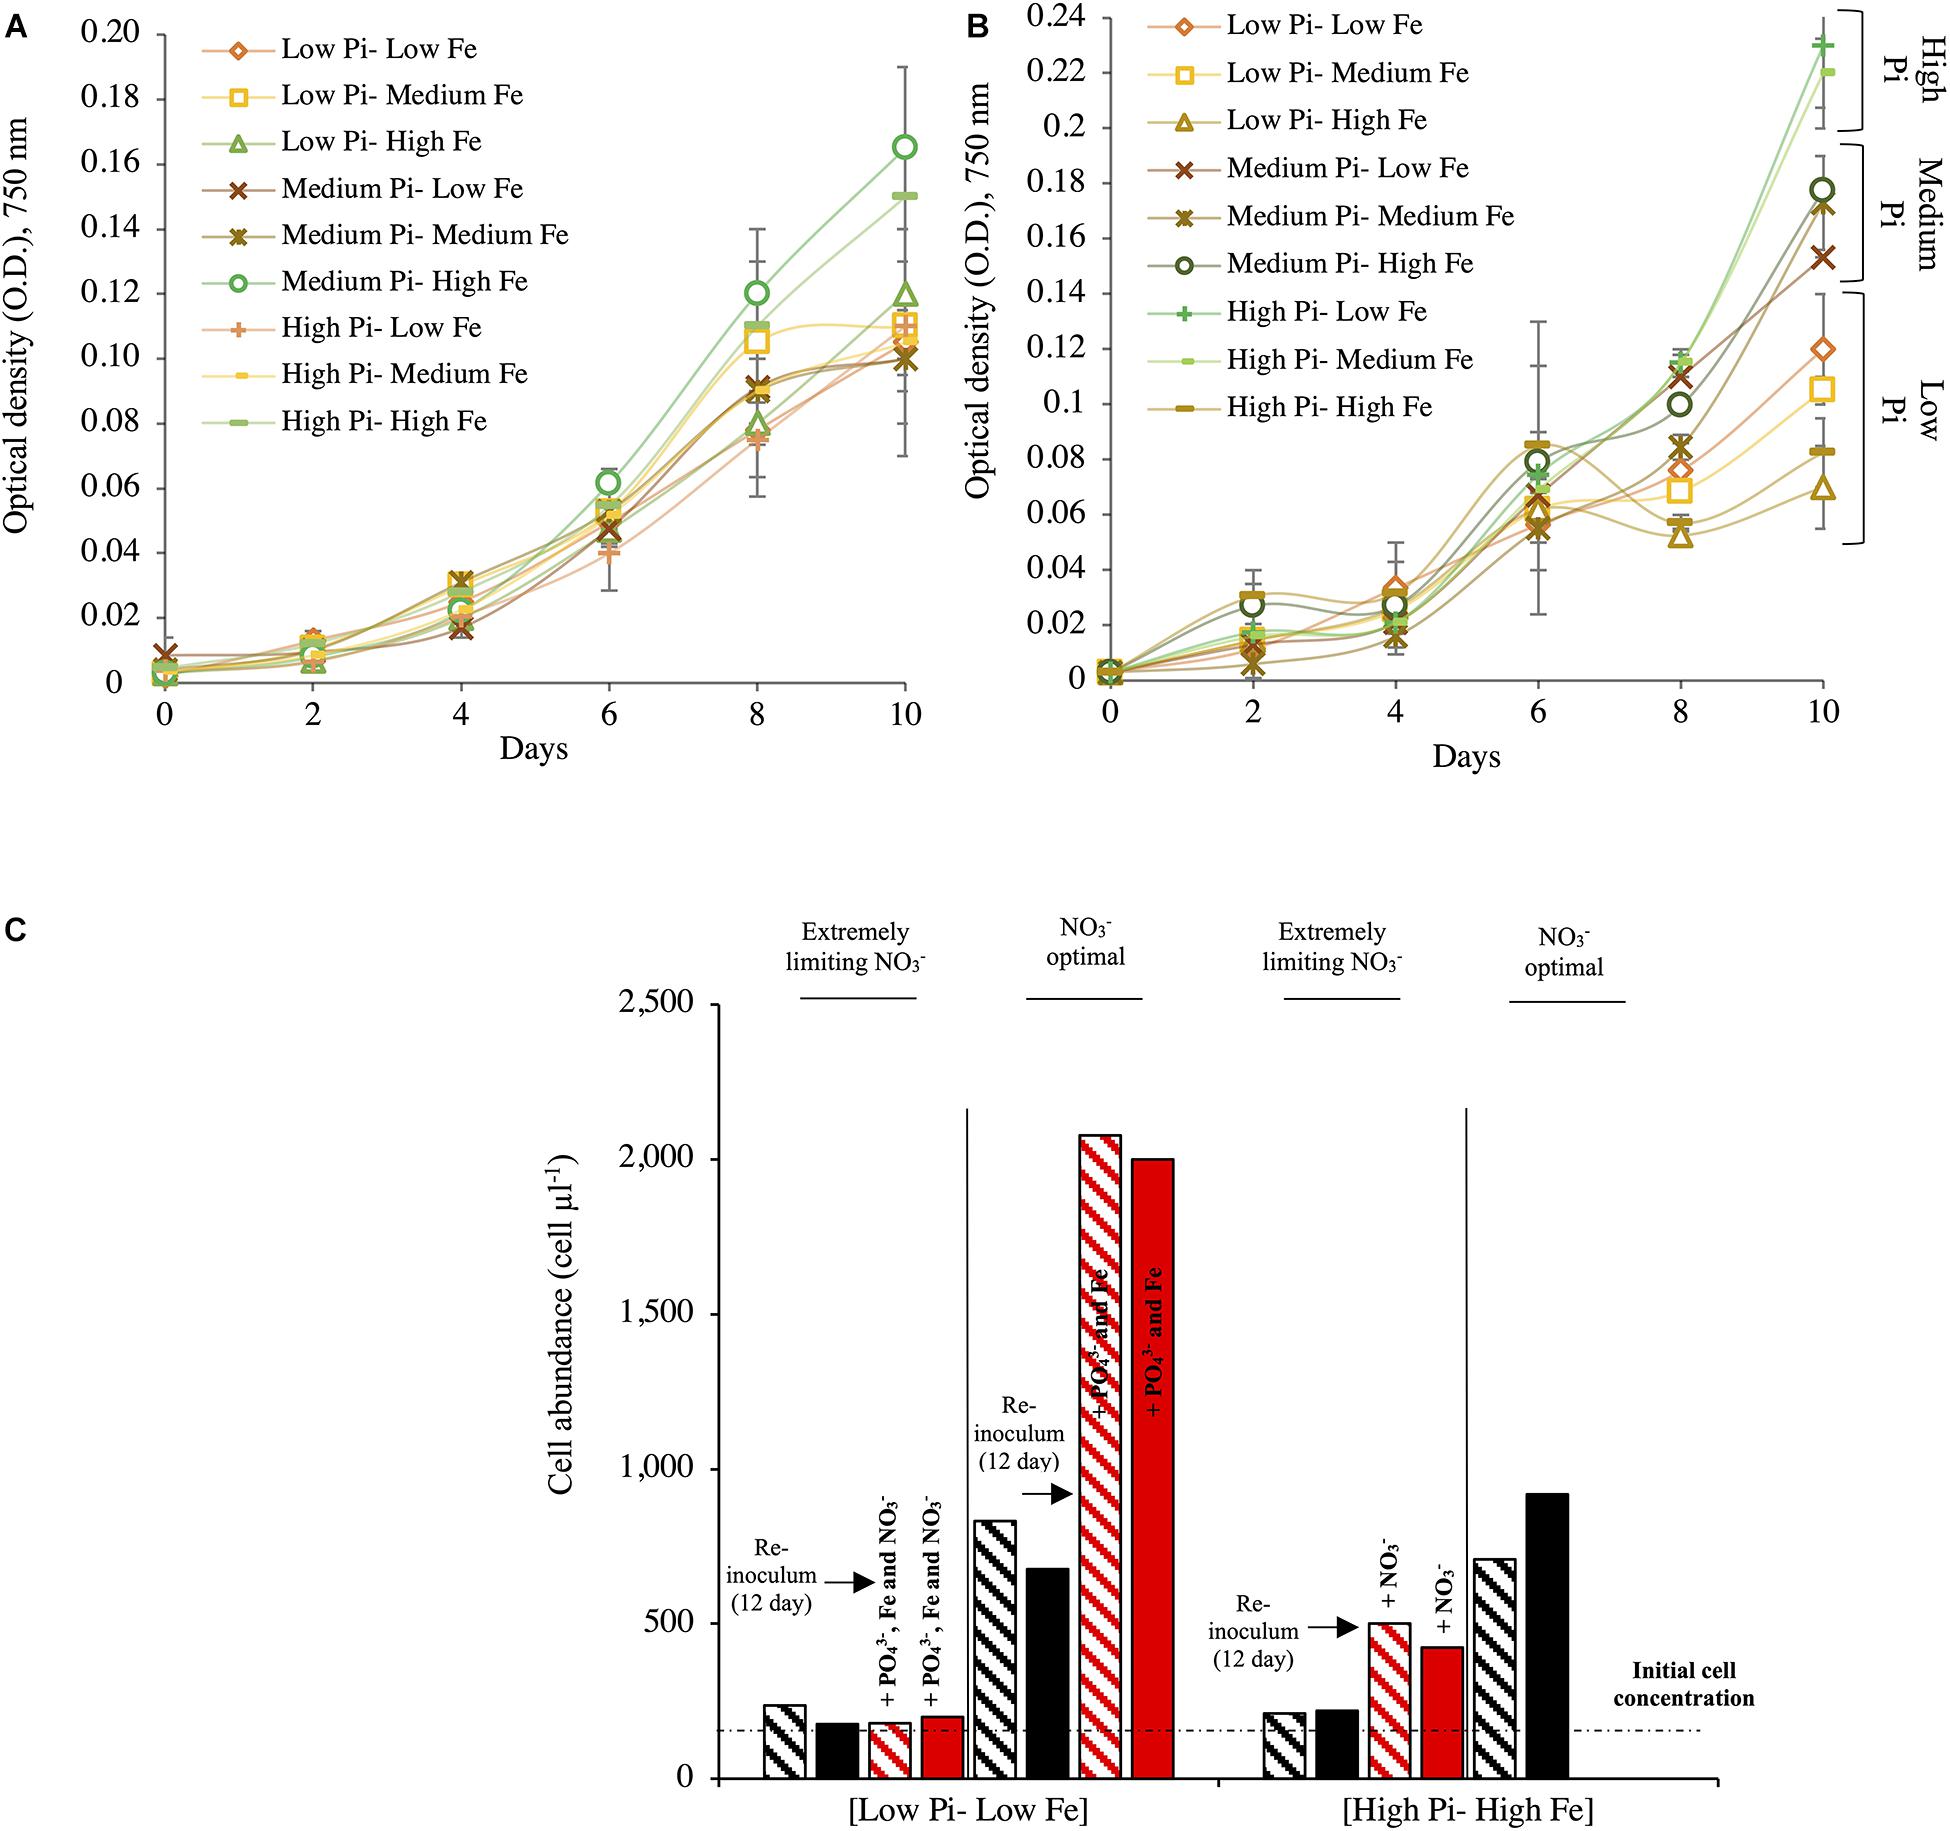
Figure 1. Growth of Halothece sp. at different combinations of nutrient concentrations (PO43–, Fe, and NO3–). (A) Growth for Halothece sp. under NO3– optimal conditions. (B) Growth for Halothece sp. under [Low NO3–] conditions. (C) Cell concentration after 12 days of incubation and recovery of Halothece sp. under different NO3– concentrations with the re-inoculum (black arrow) of PO43–, Fe, and/or NO3– and incubated 4 days more (red bars). The initial cell concentration is referenced with the black dashed line. PO43– is represented as Pi. In panels (A,B), values are the mean with their spanning range (SR) between the duplicate measurements. In panel (C), data presented are actual values of the duplicates (striped and solid bars).
Recovery of Halothece sp. After Nutrient Re-inoculation
The recovery of Halothece sp. cells from low PO43– and low Fe (and/or under extremely limiting NO3–) to high PO43– and high Fe concentrations with re-inoculation of the nutrients (PO43–, Fe, and/or NO3–) in the medium was dependent on the initial conditions of PO43–, Fe, and NO3– concentrations in the culture medium (Figure 1C). In the [Low PO43––Low Fe] condition under extremely limiting NO3– conditions, the cells exhibited total chlorosis, and the addition of PO43–, Fe, and NO3– (at final concentrations of 45 μM, 7.5 μM, and 4.4 mM, respectively) was not sufficient to restore their original phenotype. However, in [High PO43––High Fe] treatments under extremely limiting NO3– conditions, re-inoculation of NO3– exhibited slight recovery (recovering their greenish color; data not shown). In addition, in [Low PO43––Low Fe] treatment under optimal NO3–, which was re-inoculated with PO43– and Fe, the cells responded with higher growth and recovered their greenish color (Figure 1C).
Growth of Fischerella muscicola Under Different PO43– and Fe Concentrations
Unlike what was observed for Halothece sp., decreasing concentration of NO3– did not affect the μ of F. muscicola PCC 73103 (data not shown). With N2 as sole N source, F. muscicola reached the maximum μ of 0.74 day–1 (Tg, 0.94 days) at the highest concentrations of PO43– and Fe, and it was higher than the rest of the treatments (Kruskal–Wallis, H = 16.03, 8 d.f., p = 0.042, Figure 2A). The cells under [High PO43––High Fe] conditions also showed the highest average content of Chla, Chlb, and total chlorophyll (total Chl) (Figure 2B) and phycobiliprotein (R-PC and R-PE) content (Figure 2C).
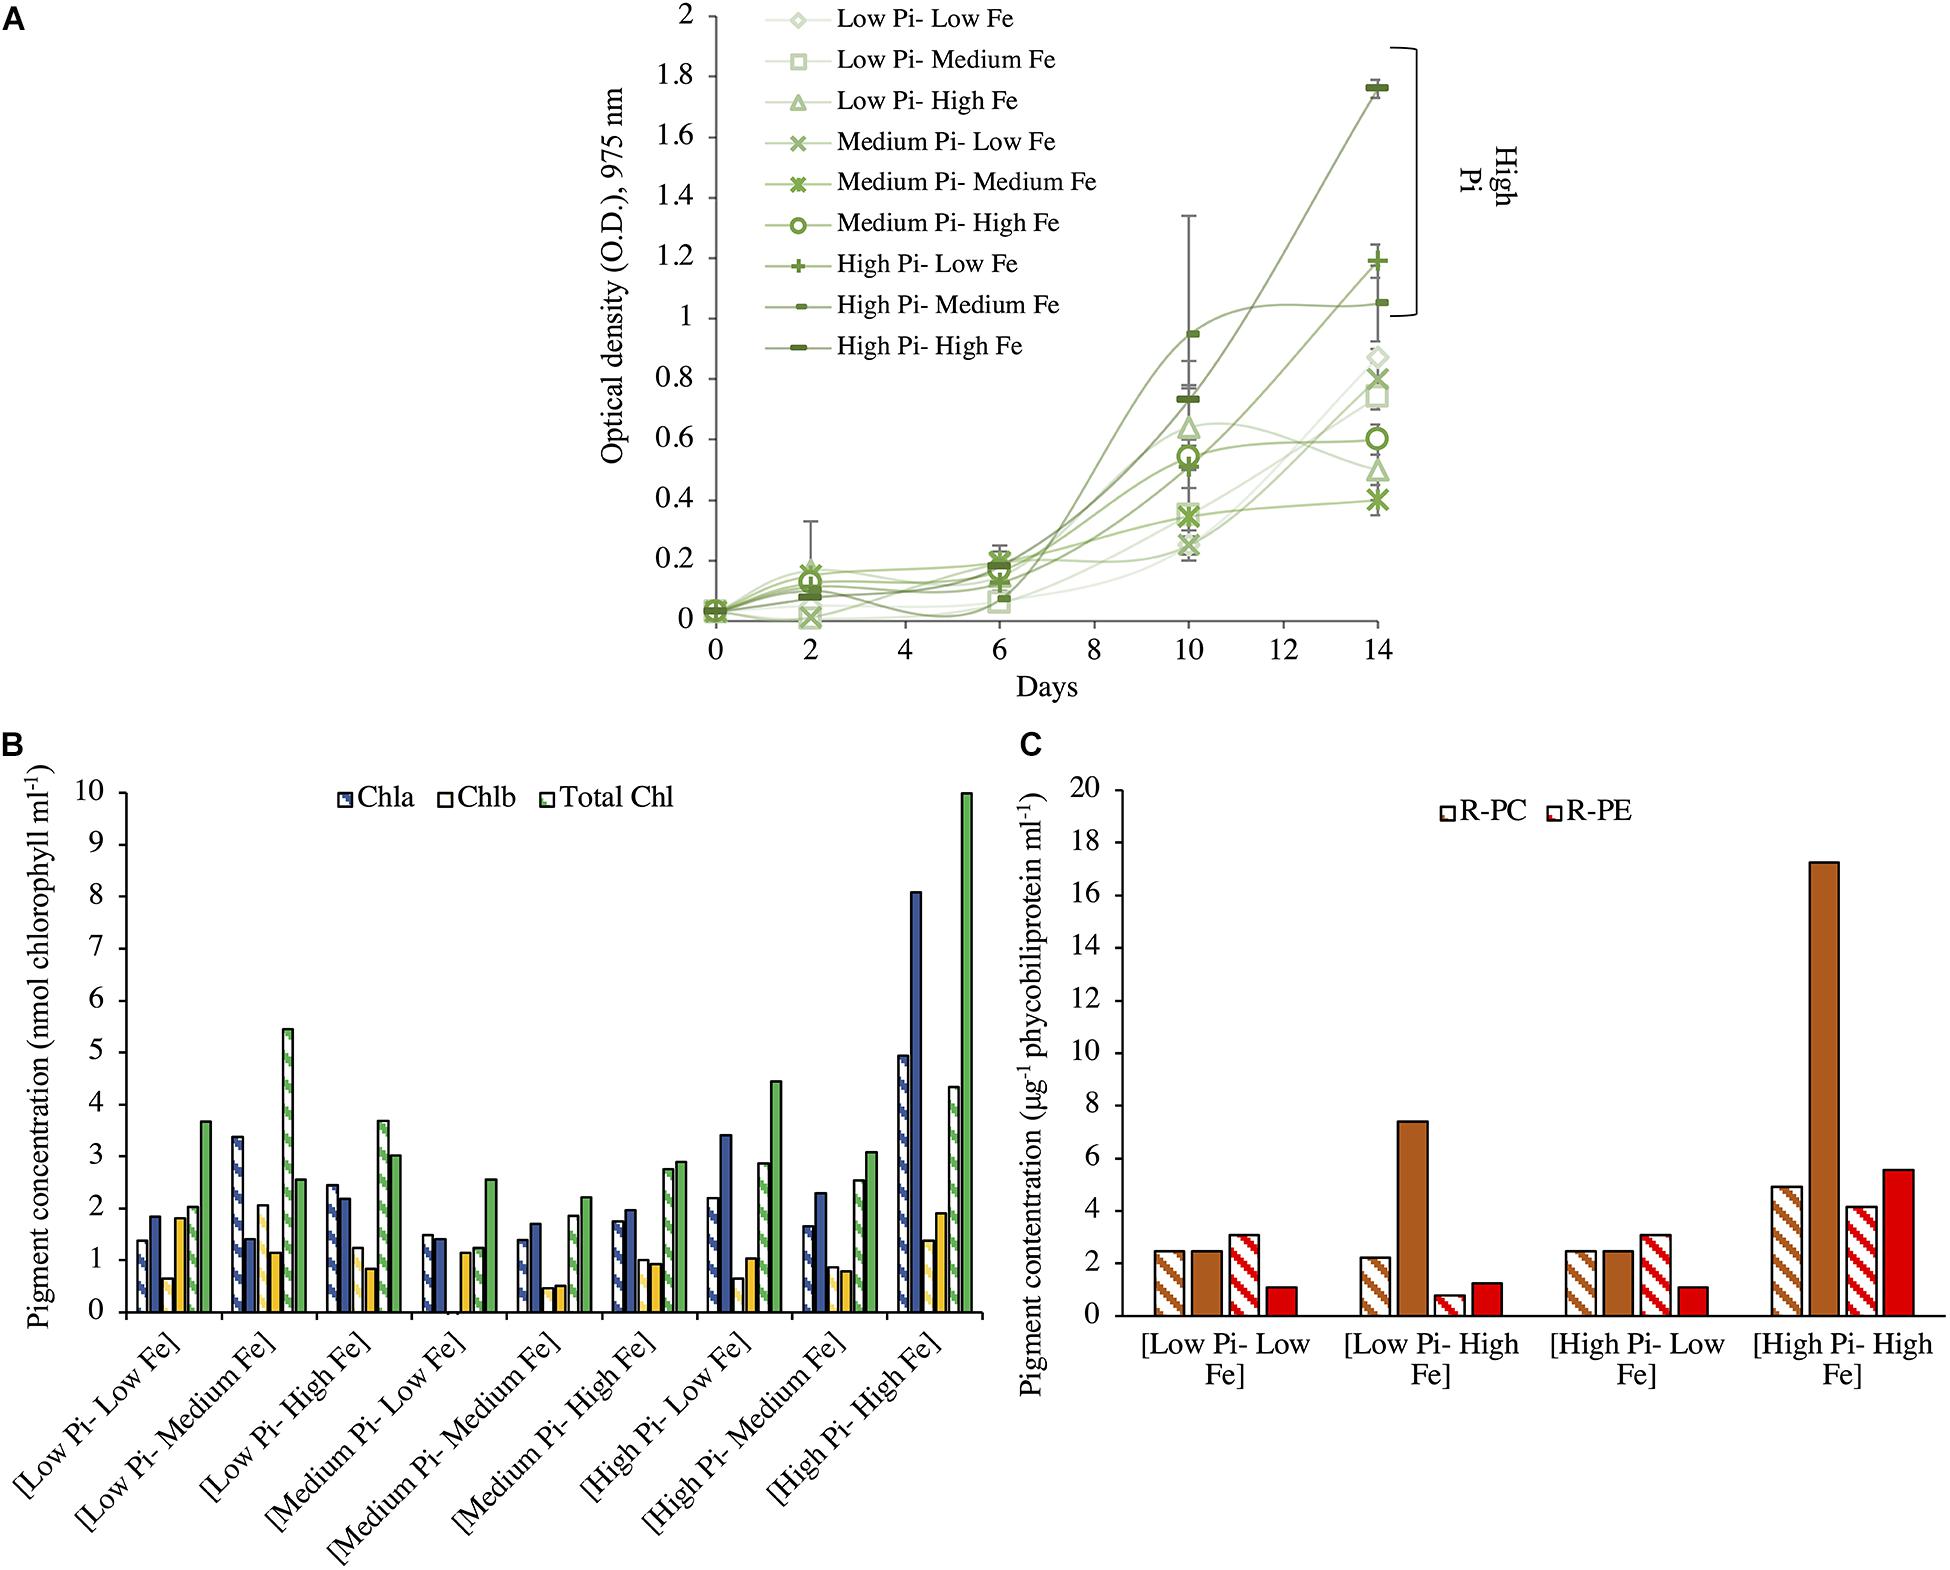
Figure 2. Growth and pigment content for Fischerella muscicola at different concentrations of PO43– and Fe after 14 days of incubation. (A) Growth for F. muscicola at different combinations of PO43– and Fe where values are the mean with their spanning range (SR) between the duplicate measurements. (B) Chlorophyll (Chla, Chlb, and total Chl) and (C) phycobiliproteins (R-PC and R-PE) concentrations at different combinations of PO43– and Fe concentrations. PO43– is represented as Pi. In panels (B,C), data presented are actual values of the duplicates (striped and solid bars).
Nature of Limitation of PO43–, Fe, and/or NO3– in Halothece sp. and/or Fischerella muscicola
The evaluation of the limitation of NO3– and PO43– in Halothece sp. under extremely limiting NO3– conditions concentrations revealed that cells were serially limited, i.e., first with NO3– and then with PO43– (N response > 0, P response = 0 and N + P response > 0) (Figure 3A). PO43– did not have any effect on the growth of cells when they were extremely N limited. Evaluating the effects of the addition of PO43– and Fe with increased N supply, we showed that under optimal NO3–, Halothece sp. did not respond significantly to any addition of PO43– and Fe (p < 0.05, Figure 3B). Under sufficient N supply (i.e., at [Low NO3–] when maximum rates of N2-fixation were measured), PO43– was the main limiting nutrient and Fe had a negative effect on the growth of Halothece sp. at high Fe levels (Fe response < 0, P response > 0, and P + Fe response > 0) (Figure 3C). However, we also found a simultaneous co-limitation of PO43– and Fe (Fe response = 0, P response = 0, and P + Fe response > 0) when both elements were added at medium PO43– and medium–high Fe concentrations for Halothece sp. (Figure 3C). For F. muscicola, a simultaneous co-limitation of PO43– and Fe was also observed (Fe response = 0, P response = 0, and P + Fe response > 0) when both elements were added at high PO43– and Fe concentrations (Figure 3C).
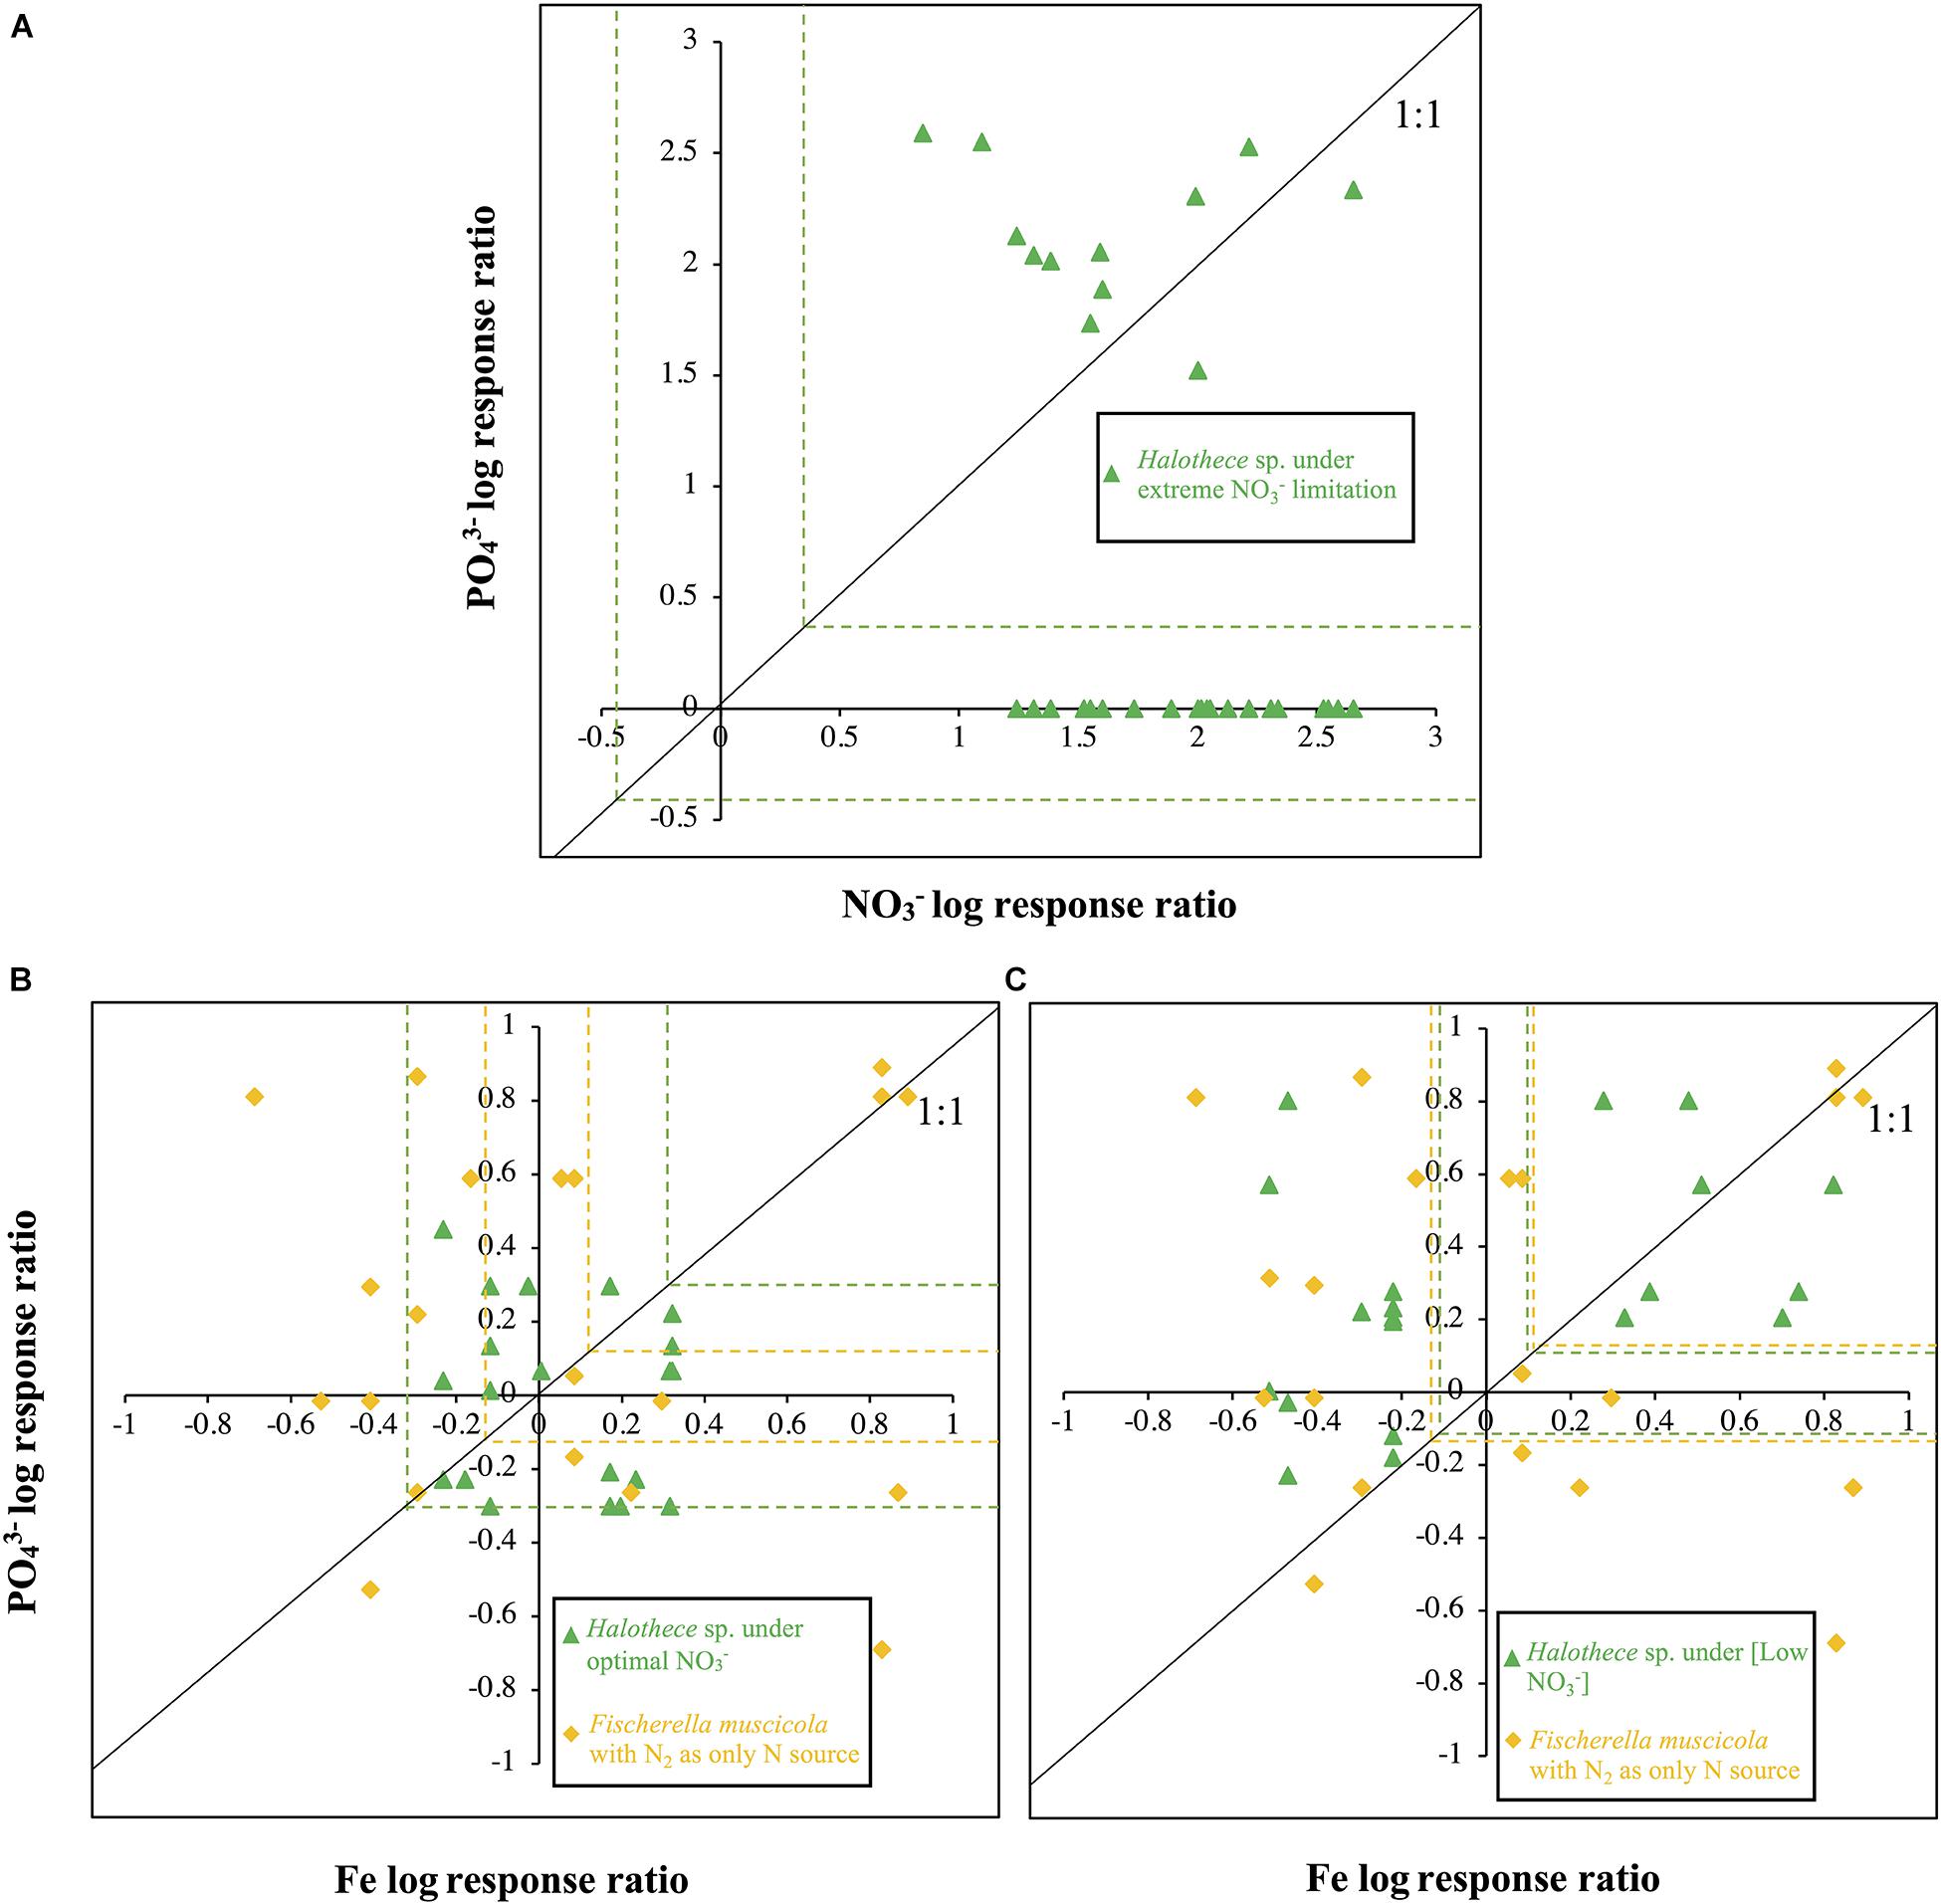
Figure 3. Log nutrient responses for Halothece sp. and Fischerella muscicola. (A) PO43– and NO3– log response ratios for Halothece sp. (B) and (C) PO43– and Fe log response ratios for Halothece sp. (B) under optimal NO3– and (C) under [Low NO3–] conditions and F. muscicola with N2 as sole N source. Each data point represents each replicate in which X-axis is the NO3– or Fe log response and Y-axis is the PO43– log response. Dashed green (for Halothece sp.) and yellow lines (for F. muscicola) represent the critical threshold values [data points outside the critical values are significantly different (at p = 0.05) from N0P0 or Fe0P0]. PO43– is represented as Pi.
Monod Growth Kinetics of Halothece sp. and Fischerella muscicola
The N-dependent Monod growth kinetics of Halothece sp. incubated at different PO43– concentrations showed P dependence (Figure 4A). Halothece sp. had higher maximum growth at high and medium PO43– levels (μ′max = 0.50 day–1) compared with low PO43– levels (μ′max = 0.44 day–1). However, the half-velocity constant at [High PO43–] (Kμ = 0.217 mM, with a Qmin = 1.55 mM) was the lowest compared with that at [Medium PO43–] (Kμ = 0.45 mM, with a Qmin = 1.19 mM) and [Low PO43–] (Kμ = 0.53 mM, with a Qmin = 1.22 mM) (Figure 4A). The P-dependent growth kinetics of Halothece sp. incubated at different Fe concentrations showed μ′max (0.25 day–1) and Qmin (5.37 μM) at high Fe levels that were lower and higher, respectively, than at low to medium Fe levels (μ′max = 0.43 day–1, Qmin = 3.13 μM); but Kμ was lower at [High Fe] (Kμ = 0.01 μM) than in [Low–Medium Fe] (Kμ = 0.35 μM) (Figure 4B). On the other hand, F. muscicola generally had higher values of the P-dependent kinetic parameters than Halothece sp. when incubated at different Fe concentrations (Figure 4B). F. muscicola had the higher maximum growth (μ′max = 0.83 day–1), half-velocity constant (Kμ = 1.85 μM), and higher minimal cell quota (Qmin = 12.58 μM) at high Fe treatments as compared with cells at low to medium levels of Fe (μ′max = 0.62 day–1, Kμ = 0.03 μM, Qmin = 12.33 μM) (Figure 4B).
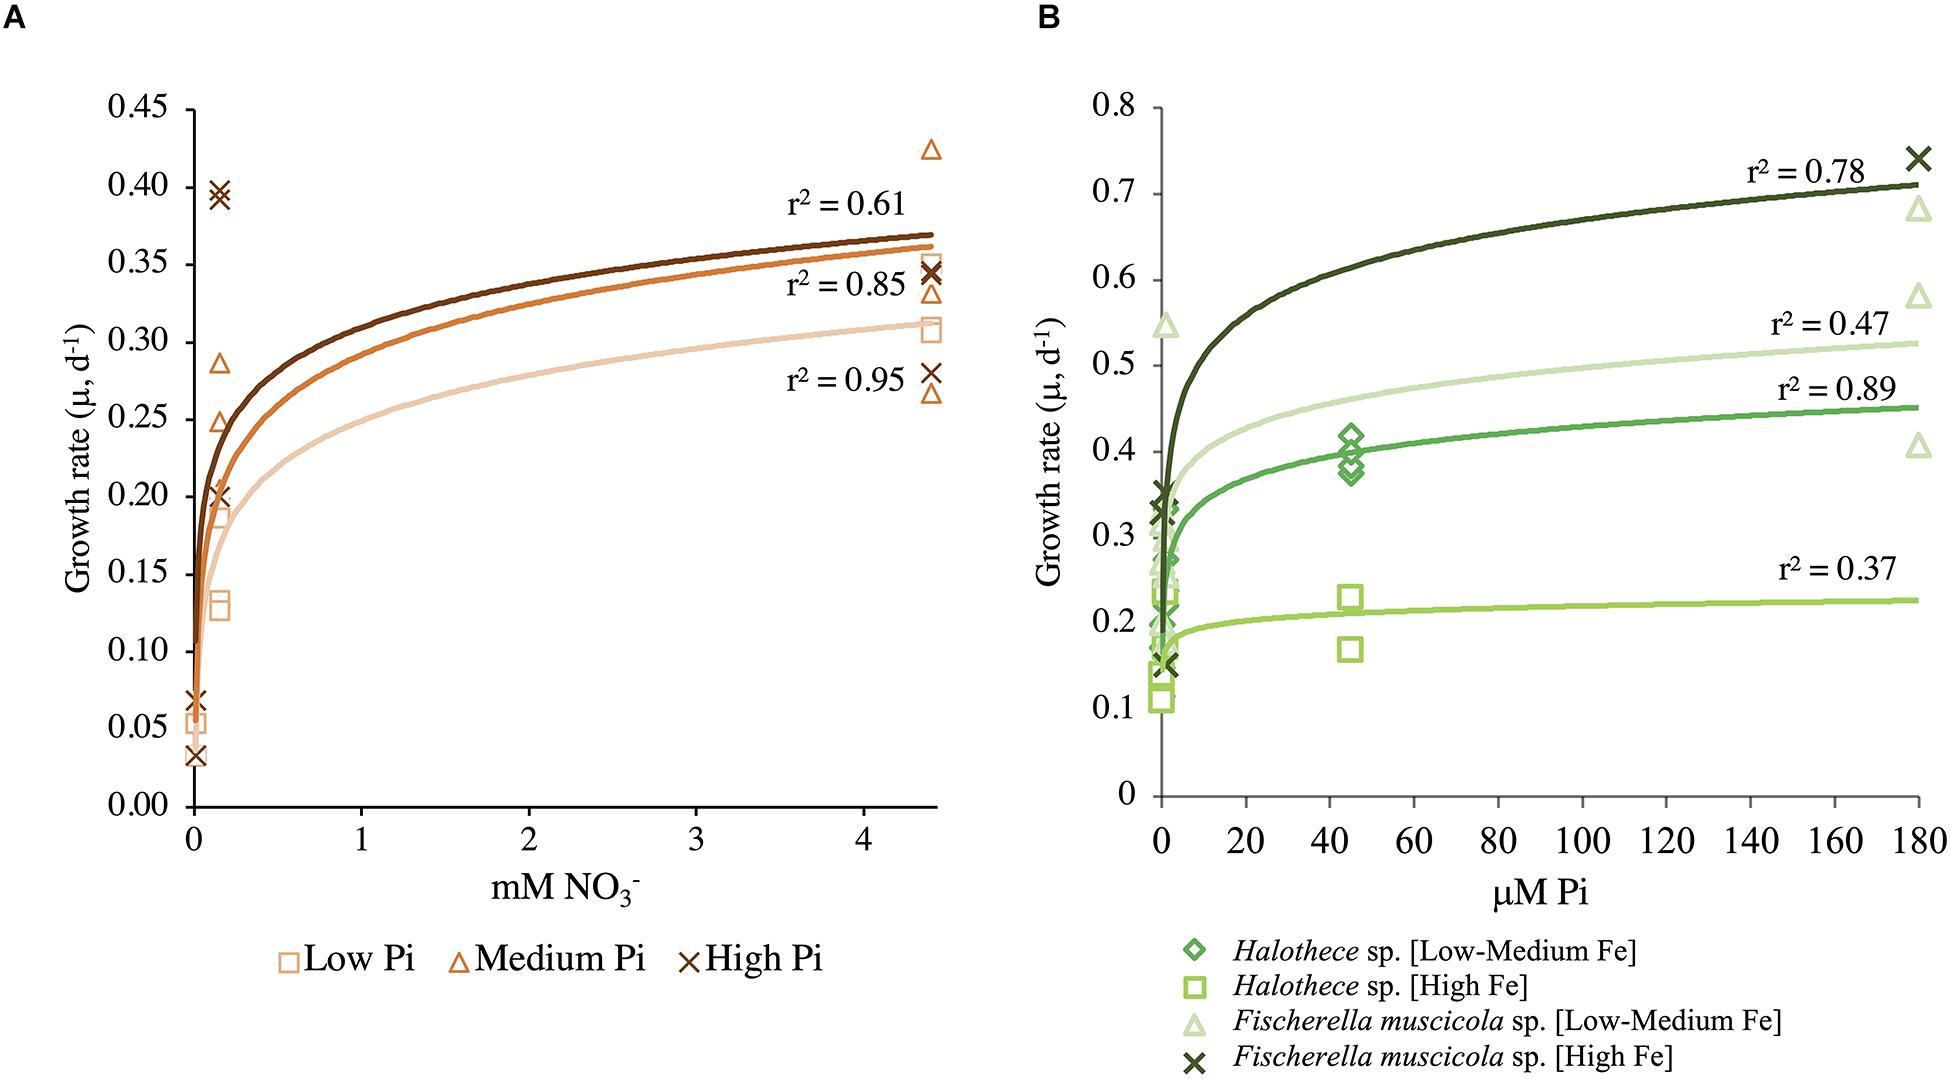
Figure 4. Monod curves (A) at different PO43– concentrations for Halothece sp. and Fischerella muscicola in function of NO3– initial levels and (B) at different Fe concentrations for Halothece sp. (under [Low NO3–]) and F. muscicola in function of PO43– initial levels. PO43– is represented as Pi.
Effect of Varying Concentrations of P and Fe on N2-Fixation Rates of Halothece sp. and Fischerella muscicola
Halothece sp.-specific N2-fixation rates under [Low NO3–] at different treatment combinations of PO43– and Fe were significantly linearly correlated with cell concentrations (Spearman’s correlation, r = 0.7, p < 0.05, n = 18). N2-fixation rates at [Low PO43–] conditions were undetectable and generally increased at medium PO43– and at increasing Fe concentrations (Figure 5A). However, at the highest PO43– and Fe concentrations, N2-fixation was again undetectable (Figure 5A). For F. muscicola, where specific N2-fixation rates were measured during the light and dark photoperiods, there were no significant differences among the treatments during the light and dark phase (Kruskal–Wallis, H = 15.45, 8 d.f., p = 0.051; data not shown). Higher N2-fixation rates under high PO43– levels were detected, especially when combined with high Fe concentrations (Figure 5B).
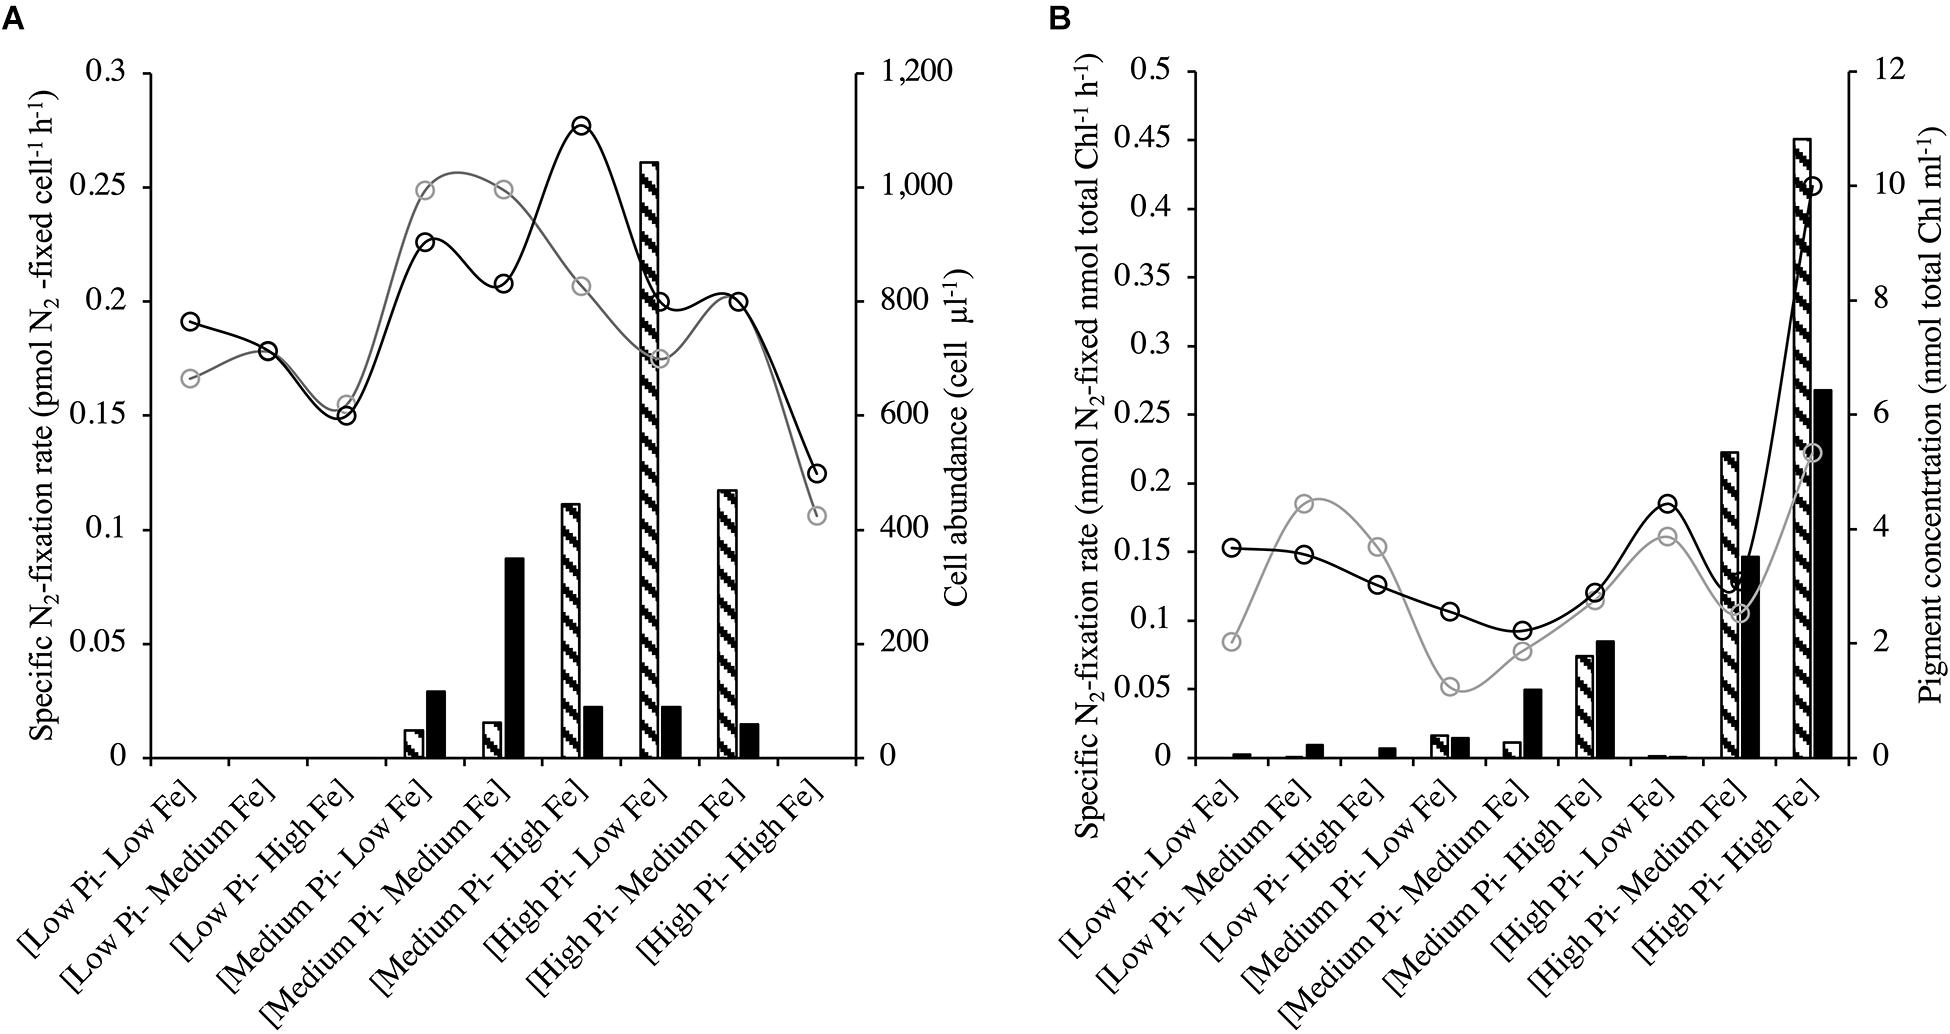
Figure 5. N2-fixation rates for (A) Halothece sp. and (B) Fischerella muscicola at different combinations of PO43– and Fe concentrations. Halothece sp. were grown under [Low NO3–] to promote N2-fixation. Bar graphics indicate N2-fixation, while empty circles indicate cell abundance (cell μl–1) for Halothece sp. and chlorophyll concentrations (nmol total Chl ml–1) for F. muscicola. Data presented are actual values of the duplicates (striped and solid bars or light and heavy lined circles). PO43– is represented as Pi.
Effect of Varying Concentrations of P and Fe on the Production of Reactive Oxygen Species of Halothece sp. and Fischerella muscicola
Reactive oxygen species production for Halothece sp. was measured under optimal NO3– and [Low NO3–] conditions (Figures 6A,B). Under optimal NO3–, there were significant differences among the treatments (Kruskal–Wallis, H = 15.67, 8 d.f., p = 0.047, Figure 6A). ROS production was higher at [Low PO43––Low Fe] conditions compared with increasing concentrations of PO43– at the same [Low Fe] conditions (Figure 6A). At [Low PO43–] conditions, increasing Fe concentration reduced the ROS production (Figure 6A). On the other hand, cells under PO43– and Fe limitation ([Low PO43––Low Fe]) and optimal NO3– showed higher ROS production, as observed with the greener color (oxidized DCF) of cells, compared with the red color of cells that were not producing ROS in [High PO43––High Fe] (Figures 7A,B). On the other hand, under [Low NO3–] conditions, we did not detect significant differences in ROS production (Kruskal–Wallis, H = 13.80, 8 d.f., p = 0.087, Figure 6B). Nonetheless, we observed ROS production under [Low NO3–] conditions to be higher at [Low PO43––Medium/High Fe] than the rest of the treatments except at [High PO43––High Fe] and [Low PO43––Low Fe] (Figure 6B). At [Medium Fe] conditions, increasing PO43– concentrations reduced ROS production (Figure 6B).
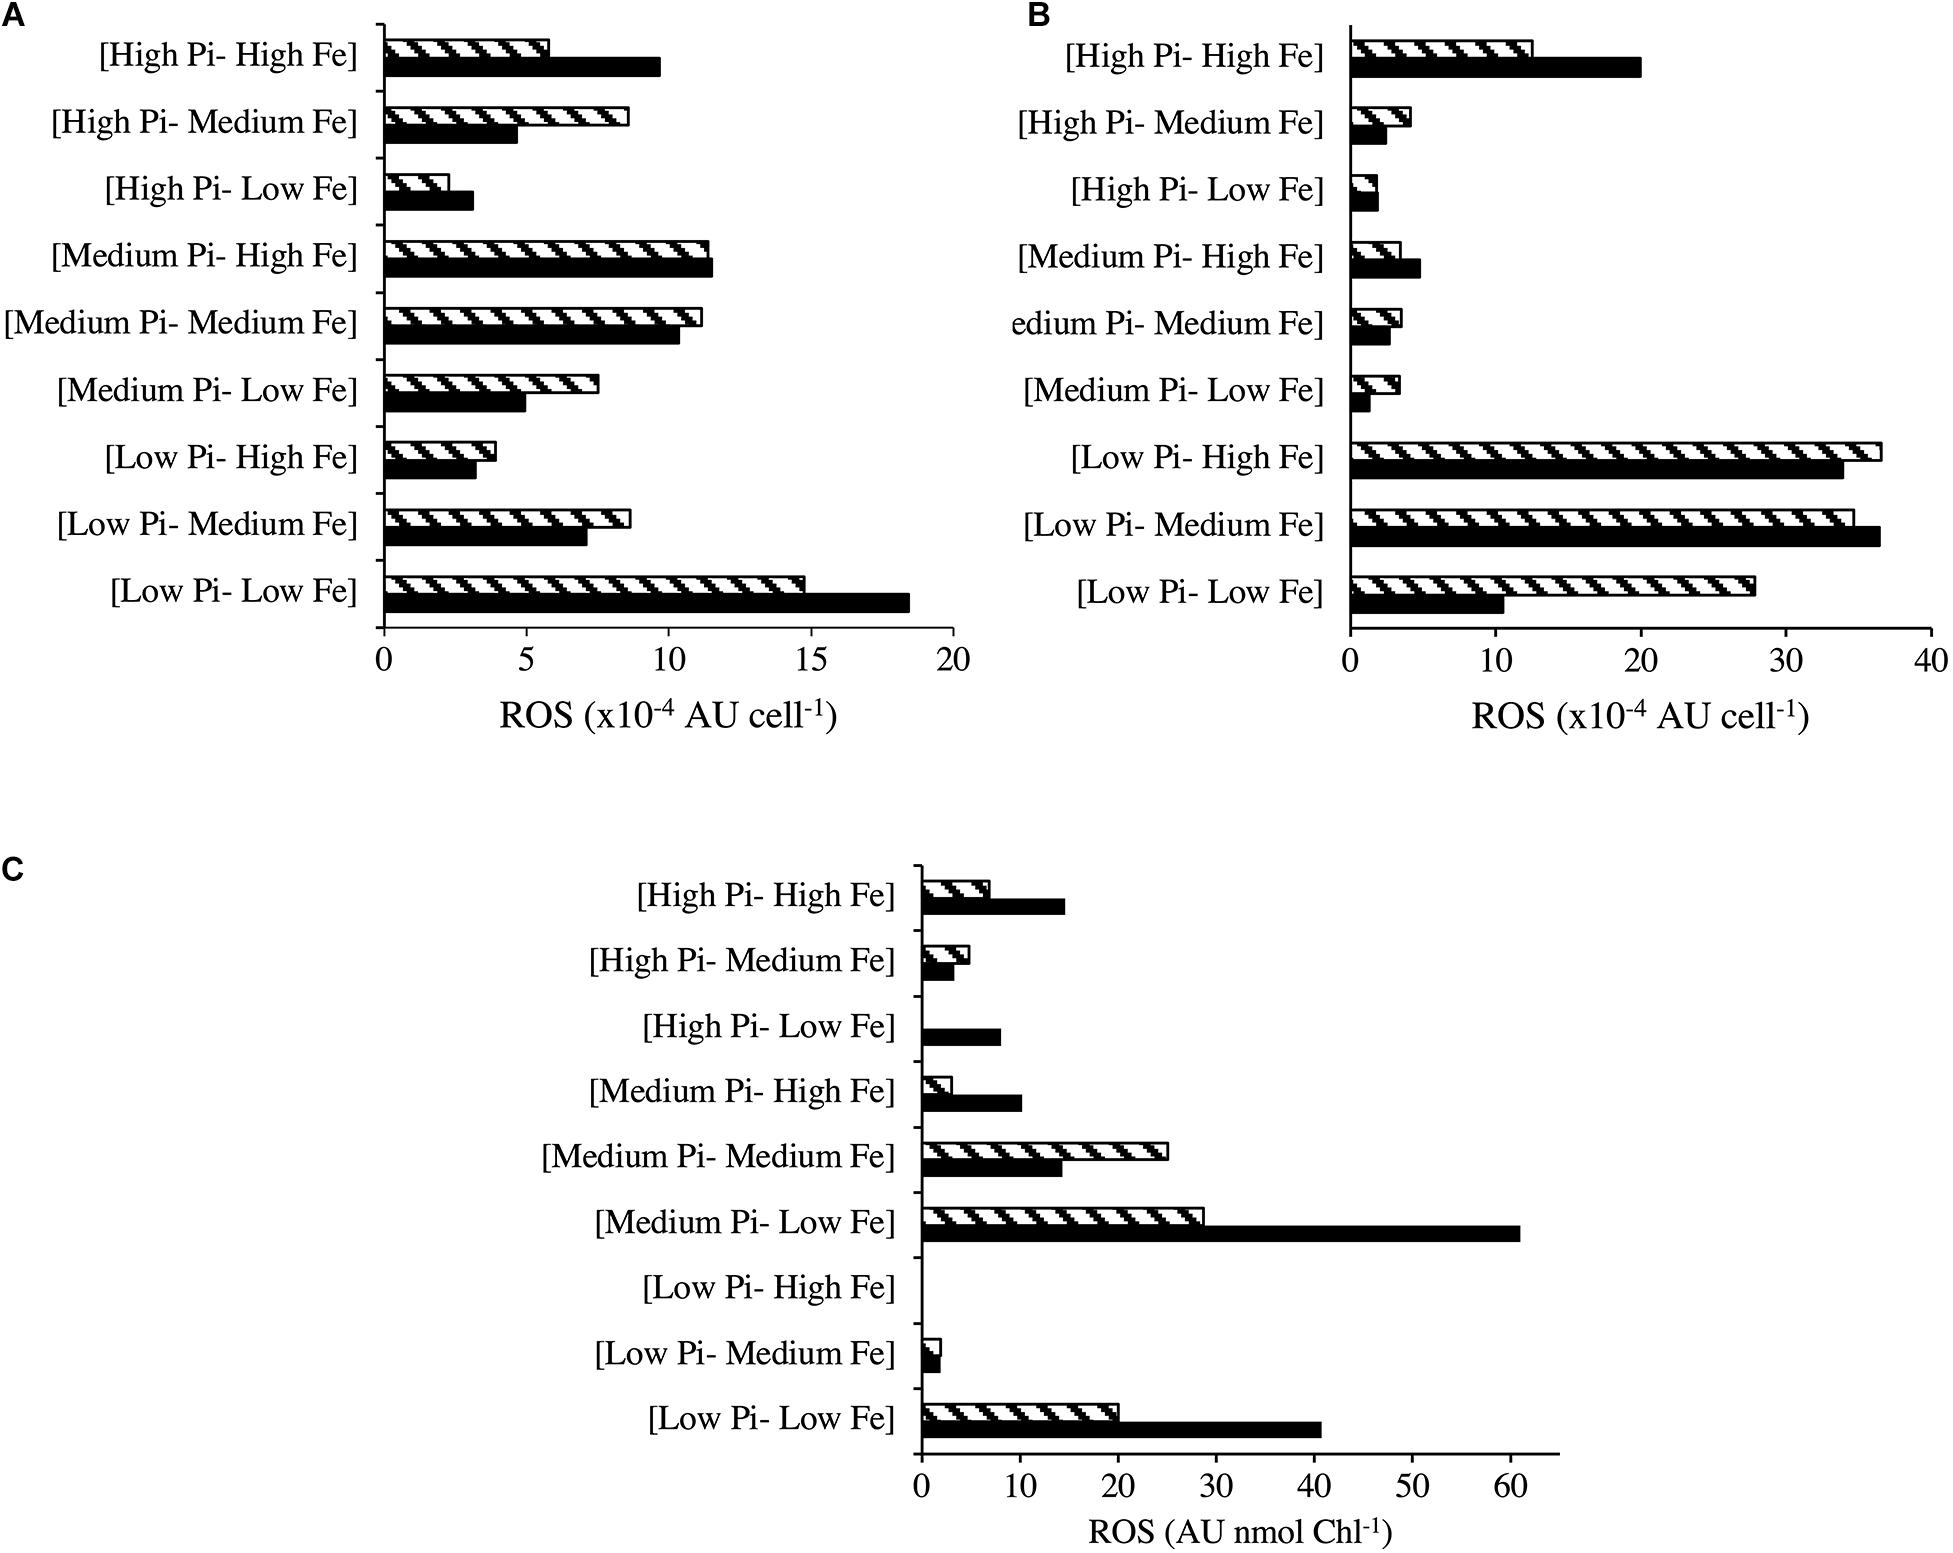
Figure 6. Radical oxygen species (ROS) production at different combinations of PO43– and Fe concentrations for Halothece sp. under (A) NO3– optimal and (B) [Low NO3–] conditions and (C) for F. muscicola. PO43– is represented as Pi. Data presented are actual values of the duplicates (striped and solid bars).
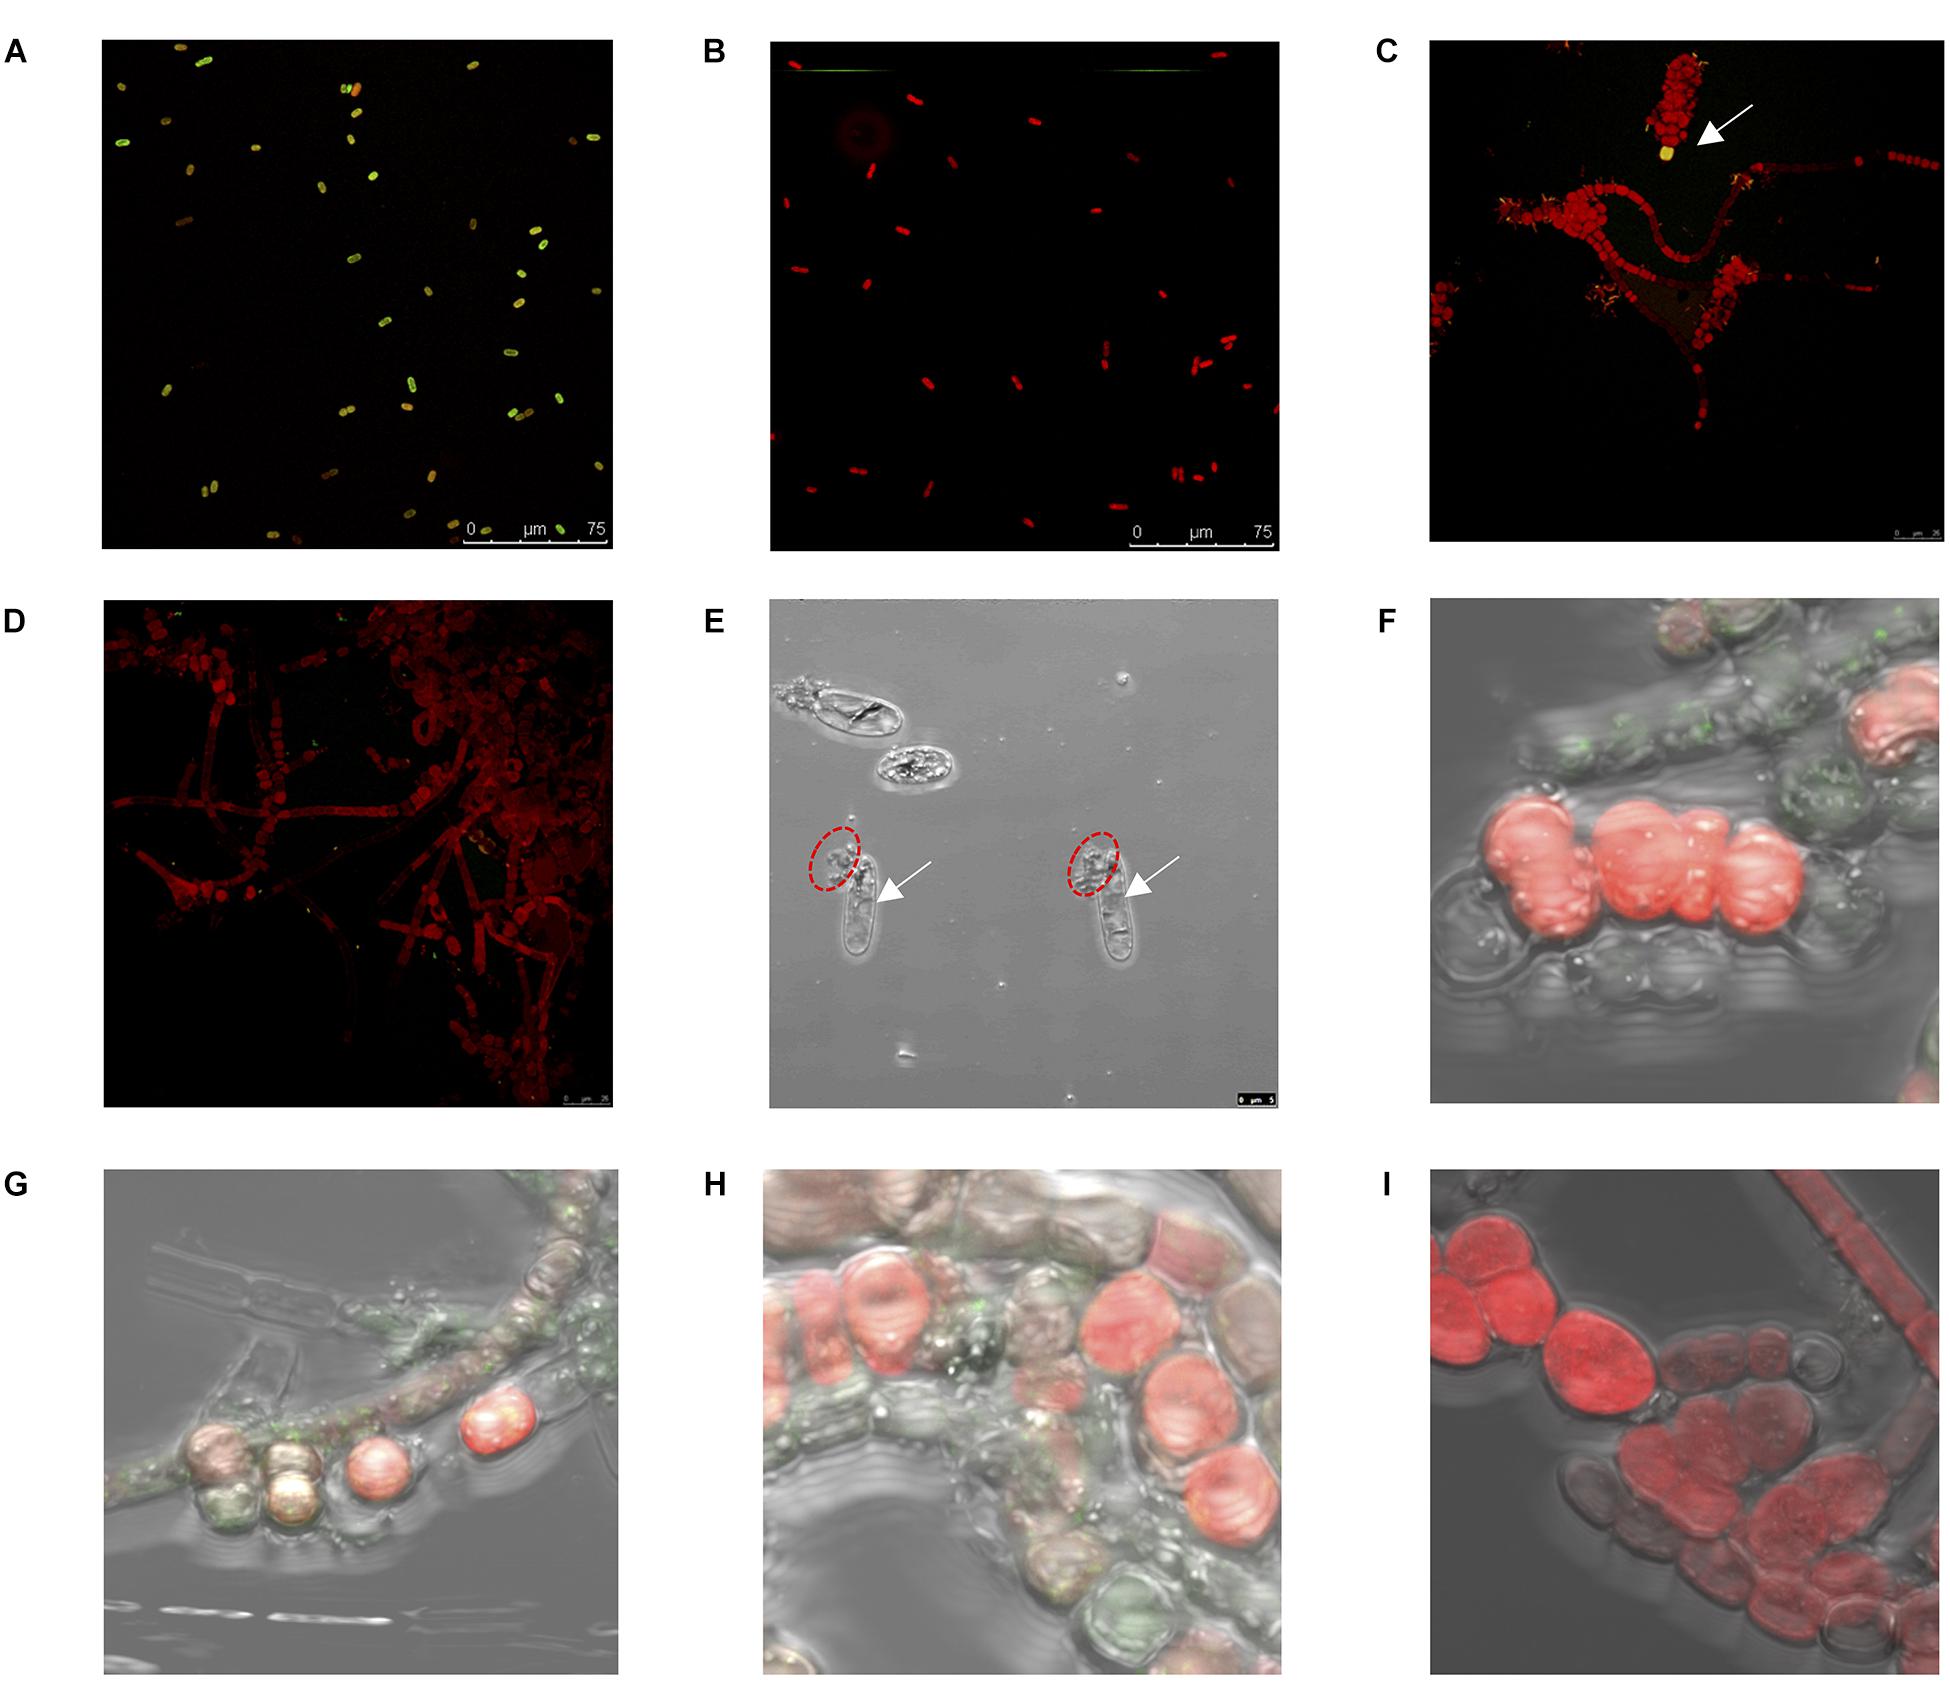
Figure 7. Biochemical [e.g., reactive oxygen species (ROS) production], morphological, and physiological changes for Halothece sp. and Fischerella muscicola. (A–D) Confocal images of ROS production (green-yellow color) for Halothece sp. at panel (A) [Low PO43––Low Fe] and panel (B) [High PO43––High Fe] conditions and for F. muscicola at panel (C) [Low PO43––Low Fe] (in which the white arrow indicates the ROS production) and panel (D) [High PO43––High Fe] conditions. Images were taken at 400×. Panel (E) [Low PO43––Low Fe] condition under extremely limiting NO3– conditions under the bright field (arrows indicate vacuole formation, and red dashed circles indicate cell breaks). (F–I) Apoptosis assay results for F. muscicola under confocal microscopy. Panel (F) [Low PO43––Low Fe], panel (G) [Low PO43––High Fe], panel (H) [High PO43––Low Fe], and panel (I) [High PO43––High Fe]. In panels (F–I), the green color resulted from the binding of annexin with the phosphatidylserines that were exposed in apoptotic cells, and images (E–I) were taken at 1,000× with zoom. PO43– is represented as Pi.
The ROS production of F. muscicola did not vary among the different treatment combinations of PO43– and Fe (Kruskal–Wallis, H = 12.30, 8 d.f., p = 0.14, Figure 6C). Nonetheless, there was a tendency of higher ROS production at [Low PO43––Low Fe] compared with [High PO43––High Fe] conditions, consistent with the confocal images showing oxidative stress, observing more green-yellowish color cells (indicative of ROS production) in [Low PO43––Low Fe] treatments (Figure 7C) than in [High PO43––High Fe] conditions (Figure 7D).
Effect of Varying Concentrations of P and Fe on the Morphology and Physiology of Halothece sp. and Fischerella muscicola
Halothece sp. cells under optimal nutrient conditions (PO43–, Fe, and/or NO3–) exhibited sizes between 4 and 7 μm. Limitation of PO43– and Fe under NO3– optimal and [Low NO3–] conditions did not cause changes in sizes. However, extremely limiting NO3– conditions caused an increase in size of the cells (up to two-fold with respect to the normal size), reaching an average size of 12.7 ± 0.74 μm. Under extremely limiting NO3– conditions together with PO43– and Fe limitation, cells experience vacuole production together with modification of shape and breakage of the cells (Figure 7E). In addition, we also observed that under these same conditions, cells experience total chlorosis (dramatic loss of phycobiliproteins), and cells were barely visible under confocal microscopy compared with cells under optimal nutrient conditions.
Programmed cell death for F. muscicola was studied through apoptosis assay to detect mortality in four treatments: [Low PO43––Low Fe] (Figure 7F), [Low PO43––High Fe] (Figure 7G), [High PO43––Low Fe] (Figure 7H), and [High PO43––High Fe] (Figure 7I). Results showed that PO43– and Fe limitation caused increased mortality. At [High PO43––High Fe], there was no signal of annexin V in conjugation with phosphatidylserine detected, indicating the good status of the cells in this treatment.
Prediction of Genes Involved in P, Fe, and N Adaptation and Survival in Halothece sp.
We predicted the consensus sequences for TBSs for SphR-PhoB (PHO box), Fur regulator (Fur Box), and NtcA protein (NtcA box) for Halothece sp. For PHO box, we established that consensus sequence was formed by three tandem repeats of 8 bp ([ATTTAAAT]3) separated by 3 bp (Figure 8A). Fur Box was formed by 19 bp inverted repeats (ATTGAAAATTATTTT[T/C]AAT) (Figure 8B). Finally, NtcA box was constituted by TGTAN8TACA in which GTA at positions 2–4 and TAC at positions 13–15 were well conserved (Figure 8C). From the prediction of these boxes, we described what potential genes are implicated in Pho, Fur, and NtcA regulons (Supplementary Tables S2–S4).
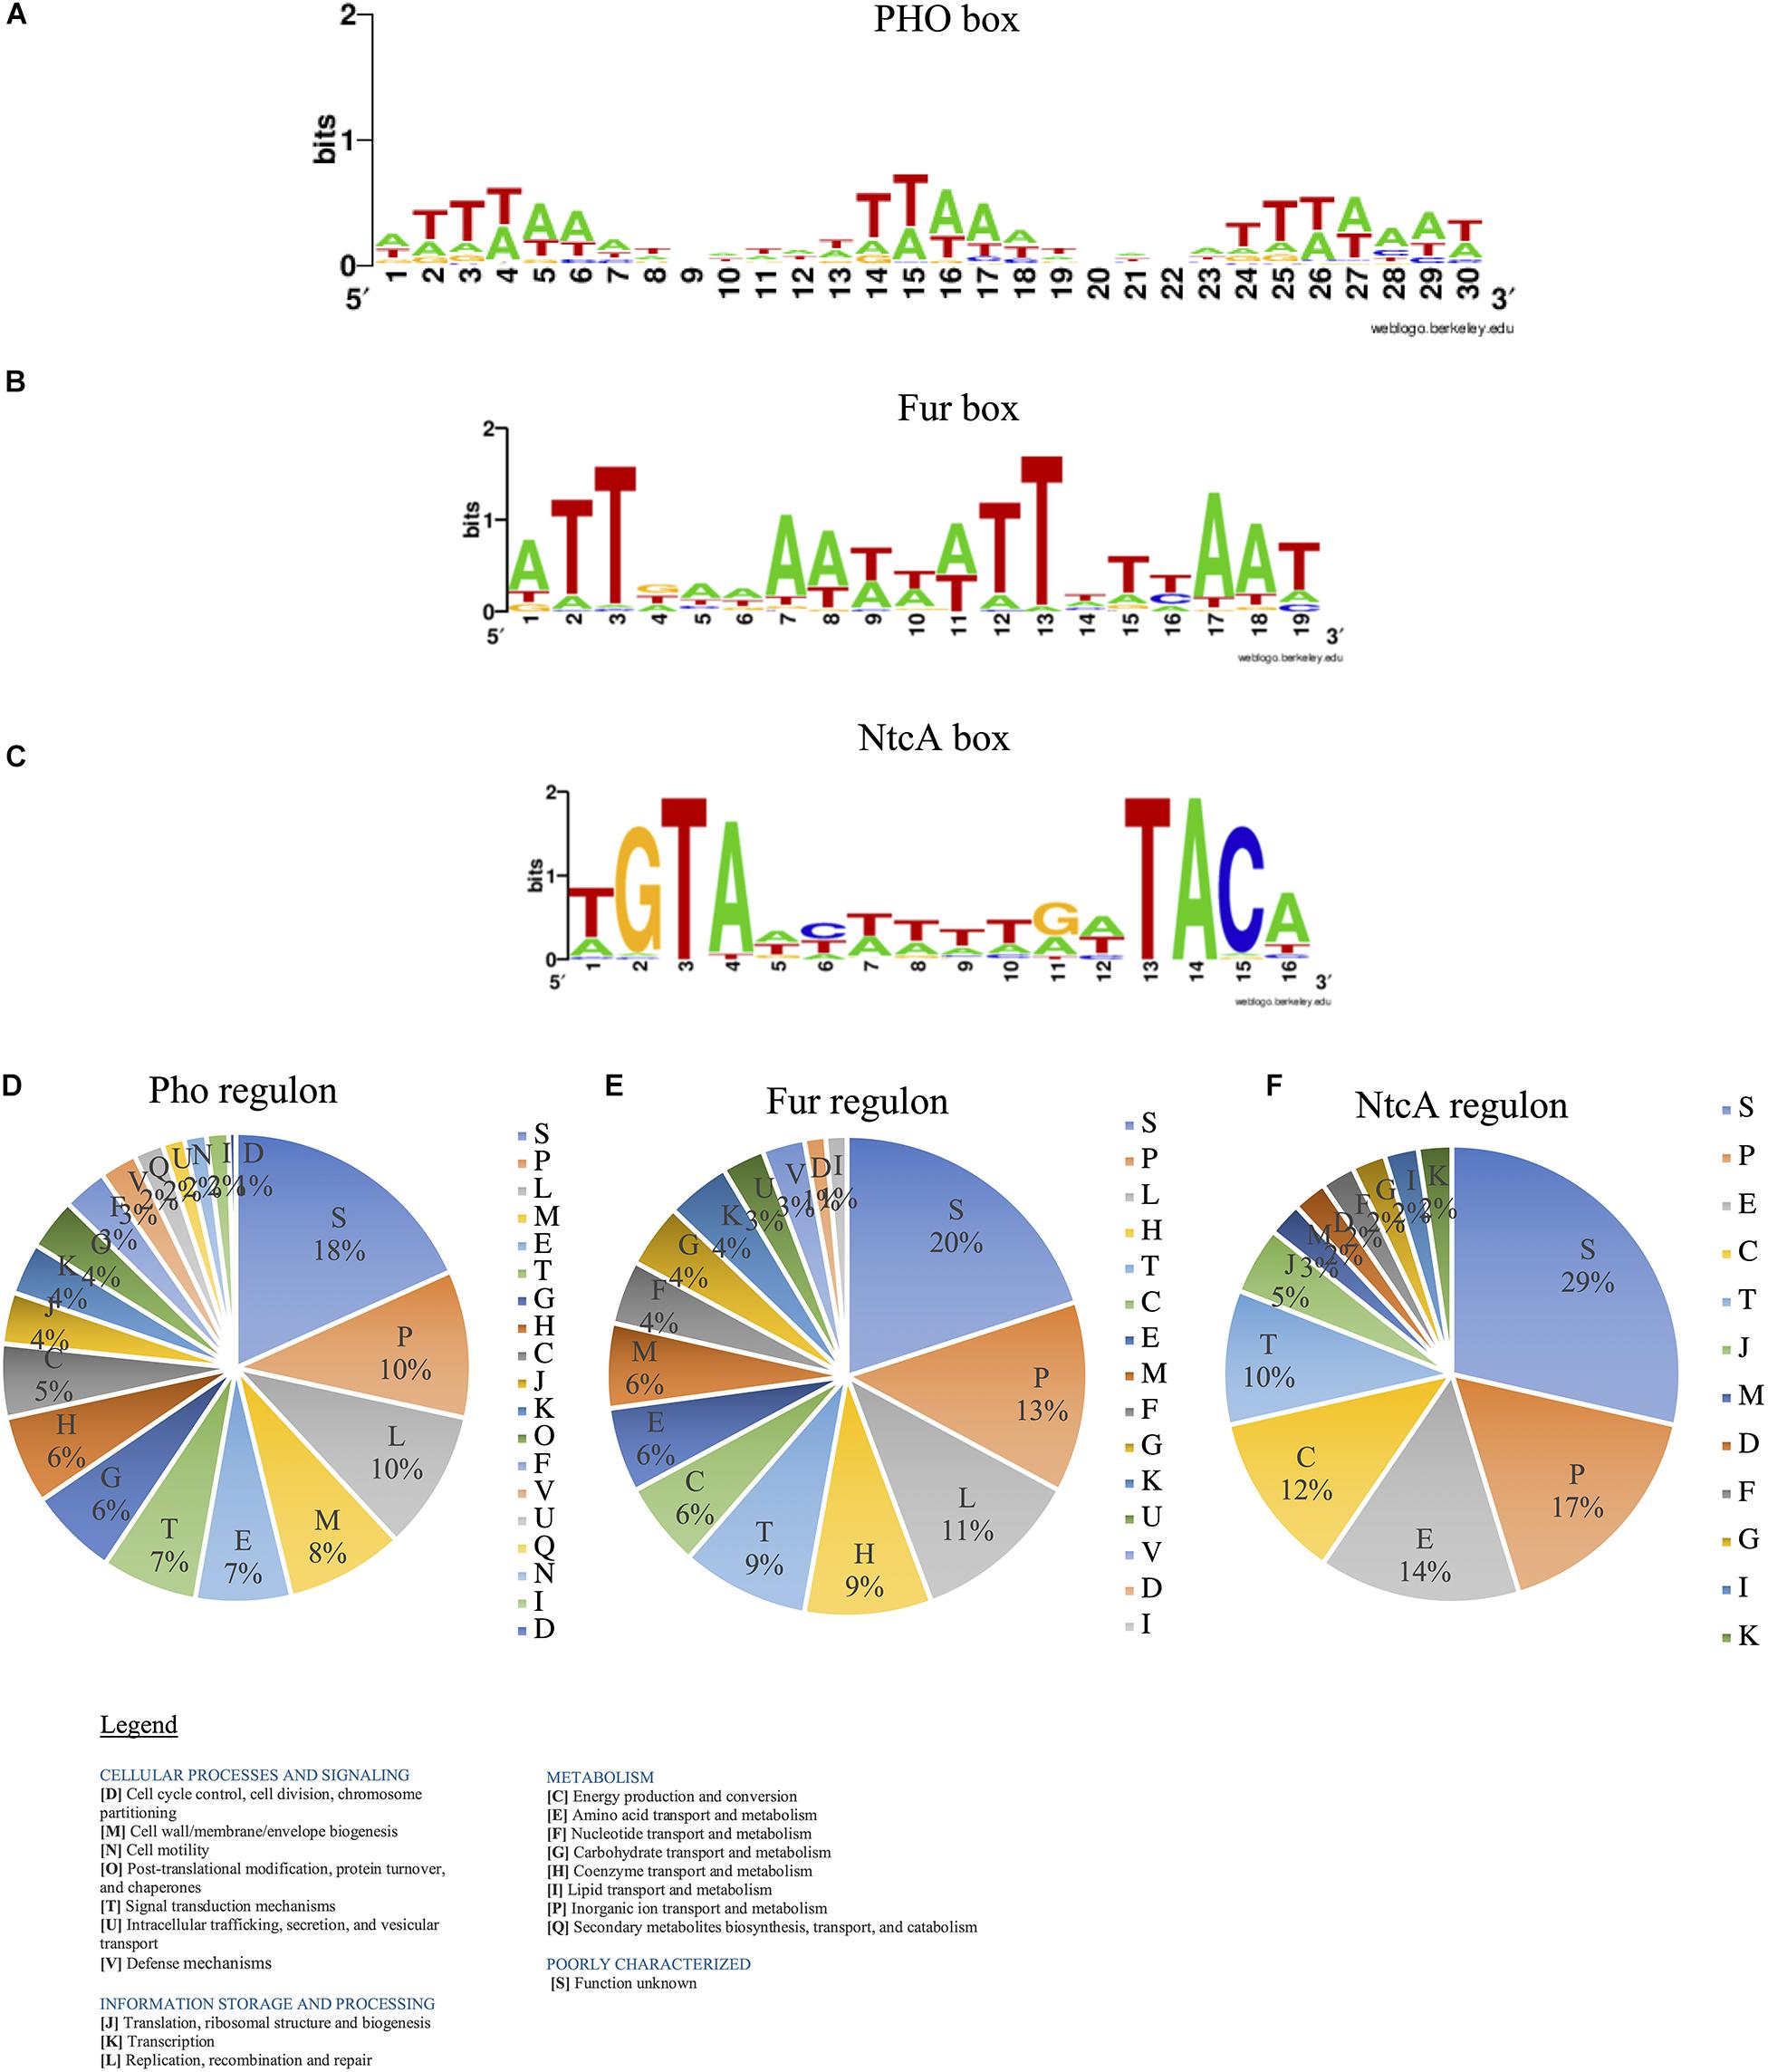
Figure 8. Transcriptional binding sites (TBS) for PhoB, Fur, and NtcA regulators predicted for Halothece sp. (A) PHO box, (B) Fur box, and (C) NtcA box in Halothece sp. The Markov models were built with WebLogo. (D–F) Single-letter functional codes (COGs) for (D) Pho regulon, (E) Fur regulon, and (F) NtcA regulon in Halothece sp. PO43– is represented as Pi.
Pho regulon (Figure 8D) was mainly constituted by genes involved in inorganic ion transport and metabolism (P) (10%), replication, recombination and repair (L) (10%), and cell wall/membrane/envelope biogenesis (M) (8%), detecting 218 genes (Supplementary Table S2). Among them, we detected genes that are part of the “classical” Pho regulon (e.g., some of them found in the same operon): PstS family phosphate ABC transporter substrate-binding protein-phosphate (pstS), ABC transporter permease subunit PstC-phosphate (pstC), ABC transporter permease PstA-phosphate (pstA), ABC transporter ATP-binding protein PstB (pstB), PhoQ sensor (phoQ), or alkaline phosphatase (phoA). In addition, we detected other genes under the control of PhoB such as nblA (involved in chlorosis processes); gvpA, gvpN, gvpL, and gvpF (involved in gas vesicles); cas genes (involved in CRISPR-Cas systems); and a whole group of genes that codify for transferases, endonucleases, ABC transporters, or transposases (Supplementary Table S2).
Fur regulon (Figure 8E) mostly was distributed in P (13%), L (11%), coenzyme transport and metabolism (H) (9%), and signal transduction mechanisms (T) (9%), detecting 73 genes (Supplementary Table S3). We detected genes under the control of Fur box directly involved in Fe acquisition, such as energy transducer TonB (tonB), MotA/TolQ/ExbB proton channel family protein, and three operons of transporter permease subunit (feoA–feoB). Fur boxes were detected upstream of genes related in photosynthesis and respiration [e.g., photosystem II reaction center protein X (psbX)], in the pathway of chlorophyll biosynthesis [glutamate-1-semialdehyde-2,1-aminomutase (gsaI)], and in bacteriochlorophyll biosynthesis [magnesium-protoporphyrin IX monomethyl ester anaerobic oxidative cyclase/DNA-binding response regulator (bchE)].
Finally, NtcA regulon (Figure 8F) was constituted by genes mostly involved in P (17%), amino acid transport and metabolism (E) (14%), and energy production and conversion (C) (12%), detecting 40 genes (Supplementary Table S4). We detected genes involved in N2-fixation processes: FeMo cofactor biosynthesis protein (nifB) and molybdate ABC transporter substrate-binding protein (modA); in nitrogen assimilation: ferredoxin–nitrite reductase (nirA); in glutamine/glutamate assimilation: glutamate synthase [NADPH] large chain (gltB), type I glutamate-ammonia ligase (glnN) and sodium:glutamate symporter (gltS); and in ammonium assimilation: ammonium transporter (amt). In addition, Fur regulator itself potentially has a NtcA box.
Discussion
Effect of Varying N Concentrations on Halothece sp. Compared With Fischerella muscicola
In this study, the dependence on the concentration of combined N sources such as NO3– for growth of diazotrophic cyanobacterial cultures differed between the unicellular Halothece sp. and the filamentous heterocyst-forming F. muscicola (Table 1 and Figures 1A–C, 2A, 3A, 4A). Theoretically, N2-fixers are independent of inorganic N source (e.g., F. muscicola) because of their capability of fixing N2 (Knapp, 2012). However, at extremely limiting NO3– conditions (i.e., 6.66 nM), almost having N2 as sole N source, Halothece sp. were barely growing (Table 1 and Figures 1C, 4A), and their morphology (increased size) and physiology (i.e., exhibiting extreme chlorosis) changed. Chlorosis can result from the deprivation of NO3–, which promotes the degradation of phycobilisomes through the protein NblA (Klotz et al., 2015), which was detected here under the PhoB control (Supplementary Table S2). The observed increases in cell size, possibly, is a result of cell division cessation (Klotz et al., 2016). Moreover, vacuole formation was observed possibly due to the storage of compounds in response to severe N limitation (Figure 7E). Our results indicate that in some N2-fixing species, e.g., Halothece sp., a minimum amount of combined N sources is necessary for the proper functioning of the cells (Qmin ranging from 1.19 to 1.51 mM of NO3–, Figure 4A). However, it remains to be investigated whether these cells in the natural environment, indeed, require a combined source of inorganic nitrogen and if this requirement can be supplied by other diazotrophs in N-limited waters.
Contrary with Halothece sp., F. muscicola cells were totally independent of combined N source and were able to grow with N2 as the sole N source. The viability of unicellular N2-fixers to grow under N2 as sole N source may be dependent on the presence and type of additional carbon (C) source to support their growth as shown with Synechococcus sp. strain SF1 (isolated from macroalgae, Sargassum fluitans), which was not able to grow with HCO3– as sole C source (Spiller and Shanmugam, 1987). Here, Halothece sp. were cultured with glucose and citrate, and these may not be the optimal C source for their growth when grown at almost having N2 as sole N source. Unicellular N2-fixers also have been shown to grow more when NO3– is added compared when grown with only N2 as sole N source (Agawin et al., 2007), since a larger energetic cost is associated with assimilating N2 versus NO3– assimilation. Since N2-fixation is sensitive to oxygen (O2), cyanobacteria must develop strategies to avoid N2-fixation inhibition by the O2 liberated from photosynthesis. Unicellular cyanobacterial cells are able to separate temporarily two incompatible processes: N2-fixation (at night) and photosynthesis (at day) in the same cell (De Bruijn, 2015). These two processes have to be tightly controlled to avoid inhibition of N2-fixation through well-regulated circadian clocks (Toepel et al., 2008), and these strategies can be energy consuming. Aside therefore of the energy cost of assimilating N2, Halothece sp. may have an add-on cost of temporally separating N2-fixation and photosynthetic process, and thus they cannot be totally independent of combined sources of inorganic N. On the contrary, filamentous heterocyst-forming cells have specialized cells (heterocyst) in which N2-fixation takes place in anoxic conditions and may not have an add-on cost of temporally separating N2-fixation and photosynthetic processes and thus are better adapted to growing with N2 as sole N source (De Bruijn, 2015; Figure 5B).
Effect of Varying Concentrations of P and Fe on Halothece sp. and Fischerella muscicola
Concentration of P and Fe in Halothece sp. and Fischerella muscicola
Phosphorus (P) is needed for many cellular components, such as cellular membranes, nucleic acids, and ATP-dependent reactions such as N2-fixation, which is energetically costly, requiring 16 ATPs (N2 + 8e– + 16ATP + 8H+ → 2NH3 + H2 + 16ADP + 16PO43–) (Hoffman et al., 2014). Under optimum conditions for N2-fixation (at low [Low NO3–] for Halothece sp. and without any combined N source in the case of F. muscicola), increasing concentrations of PO43– generally increased the growth of both species, suggesting that PO43– was an important limiting factor for both species and affected their N2-fixation rates (Figures 1–5). These results are consistent with the previous study of Fernández-Juárez et al. (2019) reporting the increased rates of P-acquisition mechanisms (PO43–-uptake rates and APAs) at [Low NO3–] for Halothece sp. At high concentrations of NO3– where N2-fixation rates were lower (and thus this P-requirement can be lower), growth of Halothece sp. was independent of varying concentrations of PO43–. It is well described that in some cyanobacteria, e.g., Trichodesmium sp., one of the major N2-fixers in the Atlantic, P is the main element regulating N2-fixation (Sañudo-Wilhelmy et al., 2001). Under P-limiting environments (e.g., the Mediterranean Sea), N2-fixers must therefore depend on external P sources (such as Saharan dust deposition, Tanhua et al., 2013), and cells have to be well adapted to P limitation with mechanisms for phosphorus scavenging (Dyhrman and Haley, 2006; Fernández-Juárez et al., 2019).
Iron (Fe) had differing effects for Halothece sp. (i.e., toxic effect under high Fe levels under [Low NO3–]) and for F. muscicola (i.e., limiting growth under low Fe levels) (Table 1 and Figures 1B, 2A, 3B,C, 4, 5). The results for F. muscicola were consistent with studies on Crocosphaera watsonii in which severe Fe limitation (3 nM) showed strong negative changes in growth and N2-fixation, limiting both processes, while higher Fe levels (up to 400 nM) increased these two parameters (Jacq et al., 2014). N2-fixation is an Fe-dependent process, since nitrogenase complex contains 38 Fe atoms per holoenzyme (Hoffman et al., 2014). This Fe dependence was observed for F. muscicola at high PO43– levels (Figure 5B). However, in Halothece sp., high amounts of Fe (7.5 μM) inhibited N2-fixation but only under high PO43– levels, suggesting toxicity at these levels of PO43– and Fe for this species (Figures 3C, 4B, 5A). Nonetheless, Fe can control N2-fixation in Halothece sp. cells, considering the Fe dependence of their alkaline phosphatase D (PhoD), which releases PO43– from organic sources to fuel N2-fixation (Fernández-Juárez et al., 2019). Further studies must be conducted especially in Halothece sp. to determine which threshold of Fe concentrations can Fe inhibit/enhance growth and N2-fixation rates.
Interaction Between P and Fe Under Different Nitrogen Concentrations
Cell Recovery Under P, Fe, and N Limitation in Halothece sp.
It is well documented how unicellular cyanobacteria cells are able to recover their phenotype by a genetically determined program (Klotz et al., 2016). Re-inoculum of PO43– and Fe in [Low PO43–-Low Fe] under NO3– optimal conditions and even in [High PO43––High Fe] under extremely limiting NO3– conditions with the addition of NO3– had as a consequence the partial or complete recovery of the green natural color and growth of the cells (Figure 1C). However, here, we observed that for Halothece sp., this program is “canceled” under extreme NO3– limitation and co-limitation of PO43– and Fe. Under extremely limiting NO3– and [Low PO43––Low Fe] conditions, addition of PO43– and Fe did not result in growth recovery of the cells, suggesting that nutrient co-limitation (PO43–, Fe, and NO3–) could kill cells irreversibly by breakage of cells (Figures 1C, 7E).
Nature of Nutrient Co-Limitation (P, Fe, and N) in Halothece sp. and Fischerella muscicola
In oligotrophic areas, e.g., the tropical North Atlantic, bacterial productivity and biomass are usually co-limited with N, P, and/or Fe (Mills et al., 2004; Arrigo, 2005; Moore et al., 2008). The interactions between these limiting nutrients can trigger different types of limitation: simultaneous co-limitation (nutrient limitation of, e.g., N, P, and/or Fe have collective responses), independent co-limitation (nutrient limitation of, e.g., N, P, and/or Fe have different responses), and serial limitation wherein the response of a second limiting nutrient is appreciable after the previous addition of the primary limiting nutrient (Harpole et al., 2011). To our knowledge, this study is the first to show evidences of serial limitation of N (NO3–) and P (PO43–) in diazotrophs with combined N as the primary limiting nutrient as suggested by the results for Halothece sp. (Figure 3A). This suggests that in extremely N-limited waters, diazotrophs like Halothece sp. are not competitive enough to compensate for N-deficits of the system through their N2-fixation activities and cannot deplete the P concentration enough for the other co-occurring diazotrophic or non-diazotrophic species in the community to become P-limited. The reverse would follow for F. muscicola, which was independent of combined N source. The simultaneous co-limitation of PO43– and Fe observed in Figure 3C for Halothece sp. and F. muscicola may be due to the nature of the process of N2-fixation, which is ATP dependent, and Fe is a structural component of the nitrogenase enzyme (Hoffman et al., 2014). Iron (Fe) is also a co-factor of alkaline phosphatases, which is one of the P-acquisition mechanisms of diazotrophs when P is in short supply (Santos-Beneit, 2015; Fernández-Juárez et al., 2019). However, the mechanisms behind the simultaneous limitation of PO43– and Fe have to be further investigated as we also observed deleterious effects depending on the concentrations of these nutrients.
Differences in Nutrient Kinetics in Diazotrophs at Different P and Fe Concentrations
Of the two species of cyanobacteria tested, the one that can most probably adapt to low levels of PO43– is the unicellular cyanobacterium Halothece sp. based on their nutrient kinetics (Figure 4B). Based on the Monod curves, the unicellular strain had the lowest Kμ and Qmin, indicating a better adaptation to PO43– than the filamentous diazotroph (Figure 4B), albeit the Kμ measured in Halothece sp. under [High Fe] (i.e., 10 nM) shows lower affinity for PO43– than that reported in the marine picophytoplankton Synechococcus (1 nM) (Kretz et al., 2015). In addition, its Qmin (2.27 μM) was much higher than that of the marine Synechococcus (3 nM) (Kretz et al., 2015), indicating that Halothece sp. is well adapted to P limitation but not at the level of Synechococcus. Unicellular cyanobacteria with smaller sizes are more efficient in acquiring nutrients in nutrient-limited waters because of their high surface: area ratios, while heterocyst-forming bacteria, which are generally bigger in size, need higher nutrient requirements (Haramaty et al., 2007). This is clearly shown in the Monod plot (Figure 4B), in which F. muscicola needs high amounts of Fe to growth, on the contrary of Halothece sp. in which high Fe levels inhibited cell abundance (Figures 3C, 4B).
Reactive Oxygen Species Production and Apoptotic Changes Derived From P, Fe, and N Limitation
Nutrient limitation (i.e., PO43–, Fe, and/or NO3–) increased ROS in both species, Halothece sp. and F. muscicola (Figures 6A–C, 7A–D). Iron (Fe) had a key role in regulating ROS production. Increasing Fe levels can have different responses as shown in Figures 6A–C: (1) beneficial through increase activity of enzymatic antioxidant defenses or (2) extremely toxic through increase in Fenton and Haber–Weiss reaction (Latifi et al., 2009; Diaz and Plummer, 2018). The second case is suggested in Figure 6B, in which under [Low NO3–] and [High PO43–], Fe increased ROS production and in turn can inhibit N2-fixation (Alquéres et al., 2010). This could explain why Halothece sp. under [High PO43––High Fe] had lower growth and N2-fixation rates than the other treatments with high levels of PO43– (Figure 5A). On the contrary, in F. muscicola, Fe generally reduced ROS production (Figure 6C). The reduction of ROS production with Fe addition is consistent with a study on Anabaena PCC 7120, in which ROS increased up to 10-fold when the cells were starved with Fe (Latifi et al., 2005). The results of our apoptosis tests (normally applied to eukaryotic cells) for F. muscicola when cells were limited by PO43– and/or Fe are first evidences of programmed cell death in cyanobacteria by nutrient limitation (Figures 7F–I). Further investigations have to be performed to figure out the molecular mechanisms behind this.
Prediction of Genes Involved in P, Fe, and N Limitation in Halothece sp.
We predicted the Pho, Fur, and NtcA boxes in the unicellular cyanobacterium Halothece sp. (PCC 7418), controlled by the master regulators in P, Fe, and N metabolism (PhoB, Fur, and NtcA, respectively), showing well-conserved sequences in this bacteria (Figures 8A–C), consistent with several studies (Tiwari et al., 2015; Kaushik et al., 2016; Giner-Lamia et al., 2017). A large majority of these genes associated to these boxes were involved in inorganic ion transport and metabolism (P) (Figures 8D–F and Supplementary Tables S2–S4), providing key information of how cyanobacteria respond to P, Fe, and N limitation (Figure 9). We detected genes involved in typical transporters in P, Fe, and N metabolism, in Fe storage, cell wall biosynthesis, amino acid metabolism, photosynthesis, chlorosis, chlorophylls and PC biosynthesis, anti-phage systems (e.g., cas genes, implicated in the CRISPR-Cas systems), or even virulence (Supplementary Tables S2–S4). Through the created algorithms, we were able to detect elements from the “classical” Pho regulon (e.g., transporters, pstABCS, enzymes through which PO43– is obtained from dissolved organic phosphorus, APases or stored phosphate, ppK), Fe transporters (e.g., feoA and feoB), and a whole group of genes involved in N metabolism (e.g., gltBNS, amt, and nifB) and thus being the most probable genes controlled by these TFs as is already described in Cyanothece, Gloeobacter, Microcystis, Nostoc, Prochlorococcus, Synechococcus, Synechocystis, Thermosynechococcus, and Trichodesmium (Supplementary Material [Multifasta] and Supplementary Tables S2–S4). A N2-fixation regulator, nifB, was predicted under the control of NtcA, whose product is crucial in iron–molybdenum biosynthesis (Supplementary Table S4). Downstream of this gene, we localized an entire cluster of genes related to N2-fixation: Fd III 4Fe-4S, nifS, nifU, nifH, nifD, nifK, nifZ, nifE, nifN, nifX, DUF683, and nifW. In addition, some reports affirm that NtcA binds and controls Fur protein (López-Gomollón et al., 2007), as we predicted in this study, showing that N limitation can increase Fur protein levels and suggesting the narrow connection between N and Fe metabolism.
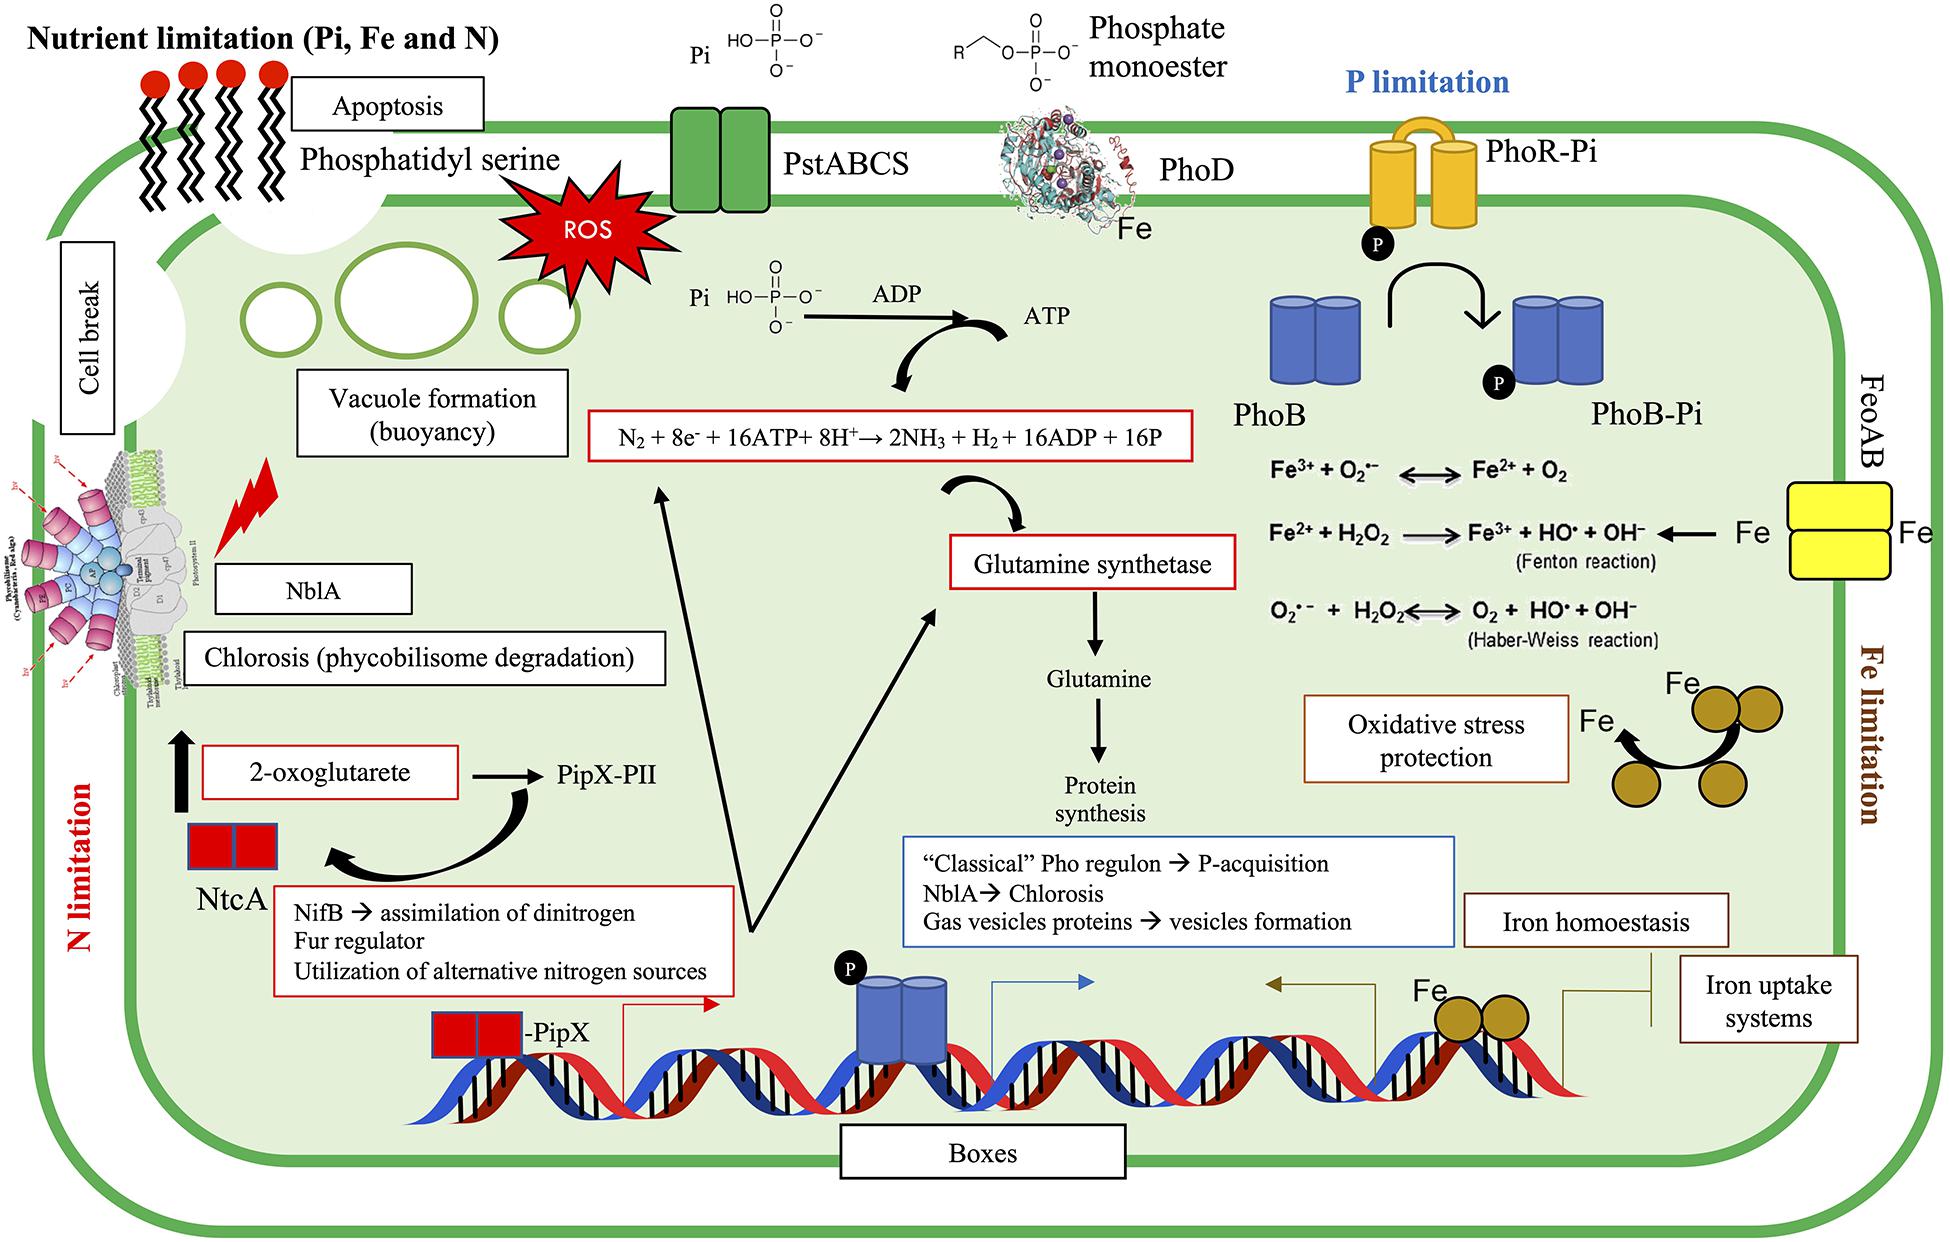
Figure 9. Summary of PO43–, Fe, and NO3– interactions and the physiological and molecular responses of the cyanobacteria tested. Nutrient limitation can result in chlorosis, apoptosis, vacuole formation, reactive oxygen species (ROS) production, and growth inhibition. In such situations, cells may activate different molecular mechanisms. Under PO43– limitation (blue), the autophosphorylation of PhoR allows the phosphorylation of PhoB, regulating the P-response (i.e., expression of the “classical” Pho regulon, e.g., alkaline phosphatase, PhoD). Fur is a repressor (although it can play as activator) that responds to Fe limitation (brown) and inhibits/allows the transcription of the Fur regulon, through the association with divalent metal (i.e., Fe). Nitrogen limitation (red) triggers different responses through NtcA regulator. When N abundance is low, 2-oxoglutarate (2-OG) may increase, and this could bind to a complex called PII–PipX and breaks this association, allowing the disassociation of PipX, and the formation of PipX–NtcA. PipX is a coactivator of NtcA, and it is suggested that it can stabilize NtcA and would help to recruit RNA polymerase (Tiwari et al., 2015; Kaushik et al., 2016; Giner-Lamia et al., 2017). PO43– is represented as Pi.
In summary, we show that two species of N2-fixing cyanobacteria potentially associated with seagrasses have differing sensibilities to PO43–, Fe, and NO3– concentrations, showing that these nutrients interact with each other based on our experimental and bio-informatic analysis. Despite the low number replications (being conscious that some results cannot be generalized), the growth responses reported here at varying concentrations of PO43– and Fe at different NO3– conditions must be taken with precaution since the internal storage of these nutrients could affect these results considering that the cells were inoculated from optimal nutrients conditions. This is a pilot study in which insights on nutrient limitation in N2-fixers are reported. Nonetheless, our study of a multifactorial design provides useful data and important findings of nutrient limitation in marine diazotrophs (at physiological, biochemical, and genetic levels). Deeper molecular assays (i.e., transcriptomic or proteomic assays) are recommended to investigate all the predicted genes involved in P, Fe, and N metabolism.
Data Availability Statement
The raw data supporting the article of this manuscript will be made available by the authors, without undue reservation, to any qualified researcher.
Author Contributions
VF-J and NA designed the experiments. VF-J conducted all experiments. All authors led the writing of the manuscript, reviewed, and supervised by NA.
Funding
This work was supported by funding to NA through the Ministerio de Economía, Industria y Competitividad-Agencia Estatal de Investigación, and the European Regional Development Funds project (CTM2016-75457-P). AS-G was supported by the Spanish Ministry of Economy and Competitiveness, Instituto de Salud Carlos III (CIBEROBN CB12/03/30038).
Conflict of Interest
The authors declare that the research was conducted in the absence of any commercial or financial relationships that could be construed as a potential conflict of interest.
Acknowledgments
We acknowledge the support and help of Scientific Technical Service (Maria Trinidad Garcia Barceló) of the University of the Balearic Islands for gas chromatography analyses. We also thank Pere Ferriol Buñola and Alba Coma Ninot for the help in the acquisition of the cultures.
Supplementary Material
The Supplementary Material for this article can be found online at: https://www.frontiersin.org/articles/10.3389/fmicb.2020.541558/full#supplementary-material
Supplementary Table 1 | List of all experimental treatments conducted in this study.
Supplementary Table 2 | Pho regulon prediction. PHO boxes sequences, their position in the genome, orientation, the genes that are controlling (the Pho regulon), locus tag from these genes, the distance of the box from the gene and the gen function from single-letter of functional (COGs) are presented.
Supplementary Table 3 | Fur regulon prediction. Fur boxes sequences, their position in the genome, orientation, the genes that are controlling (the Fur regulon), locus tag from these genes, the distance of the box from the gene and the gen function from single-letter of functional (COGs) are presented.
Supplementary Table 4 | NtcA regulon prediction. NtcA boxes sequences, their position in the genome, orientation, the genes that are controlling (the NtcA regulon), locus tag from these genes, the distance of the box from the gene and the gen function from single-letter of functional (COGs) are presented.
Footnotes
References
Agawin, N. S. R., Benavides, M., Busquets, A., Ferriol, P., Stal, L. J., and Arístegui, J. (2014). Dominance of unicellular Cyanobacteria in the diazotrophic community in the Atlantic Ocean. Limnol. Oceanogr. 59, 623–637. doi: 10.4319/lo.2014.59.2.0623
Agawin, N. S. R., Ferriol, P., Cryer, C., Alcon, E., Busquets, A., Sintes, E., et al. (2016). Significant nitrogen fixation activity associated with the phyllosphere of Mediterranean seagrass Posidonia oceanica: first report. Mar. Ecol. Prog. Ser. 551, 53–62. doi: 10.3354/meps11755
Agawin, N. S. R., Ferriol, P., Sintes, E., and Moyà, G. (2017). Temporal and spatial variability of in situ nitrogen fixation activities associated with the Mediterranean sseagrass Posidonia oceanica meadows. Limnol. Oceanogr. 62, 2575–2592. doi: 10.1002/lno.10591
Agawin, N. S. R., Rabouille, S., Veldhuis, M. J. W., Servatius, L., Hol, S., Van Overzee, M. J., et al. (2007). Competition and facilitation between unicellular nitrogen-fixing Cyanobacteria and non – nitrogen-fixing phytoplankton species. Limonol. Oceanogr. 52, 2233–2248. doi: 10.4319/lo.2007.52.5.2233
Alquéres, S. M. C., Oliveira, J. H. M., Nogueira, E. M., Guedes, H. V., Oliveira, P. L., Câmara, F., et al. (2010). Antioxidant pathways are up-regulated during biological nitrogen fixation to prevent ROS-induced nitrogenase inhibition in Gluconacetobacter diazotrophicus. Arch. Microbiol. 192, 835–841. doi: 10.1007/s00203-010-0609-1
Arrigo, R. K. (2005). Marine microorganisms and global nutrient cycles. Nature 437, 343–348. doi: 10.1038/nature04158
Baichoo, N., and Helmann, J. D. (2002). Recognition of DNA by Fur: a reinterpretation of the Fur box consensus sequence recognition of DNA by Fur: a reinterpretation of the fur box consensus sequence. J. Bacteriol. 184, 5826–5832. doi: 10.1128/JB.184.21.5826
Browning, T. J., Achterberg, E. P., Yong, J. C., Rapp, I., Utermann, C., Engel, A., et al. (2017). Iron limitation of microbial phosphorus acquisition in the tropical North Atlantic. Nat. Commun. 8, 1–7. doi: 10.1038/ncomms15465
Crooks, G. E., Hon, G., Chandonia, J. M., and Brenner, S. E. (2004). WebLogo: a sequence logo generator. Genome Res. 14, 1188–1190. doi: 10.1101/gr.849004
De Bruijn, F. J. (2015). Biological Nitrogen Fixation. Amsterdam: Elsevier Inc, doi: 10.1002/9781119053095
de Jong, A., Pietersma, H., Cordes, M., Kuipers, O. P., and Kok, J. (2012). PePPER: a webserver for prediction of prokaryote promoter elements and regulons. BMC Genomics 13:299. doi: 10.1186/1471-2164-13-299
Diaz, J. M., and Plummer, S. (2018). Production of extracellular reactive oxygen species by phytoplankton: past and future directions. J. Plankton Res. 40, 655–666. doi: 10.1093/plankt/fby039
Dyhrman, S. T., and Haley, S. T. (2006). Phosphorus scavenging in the unicellular marine diazotroph Crocosphaera watsonii. Appl. Environ. Microbiol. 72, 1452–1458. doi: 10.1128/AEM.72.2.1452-1458.2006
Fernández-Juárez, V., Bennasar-Figueras, A., Tovar-Sanchez, A., and Agawin, N. S. R. (2019). The role of iron in the P-acquisition mechanisms of the unicellular N2-fixing Cyanobacteria halothece sp., found in association with the Mediterranean seagrass Posidonia oceanica. Front. Microbiol. 10:1903. doi: 10.3389/fmicb.2019.01903
Geider, R. J., and La Roche, J. (2002). Redfield revisited: variability of C:N:P in marine microalgae and its biochemical basis. Eur. J. Phycol. 37, 1–17. doi: 10.1017/S0967026201003456
Giner-Lamia, J., Robles-Rengel, R., Hernández-Prieto, M. A., Isabel Muro-Pastor, M., Florencio, F. J., and Futschik, M. E. (2017). Identification of the direct regulon of NtcA during early acclimation to nitrogen starvation in the cyanobacterium Synechocystis sp. PCC 6803. Nucleic Acids Res. 45, 11800–11820. doi: 10.1093/nar/gkx860
Golosova, O., Henderson, R., Vaskin, Y., Gabrielian, A., Grekhov, G., Nagarajan, V., et al. (2014). Unipro UGENE NGS pipelines and components for variant calling. RNA-seq and ChIP-seq data analyses. PeerJ 2:e644. doi: 10.7717/peerj.644
Haramaty, L., Quigg, A., Berman-Frank, I., Finkel, Z. V., and Irwin, A. J. (2007). Nitrogen-fixation strategies and Fe requirements in Cyanobacteria. Limnol. Oceanogr. 52, 2260–2269. doi: 10.4319/lo.2007.52.5.2260
Harpole, W. S., Ngai, J. T., Cleland, E. E., Seabloom, E. W., Borer, E. T., Bracken, M. E. S., et al. (2011). Nutrient co-limitation of primary producer communities. Ecol. Lett. 14, 852–862. doi: 10.1111/j.1461-0248.2011.01651.x
Hedges, L. V., Gurevitch, J., and Curtis, P. S. (1999). The meta-analysis of response ratios in experimental ecology. Ecology 80, 1150–1156. doi: 10.1890/0012-9658(1999)080[1150:tmaorr]2.0.co;2
Hoffman, B. M., Lukoyanov, D., Yang, Z.-Y., Dean, D. R., and Seefeldt, L. C. (2014). Mechanism of nitrogen fixation by nitrogenase: the next stage. Chem. Rev. 114, 4041–4062. doi: 10.1021/cr400641x
Huerta-Cepas, J., Szklarczyk, D., Heller, D., Hernández-Plaza, A., Forslund, S. K., Cook, H., et al. (2018). eggNOG 5.0: a hierarchical, functionally and phylogenetically annotated orthology resource based on 5090 organisms and 2502 viruses. Nucleic Acids Res. 47, 309–314. doi: 10.1093/nar/gky1085
Jacq, V., Ridame, C., L’Helguen, S., Kaczmar, F., and Saliot, A. (2014). Response of the unicellular diazotrophic cyanobacterium Crocosphaera watsonii to iron limitation. PLoS One 9:e0086749. doi: 10.1371/journal.pone.0086749
Jensen, B. B., and Cox, R. P. (1983). Direct measurements of steady-state kinetics of Cyanobacterial N2 uptake by membrane-leak mass spectrometry and comparisons between nitrogen fixation and acetylene reduction. Appl. Environ. Microbiol. 45, 1331–1337. doi: 10.1128/aem.45.4.1331-1337.1983
Kaushik, M. S., Singh, P., Tiwari, B., and Mishra, A. K. (2016). Ferric Uptake Regulator (FUR) protein: properties and implications in Cyanobacteria. Ann. Microbiol. 66, 61–75. doi: 10.1007/s13213-015-1134-x
Klotz, A., Georg, J., Bučinská, L., Watanabe, S., Reimann, V., Januszewski, W., et al. (2016). Awakening of a dormant cyanobacterium from nitrogen chlorosis reveals a genetically determined program. Cell Press 26, 2862–2872. doi: 10.1016/j.cub.2016.08.054
Klotz, A., Reinhold, E., Doello, S., and Forchhammer, K. (2015). Nitrogen starvation acclimation in Synechococcus elongatus: redox-control and the role of nitrate reduction as an electron sink. Life 5, 888–904. doi: 10.3390/life5010888
Knapp, A. N. (2012). The sensitivity of marine N2 fixation to dissolved inorganic nitrogen. Front. Microbiol. 3:374. doi: 10.3389/fmicb.2012.00374
Kranzler, C., Lis, H., Finkel, O. M., Schmetterer, G., Shaked, Y., and Keren, N. (2014). Coordinated transporter activity shapes high-affinity iron acquisition in Cyanobacteria. ISME J. 8, 409–417. doi: 10.1038/ismej.2013.161
Kranzler, C., Rudolf, M., Keren, N., and Schleiff, E. (2013). Iron in Cyanobacteria. Adv. Bot. Res. 65, 57–105. doi: 10.1016/B978-0-12-394313-2.00003-2
Kretz, C. B., Bell, D. W., Lomas, D. A., Lomas, M. W., and Martiny, A. C. (2015). Influence of growth rate on the physiological response of marine Synechococcus to phosphate limitation. Front. Microbiol. 6:85. doi: 10.3389/fmicb.2015.00085
Latifi, A., Jeanjean, R., Lemeille, S., Havaux, M., and Zhang, C. C. (2005). Iron starvation leads to oxidative stress in Anabaena sp. strain PCC 7120. J. Bacteriol. 187, 6596–6598. doi: 10.1128/JB.187.18.6596-6598.2005
Latifi, A., Ruiz, M., and Zhang, C. C. (2009). Oxidative stress in Cyanobacteria. FEMS Microbiol. Rev. 33, 258–278. doi: 10.1111/j.1574-6976.2008.00134.x
Llacer, J. L., Espinosa, J., Castells, M. A., Contreras, A., Forchhammer, K., and Rubio, V. (2010). Structural basis for the regulation of NtcA-dependent transcription by proteins PipX and PII. Proc. Natl. Acad. Sci. U.S.A. 107, 15397–15402. doi: 10.1073/pnas.1007015107
López-Gomollón, S., Hernández, J. A., Wolk, C. P., Peleato, M. L., and Fillat, M. F. (2007). Expression of FurA is modulated by NtcA and strongly enhanced in heterocysts of Anabaena sp. PCC 7120. Microbiology 153, 42–50. doi: 10.1099/mic.0.2006/000091-0
Manhart, J. R., and Wong, P. P. (1980). Nitrate effect on nitrogen fixation (acetylene reduction): activities of legume root nodules induced by rhizobia with varied nitrate reductase activities. Plant Physiol. 65, 502–505. doi: 10.1104/pp.65.3.502
Mills, M. M., Ridame, C., Davey, M., La Roche, J., and Geider, R. J. (2004). Iron and phosphorus co-limit nitrogen fixation in the eastern tropical North Atlantic. Nature 429, 232–294. doi: 10.1038/nature02550
Monod, J. (1949). The growth of bacterial cultures. Annu. Rev. Microbiol. 3, 371–394. doi: 10.1146/annurev.mi.03.100149.002103
Moore, C. M., Mills, M. M., Langlois, R., Milne, A., Achterberg, E. P., La Roche, J., et al. (2008). Relative influence of nitrogen and phosphorus availability on phytoplankton physiology and productivity in the oligotrophic sub-tropical North Atlantic Ocean. Limnol. Oceanogr. 53, 291–305. doi: 10.4319/lo.2008.53.1.0291
Nelson, D. C., Waterbury, J. B., and Jannasch, H. W. (1982). Nitrogen fixation and nitrate utilization by marien and freshwater Beggiatoa. Arch. Microbiol 133, 172–177. doi: 10.1007/BF00414997
Ng, T. S., Chew, S. Y., Rangasamy, P., Mohd Desa, M. N., Sandai, D., Chong, P. P., et al. (2015). SNF3 as high affinity glucose sensor and its function in supporting the viability of Candida glabrata under glucose-limited environment. Front. Microbiol. 6:1334. doi: 10.3389/fmicb.2015.01334
Novichkov, P. S., Kazakov, A. E., Ravcheev, D. A., Leyn, S. A., Kovaleva, G. Y., Sutormin, R. A., et al. (2013). RegPrecise 3.0 - A resource for genome-scale exploration of transcriptional regulation in bacteria. BMC Genomics 14:745. doi: 10.1186/1471-2164-14-745
Porra, R. J., Thompson, W. A., and Kriedemann, P. E. (1989). Determination of accurate extinction coefficients and simultaneous equations for assayin chlorophylls a and b extracted with four different solvents. Biochim. Biophys. Acta 975, 384–394. doi: 10.1016/s0005-2728(89)80347-0
Powley, H. R., Krom, M. D., and Van Cappellen, P. (2017). Understanding the unique biogeochemistry of the Mediterranean Sea: insights from a coupled phosphorus and nitrogen model. Global Biogeochem. Cycles 31, 1010–1031. doi: 10.1002/2017GB005648
Quigg, A., Irwin, A. J., and Finkel, Z. V. (2011). Evolutionary inheritance of elemental stoichiometry in phytoplankton. Proc. R. Soc. BBiol. Sci. 278, 526–534. doi: 10.1098/rspb.2010.1356
Reddy, K. J., Haskell, J. B., Sherman, D. M., and Sherman, L. A. (1993). Unicellular, aerobic nitrogen-fixing Cyanobacteria of the genus Cyanothece. J. Bacteriol. 175, 1284–1292. doi: 10.1128/jb.175.5.1284-1292.1993
Redfield, A. C. (1934). “On the proportions of organic derivatives in sea water and their relation to the composition of plankton,” in James Johnstone Meml, ed. R. J. Daniel (Liverpool: Univ. Press Liverpool), 176–192.
Richaud, C., Zabulon, G., Joder, A., Thomas, J., and Zabulon, R. (2001). Nitrogen or sulfur starvation differentially affects phycobilisome degradation and expression of the nblA gene in Synechocystis strain PCC 6803. J. Bacteriol. 183, 2989–2994. doi: 10.1128/JB.183.10.2989
Santos-Beneit, F. (2015). The Pho regulon: a huge regulatory network in bacteria. Front. Microbiol. 6:402. doi: 10.3389/fmicb.2015.00402
Sañudo-Wilhelmy, S. A., Kustka, A. B., Gobler, C. J., Hutchins, D. A., Yang, M., Lwiza, K., et al. (2001). Phosphorus limitation of nitrogen fixation by Trichodesmium in the central Atlantic Ocean. Nature 411, 66–69. doi: 10.1038/35075041
Sobiechowska-Sasim, M., Stoñ-Egiert, J., and Kosakowska, A. (2014). Quantitative analysis of extracted phycobilin pigments in Cyanobacteria—an assessment of spectrophotometric and spectrofluorometric methods. J. Appl. Phycol. 26, 2065–2074. doi: 10.1007/s10811-014-0244-3
Sohm, J. A., Webb, E. A., and Capone, D. G. (2011). Emerging patterns of marine nitrogen fixation. Nat. Rev. Microbiol. 9, 499–508. doi: 10.1038/nrmicro2594
Spiller, H., and Shanmugam, K. T. (1987). Physiological conditions for nitrogen fixation in a unicellular marine cyanobacterium, Synechococcus sp. strain SF1. J. Bacteriol. 169, 5379–5384. doi: 10.1128/jb.169.12.5379-5384.1987
Stal, L. J. (1988). Acetylene reduction technique for assay of nitrogenase. Methods Enzymol. 167, 474–484.
Stanier, R. Y., Deruelles, J., Rippka, R., Herdman, M., and Waterbury, J. B. (1979). Generic assignments, strain histories and properties of pure cultures of Cyanobacteria. Microbiology 111, 1–61. doi: 10.1099/00221287-111-1-1
Statham, P. J., and Hart, V. (2005). Dissolved iron in the Cretan Sea (eastern Mediterranean). Limnol. Oceanogr. 50, 1142–1148. doi: 10.4319/lo.2005.50.4.1142
Sunda, W., and Huntsman, S. (2015). High iron requirement for growth, photosynthesis, and low-light acclimation in the coastal cyanobacterium Synechococcus bacillaris. Front. Microbiol. 6:561. doi: 10.3389/fmicb.2015.00561
Tanhua, T., Hainbucher, D., Schroeder, K., Cardin, V., Álvarez, M., and Civitarese, G. (2013). The mediterranean Sea system: a review and an introduction to the special issue. Ocean Sci. 9, 789–803. doi: 10.5194/os-9-789-2013
Tiwari, B., Singh, S., Kaushik, M. S., and Mishra, A. K. (2015). Regulation of organophosphate metabolism in Cyanobacteria. A review. Microbiology 84, 291–302. doi: 10.1134/S0026261715030200
Toepel, J., Welsh, E., Summerfield, T. C., Pakrasi, H. B., and Sherman, L. A. (2008). Differential transcriptional analysis of the cyanobacterium Cyanothece sp. strain ATCC 51142 during light-dark and continuous-light growth. J. Bacteriol. 190, 3904–3913. doi: 10.1128/JB.00206-08
Tripathi, K., Sharma, N. K., Kageyama, H., Takabe, T., and Rai, A. K. (2013). Physiological, biochemical and molecular responses of the halophilic cyanobacterium Aphanothece halophytica to Pi-deficiency. Eur. J. Phycol. 48, 461–473. doi: 10.1080/09670262.2013.859303
Yuan, Z. C., Zaheer, R., Morton, R., and Finan, T. M. (2006). Genome prediction of PhoB regulated promoters in Sinorhizobium meliloti and twelve proteobacteria. Nucleic Acids Res. 34, 2686–2697. doi: 10.1093/nar/gkl365
Keywords: Halothece sp. PCC 7418, Fischerella muscicola PCC 73103, phosphorus, iron, nitrogen, N2-fixation, reactive oxygen species production, Pho–Fur–NtcA regulon
Citation: Fernández-Juárez V, Bennasar-Figueras A, Sureda-Gomila A, Ramis-Munar G and Agawin NSR (2020) Differential Effects of Varying Concentrations of Phosphorus, Iron, and Nitrogen in N2-Fixing Cyanobacteria. Front. Microbiol. 11:541558. doi: 10.3389/fmicb.2020.541558
Received: 09 March 2020; Accepted: 18 August 2020;
Published: 25 September 2020.
Edited by:
Mar Benavides, Institut de Recherche Pour le Développement (IRD), FranceReviewed by:
Ulisse Cardini, University of Naples Federico II, ItalyDouglas G. Capone, University of Southern California, United States
Francisco M. Cornejo-Castillo, University of California, Santa Cruz, United States
Copyright © 2020 Fernández-Juárez, Bennasar-Figueras, Sureda-Gomila, Ramis-Munar and Agawin. This is an open-access article distributed under the terms of the Creative Commons Attribution License (CC BY). The use, distribution or reproduction in other forums is permitted, provided the original author(s) and the copyright owner(s) are credited and that the original publication in this journal is cited, in accordance with accepted academic practice. No use, distribution or reproduction is permitted which does not comply with these terms.
*Correspondence: Víctor Fernández-Juárez, dmljdG9yLmZlcm5hbmRlekB1aWIuZXM=; Nona S. R. Agawin, bm9uYS5hZ2F3aW5AdWliLmVz