 Marinela Vavla1*
 Filippo Arrigoni2
 Andrea Nordio2,3
 Alberto De Luca2†Silvia Pizzighello1
 Elisa Petacchi1Gabriella Paparella1Maria Grazia D'Angelo4
 Erika Brighina4Emanuela Russo1
 Marianna Fantin1Paola Colombo2
 Andrea Martinuzzi1
- 1Severe Developmental Disabilities Unit, Scientific Institute, IRCCS “Eugenio Medea”, Conegliano, Italy
- 2Neuroimaging Lab, Scientific Institute IRCCS “Eugenio Medea”, Bosisio Parini, Italy
- 3Department of Information Engineering, University of Padova, Padova, Italy
- 4NeuroMuscular Unit, Department of NeuroRehabilitation, IRCCS “Eugenio Medea”, Bosisio Parini, Italy
Friedreich's ataxia (FRDA) is a rare hereditary neurodegenerative disorder caused by a GAA repeat expansion in the FXN gene. There is still no cure or quantitative biomarkers reliaby correlating with the progression rate and disease severity. Investigation of functional and structural alterations characterizing white (WM) and gray matter (GM) in FRDA are needed prerequisite to monitor progression and response to treatment. Here we report the results of a multimodal cross-sectional MRI study of FRDA including Voxel-Based Morphometry (VBM), diffusion-tensor imaging (DTI), functional MRI (fMRI), and a correlation analysis with clinical severity scores. Twenty-one early-onset FRDA patients and 18 age-matched healthy controls (HCs) were imaged at 3T. All patients underwent a complete cognitive and clinical assessment with ataxia scales. VBM analysis showed GM volume reduction in FRDA compared to HCs bilaterally in lobules V, VI, VIII (L>R), as well as in the crus of cerebellum, posterior lobe of the vermis, in the flocculi and in the left tonsil. Voxel-wise DTI analysis showed a diffuse fractional anisotropy reduction and mean, radial, axial (AD) diffusivity increase in both infratentorial and supratentorial WM. ROI-based analysis confirmed the results showing differences of the same DTI metrics in cortico-spinal-tracts, forceps major, corpus callosum, posterior thalamic radiations, cerebellar penduncles. Additionally, we observed increased AD in superior (SCP) and middle cerebellar peduncles. The WM findings correlated with age at onset (AAO), short-allelle GAA, and disease severity. The intragroup analysis of fMRI data from right-handed 14 FRDA and 15 HCs showed similar findings in both groups, including activation in M1, insula and superior cerebellar hemisphere (lobules V–VIII). Significant differences emerged only during the non-dominant hand movement, with HCs showing a stronger activation in the left superior cerebellar hemisphere compared to FRDA. Significant correlations were found between AAO and the fMRI activation in cerebellar anterior and posterior lobes, insula and temporal lobe. Our multimodal neuroimaging protocol suggests that MRI is a useful tool to document the extension of the neurological impairment in FRDA.
Introduction
Friedreich's ataxia (FRDA) is an autosomal recessive progressive hereditary neurodegenerative disorder caused by a GAA repeat expansion in the first intron of the FXN gene on chromosome 9 (1). The prevalence in the Caucasian populations is 2–5:100.000 (2). FRDA is characterized by early onset and progressive deterioration of the motor and sensory functions, scoliosis, cardiomyopathy, and eventually nystagmus (3, 4). Age at onset (AAO), clinical progression and severity are not uniform across patients, but variably correlate with the short-allele expansion size (5). Magnetic Resonance Imaging (MRI) studies have provided several insights over the damage in cerebellar, cerebral, and spinal cord areas involved in FRDA.
Cerebral, cerebellar, and spinal cord involvement in FRDA has been documented and established with different MRI-based techniques. Volumetric MRI studies have shown widespread involvement of white (WM) and gray matter (GM). Atrophy has been documented in the infratentorial compartment at the level of dentate nuclei (DN) (6), peridentate WM (7), posterior cerebellar lobules, vermian cortex, as well as in the dorsal medulla (7–10) and in supratentorial GM areas (6, 8, 9). Diffusion Tensor Imaging (DTI) studies further characterized structural changes in WM revealing alterations in the cerebellar peduncles (6, 11–16) and in the cerebellum (11, 13). Alterations in the corticospinal tracts (CST) were observed at the level of subcortical pre-central WM, posterior limb of internal capsule (PLIC) (11) and in the brainstem (6, 11, 13, 15). Furthermore, other DTI based studies have reported alterations of the posterior thalamic radiations (14, 15, 17), optic radiations (18), and the long associative tracts (11, 14, 15).
Few functional MRI (fMRI) studies have been performed in FRDA, including either motor (19–23) or non-motor tasks (15, 24, 25). These studies reported overall significant differences of activation in the posterior cerebellar lobules (20, 22) and in the cortical motor and sensory areas (19–22).
The rationale behind the present work is the existence of a pattern of functional and structural alterations characterizing WM and GM in FRDA which correlates with specific clinical measures known as ataxia scales (26–28) routinely used to assess disease severity. Once identified, this pattern could be directly used for the implementation of longitudinal studies possibly overcoming some of the sensibility limitations recently demonstrated for the clinical scales (29, 30). For this reason, we designed a cross-sectional study of FRDA from a neuroimaging (Voxel-Based Morphometry, DTI, fMRI) and a clinical prospective in order to provide a composite overview of the CNS damage in FRDA versus healthy controls (HCs). In addition, we investigated the correlation between clinical functional scales and neuroimaging metrics.
Materials and Methods
Participants
We recruited a cohort of 21 patients with a molecularly confirmed diagnosis of FRDA at the research centers “Eugenio Medea” in Conegliano/Pieve di Soligo (TV, Italy) and Bosisio Parini (LC, Italy). The recruited patients were older than 12 years and had an early onset FRDA (under 25 years old). All participants, but three, were native Italians, mostly originating from Central and North Italy. Non-Italian patients came from Albania (n = 2) and Germany (n = 1). A group of 18 age and sex matched HCs was recruited for inter-group comparison following a detailed anamnestic interview and cognitive assessment. The demographic data of patients and controls are presented in Table 1.
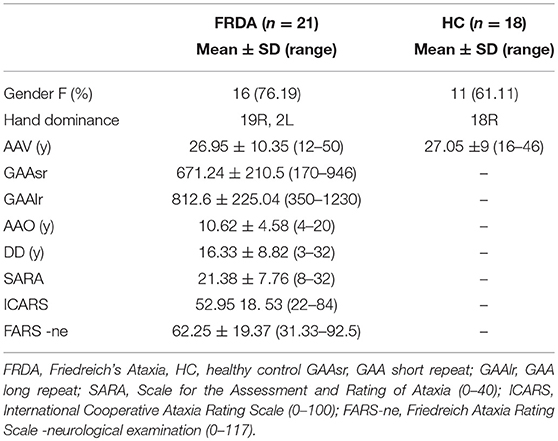
Table 1. Demographic and clinical data.
Ethic Committee Approval and Patients Consent
The study has been reviewed and approved by the Ethic Committee IRCCS E. Medea—Associazione La Nostra Famiglia—Bosisio Parini (LC) (Prot. No 051/11-CE) and all participants gave their written informed consent in accordance with the Declaration of Helsinki.
Clinical Measurement Tools
All patients underwent a complete clinical and neurological assessment. The Scale for the Assessment and Rating of Ataxias scale (SARA) (28), International Cooperative Ataxia Rating Scale (ICARS) (26), and the neurological section of the Friedreich Ataxia Rating Scale (FARS) (27) were implemented.
Patients and HCs underwent a cognitive assessment specific for 2 age groups: 12–16 and 16–50 years old. The cognitive functions of the subjects aged 12–16 years were assessed by using the Wechsler Intelligence Scale for Children III (WISC-III) (31). The group of adults and older adolescents in both FRDA and HCs were assessed by using the Wechsler Adult Intelligence Scale Revised (WAIS- R) (32).
Neuroimaging Protocol
FRDA and HCs underwent an MRI session with a 3T Philips Achieva Scanner (Philips Medical System, The Netherlands), equipped with a digital 32-channel head coil. The acquisition protocol included a T1-weighted (T1w) high resolution sequence (TE/TR = 3.5/8 ms, flip angle 8°, SENSE factor 2, voxel-size 1 × 1 × 1 mm3 matrix size 256 × 256 × 160), a multi-shell diffusion MRI acquisition (15 directions at b = 300 s/mm2, 53 directions at b = 1,100 s/mm2, 8 volumes at b = 0 s/mm2, TE/TR = 100/8,800 ms, SENSE factor 2, SPIR fat suppression, voxel size 2.2 × 2.2 × 2.2 mm3, matrix size 112 × 112 × 80), a T2-weighted (T2w) fat suppressed scan (for DTI processing purposes, TE/TR = 100/4,700 ms, SENSE factor 2, voxel-size 1.5 × 1.5 × 1.5 mm3, matrix size 160 × 146 × 110), and a fMRI sequence (FOV = 240 × 240 mm2, 40 slices interleaved without gap, voxel size 2.5 × 2.5 × 3.5 mm3, TE/TR = 20/2,000 ms, flip angle 85°, 178 time points).
fMRI Motor Task
The fMRI protocol included a standard block design finger tapping task involving both hands. Subjects were asked to press the buttons of an MRI-compatible response-device using all the fingers in sequence from the thumb to the little finger, always starting from the thumb. Blocks lasted 20 s for each hand with 16 s inter-stimulus interval. The fMRI task was paced according to the screen commands that were provided with a regular pattern. A drawing of the right or left hand with a caption (“right hand” or “left hand”) was projected on MR compatible goggles worn by the patients during the stimulus. A fixation point was projected in the inter-stimulus interval. Subjects were trained before the scan to familiarize with the projected instructions and with the hand device and to ensure comprehension of the task.
Gray Matter Analysis
Voxel-Based Morphometry (VBM) pipeline (33) was applied to T1w images to detect morphological differences in the volumes between patients compared to HCs. Data was pre-processed with the N4 tool of ANTs (34, 35) to remove intensity field inhomogeneity, then the FSL anatomical pipeline was applied (36–38) to remove the skull and perform tissue segmentation, finally obtaining the Partial Volume Estimate (PVE) map of GM. A population template of GM was built among all subjects (including patients) with ANTs (34, 39, 40), then the GM PVE of each subject was non-linearly moved to template space and multiplied by the determinant of the transformation Jacobian. Voxel-wise statistics were computed with a general linear model (GLM) using FSL (41), with age, sex, and intracranial volume (ICV) in native space as covariates. The critical value for null hypothesis rejection was set at 0.05 corrected for multiple comparisons and employing the TFCE technique (42).
White Matter Analysis
All the individual DTI data werepre-processed with Tortoise (43), taking advantage of the T2w acquisition to correct for motion and eddy current artifacts. With the same software the mono-exponential non-linear model was fitted on the data including all shells (44, 45) to compute the diffusion tensor and DTI derived measures to associated quantitative metrics, as fractional anisotropy (FA), axial diffusivity (AD), mean diffusivity (MD), and radial diffusivity (RD). Two study specific templates were built with DTI-TK (46, 47), one for HCs and one for patients. DTI-TK takes advantage of all the tensor elements to perform the registrations, delivering more accurate spatial alignments than tools based on intensity registration, especially in regions with complex fiber architecture such as the brainstem. The template of FRDA was non-linearly registered to the template of HCs, therefore then the transformations were concatenated to move the quantitative maps of FRDA subjects to the template space of HCs with a single interpolation. Statistical analysis were performed both at region of interest (ROI) and at voxel level. Voxel-wise statistics were performed for each DTI derived map with a general linear model (GLM) using age and sex as covariates, with the same approach previously described for VBM. To perform ROI level statistics, we moved the two JHU DTI-based WM atlas (48) to the common space. For each of the 43 regions defined in the atlas (see list in Table S1), we tested FA, MD, AD, and RD with a GLM comparing HCs and FRDA patients while accounting for age and sex as covariates. For the ROI level analysis, the critical threshold was set to 0.05 corrected with the Bonferroni method for multiple comparisons.
Functional MRI Analysis
Data were pre-processed using SPM12 (49) and ANTs. Functional volumes were realigned using a two-step realignment process (to the first volume of the sequence and then to the mean volume), then the mean volume was co-registered to the T2w anatomical volume to correct for EPI distortions (50). The T2w volume was rigidly aligned to the corresponding T1w anatomical volume after normalization to the MNI152 space. Finally, all the transformations were combined together to avoid further interpolation errors. The combined transformation was applied to normalize the functional sequence on the MNI space, with a final voxel size of 2 × 2 × 2 mm3. Before the single-subject analysis, a Gaussian spatial filter, with FWHM equal to 6 mm, was applied to the functional data to increase the Signal-to-Noise-Ratio (SNR) and to deal with the residual anatomical differences between subjects. Additionally, a high-pass temporal filter with cut-off frequency of 128 s was used to correct for slow signal drifts. The GLM approach was adopted for the single-subject analysis: the design matrix included one regressor for each condition of interest: rest, right (R) hand movement, left (L) hand movement and one regressor of no interest for each as nuance factors (movement parameters of the realignment process and outlier volumes). The ARtifact Detection Tool (ART) was employed to create regressors and detect outliers (51). A volume was defined as an outlier when its displacement from the reference volume was >2 mm or when its global mean Z-score was >5. After the estimation of the model was completed, we created a map for each effect we wanted to test. Contrast maps between the R and the L hand movement task (R>L and L>R) were computed to exclude confounding factors due to the non-motor component of the task (attention, visual stimulation). These maps were subsequently used as inputs for the following GLM group analysis. A one-sample t-test was performed among the two groups individually to verify which anatomical regions were involved in the task, then a two-sample t-test was performed to verify differences between groups. All the statistics were performed with SPM12 using a threshold p < 0.05 corrected for the False Discovery Rate (FDR) at voxel level.
Following the same rationale of statistical analysis performed on the DTI data, in the fMRI dataset we performed a ROI-based GLM correlation analysis of beta values, including the clinical variables as predictors. However, differently from the DTI dataset, the fMRI dataset included only 2 male subjects. For this reason, the sex of patients was not included as confounding factor. For the correlation analysis we used clusters of significant activations generated by R hand and L hand movement (contrasts “R Hand > L Hand” and “L Hand > R Hand) in the HC group. This approach guaranteed the independence of the ROI-selection step from the data used in the GLM correlation analysis. We found eight ROIs related to the movement of the R hand only, and seven ROIs related to the movement of the L hand only. Significance was set using a p < 0.05 corrected for the number of variables tested.
Statistical Analysis
Computed descriptive statistics mainly included mean values, modes and standard deviations of the variables. Inferential statistics on the clinical variables were performed with SPSS v24. Further statistical investigations were performed within the group of FRDA patients to assess the relation between diffusion metrics FA and MD and clinical covariates scoring disease severity. The considered covariates were the functional scales SARA, ICARS, and FARS, the short repeat triplet GAAsr and the age at onset (AAO). Thus, a battery of multi-variate GLMs was fit for each ROI, following a design scheme with intercept, age, sex, and one additional covariate at time. The significance p-value used to consider a covariate significant was set to 0.05 divided by the total number of considered covariates.
Results
Clinical Results
Twenty-one patients with a molecularly defined diagnosis of FRDA were examined. The mean age at the time of the clinical assessment (AAV) was 26.95 ± 10.35 years (range 12–50, mode 26 years) (Table 1). The mean disease duration (DD) was 16.33 ± 8.82 years (range 3–32). The gender ration was F/M: 16/5. Patients declared an AAO of about 10.62 ± 4.58 (range 4–20), with a bimodal distribution (10 and 11 years).
Twenty of the patients' cohort were homozygous for the GAA repeat expansion, and one presented a 170 GAA repeat expansion on one allele and a nonsense point mutation on the other (52). The mean GAA repeat expansion in the short-allele (GAAsr) was 671.24 ± 210.5 (range 170–946), while the long allele (GAAlr) counted for 812.6 ± 225.04 (range 350–1,230). The Spearman test correlations showed that GAAsr correlated negatively with the AAO (R2 = −0.692, p = 0.001) and positively with clinical severity scores SARA (R2 = 0.714, p = 0.000*) and ICARS (R2 = 0.690, p = 0.001). The DD correlated positively to all the clinical scales SARA (R2 = 0.529, p = 0.014), ICARS (R2 = 0.582, p = 0.006), and FARS-ne (R2 = 0.767, p = 0.016).
The clinical features of the patients at onset, and the involvement of the CNS, sensory and other systems derived from the neurological examination, the ataxia scales and other complementary assessments are shown in Table S2.
Neuroimaging Findings
Gray Matter Analysis
VBM showed a significant bilateral reduction of GM volume in lobule V, VI, VIII (L>R) and in the crus of cerebellum in FRDA patients compared to HCs. A significant volume reduction was observed also in the posterior lobe of the vermis, in both the flocculi and in the L tonsil (Figure 1). No differences between patients and controls were found in the supratentorial GM.
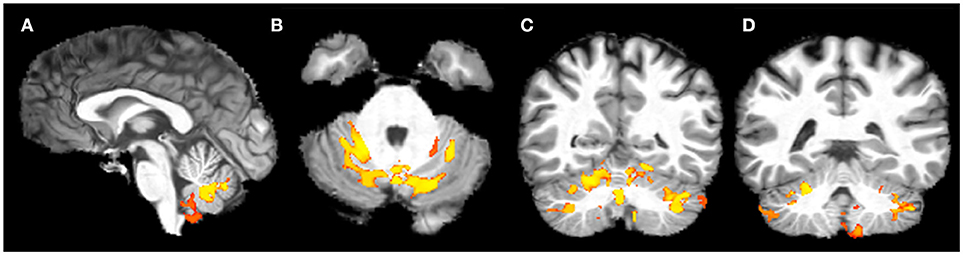
Figure 1. Voxel-based analysis of the Gray Matter reduction in FRDA patients compared to HCs. (A) Sagittal view, (B) Axial view, (C,D) Coronal view. FRDA, Freidreich's Ataxia; HCs, healthy controls. Results are overlaid on a subject from the cohort.
White Matter Analysis
Voxel-wise analysis of DTI derived maps showed a diffuse reduction of FA values in both infratentorial and supratentorial WM of FRDA patients (Figure 2). In particular FA reduction involved deep cerebellar WM, inferior (ICP), middle (MCP), and superior (SCP) cerebellar peduncles (including the decussation in the brainstem), CST both in the brainstem, in the PLIC and in the subcortical WM close to motor cortex, posterior thalamic radiations and optic radiation, and corpus callosum (CC). Optic tracts were also partially involved. The same areas showed increased MD, AD, and RD values in FRDA patients, with a more diffuse pattern for RD (Figure 3).
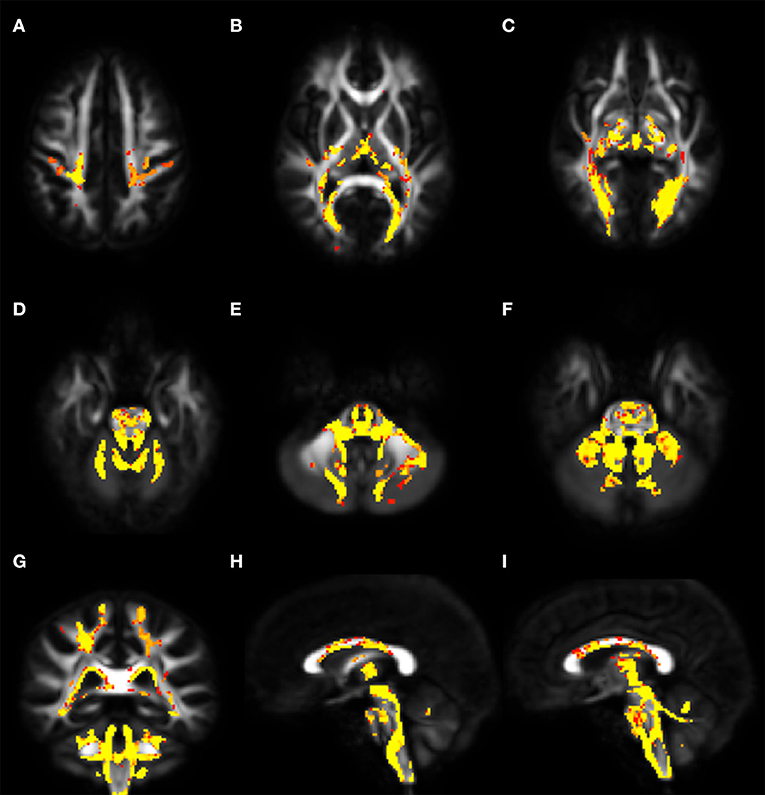
Figure 2. Voxel-wise analysis of White Matter in FRDA compared to HCs. The figure shows areas of FA reduction from the axial view (A–F), coronal view (G), and sagittal view (H,I). FRDA, Freidreich's Ataxia; HCs, healthy controls; FA, fractional anisotropy.
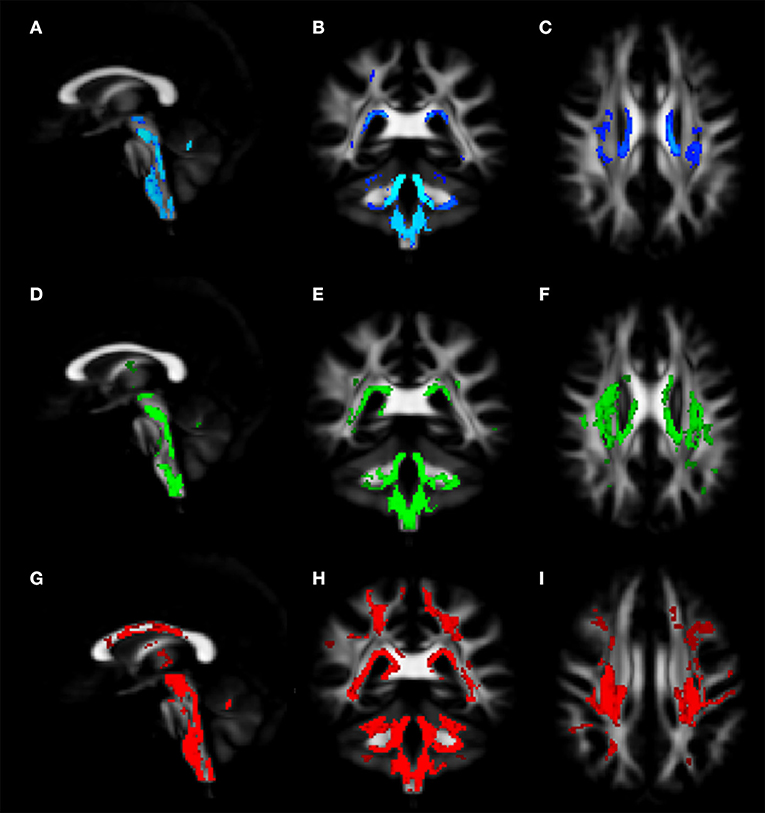
Figure 3. Voxel-wise analysis of White Matter in FRDA compared to HCs. The figure shows areas of MD increase (A–C), AD increase (D–F), and RD increase (G–I). The distribution of the DTI indexes has been shown in the sagittal view (A,D,G), coronal view (B,E,H), and axial view (C,F,I). FRDA, Freidreich's Ataxia; HCs, healthy controls; MD, mean diffusivity; AD, axial diffusivity; RD, radial diffusivity; DTI, Diffusion Tensor Imaging.
The ROI-based analysis showed similar results. Significant FA reductions in FRDA patients were found in ROIs representing CSTs, forceps major, CC, posterior thalamic radiations, SCP, MCP, and ICP. The same areas showed increased MD and RD values, while AD was increased only in MCP and SCP (Table 2).
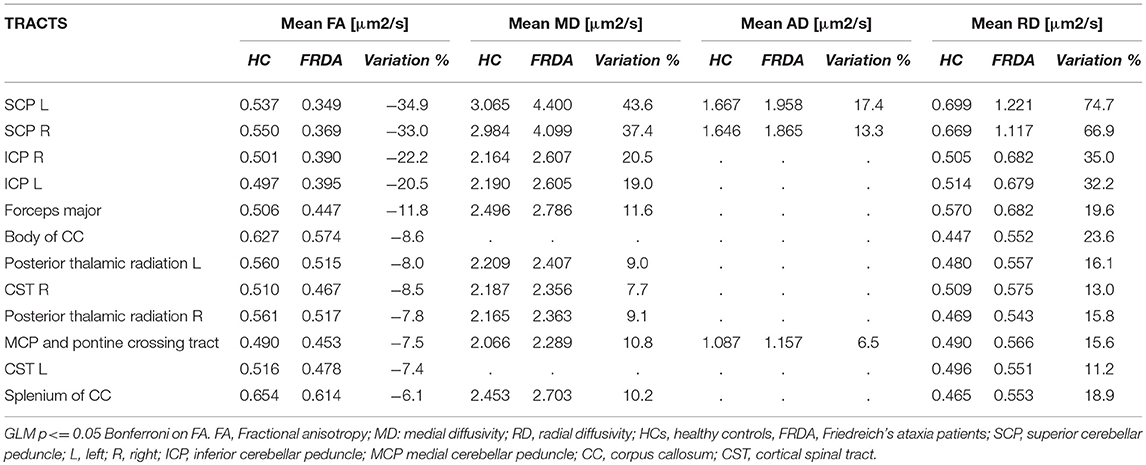
Table 2. DTI metrics distribution in the White Matter in FRDA and HCs and the intergroup variation.
No differences emerged at the level of association tracts like superior or inferior longitudinal fasciculi, uncinate fasciculi, or inferior fronto-occipital fasciculi.
The relative change of DTI-derived measures varied among significant tracts. The SCPs showed the most important alterations, with more than 30% FA reduction and more than 35, 13, and 65% increments in MD, AD, and RD values respectively (Table 2). The ICPs were the second most-affected tracts with a FA reduction around 20% and an increment of MD and RD of more than 18 and 32%, respectively.
Other significant tracts showed less severe modifications of DTI measurements.
WM and Clinical Data Correlation
Table 3 shows significant correlations between DTI-indexes (FA and MD) and clinical variables. Negative and positive correlations were found for FA and MD values. The AAO correlated with FA and MD in both supratentorial (thalamic radiations, CC, forceps, fornix, internal capsule) and infratentorial (ICP) tracts. Clinical scales and the number of GAA repetitions were negatively correlated with FA and positively correlated with MD in SCP, forceps, and fornix.
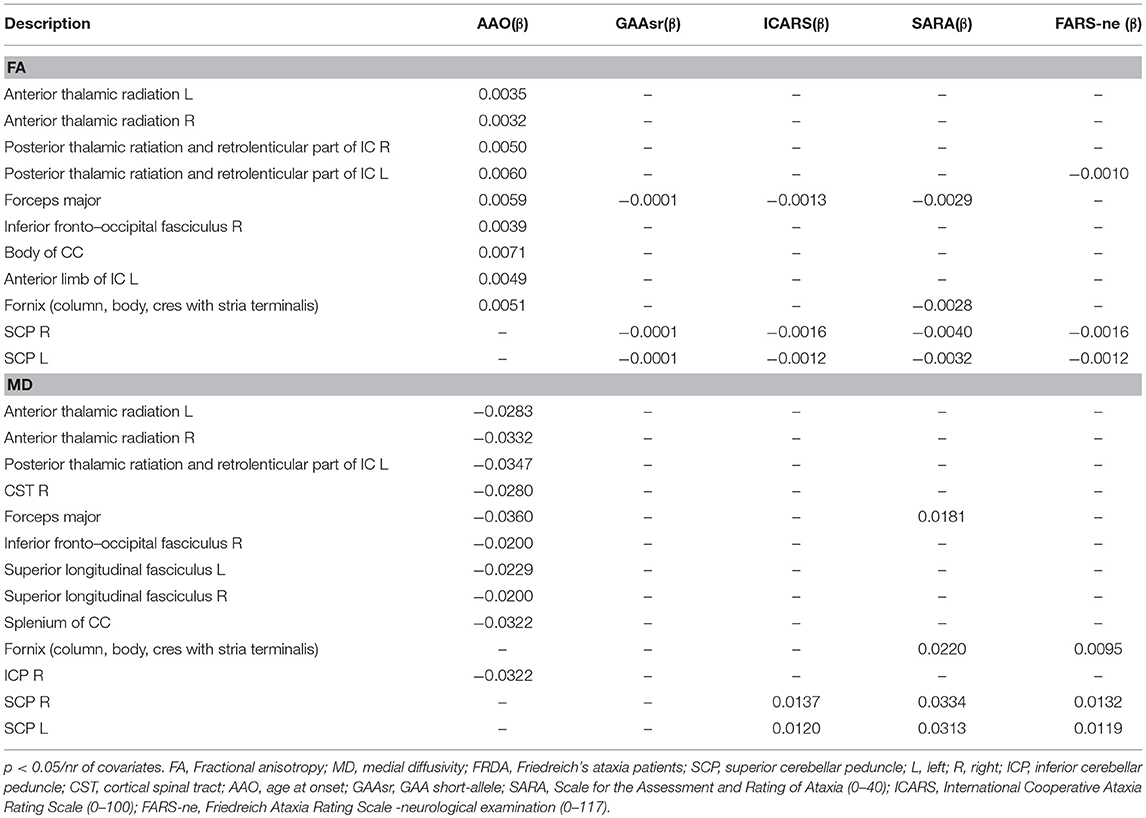
Table 3. Significant coefficients (β) of the GLM regression of DTI metrics with clinical covariates.
fMRI Analysis
Due to excessive motion artifacts and collaboration problems during the acquisition, 7 FRDA and 3 HCs were excluded from the following fMRI analysis. The FRDA group (n = 14) mean age was 27.6 ± 11.1 years (range 12.1–50.5) and gender ratio 12F/2M. The HCs (n = 15) group had a mean age 27.9 ± 9.8 years (range 15.9–45.7) and gender ratio 10F/5M. All the FRDA and HCs were R handed.
From intragroup analysis, in both FRDA and HCs, the multi-finger tapping task activated similar brain regions. In particular, while moving the R fingers (contrast R>L), significant activations were found in the L M1, L insula, and R superior cerebellar hemisphere (lobules V, VII, VIII). During the movement of L fingers (contrast L>R), activations involved R M1 cortex, R insula, and L superior cerebellar hemisphere (lobules V, VI, VIII) (Figure 4).
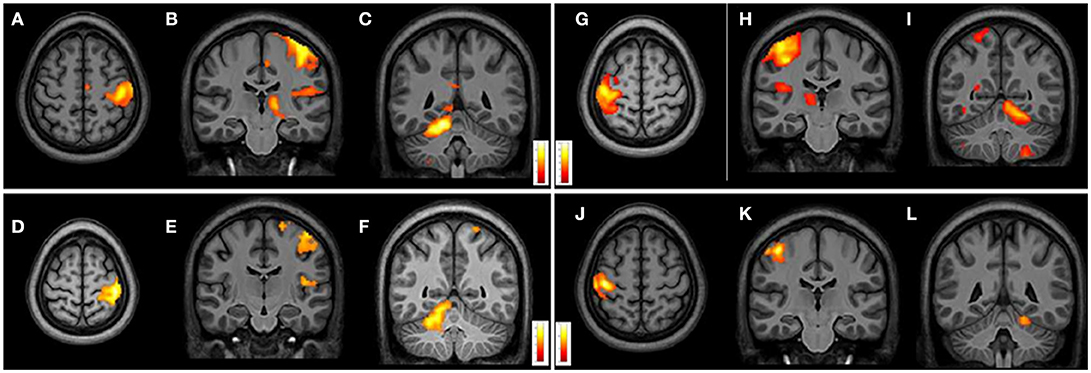
Figure 4. Cerebral and cerebellar fMRI intragroup analysis in FRDA and HCs showing similar areas of activation. Right-hand task (A–F) shows activated areas in transverse (A,D) and frontal views (B,C,E,F). Left-hand task (G–L) shows activated areas in axial (G,J) and coronal views (H–L). FRDA, Freidreich's Ataxia; HCs, healthy controls.
From intergroup analysis, significant differences emerged only during the movement of the non-dominant hand (left-hand), with HCs showing a stronger activation (cluster size k = 42 voxels, t > 5.174, p < 0.05 FDR corrected) in the L superior cerebellar hemisphere (Figure 5). No significant differences were found during the movement of the dominant hand.
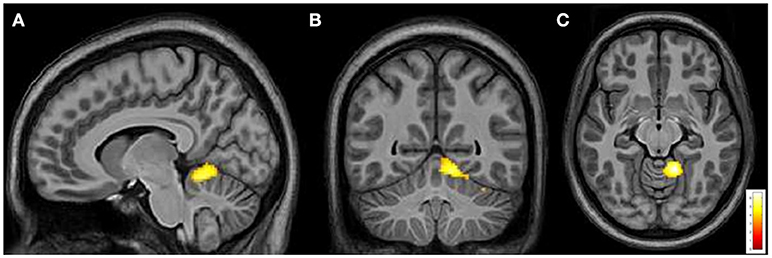
Figure 5. Cerebral and cerebellar fMRI intergroup analysis. Left-hand related activation differences between the FRDA and HCs. Higher activated areas are localized in the left superior cerebellar cortex: sagittal (A), coronal (B), and axial view (C). FRDA, Freidreich's Ataxia; HCs, healthy controls.
fMRI and Clinical Data Correlation
Table 4 shows the significant correlations between fMRI activation magnitude and the clinical parameters in the FRDA group. Significant positive correlations (p < 0.05/nr of variables) were found between AAO and activation in the cerebellar anterior lobe, insula, motor cortex, and temporal lobe. Negative correlations (p < 0.05) that did not survive to multiple comparisons correction, were found between disease severity measures (ICARS, SARA; FARS-ne), GAAsr and fMRI activation in the cerebellum, insula, and temporal lobes. Task-related cerebral activation generated more correlation during the R-hand task (dominant hand).
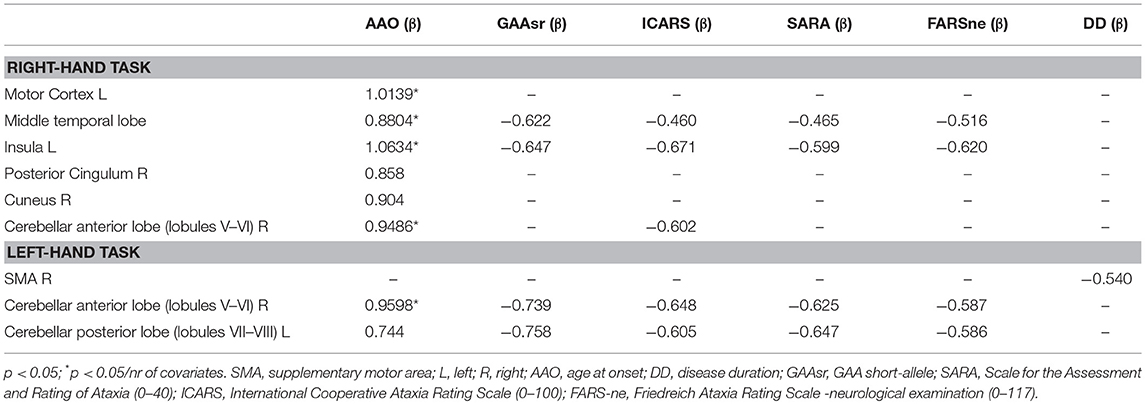
Table 4. Correlations between fMRI activation and clinical covariates.
Cognitive Assessment Results
Nineteen patients underwent the cognitive assessment (Table S3). The protocol was not administered to two patients, as they were non-Italian speakers. The mean level of education was 12.84 years (SD ± 2.87). The intelligence quotient (IQ) level was normal in 13 FRDA (68.41%), borderline in 4 FRDA and in the intellectual disability range in 2 subjects (10.52%). In 4 out of 6 FRDA patients with reduced IQ, the verbal performance was more strongly impaired. In 10 cases, FRDA patients showed a disharmonic profile, with better verbal component. The IQ level components fell into the normal range in all the HCs.
Considering the IQ level as index of cognitive functioning and using an intellectual disability cut off of total IQ < 70; we found only 2 patients with cognitive deficits. Due to the unbalanced samples of patients with vs. without cognitive deficits, we did not perform group comparison of DTI and fMRI indexes. We tested the occurrence of any correlation between the IQ values and the DTI and fMRI metrics, but did not find any significant correlation.
Discussion and Conclusions
Our study demonstrates the extent of CNS brain damage in FRDA by using a composite protocol of clinical and multimodal neuroimaging tools as VBM, DTI and fMRI in a cross-sectional study. Our findings support the need for future longitudinal studies and highlights the possibility that MRI studies could provide valuable paraclinical biomarkers in FRDA.
Voxel-Based Morphometry in the Gray Matter
By using the VBM technique we demonstrated infratentorial GM volume reduction, particularly in the lobules V, VI, VIII, crus of cerebellum, posterior lobe of vermis, flocculi bilaterally, and L tonsils. These results are consistent with previous studies (6, 8, 9, 15, 53) (Table S4). We did not find any supratentorial GM volume reduction or DN alteration. This is in line with reports of no cerebral atrophy in FRDA (11, 53), although opposite results have also been reported (6, 8, 15, 54).
Our findings support previous investigations reporting involvement of the anterior vermis and of the anterior cerebellar lobes (6, 11), otherwise known as the primary sensorimotor regions of the cerebellum.
Yet, we describe for the first time GM loss in FRDA in the lobule VIII, also known as the secondary sensorimotor cerebellum (55), in the flocculi bilaterally and in the left tonsil. This morphometric distribution of GM changes implies the involvement of both the cerebellar primary and secondary body maps in FRDA.
In addition, the GM reduction in the flocculi, in the lobules V–VI and in the dorsal vermis may provide the structural explanation for the eye movements impairments (Table S2) (56), as it was demonstrated in other neurodegenerative ataxias such as SCA6 (57) where the floccular atrophy was linked to gaze holding and pursuit impairment.
Microstructural Changes in the White Matter
Voxel-wise and ROI-based analysis of DTI metrics reported diffuse microstructural changes in infra- and supratentorial WM. These findings are in line with previous DTI reports of alterations in the cerebellar peduncles (6, 11–16) (Table S4) and of the supratentorial involvement in areas such as CC, forceps major, posterior thalamic radiations, optic tracts, and optic radiations (6, 14, 15, 18, 58, 59). In particular, we observed significantly different FA and MD values between FRDA and HCs in the CST, as consistently reported in the literature (6, 11, 13, 15).
The intergroup variation of the four DTI metrics pointed toward a primary involvement of the SCPs and, to a less extent, of the ICPs. The infra- and supratentorial FA and MD values correlated with AAO in FRDA. In addition, the disease severity scored with SARA and FARS showed a strong correlation with FA and MD values in SCP and forceps major. These findings support previous correlating DTI metrics and disease severity scores in areas as the cerebellar peduncles and the CC (6, 7, 13, 16). Although other studies denied such correlations, we presume that this difference was due to the different techniques employed and study samples (12, 14, 59, 60).
We did not observe any structural alteration in the associative tracts. Others have reported FA reduction in the inferior fronto-occipital fasciculus (11, 14, 15) and in the inferior longitudinal fasciculus (11, 15). However, the FRDA intragroup FA and MD values correlated with the AAO in the inferior fronto-occipital and superior longitudinal fasciculi, suggesting sensitivity of this measure to damage over time.
The relevance of the consistent variation of the different DTI-indexes, in particular localized in the cerebellar peduncles and forceps major is strongly supported by the correlation with the different disease severity measures and with AAO.
Motor Function Exploration
We observed similar areas of activation in both groups from the intragroup analysis of fMRI data with bi-manual finger tapping task. During the R-hand motor task (dominant hand in all the subjects) we observed significant activation in L M1, L insula, and the R superior cerebellar hemisphere (lobules V, VI, VIII). From the L-hand motor task, we observed significant activations of the R M1, R insula, and L superior cerebellar hemisphere (lobules V, VII, VIII). The areas activated in the cerebellum with R and L hand during the motor task were comparable to the areas found in other studies (20–23) (Table S4). Our intergroup analysis showed no significant differences during the dominant-hand task, differently from other studies that have reported either reduction of activation in M1, thalamus, DN, and lobule V (21, 22) or increase of activation in parietal cortex, striatum, supplementary motor area, and lobule VII (20–22) Interestingly, we found a significant difference during the non-dominant hand motor task with a stronger activation in the L superior cerebellar hemisphere in HCs when compared to FRDA. This difference was not previously described. One possible explanation is that while the dominant-hand is controlled by the dominant hemisphere, the non-dominant hand is controlled by both hemispheres (61, 62). The intergroup differences in our study might be explained by probable disruption in FRDA of the cerebellar circuitry involved in the primary somatosensory map in the cerebellum. In our study, we propose a bimanual device-mediated finger tapping task, while other studies have performed only dominant-hand motor tasks (19–22).
The correlation analysis demonstrates that the cerebral and cerebellar functionality can be related to clinical and genetic factors. Predominantly, the activation of the anterior cerebellum is directly correlated to AAO, GAAsr, and severity measures as reported elsewhere (4, 23).
Although the FRDA group had a lower IQ than HCs, the mean IQ level of both groups was within normal range, similarly to the results reported in Mantovan et al. (19). The lack of correlation between results of the neuropsychological assessment and either fMRI, VBM, or DTI data is not surprising since the finger tapping task was not constructed to explore cognitive relevant performances and the areas found impaired with VBM and DTI techniques are not primarily engaged in cognitive functions.
Our findings derive from a 3 Tesla scanner. This magnet strength was widely used in other studies (6, 8, 9, 15, 17, 20, 24, 25) (Table S4) and perhaps is sufficient to detect the CNS structural and functional damage in FRDA. Only two other works have tried a higher magnet field of 7 Tesla (22, 54) but their findings do not provide more insight.
Limitations in our study are the relatively small sample size, which impacts on the statistical strength of the study, the heterogeneity in disease severity of the recruited subjects and the lack of a longitudinal appraisal of both clinical and neuroimaging assessments. Few studies have recruited more patients, but the sample size was generally not remarkably different. The difficulty in recruitment of larger cohorts could be overcome by sharing common protocols in multiple centers and pooling the results. A step in this direction is already taking place with the ENIGMA network (http://enigma.ini.usc.edu/) which promotes neuroimaging data sharing for rare genetically determined diseases.
There have been few longitudinal studies in FRDA. Two longitudinal studies reported DTI changes as FA reduction in CC (6) and AD changes in CC splenium and WM deep subcortical parietal lobes after a follow-up period (59) with no macrostructural changes or atrophy. Two more longitudinal interventional studies have tried to investigate the effect of rhuEPO treatment in FRDA and showed increase in the GM volume in pulvinar and posterior parietal cortex (63) and WM bilateral increase in FA and increase in AD in cerebral hemispheres bilaterally (60). However, more longitudinal studies are needed in order to validate the cross-sectional study derived findings. This would lead to a better definition of the significance and of the temporal dynamics of the observed alterations. In such contexts, the neuroimaging study could provide the sensitive and objective biomarkers very much needed for the rapid and efficient clinical trial design and results evaluation.
In summary, we demonstrated infratentorial GM volume reduction suggesting an alternative sensorimotor cerebellar map involvement in FRDA with no supratentorial GM involvement. This finding shows the extension of cerebellar damage in FRDA.
The microstructural WM findings were consistent with the known areas of CNS damage and correlated with the clinical measures. The established correlation between DTI metrics and clinical variables as the AAO or the disease severity scores, should now be validated in larger cohorts and in longitudinal studies, which then could support the use of these measures as disease biomarkers in future studies. The non-dominant hand motor task differences between the FRDA and HCs gives hints on cerebral-cerebellar circuitry disruption in both hemispheres.
In conclusion, our multimodal imaging study provided convergent results, with a strong involvement of the cerebellar cortex, cerebellar WM tracts, in particular SCPs and ICPs and a strong functional involvement of the anterior lobe of the cerebellum during the non-dominant hand motor task. These findings bring a new dimensional role of the cortical circuitry involved in FRDA.
Authors Note
Paper previously presented by MV in part as a scientific poster at the 1st Congress of the European Academy of Neurology, June 20–23, 2015, Berlin, Germany.
The raw data supporting the conclusions of this manuscript will be made available by the authors, without undue reservation, to any qualified researcher.
Author Contributions
MV provided the design of the study, supervision, collected and analyzed the data, and prepared the manuscript. FA provided the design of the study and analyzed the data. AN and AD analyzed the data. SP provided the data and analyzed the data. EP, GP, MD, EB, ER, MF, and PC provided the data. AM provided the design of the study, supervision, and financial support. All authors revised the manuscript for important intellectual content, provided approval for publication and agree to be accountable for all aspects of the work.
Conflict of Interest Statement
The authors declare that the research was conducted in the absence of any commercial or financial relationships that could be construed as a potential conflict of interest.
Acknowledgments
We are very grateful to patients who participated in this study and their families. We thank the MRI technicians Giancarlo Lembo, Luca Brenz, and the nurse Lucia for technical assistance during the acquisition of the MRI scans.
This work was supported by the Italian National Institutes of Health [Grant Ricerca Corrente 2011] and by Ogni Giorno per Emma ONLUS Association.
Supplementary Material
The Supplementary Material for this article can be found online at: https://www.frontiersin.org/articles/10.3389/fneur.2018.00747/full#supplementary-material
References
1. Campuzano V, Montermini L, Moltò MD, Pianese L, Cossée M, Cavalcanti F, et al. Friedreich's ataxia: autosomal recessive disease caused by an intronic GAA triplet repeat expansion. Science (1996) 271:1423–7. doi: 10.1126/science.271.5254.1423
2. Vankan P. Prevalence gradients of Friedreich's ataxia and R1b haplotype in Europe co-localize, suggesting a common Palaeolithic origin in the Franco-Cantabrian ice age refuge. J Neurochem. (2013) 126(Suppl. 1):11–20. doi: 10.1111/jnc.12215
3. Harding AE. Friedreich's ataxia: a clinical and genetic study of 90 families with an analysis of early diagnostic criteria and intrafamilial clustering of clinical features. Brain (1981) 104:589–620. doi: 10.1093/brain/104.3.589
4. Harding AE. Classification of the hereditary ataxias and paraplegias. Lancet (1983) 21:1151–5. doi: 10.1016/S0140-6736(83)92879-9
5. Montermini L, Richter A, Morgan K, Justice CM, Julien D, Castellotti B, et al. Phenotypic variability in Friedreich ataxia: role of the associated GAA triplet repeat expansion. Ann Neurol. (1997) 41:675–82. doi: 10.1002/ana.410410518
6. Rezende TJ, Silva CB, Yassuda CL, Campos BM, D'Abreu A, Cendes F, et al. Longitudinal magnetic resonance imaging study shows progressive pyramidal and callosal damage in Friedreich's ataxia. Mov Disord. (2016) 31:70–8. doi: 10.1002/mds.26436
7. Della Nave R, Ginestroni A, Tessa C, Salvatore E, Bartolomei I, Salvi F, et al. Brain white matter tracts degeneration in Friedreich ataxia. An in vivo MRI study using tract-based spatial statistics and voxel-based morphometry. Neuroimage (2008) 40:19–25. doi: 10.1016/j.neuroimage.2007.11.050
8. Bonilha da Silva C, Bergo FP, D'Abreu A, Cendes F, Lopes-Cendes I, França MC, et al. Dentate nuclei T2 relaxometry is a reliable neuroimaging marker in Friedreich's ataxia. Eur J Neurol. (2014) 21:1131–6. doi: 10.1111/ene.12448
9. Selvadurai LP, Harding IH, Corben LA, Stagnitti MR, Storey E, Egan GF, et al. Cerebral and cerebellar grey matter atrophy in Friedreich ataxia: the IMAGE-FRDA study. J Neurol. (2016) 263:2215–23. doi: 10.1007/s00415-016-8252-7
10. Dogan I, Romanzetti S, Didszun C, Mirzazade S, Timmann D, Saft C, et al. Structural characteristics of the central nervous system in Friedreich ataxia: an in vivo spinal cord and brain MRI study. J Neurol Neurosurg Psychiatry (2018). doi: 10.1136/jnnp-2018-318422. [Epub ahead of print].
11. Della Nave R, Ginestroni A, Giannelli M, Tessa C, Salvatore E, Salvi F, et al. Brain structural damage in Friedreich's ataxia. J Neurol Neurosurg Psychiatry (2008) 79:82–5. doi: 10.1136/jnnp.2007.124297
12. Della Nave R, Ginestroni A, Diciotti S, Salvatore E, Soricelli A, Mascalchi M. Axial diffusivity is increased in the degenerating superior cerebellar peduncles of Friedreich's ataxia. Neuroradiology (2011) 53:367–72. doi: 10.1007/s00234-010-0807-1
13. Rizzo G, Tonon C, Valentino ML, Manners D, Fortuna F, Gellera C, et al. Brain diffusion-weighted imaging in Friedreich's ataxia. Mov Disord. (2011) 26:705–12. doi: 10.1002/mds.23518
14. Vieira Karuta SC, Raskin S, de Carvalho Neto A, Gasparetto EL, Doring T, Teive HA. Diffusion tensor imaging and tract-based spatial statistics analysis in Friedreich's ataxia patients. Parkinsonism Relat Disord. (2015) 21:504–8. doi: 10.1016/j.parkreldis.2015.02.021
15. Dogan I, Tinnemann E, Romanzetti S, Mirzazade S, Costa AS, Werner CJ, et al. Cognition in Friedreich's ataxia: a behavioral and multimodal imaging study. Ann Clin Transl Neurol. (2016) 3:572–87. doi: 10.1002/acn3.315
16. Clemm von Hohenberg C, Schocke MF, Wigand MC, Nachbauer W, Guttmann CR, Kubicki M, et al. Radial diffusivity in the cerebellar peduncles correlates with clinical severity in Friedreich ataxia. Neurol Sci. (2013) 34:1459–62. doi: 10.1007/s10072-013-1402-0
17. Akhlaghi H, Corben L, Georgiou-Karistianis N, Bradshaw J, Storey E, Delatycki MB, et al. Superior cerebellar peduncle atrophy in Friedreich's ataxia correlates with disease symptoms. Cerebellum (2011) 10:81–7. doi: 10.1007/s12311-010-0232-3
18. Fortuna F, Barboni P, Liguori R, Valentino ML, Savini G, Gellera C, et al. Visual system involvement in patients with Friedreich's ataxia. Brain (2009) 132:116–23. doi: 10.1093/brain/awn269
19. Mantovan MC, Martinuzzi A, Squarzanti F, Bolla A, Silvestri I, Liessi G, et al. Exploring mental status in Friedreich's ataxia: a combined neuropsychological, behavioral and neuroimaging study. Eur J Neurol. (2006) 13:827–35. doi: 10.1111/j.1468-1331.2006.01363.x
20. Akhlaghi H, Corben L, Georgiou-Karistianis N, Bradshaw J, Delatycki MB, Storey E, et al. (2012). A functional MRI study of motor dysfunction in Friedreich's ataxia. Brain Res. 1471:138–54. doi: 10.1016/j.brainres.2012.06.035
21. Ginestroni A, Diciotti S, Cecchi P, Pesaresi I, Tessa C, Giannelli M, et al. Neurodegeneration in friedreich's ataxia is associated with a mixed activation pattern of the brain. A fMRI study. Hum Brain Mapp. (2012) 33:1780–91. doi: 10.1002/hbm.21319
22. Stefanescu MR, Dohnalek M, Maderwald S, Thürling M, Minnerop M, Beck A, et al. Structural and functional MRI abnormalities of cerebellar cortex and nuclei in SCA3, SCA6 and Friedreich's ataxia. Brain (2015) 138:1182–97. doi: 10.1093/brain/awv064
23. Harding IH, Corben LA, Delatycki MB, Stagnitti MR, Storey E, Egan GF, et al. Cerebral compensation during motor function in Friedreich ataxia: The IMAGE-FRDA study. Mov Disord. (2017) 32:1221–9. doi: 10.1002/mds.27023
24. Georgiou-Karistianis N, Akhlaghi H, Corben LA, Delatycki MB, Storey E, Bradshaw JL, et al. Decreased functional brain activation in Friedreich ataxia using the Simon effect task. Brain Cogn. (2012) 79:200–8. doi: 10.1016/j.bandc.2012.02.011
25. Harding IH, Corben LA, Storey E, Egan GF, Stagnitti MR, Poudel GR, et al. Fronto-cerebellar dysfunction and dysconnectivity underlying cognition in friedreich ataxia: The IMAGE-FRDA study. Hum Brain Mapp. (2016) 37:338–50. doi: 10.1002/hbm.23034
26. Trouillas P, Takayanagi T, Hallett M, Currier RD, Subramony SH, Wessel K, et al. International Cooperative Ataxia Rating Scale for pharmacological assessment of the cerebellar syndrome. The Ataxia Neuropharmacology Committee of the World Federation of Neurology. J Neurol Sci. (1997) 145:205–11. doi: 10.1016/S0022-510X(96)00231-6
27. Subramony SH, May W, Lynch D, Gomez C, Fischbeck K, Hallett M, et al. Measuring Friedreich ataxia: Interrater reliability of a neurologic rating scale. Neurology (2005) 64:1261–2. doi: 10.1212/01.WNL.0000156802.15466.79
28. Schmitz-Hübsch T, du Montcel ST, Baliko L, Berciano J, Boesch S, Depondt C, et al. Scale for the assessment and rating of ataxia: development of a new clinical scale. Neurology (2006) 66:1717–20. doi: 10.1212/01.wnl.0000219042.60538.92
29. Patel M, Isaacs CJ, Seyer L, Brigatti K, Gelbard S, Strawser C, et al. Progression of Friedreich ataxia: quantitative characterization over 5 years. Ann Clin Transl Neurol. (2016) 3:684–94. doi: 10.1002/acn3.332
30. Reetz K, Dogan I, Hilgers RD, Giunti P, Mariotti C, Durr A, et al. Progression characteristics of the European Friedreich's Ataxia Consortium for Translational Studies (EFACTS), a 2 year cohort study. Lancet Neurol. (2016) 15:1346–54. doi: 10.1016/S1474-4422(16)30287-3
32. Wechsler D. Wechsler Adult Intelligence Scale—3rd ed. San Antonio, TX: The Psychological Corporation (1997).
33. Ashburner J, Friston KJ. Voxel-based morphometry-the methods. NeuroImage (2000) 11:805–21. doi: 10.1006/nimg.2000.0582
34. Avants B, Gee JC. Geodesic estimation for large deformation anatomical shape averaging and interpolation. Neuroimage (2004) 23(Suppl. 1):S139–50. doi: 10.1016/j.neuroimage.2004.07.010
35. Tustison NJ, Avants BB, Cook PA, Zheng Y, Egan A, Yushkevich PA, et al. N4ITK: improved N3 bias correction. IEEE Trans Med Imaging (2010) 29:1310–20. doi: 10.1109/TMI.2010.2046908
36. Zhang Y, Brady M, Smith S. Segmentation of brain MR images through a hidden Markov random field model and the expectation-maximization algorithm. IEEE Trans Med Imaging (2001) 20:45–57. doi: 10.1109/42.906424
37. Smith SM. Fast robust automated brain extraction. Hum Brain Mapp. (2002) 17:143–55. doi: 10.1002/hbm.10062
38. Jenkinson M, Beckmann CF, Behrens TEJ, Woolrich MW, Smith SM. FSL. NeuroImage (2012) 62:782–90. doi: 10.1016/j.neuroimage.2011.09.015
39. Avants BB, Epstein CL, Grossman M, Gee JC. Symmetric diffeomorphic image registration with cross-correlation: evaluating automated labeling of elderly and neurodegenerative brain. Med Image Anal. (2008) 12:26–41. doi: 10.1016/j.media.2007.06.004
40. Avants BB, Tustison NJ, Stauffer M, Song G, Wu B, Gee JC. The Insight ToolKit image registration framework. Front Neuroinformatics (2014) 8:44. doi: 10.3389/fninf.2014.00044
41. Winkler AM, Ridgway GR, Webster MA, Smith SM, Nichols TE. Permutation inference for the general linear model. NeuroImage (2014) 92:381–97. doi: 10.1016/j.neuroimage.2014.01.060
42. Smith SM, Nichols TE. Threshold-free cluster enhancement: addressing problems of smoothing, threshold dependence and localisation in cluster inference. NeuroImage (2009) 44:83–98. doi: 10.1016/j.neuroimage.2008.03.061
43. Pierpaoli C, Walker L, Irfanoglu MO, Barnett A, Basser P, Chang LC, et al. TORTOISE: an integrated software package for processing of diffusion MRI data. ISMRM 18th Annual Meeting. Stockholm (2010).
44. Basser PJ, Pierpaoli C. Microstructural and physiological features of tissues elucidated by quantitative-diffusion-tensor MRI. J Mag Reson Series B (1996) 111:209–19. doi: 10.1006/jmrb.1996.0086
45. Koay CG, Chang LC, Carew JD, Pierpaoli C, Basser PJ. A unifying theoretical and algorithmic framework for least squares methods of estimation in diffusion tensor imaging. J Magn Reson. (2006) 182:115–25. doi: 10.1016/j.jmr.2006.06.020
46. Zhang H, Avants BB, Yushkevich PA, Woo JH, Wang S, McCluskey LF, et al. High-dimensional spatial normalization of diffusion tensor images improves the detection of white matter differences: an example study using amyotrophic lateral sclerosis. IEEE Trans Med Imaging (2007) 26:1585–97. doi: 10.1109/TMI.2007.906784
47. Zhang H, Yushkevich PA, Rueckert D, Gee JC. Unbiased white matter atlas construction using diffusion Tensor Images. Medical Image Computing and Computer-Assisted Intervention : MICCAI International Conference on Medical Image Computing and Computer-Assisted Intervention (2007). Available online at: http://www.ncbi.nlm.nih.gov/pubmed/18044571
48. Mori S, Wakana S, van Zijl PCM, Nagae-Poetscher LM. MRI Atlas of Human White Matter. Elsevier Science. (2005). Available online at: http://books.google.ca/books?id=ltwRYlvFNLIC
49. Friston KJ, Ashburner J, Kiebel S, Nichols T, Penny WD. Statistical Parametric Mapping: The Analysis of Functional Brain Images. Amsterdam: Elsevier/Academic Press (2007).
50. Nordio A, Peruzzo D, Arrigoni F, Triulzi F, Bertoldo A. Use of T2-Weighted 3D Acquisition for Correction of EPI-Induced Distortion in FMRI. Proceedings of the 24th Annual Meeting of the International Society for Magnetic Resonance in Medicine (Singapore) (2016).
51. Mazaika PK, Whitfield S, Cooper JC. Detection and Repair of Transient Artifacts in fMRI Data. Paper Presented at the Meeting of the Society for Human Brain Mapping (Toronto, ON) (2005).
52. Gellera C, Castellotti B, Mariotti C, Mineri R, Seveso V, Didonato S, et al. Frataxin gene point mutations in Italian Friedreich ataxia patients. Neurogenetics (2007) 8:289–99. doi: 10.1007/s10048-007-0101-5
53. França MC Jr, D'Abreu A, Yasuda CL, Bonadia LC, Santos da Silva M, Nucci A, et al. A combined voxel-based morphometry and 1H-MRS study in patients with Friedreich's ataxia. J Neurol. (2009) 256:1114–20. doi: 10.1007/s00415-009-5079-5
54. Solbach K, Kraff O, Minnerop M, Beck A, Schöls L, Gizewski ER, et al. Cerebellar pathology in Friedreich's ataxia: atrophied dentate nuclei with normal iron content. Neuroimage Clin. (2014) 6:93–9. doi: 10.1016/j.nicl.2014.08.018
55. Stoodley CJ, Schmahmann JD. Functional Topography of the Human Cerebellum. In: Gruol DL, Koibuchi N, Manto M, Molinari J, Schmahmann D, Shen Y, editors. Essentials of Cerebellum and Cerebellar Disorders: A Primer For Graduate Students. Springer (2016). doi: 10.1007/978-3-319-24551-5
56. Kheradmand A, Zee DS. Cerebellum and ocular motor control. Front Neurol. (2011) 2:53. doi: 10.3389/fneur.2011.00053
57. Ying SH, Choi SI, Lee M, Perlman SL, Baloh RW, Toga AW, et al. Relative atrophy of the flocculus and ocular motor dysfunction in SCA2 and SCA6. Ann N Y Acad Sci. (2005) 1039:430–5. doi: 10.1196/annals.1325.040
58. Akhlaghi H, Yu J, Corben L, Georgiou-Karistianis N, Bradshaw JL, Storey E, et al. Cognitive deficits in Friedreich ataxia correlate with micro-structural changes in dentatorubral tract. Cerebellum (2014) 13:187–98. doi: 10.1007/s12311-013-0525-4
59. Mascalchi M, Toschi N, Giannelli M, Ginestroni A, Della Nave R, Tessa C, et al. Regional cerebral disease progression in Friedreich's Ataxia: a longitudinal diffusion tensor imaging study. J Neuroimaging (2016) 26:197–200. doi: 10.1111/jon.12270
60. Egger K, Clemm von Hohenberg C, Schocke MF, Guttmann CR, Wassermann D, Wigand MC, et al. White matter changes in patients with friedreich ataxia after treatment with erythropoietin. J Neuroimaging (2014) 24:504–8. doi: 10.1111/jon.12050
61. Baraldi P, Porro CA, Serafini M, Pagnoni G, Murari C, Corazza R, et al. Bilateral representation of sequential finger movements in human cortical areas. Neurosci Lett. (2005) 269:95–8. doi: 10.1016/S0304-3940(99)00433-4
62. Gut M, Urbanik A, Forsberg L, Binder M, Rymarczyk K, Sobiecka B, et al. Brain correlates of right-handedness. Acta Neurobiol Exp. (2007) 67:43–51.
Keywords: Friedreich's ataxia, neuroimaging, diffusion tensor imaging, fMRI, biomarkers, disease severity measures
Citation: Vavla M, Arrigoni F, Nordio A, De Luca A, Pizzighello S, Petacchi E, Paparella G, D'Angelo MG, Brighina E, Russo E, Fantin M, Colombo P and Martinuzzi A (2018) Functional and Structural Brain Damage in Friedreich's Ataxia. Front. Neurol. 9:747. doi: 10.3389/fneur.2018.00747
Received: 18 May 2018; Accepted: 17 August 2018;
Published: 06 September 2018.
Edited by:
Kathrin Reetz, RWTH Aachen Universität, GermanyReviewed by:
Laura Canafoglia, Istituto Neurologico Carlo Besta (IRCCS), ItalyJordi A. Matias-Guiu, Hospital Clínico San Carlos, Spain
Copyright © 2018 Vavla, Arrigoni, Nordio, De Luca, Pizzighello, Petacchi, Paparella, D'Angelo, Brighina, Russo, Fantin, Colombo and Martinuzzi. This is an open-access article distributed under the terms of the Creative Commons Attribution License (CC BY). The use, distribution or reproduction in other forums is permitted, provided the original author(s) and the copyright owner(s) are credited and that the original publication in this journal is cited, in accordance with accepted academic practice. No use, distribution or reproduction is permitted which does not comply with these terms.
*Correspondence: Marinela Vavla, bWFyaW5lbGEudmF2bGFAbGFub3N0cmFmYW1pZ2xpYS5pdA==
†Present Address: Alberto De Luca, Image Sciences Institute, University Medical Center Utrecht, Utrecht, Netherlands