 Pengjing Xu
 Luis A. Lesmes
 Deyue Yu
 Zhong-Lin Lu
- 1College of Optometry, The Ohio State University, Columbus, OH, United States
- 2Adaptive Sensory Technology, Inc., San Diego, CA, United States
- 3Division of Arts and Sciences, NYU Shanghai, Shanghai, China
- 4Center for Neural Science and Department of Psychology, New York University, New York, NY, United States
- 5NYU-ECNU Institute of Brain and Cognitive Science at NYU Shanghai, Shanghai, China
Current clinical evaluation, which focuses on central vision, could be improved through characterization of residual vision with peripheral testing of visual acuity, contrast sensitivity, color vision, crowding, and reading speed. Assessing visual functions in addition to light sensitivity, a comprehensive visual field map (VFM) would be valuable for detecting and managing eye diseases. In a previous study, we developed a Bayesian adaptive qVFM method that combines a global module for preliminary assessment of the VFM's shape and a local module for assessment at individual retinal locations. The method was validated in measuring the light sensitivity VFM. In this study, we extended the qVFM method to measure contrast sensitivity across the visual field. In both simulations and psychophysics, we sampled 64 visual field locations (48 x 48 deg) and compared the qVFM method with a procedure that tested each retinal location independently (qFC; Lesmes et al., 2015). In each trial, subjects were required to identify a single optotype (size: 2.5 x 2.5 deg), one of 10 filtered Sloan letters. To compare the accuracy and precision of the two methods, three simulated eyes were tested in 1,280 trials with each method. In addition, data were collected from 10 eyes (5 OS, 5 OD) of five normal observers. For simulations, the average RMSE of the estimated contrast sensitivity with the qVFM and qFC methods were 0.057 and 0.100 after 320 trials, and 0.037 and 0.041 after 1,280 trials [all in log10 units, represent as log(sensitivity)], respectively. The average SD of the qVFM and qFC estimates were 0.054 and 0.096 after 320 trials, and 0.032 and 0.041 after 1,280 trials, respectively. The within-run variability (68.2% HWCIs) were comparable to the cross-run variability (SD). In the psychophysics experiment, the average HWCI of the estimated contrast sensitivity from the qVFM and qFC methods across the visual field decreased from 0.33 on the first trial to 0.072 and 0.16 after 160, and to 0.060 and 0.10 after 320 trials. The RMSE between the qVFM and qFC estimates started at 0.26, decreased to 0.12 after 160 and to 0.11 after 320 qVFM trials. The qVFM provides an accurate, precise, and efficient mapping of contrast sensitivity across the entire visual field. The method might find potential clinical applications in monitoring vision loss, evaluating therapeutic interventions, and developing effective rehabilitation for visual diseases.
Introduction
A comprehensive characterization of peripheral vision with assessment of the Visual Filed Map (VFM) is crucial for monitoring the status of vision loss, for developing and providing effective rehabilitation interventions (Sunness et al., 1995; Fletcher and Schuchard, 1997; Markowitz and Muller, 2004), and for obtaining projections of potential benefits from interventions (Massof and Rubin, 2001; Strasburger et al., 2011).
As a part of the clinical ophthalmic diagnostic procedure, the VFM of light sensitivity is assessed by the majority of eye care practitioners, mostly using the standard automated perimetry (SAP) (Dreyer, 1993; Johnson et al., 2011). Assessment of the VFM of many other visual functions, such as contrast sensitivity (Daitch and Green, 1969; Swanson et al., 2014), visual acuity (VA, 1965; Thompson et al., 1982), color vision (Carlow et al., 1976; Hart et al., 1984; Sample and Weinreb, 1990, 1992), reading speed (Ramulu et al., 2009; Yu et al., 2010), and crowding (Balas et al., 2009; Levi and Carney, 2009), is difficult and rarely used in the clinic. In fact, results from the standard automated perimetry (SAP) are noisy (Stewart and Hunt, 1993; Keltner et al., 2000). Precise and accurate VFM assessments of visual functions are time consuming with existing methods (Artes et al., 2002; Weinreb and Kaufman, 2009, 2011). A number of new perimetric methods have been developed and could potentially provide helpful clinical information, but have not sufficiently validated for routine clinical use (Johnson et al., 2011; Strasburger et al., 2011; Keltgen and Swanson, 2012; Swanson et al., 2014).
In a previous study, we developed a novel Bayesian adaptive testing method, the qVFM method, that combines a global module for preliminary assessment of the VFM's shape and a local module for assessing individual visual field locations to provide an efficient and precise assessment of the VFM (Xu et al., 2019). In its first implementation, we applied the qVFM method to assess the light sensitivity visual field map with a Yes/No paradigm. Computer simulations and a psychophysical validation study both showed that the qVFM method could provide an accurate, precise and efficient assessment of light sensitivity VFM.
In this study, we implemented the qVFM method in a 10-alternative forced-choice (10AFC) letter identification paradigm to measure contrast sensitivity (CS) across the visual field to provide an assessment of the contrast sensitivity visual field map.
As a clinical measure, contrast sensitivity predicts functional vision better than many other visual diagnostics (Comerford, 1983; Jindra and Zemon, 1989; Ginsburg, 2003; Faye, 2005). Deficits in contrast sensitivity accompany many visual diseases, including amblyopia (Hess and Howell, 1977; Bradley and Freeman, 1981; Kiorpes et al., 1999; Xu et al., 2006; Qiu et al., 2007), glaucoma (Ross et al., 1984; Stamper, 1984; Hot et al., 2008), optic neuritis (Zimmern et al., 1979; Trobe et al., 1996), diabetic retinopathy (Della Sala et al., 1985; Sokol et al., 1985), Parkinson's disease (Bulens et al., 1986; Bodis-Wollner et al., 1987; Mestre et al., 1990), and multiple sclerosis (Regan et al., 1981, 1982; Hess and Plant, 1985; Travis and Thompson, 1989; Regan and Hamstra, 1991). Such deficits are evident even when acuity and/or light sensitivity perimetry tests appear normal (Jindra and Zemon, 1989; Woods and Wood, 1995). Contrast sensitivity is also an important outcome measure of refractive and cataract surgery (Ginsburg, 1987, 2006; Applegate et al., 1998, 2000; McLeod, 2001; Bellucci et al., 2005), and potential rehabilitation programs for macular degeneration (Loshin and White, 1984), myopia (Tan and Fong, 2008), and amblyopia (Polat et al., 2004; Li et al., 2005, 2009; Zhou et al., 2006; Huang et al., 2008). On the other hand, although the literature has documented the importance of contrast sensitivity test, the current in-clinic contrast sensitivity exams mostly consist of contrast sensitivity measurements in fovea, e.g., the Pelli-Robson chart (Pelli and Robson, 1988), which can only provide a limited contrast sensitivity assessment of residual spatial vision for ophthalmic patients (Elliott and Whitaker, 1992).
Our new implementation of the qVFM method was based on the qFC procedure, originally developed to measure contrast sensitivity with forced-choice paradigms at a single visual location (Hou et al., 2015; Lesmes et al., 2015). Here, we integrated the qFC procedure with the qVFM method to assess contrast sensitivity across the visual field. In the rest of this paper, we first briefly describe the 10AFC implementation of the qVFM method, then computer simulations, and finally a psychophysical validation experiment.
qVFM With 10-AFC
The qVFM method consists of three major modules (Xu et al., 2019; see Appendix C for more details):
1) The global module, which assesses the shape of the VFM through a Bayesian adaptive procedure to estimate the posterior distributions of the parameters of a tilted elliptic paraboloid function (TEPF):
where EPZ is the contrast sensitivity at the fovea, EPA is the bandwidth (latus rectum) in the horizontal direction, EPB is the bandwidth in the vertical direction, SLA is the tilt level in the horizontal direction, and SLB is the tilt level in the vertical direction. The height of the TEPF, τ(x, y), defines the contrast sensitivity (1/contrast) at a fixed d′ = 1.5 level at visual field location (x, y).
2) The switch module, which evaluates the rate of information gain in the global module and determines when to switch to the local module, and, at the point of the switch, generates the prior distribution of the visual function (e.g., light sensitivity, contrast sensitivity) at each visual field location based on the posterior from the global module.
3) The local module, which provides independent assessment of visual function at each visual field location using another Bayesian adaptive procedure that determines the location and stimulus parameters of test stimulus in each trial based on the relative information gain across locations.
In the global module, a probability density function, , where is defined over the parameter space of the TEPF. The initial prior distribution pt = 0() represents foreknowledge of model parameters before any data collection (trial t = 0). A stimulus space, which includes all possible stimulus intensities and stimulus locations (x, y), is also defined in the qVFM procedure. The local module starts with a prior distribution in each retinal location. In both the global and local modules, a one-step-ahead search strategy is used to determine the optimal stimulus in the next trial that would lead to the maximum information gain (equivalent to the minimum expected entropy), and the selection of optimal stimulus location and intensity is always based on the total expected entropy across all the visual field locations. Using Bayesian update and optimal stimulus selection (Kontsevich and Tyler, 1999; Lesmes et al., 2006, 2010, 2015; Lu and Dosher, 2013), the qVFM updates the posterior distribution of the parameters based on subject's response in each trial to estimate the shape of the VFM in the global module or the individual parameters of each location in the local module.
In a previous paper (Xu et al., 2019), we implemented the qVFM method with a Yes/No task. In the new 10AFC implementation, we kept the general algorithm unchanged except the likelihood function, which was based on the d′ psychometric function for Yes/No in the earlier implementation of the method. In a 10-AFC task, the d′ psychometric function (i.e., perceptual sensitivity for a given stimulus contrast s) at each visual field location (x, y), can be modeled as (Foley and Legge, 1981; Legge et al., 1987; Hou et al., 2015):
where s is the reciprocal of the contrast of the stimulus (i.e., 1/contrast), τ(x, y) is the contrast sensitivity at location (x,y), γ is the steepness of the d′ psychometric function. Plotted on log-log axes, this function is linear over the contrast of the stimulus. Following previous studies (Foley and Legge, 1981; Lu and Dosher, 1999; Hou et al., 2015; Lu et al., 2019), we set γ = 2.35 in the current implementation of the qVFM. Based on signal detection theory (Gu and Green, 1994; Klein, 2001), the probability of correctly identifying the target in an m-alternative forced choice (m-AFC) identification task is a function of the corresponding d′ (Hacker and Ratcliff, 1979):
where ϕ() is the probability density function of the standard normal distribution, Φ() is the cumulative probability density function of the standard normal distribution, m is the number of alternatives in the m-AFC task (which is 10 in this study), and d′(s, x, y) is the d′ value for a stimulus s at visual field location (x,y). In an m-AFC task, the observer compares the internal responses of the target with those of the m-1 non-target. The probability density of obtaining an internal response t from the target stimulus is ϕ (t − d′(s, x, y)); the probability density of obtaining an internal response t that is greater than all the m-1 non-target responses is Φm−1(t); and, according to the max decision rule, the probability of correctly identifying the target, P(s, x, y), is the probability that all possible internal responses of the target are greater than those from the m-1 non-targets, which is the product of the two probability density functions integrated over all the possible values of t (Lu and Dosher, 2013).
In addition, we assume a fixed lapse rate ε for human observers (Klein, 2001; Wichmann and Hill, 2001; Lesmes et al., 2015):
where P(s,x,y) is the psychometric function without lapse (Equation 3). In the qVFM method, ε is set to 0.03 (Wichmann and Hill, 2001; Lesmes et al., 2010). Equation (4) defines the likelihood function that completely describes the probability of 10AFC target identification across all visual field locations and contrast levels in the qVFM method.
Simulations
Methods
To evaluate the performance of the qVFM procedure for observers with a range of performance, we simulated three observers asked to perform a 10AFC letter identification task in 64 retinal locations. The parameters of the three simulated observers were chosen to approximate those of the observers in our psychophysical validation study, shown in Table 1. The blind spot of all simulated observers was at (−15 degree, −3 degree).
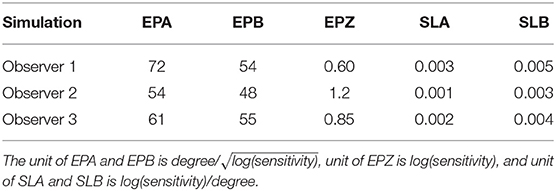
Table 1. Parameters of the three simulated observers.
In the qVFM method, the parameter space includes 30 linearly spaced EPA values [from 36.0 to 96.0 degree/], 30 linearly spaced EPB values [from 36.0 to 96.0 degree/], 50 linearly spaced EPZ values [from 0.25 to 1.4 log(sensitivity)], 20 linearly spaced SLA values [from −0.015 to 0.015 log(sensitivity)/degree] and 20 linearly spaced SLB values [from −0.016 to 0.016 log(sensitivity)/degree]. The broad parameter space ensures robust assessment of a wide range of patient populations and avoids effects of extreme values—the tendency to bias toward the center of the parameter space when the observer's true parameter values are close to the boundary of the space.
For each of the five qVFM parameters, the priors were defined by a hyperbolic secant (sech) function (King-Smith and Rose, 1997). For each qVFM parameter, θi, for i = 1, 2, 3, 4, 5, the mode of the marginal prior p(θi) was defined by the best guess for that parameter based on a pilot study, θi,guess, and the width was defined by the confidence, θi,confidence:
The priors were log-symmetric around θi, guess, whose values for the respective parameters were: EPA = 60 (degree/), EPB = 54 (degree/), EPZ = 0.90 (log(sensitivity)), SLA = 0.002 (log(sensitivity)/degree), and SLB = 0.003 (log(sensitivity)/degree). For θconfidence of each parameter, the value was set to 3.1 for EPA, 2.6 for EPB, 3.4 for EPZ, 5.2 for SLA, 4.5 for SLB. The joint prior was defined as the normalized product of the marginal priors, which resulted in a relatively moderate informative prior for the three simulated observers in our study.
The stimulus space includes an 8 x 8 grid of retina locations (48 x 48 degree) and log-linearly spaced contrast values [between 0.05 to 1.0, corresponding to 0 to 1.3 log(sensitivity)]: with 60 values in the global module and 120 contrast values in the local module.
We compared the performance of the full qVFM procedure that has all three modules with a reduced qVFM procedure that has only the local module in 1,000 repeated simulations of 1,280 trials each. The priors in the reduced qVFM was generated from the prior of the global module of the full qVFM. In other words, the two methods are equated before the first trial.
Metrics of Evaluation
Accuracy is a measure of how much the estimate deviate from the truth on average, and precision is a measure of the variability of repeated estimates. We quantify accuracy using the root mean squared error (RMSE) of the estimated contrast sensitivities across all 64 visual field locations. The RMSE after the i-th trial can be calculated as:
where τijk is the estimated sensitivity at the k-th VF location after i trials in the j-th run, and is the true sensitivity at that location.
Precision is defined as the inverse of the variability of the estimates. Two methods were used to assess the precision of the qVFM method. The first is based on the standard deviation of repeated measures:
Another measure of precision is the average half width of the credible interval (HWCI) of the posterior distribution of the estimated sensitivities across retina locations. The 68.2% credible interval represents the range within which the actual value lies with 68.2% probability. Since researchers typically do not repeat an experiment many times for the same observer, the HWCI of the posterior distribution is a very important index of precision that can be obtained with a single run of the qVFM procedure (Hou et al., 2015).
Results
A simulation of the qVFM and qFC methods based on the parameters of the simulated observer 1 is shown in Supplementary Movie 1. The simulation program can be downloaded from GitHub (https://github.com/hvxpj/qVFM_Demo/issues/1#issue-604728692). The GUI allows users to adjust the parameters of the simulated observers and prior used in the qVFM method.
The estimated VFMs of the three simulated observers, obtained with the qVFM and qFC methods, are shown in Figure 1 (simulated observer 1) and Figures A1, A2 (simulated observers 2 and 3) in Appendix A.
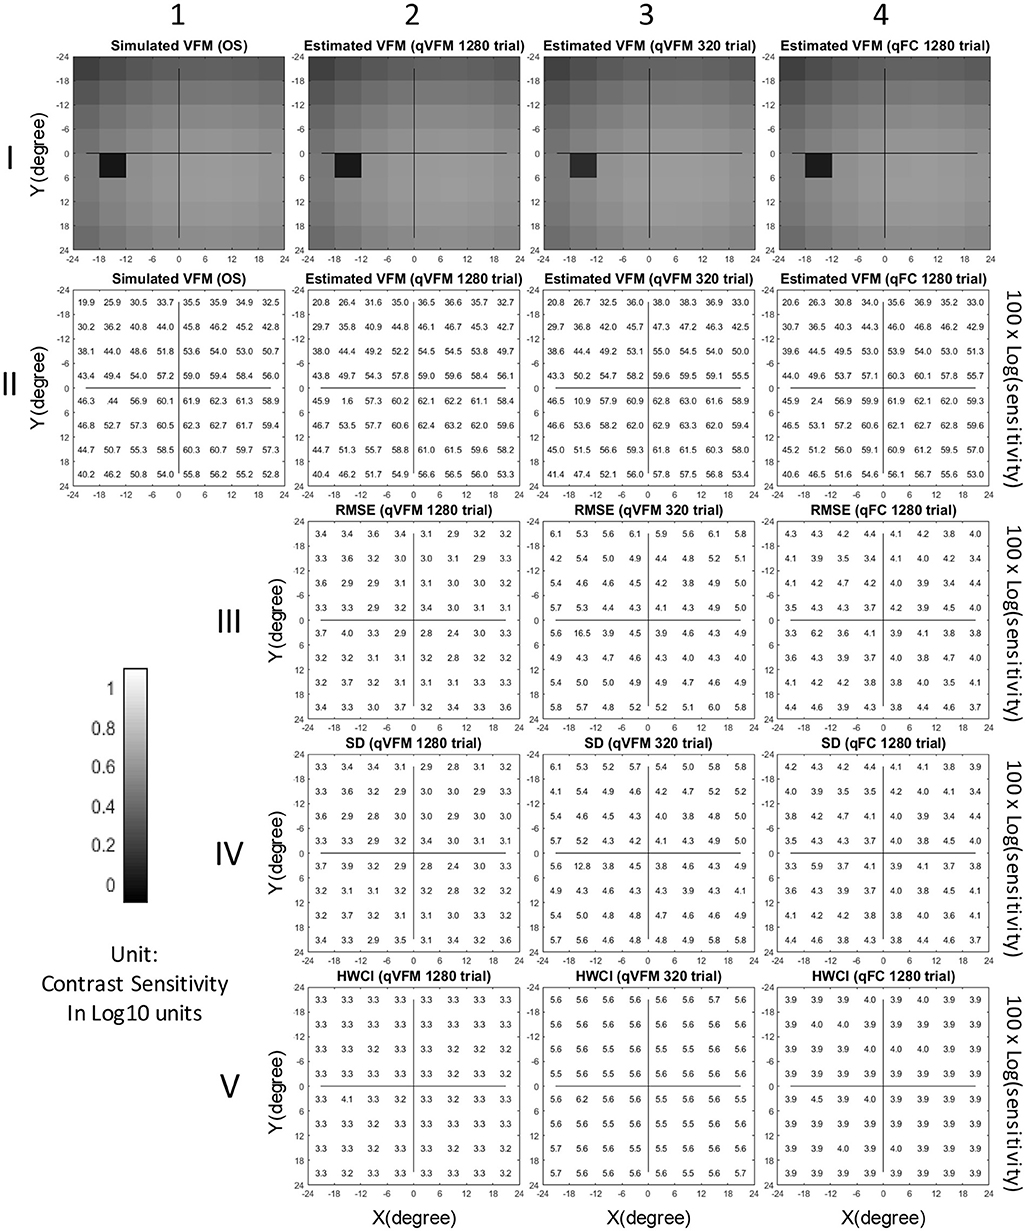
Figure 1. Simulation results I (Observer 1): The contrast sensitivity VFM of the simulated observer (I,1; II,1); The estimated VFM obtained with the qVFM method after 1,280 trials (I,2; II,2) and 320 trials (I,3; II,3); The estimated VFM obtained with the qFC method (I,4; II,4); And the corresponding RMSEsimulation (III), standard deviation (IV), and HWCI (V) of the estimates.
In characterizing spatial vision, the area under the log contrast sensitivity function is often used as a summary metric (Applegate et al., 1998, 2000; Oshika et al., 1999, 2006; van Gaalen et al., 2009; Hou et al., 2010; Lesmes et al., 2010; Jia et al., 2014; Dorr et al., 2015; Zheng et al., 2018). Here, we used the volume under the surface of the VFM (VUSVFM) to provide a summary metric of the entire visual field.
Figure 2 shows the RMSEsimulation, standard deviation, average 68.2% HWCI and VUSVFM of the estimated contrast sensitivities obtained from the qVFM and qFC methods for the three simulated observers over 1,280 trials. In log10 units [represent as log(sensitivity)], the average RMSEsimulation of the three simulated observers started at 0.24 for both the qVFM and qFC methods. It decreased to 0.057 and 0.10 in the qVFM and qFC methods after the first 320 trials, and to 0.037 and 0.041 in the two methods after 1,280 trials, respectively. The SD of the estimated sensitivities was 0.054 in the qVFM method and 0.096 in the qFC method after 320 trials, which decreased to 0.032 in the qVFM method and 0.041 in the qFC method after 1,280 trials. The average 68.2% HWCI of the estimated sensitivities also decreased with trial number. It started at 0.32 in both the qVFM and qFC methods, decreased to 0.055 in the qVFM method and 0.094 in the qFC method after the first 320 trials, and to 0.033 in the qVFM method and 0.039 in the qFC method after 1,280 trials.
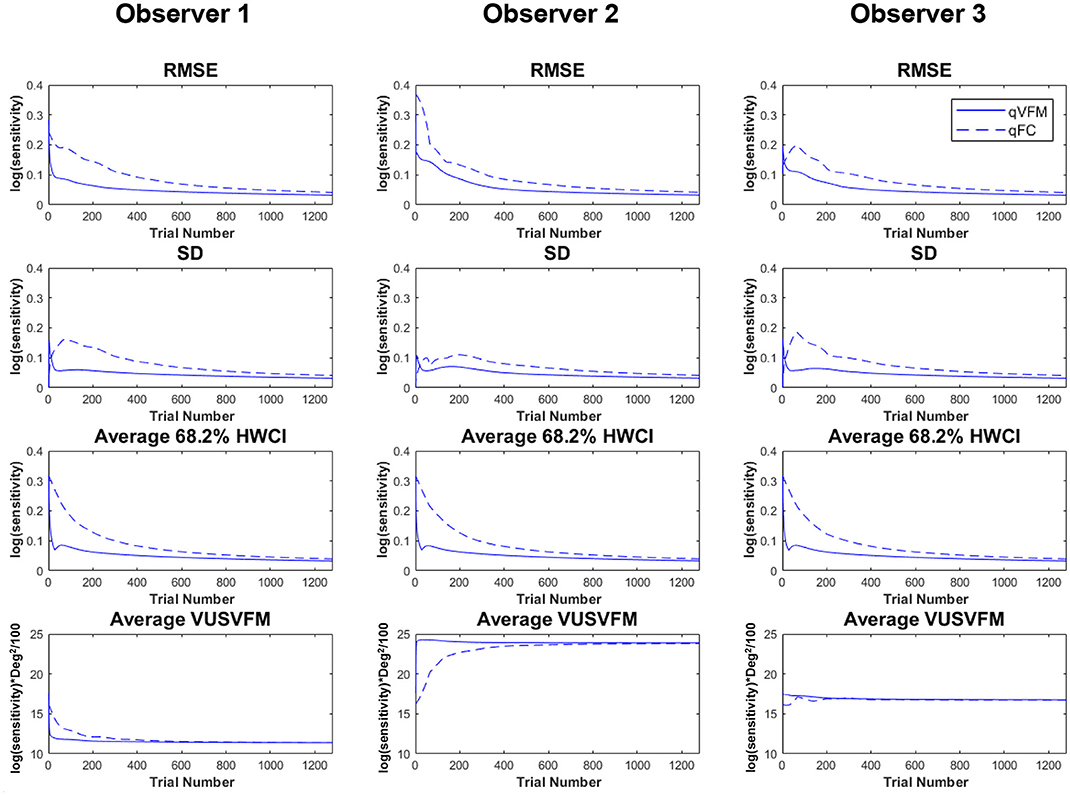
Figure 2. Simulation results II. The first three rows show the RMSEsimulation, standard deviation, and average 68.2% HWCI of the estimated contrast sensitivities across 64 locations and 1,000 runs. The fourth row shows the average volume under the surface of the VFM (VUSVFM) across 1,000 runs. The true VUSVFM is 11.3 for observer 1, 23.8 for observer 2 and 16.7 for observer 3 (unit: log(sensitivity)) x degree2/100.
For the qVFM method, the switch from the global module to the local module occurred between 31 and 69 trials, with the mean around 41 trials and standard deviation of 9.3 trials. From Figure 2, we can see that the global module acted very efficiently in reducing random errors and uncertainties in the beginning of the measurement.
The simulations showed that the estimated VFM from both the qVFM and qFC method could reach high accuracy and precision in 1,280 trials. The qVFM method could however converge much quicker and achieve good accuracy and precision in a much shorter period of time comparing to the qFC method. To achieve 0.1 log(sensitivity) accuracy and 0.1 log(sensitivity) precision, on average, the qVFM method only took 106 trials, whereas the qFC method needed 334 trials.
Psychophysical Validation
Methods
Participants
We collected data from ten eyes (5 OS, 5 OD) of 5 normal (3 male and 2 female) subjects, including four naïve observers (Subject 2–Subject 5) and one of the authors (Subject 1). All subjects were between 32 and 39 years of age.
Apparatus
The psychophysical experiment was conducted on an IBM PC compatible computer, running Matlab programs with PsychToolbox extensions (Brainard and Vision, 1997; Pelli, 1997). Subjects viewed the stimuli monocularly with natural pupil at a viewing distance of 30 cm in a dimly lighted room. The stimuli were displayed on a Samsung 55-inch monitor [Model: UN55FH6030, Clear Motion Rate (CMR) of 240], with a screen size of 120.6 x 67.8 cm, corresponding to a field of view 127.0 x 97.0 degrees for the subjects, a screen resolution of 1920 x 1080 pixels, a refresh rate of 60 Hz, and a background luminance at 47 cd/m2. A chin–forehead rest was used to minimize head movements during the experiment.
Stimuli
Ten Sloan letters, filtered with a raised cosine filter and octave bandwidth (central spatial frequency: 1.2 cycles per degree), served as stimuli (Figure 3). The contrast of the letters varied between 0.05 to 1, corresponding to 0 to 1.3 log(sensitivity).
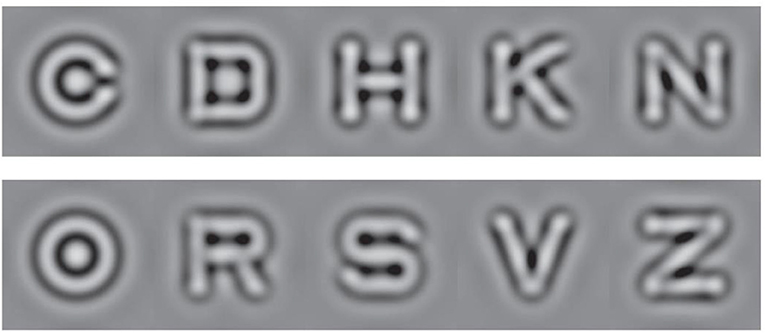
Figure 3. The 10 filtered Sloan letters used in the study.
Design and Procedure
In each trial, a single optotype (size: 2.5 x 2.5 degree) was presented for 200 ms in one of the 8 x 8 possible retina locations, evenly distributed in a 48 x 48-degree visual field (Figure 4). Subjects were asked to identify the letter. On each trial, the contrast and location of the stimulus was adaptively selected. The inter-trial interval was set to 1.2 s.

Figure 4. Illustration of the stimulus layout in the psychophysical experiment. A filtered Sloan letter was displayed for 200 ms at one of the 8×8 possible retinal locations on the screen. Subjects were asked to fixate on the center dot and report which letter was present.
Each eye was tested in four sessions, each consisting of an independent 320-trial qVFM assessment and 320 qFC trials, with the two types of trials randomly mixed.
Results
The estimated VFMs of the 10 tested eyes from both the qVFM and qFC methods are shown in Figure 5 (Subject 1) and Figures B1–B4 (Subject 2-5, in Appendix B).
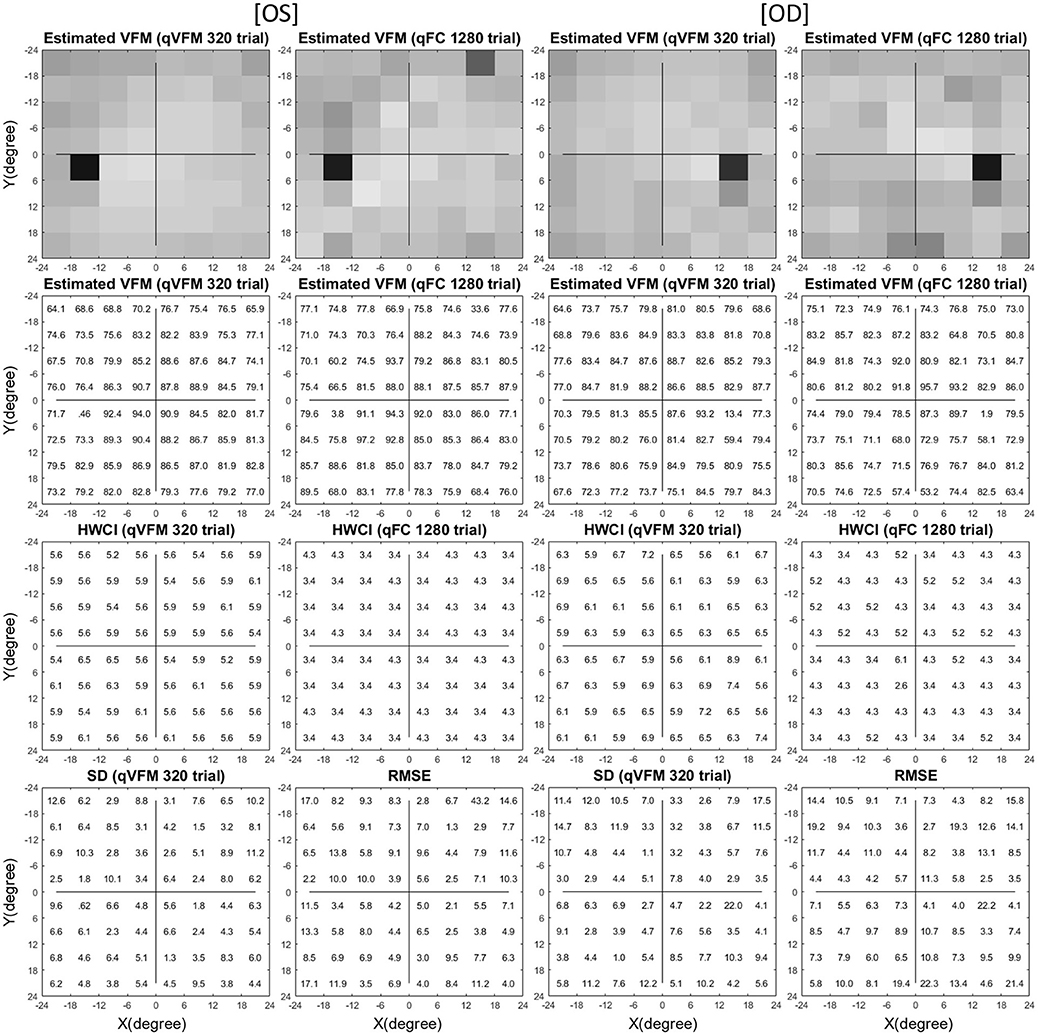
Figure 5. Experimental result I (Subject 1, OS and OD). The estimated contrast sensitivity VFMs are presented in the first row with colormaps and second row with numerical values (unit: 100 x log(sensitivity)). For each visual field location of the estimated VFM, the 68.2% HWCI is presented in the third row, the standard deviation of the estimated contrast sensitivity from the 4 repeated qVFM assessments and the RMSEeyes between the qVFM and qFC estimates are presented in the fourth row. The results obtained from OS are displayed in the first and second columns, and OD in the third and fourth columns, respectively. The results from the qVFM and qFC methods are displayed in different columns.
The agreement between the estimated VFMs from the qVFM and qFC was evaluated by the root mean squared error (RMSE) of the estimated contrast sensitivities across all 64 retina locations:
where is the estimated contrast sensitivity from the qVFM method in the k-th VF location of the l-th eye after i trials in the j-th session, and is the estimated contrast sensitivity from the qFC method in the k-th VF location of the l-th eye after 1,280 trials. The average RMSEeyes (in log(sensitivity) units) started at 0.26 on the first qVFM trial and decreased to 0.12 after 160 qVFM trials and to 0.11 after 320 qVFM trials across all test sessions and eyes (Figure 6A). That the decreasing RMSEeyes estimates is a function of trial number suggests that the accuracy of qVFM increased with number of test trials.
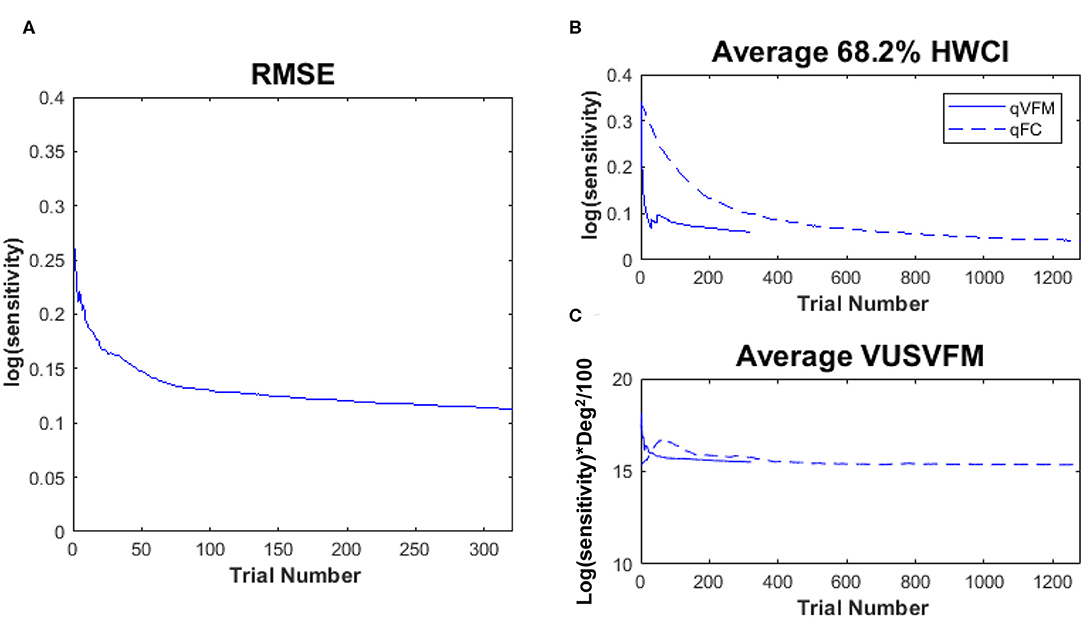
Figure 6. Experimental results II. (A) RMSEeyes of the estimated sensitivities from qVFM as a function of trial number, using estimated sensitivities from 1,280 qFC trials as the “truth.” (B) Average 68.2% HWCI of the estimated sensitivities across 64 locations and 10 eyes. (C) Average VUSVFM across 10 eyes. Results from the qVFM method are shown in solid lines, and results from the qFC method are shown in dashed lines.
The average 68.2% HWCI of the estimated contrast sensitivities [in log10 units, represent as log(sensitivity)] across all 10 eyes and 64 retina locations decreased from 0.33 before the first qVFM trial to 0.072 after 160 qVFM trials and 0.060 after 320 qVFM trials. The average 68.2% HWCI of the estimated contrast sensitivities decreased from 0.33 before the first qFC trial to 0.16 after 160 qFC trials, 0.10 after 320 qFC trials, and 0.041 after 1,280 qFC trials (Figure 6B). The results suggest that the precision of the estimated sensitivities from the qVFM and qFC methods increased with trial number, and reached 0.1 log(sensitivity) in about 17 and 325 trials, respectively.
For the qVFM method, the switch from the global module to the local module occurred between 31 and 70 trials, with the mean around 41 trials and a standard deviation of 9.8 trials across all 10 eyes, consistent with the simulations. The rapid convergence of the VFM estimates by the global module (the average 68.2% HWCI) is evident in Figure 6B.
Figure 6C presents the average estimated VUSVFM of 10 eyes as a function of trial number for qVFM and qFC. The estimated VUSVFM from the two methods was less than 0.6% different after 320 trials. The agreement of these estimates implies that the VUSVFM can be a useful metric of the overall visual filed map.
Test–retest reliability of the qVFM is assessed through analysis of the 4 qVFM runs completed in four sessions. Figure 7A plots estimated sensitivities of the paired qVFM runs from the four independent sessions (2 random pairs of qVFM × 10 eyes × 64 locations = 1,280 data points). The average test–retest correlation for the all possible pairs of VFM estimates was 0.971 (SD = 0.001).
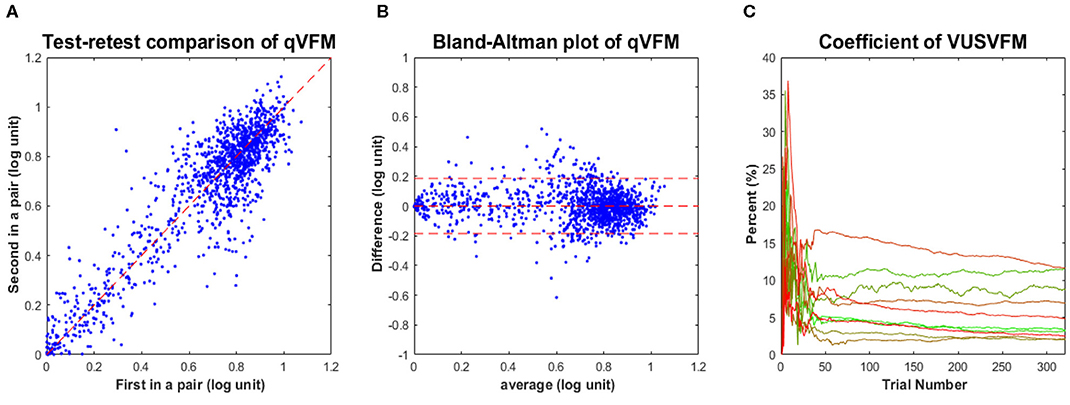
Figure 7. Experimental results III. (A) Test-retest comparison of estimated sensitivities from repeated qVFM runs. (B) Bland-Altman plot for repeated qVFM runs. (C) Coefficient of variability of estimated VUSVFMs (4 runs each) as functions of trial number for the 10 tested eyes.
Although test–retest correlation is widely reported as a measure of test–retest reliability, it might not be the most useful way to characterize the reliability of a method (Bland and Altman, 1986). Figure 7B presents a Bland–Altman plot of the difference of the qVFM estimates between all possible pairs of repeated measures against their respective means. The mean and standard deviation of the test–retest difference were 1.3 × 10⁻⁴ and 0.093 log(sensitivity), respectively. These results suggest that (1) the estimated VFM did not change much over the course of testing sessions, and (2) the test–retest differences between sessions were comparable to the estimated RMSEeyes [0.093 log(sensitivity) vs. 0.11 log(sensitivity)]. Repeated runs of the qVFM procedure generated quite consistent results, demonstrating its robustness.
To illustrate the convergence of the estimated VUSVFM obtained with the qVFM method, Figure 7C presents the coefficient of variation of VUSVFM estimates as a function of trial number for each eye. The coefficient of variation, also known as relative standard deviation, is defined as the ratio of the standard deviation to the mean:
where σi is the standard deviation of estimated VUSVFM after the i-th trial across four runs, and μi is the mean of the estimated VUSVFMs after the i-th trial across four runs. A consistent pattern, exhibited in each tested eye, is a decrease of variability with trial number: from close to 35% after 20 trials, to less than 12% after 320 trials.
Discussion
Visual filed mapping has undergone revolutionary changes over the past 2000 years, particularly with regard to instrumentation, standardization, quantitative assessment, statistical evaluation, optimization of accuracy, precision and efficiency of testing, and distribution of results (Lascaratos and Marketos, 1988; Walsh, 2010). However, the primary method for performing perimetry tests has remained relatively the same for more than 200 years. Thus, it is both a challenge and an opportunity for us to augment current methods by developing new procedures with novel algorithms that would allow more comprehensive and precise identification of damage to the visual field (Thompson and Wall, 2010; Johnson et al., 2011).
We developed the qVFM method to address this technical challenge in mapping visual functions, based on a hybrid Bayesian adaptive testing framework that combines a global module for preliminary assessment of the VFM's shape and a local module for assessing individual VF locations. We first applied the method to assess light sensitivity VFM in an earlier study. In the current study, we extended the method to assess contrast sensitivity of the visual field, and showed that the method can provide an accurate, precise, efficient assessment. Our simulations showed that the average RMSEsimulation and SD of the estimated VFM [in log10 units, represent as log(sensitivity)] after 1,280 trials were 0.037 and 0.032 by the qVFM, and 0.041 and 0.041 by the qFC, respectively. To achieve 0.1 accuracy and 0.1 precision, on average, it took 106 qVFM trials, and 334 qFC trials. Estimates of within-run variability (68.2% HWCIs) were comparable to cross-run variability (SD). For the subjects in our psychophysical experiment, the average HWCI of the qVFM estimates decreased from 0.33 on the first trial to 0.072 after 160 trials, and to 0.060 after 320 trials. The RMSEeyes of the estimates from the qVFM and qFC methods started at 0.26 on the first trial and decreased to 0.12 after 160 qVFM trials and to 0.11 after 320 trials.
In addition to light sensitivity and contrast sensitivity, the qVFM method can be extended to map many other visual functions, such as visual acuity, binocular vision, color vision, temporal frequency, motion sensitivity, reading speed, and crowding maps, with potential clinical signals for monitoring vision loss, evaluating therapeutic interventions, and developing effective rehabilitation for low vision.
The development of the qVFM and other related methods, such as the qCSF, qVA, and qReading methods (Lesmes et al., 2010; Hou et al., 2018; Lesmes and Dorr, 2019; Shepard et al., 2019; Zhao et al., 2019a), makes it possible for us to identify core deficits of functional vision in visual impairments. By measuring performance in a battery of everyday visual tasks on a large group of subjects, we can model their performance in everyday visual tasks with the candidate metrics provided by the tests (e.g., light sensitivity, contrast sensitivity, acuity, reading speed) and identify the most important core metrics. Such core metrics would allow us to better understand visual deficits, to focus on a reduced set of measures while achieving a thorough assessment of residual vision, and to setup portfolio of effective examinations and rehabilitation interventions.
Mapping Sensitivities With m-AFC Tasks
Earlier adaptive methods focused on targeting pre-defined percent correct performance levels on the empirical psychometric function. Following the development of staircase procedures (Von Békésy, 1947; Wetherill, 1963; Wetherill and Levitt, 1965), the QUEST method (Watson and Pelli, 1983) was a landmark application of Bayesian adaptive inference to measure thresholds. The Bayesian adaptive approach has since been applied to measure empirical thresholds in forced-choice tasks (Watson and Pelli, 1983; King-Smith et al., 1994; King-Smith and Rose, 1997; Snoeren and Puts, 1997; Alcala-Quintana and Garcia-Perez, 2007; García-Pérez and Alcalá-Quintana, 2007).
Previous studies (Leek et al., 1992; Leek, 2001; Alcalá-Quintana and García-Pérez, 2004; Hou et al., 2010) have revealed that the shape of the psychometric function could have a profound impact on the efficiency of adaptive procedures that search optimal stimuli in a two-dimensional stimulus space. In a particular experimental setting, the slope of the d′ psychometric function is related to the internal noise distribution and transducer of the observer (Dosher and Lu, 1998; Lu and Dosher, 2008, 2013) and is not easy to manipulate. However, for a single d′ psychometric function, it is possible to reduce the guessing rate and increase the slope of the percent correct psychometric function by increasing the number of alternatives in an m-AFC task, and therefore increase the efficiency of the adaptive procedure. The benefit of more alternatives in m-AFC tasks was documented in association with the qCSF method (Hou et al., 2015), and has been extended to the qVFM procedure in this study. It can also be extended to other Bayesian adaptive testing procedures such as QUEST, ZEST, Psi, quick TvC, quick Partial Report, qReading and quick Change-Detection, most of which are based on d′ psychometric functions (King-Smith et al., 1994; Kontsevich and Tyler, 1999; Kujala and Lukka, 2006; Lesmes et al., 2006; Baek et al., 2016; Hou et al., 2018; Shepard et al., 2019; Zhang et al., 2019; Zhao et al., 2019b).
Effects of the Prior
It is well-known that the initial prior probability distribution could change the starting point of parameter estimation and the efficiency of the estimation process (Baek et al., 2016; Gu et al., 2016). For the three simulated observers in the current study, the prior distributions were moderately informative. To illustrate the effects of the prior, we conducted an additional set of simulations with four different prior settings (Table 2): (a) a weakly informative proper prior, (b) a weakly informative but improper prior, (c) a strong informative proper prior, and (d) a strong informative but improper prior.
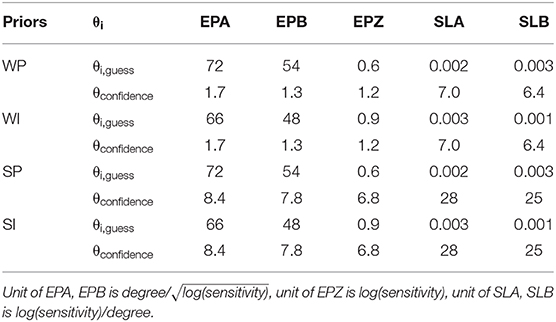
Table 2. The parameters of four prior settings.
The parameters of the simulated observer were: EPA = 72 (degree/), EPB = 54 (degree/), EPZ = 0.6 (log(sensitivity)), SLA = 0.002 (log(sensitivity)/degree), SLB = 0.003 (log(sensitivity)/degree). The parameter space and the stimulus space remained the same.
Here, we introduce the absolute bias as the index of accuracy. The average absolute bias of the estimated threshold across all locations after the i-th trial can be calculated as:
where τijk is the estimated contrast sensitivity in the k-th retina location after i trials in the j-th run, and is the true sensitivity of that location.
Figure 8 shows the performance of the qVFM and qFC procedures with the four different prior settings. In both the qVFM and qFC procedures, the strong informative proper prior led to the best performance in terms of the average absolute bias, SD and the average 68.2% HWCI. The strong informative improper prior led to the worst average absolute bias and slightly better precision than the weakly informative priors. The weakly informative proper and improper priors exhibited similar performance in all measures, with accuracy between those of the strong informative proper and improper priors, and worse precision comparing to them.
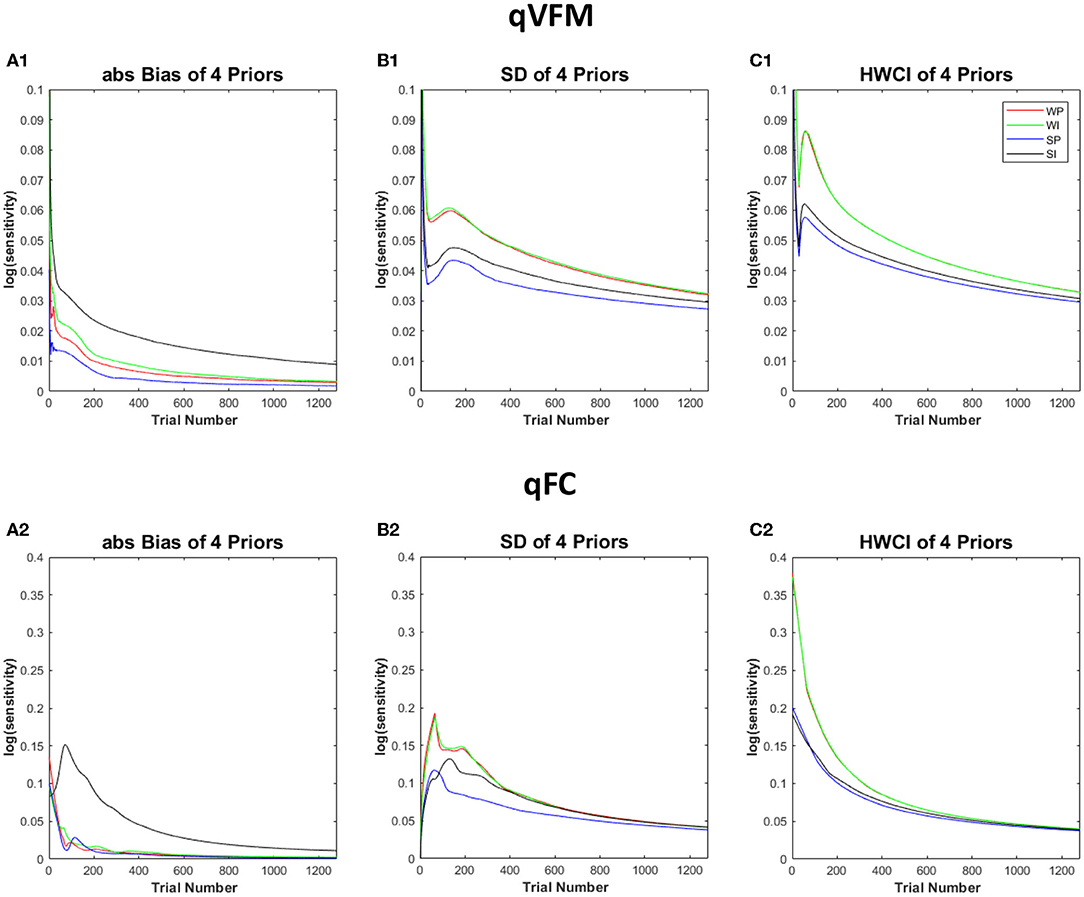
Figure 8. Simulation results III. The performance of the qVFM and qFC procedures in four prior settings. WP, weakly informative proper prior; WI, weakly informative but improper prior; SP, strong informative proper prior; SI, strong informative but improper prior. (A1, B1, C1) The average absolute Bias, SD, the average 68.2% HWCI for qVFM procedures in each of four prior settings. (A2, B2, C2) The average absolute Bias, SD, the average 68.2% HWCI for qFC procedures in each of four prior settings.
In all four prior settings, the qVFM procedure led to better performance than the qFC procedure. Especially with the strong informative priors, the improper prior made the accuracy of the qFC estimates much worse. The difference of the average absolute bias between the strong informative proper and improper priors was 0.05 for qFC and 0.016 for qVFM after 320 trials. The results suggest that the qVFM method was more robust than the qFC method when the prior was improper.
These results suggest that proper informative prior can speed up the estimation process of the qVFM procedure. We can inform the prior with previous knowledge or pilot data, such as the representative parameters from a particular patient population, or priors derived with the hierarchical adaptive method (Kim et al., 2014; Gu et al., 2016).
Conclusion
In this study, we implemented the qVFM method to measure contrast sensitivity VFM with a 10-alternative forced-choice paradigm. Detailed assessment of contrast sensitivity across the visual field and other core metrics of functional visual is critical for quantifying the effectiveness of new drugs and rehabilitation therapies. We have tested our method on 10 eyes of five normal observers. Applications of our method to clinical populations may require additional development. Further integrating with other measurements, such as fundus or OCT images, may further improve the efficiency of the qVFM method. The broad adoption of the qVFM method can potentially improve both clinical research and clinical care.
Data Availability Statement
The datasets generated for this study are available on request to the corresponding author.
Ethics Statement
The studies involving human participants were reviewed and approved by the Institutional Review Board of the Ohio State University. The patients/participants provided their written informed consent to participate in this study.
Author Contributions
Z-LL, PX, LL, and DY designed the qVFM algorithms. PX performed simulations, carried out the experiment, and analyzed the data. PX and Z-LL wrote the manuscript with input from all authors. Z-LL and DY supervised the project. All authors contributed to the article and approved the submitted version.
Funding
This research was supported by NIH grants EY025658 to DY and EY021553 to Z-LL.
Conflict of Interest
Z-LL, PX, LL, and DY own intellectual property rights on the qVFM technology and have a pending patent on it. LL and Z-LL have equity interest in Adaptive Sensory Technology, Inc. LL holds employment at AST.
Supplementary Material
The Supplementary Material for this article can be found online at: https://www.frontiersin.org/articles/10.3389/fnins.2020.00665/full#supplementary-material
Supplementary Movie 1. A simulated 320-trial sequence of the qVFM and qFC procedures based on the parameters of simulated observer 1. The first row shows the contrast sensitivity VFM of the simulated observer, and the estimated contrast sensitivity VFM's obtained with the qVFM and qFC methods. The second and third rows show the estimated VUSVFM and average HWCI of the estimated contrast sensitivities.
References
Alcalá-Quintana, R., and García-Pérez, M. A. (2004). The role of parametric assumptions in adaptive Bayesian estimation. Psychol. Methods 9, 250. doi: 10.1037/1082-989X.9.2.250
Alcala-Quintana, R., and Garcia-Perez, M. A. (2007). A comparison of fixed-step-size and Bayesian staircases for sensory threshold estimation. Spat. Vis. 20, 197–218. doi: 10.1163/156856807780421174
Applegate, R. A., Hilmantel, G., Howland, H. C., Tu, E. Y., Starck, T., and Zayac, E. J. (2000). Corneal first surface optical aberrations and visual performance. J. Refract. Surg. 16, 507–514.
Applegate, R. A., Howland, H. C., Sharp, R. P., Cottingham, A. J., and Yee, R. W. (1998). Corneal aberrations and visual performance after radial keratotomy. J. Refract. Surg. 14, 397–407. doi: 10.3928/1081-597X-19980701-05
Artes, P. H., Iwase, A., Ohno, Y., Kitazawa, Y., and Chauhan, B. C. (2002). Properties of perimetric threshold estimates from Full Threshold, SITA Standard, and SITA Fast strategies. Invest. Ophthalmol. Vis. Sci. 43, 2654–2659.
Baek, J., Lesmes, L. A., and Lu, Z.-L. (2016). qPR: an adaptive partial-report procedure based on Bayesian inference. J. Vis. 16:25. doi: 10.1167/16.10.25
Balas, B., Nakano, L., and Rosenholtz, R. (2009). A summary-statistic representation in peripheral vision explains visual crowding. J. Vis. 9:13. doi: 10.1167/9.12.13
Bellucci, R., Scialdone, A., Buratto, L., Morselli, S., Chierego, C., Criscuoli, A., et al. (2005). Visual acuity and contrast sensitivity comparison between Tecnis and AcrySof SA60AT intraocular lenses: a multicenter randomized study. J. Cataract Refract. Surg. 31, 712–717. doi: 10.1016/j.jcrs.2004.08.049
Bland, J. M., and Altman, D. (1986). Statistical methods for assessing agreement between two methods of clinical measurement. Lancet 327, 307–310. doi: 10.1016/S0140-6736(86)90837-8
Bodis-Wollner, I., Marx, M. S., Mitra, S., Bobak, P., Mylin, L., and Yahr, M. (1987). Visual dysfunction in Parkinson's disease: Loss in spatiotemporal contrast sensitivity. Brain 110, 1675–1698. doi: 10.1093/brain/110.6.1675
Bradley, A., and Freeman, R. D. (1981). Contrast sensitivity in anisometropic amblyopia. Invest. Ophthalmol. Vis. Sci. 21, 467–476.
Brainard, D. H., and Vision, S. (1997). The psychophysics toolbox. Spat. Vis. 10, 433–436. doi: 10.1163/156856897X00357
Bulens, C., Meerwaldt, J. D., Van der Wildt, G. J., and Keemink, C. J. (1986). Contrast sensitivity in Parkinson's disease. Neurology 36, 1121–1121. doi: 10.1212/WNL.36.8.1121
Carlow, T. J., Flynn, J. T., and Shipley, T. (1976). Color perimetry. Arch. Ophthalmol 94, 1492–1496. doi: 10.1001/archopht.1976.03910040326007
Comerford, J. P. (1983). Vision evaluation using contrast sensitivity functions. Am. J. Optom. Physiol. Opt. 60, 394–398. doi: 10.1097/00006324-198305000-00009
Daitch, J. M., and Green, D. G. (1969). Contrast sensitivity of the human peripheral retina. Vision Res. 9:947–952. doi: 10.1016/0042-6989(69)90100-X
Della Sala, S., Bertoni, G., Somazzi, L., Stubbe, F., and Wilkins, A. J. (1985). Impaired contrast sensitivity in diabetic patients with and without retinopathy: a new technique for rapid assessment. Br. J. Ophthalmol. 69, 136–142. doi: 10.1136/bjo.69.2.136
Dorr, M., Wille, M., Viulet, T., Sanchez, E., Bex, P. J., Lu, Z.-L., et al. (2015). Next-generation vision testing: the quick CSF. Curr. Dir. Biomed. Eng. 1, 131–134. doi: 10.1515/cdbme-2015-0034
Dosher, B. A., and Lu, Z.-L. (1998). Perceptual learning reflects external noise filtering and internal noise reduction through channel reweighting. Proc. Natl. Acad. Sci. U.S.A. 95, 13988–13993. doi: 10.1073/pnas.95.23.13988
Dreyer, E. B. (1993). Automated static perimetry. Arch. Ophthalmol. 111:310. doi: 10.1001/archopht.1993.01090030028017
Elliott, D. B., and Whitaker, D. (1992). Clinical contrast sensitivity chart evaluation. Ophthalmic Physiol. Opt. 12, 275–280. doi: 10.1111/j.1475-1313.1992.tb00397.x
Faye, E. E. (2005). “Contrast sensitivity tests in predicting visual function,” in International Congress Series (London, UK: Elsevier), 521–524. doi: 10.1016/j.ics.2005.05.001
Fletcher, D. C., and Schuchard, R. A. (1997). Preferred retinal loci relationship to macular scotomas in a low-vision population. Ophthalmology 104, 632–638. doi: 10.1016/S0161-6420(97)30260-7
Foley, J. M., and Legge, G. E. (1981). Contrast detection and near-threshold discrimination in human vision. Vision Res. 21, 1041–1053. doi: 10.1016/0042-6989(81)90009-2
García-Pérez, M. A., and Alcalá-Quintana, R. (2007). The transducer model for contrast detection and discrimination: formal relations, implications, and an empirical test. Spat. Vis. 20, 5–43. doi: 10.1163/156856807779369724
Ginsburg, A. P. (1987). Contrast sensitivity, drivers' visibility, and vision standards. Transp. Res. Rec. 1149, 32–39.
Ginsburg, A. P. (2003). Contrast sensitivity and functional vision. Int. Ophthalmol. Clin. 43, 5–15. doi: 10.1097/00004397-200343020-00004
Ginsburg, A. P. (2006). Contrast sensitivity: determining the visual quality and function of cataract, intraocular lenses and refractive surgery. Curr. Opin. Ophthalmol. 17, 19–26. doi: 10.1097/01.icu.0000192520.48411.fa
Gu, H., Kim, W., Hou, F., Lesmes, L. A., Pitt, M. A., Lu, Z.-L., et al. (2016). A hierarchical Bayesian approach to adaptive vision testing: a case study with the contrast sensitivity function. J. Vis. 16, 15–15. doi: 10.1167/16.6.15
Gu, X., and Green, D. M. (1994). Further studies of a maximum-likelihood yes–no procedure. J. Acoust. Soc. Am. 96, 93–101. doi: 10.1121/1.410378
Hacker, M. J., and Ratcliff, R. (1979). A revised table of d'for M-alternative forced choice. Atten. Percept. Psychophys. 26, 168–170. doi: 10.3758/BF03208311
Hart, W. M., Hartz, R. K., Hagen, R. W., and Clark, K. W. (1984). Color contrast perimetry. Invest. Ophthalmol. Vis. Sci. 25, 400–413.
Hess, R. F., and Howell, E. R. (1977). The threshold contrast sensitivity function in strabismic amblyopia: evidence for a two type classification. Vision Res. 17, 1049–1055. doi: 10.1016/0042-6989(77)90009-8
Hess, R. F., and Plant, G. T. (1985). Temporal frequency discrimination in human vision: evidence for an additional mechanism in the low spatial and high temporal frequency region. Vision Res. 25, 1493–1500. doi: 10.1016/0042-6989(85)90227-5
Hot, A., Dul, M. W., and Swanson, W. H. (2008). Development and evaluation of a contrast sensitivity perimetry test for patients with glaucoma. Invest. Ophthalmol. Vis. Sci. 49, 3049–3057. doi: 10.1167/iovs.07-1205
Hou, F., Huang, C., Lesmes, L. A., Feng, L., Tao, L., Zhou, Y., et al. (2010). qCSF in clinical application: efficient characterization and classification of contrast sensitivity functions in amblyopia. Invest. Ophthalmol. Vis. Sci. 51, 5365–5377. doi: 10.1167/iovs.10-5468
Hou, F., Lesmes, L. A., Bex, P. J., Dorr, M., and Lu, Z.-L. (2015). Using 10AFC to further improve the efficiency of the quick CSF method. J. Vis. 15:2. doi: 10.1167/15.9.2
Hou, F., Zhao, Y., Lesmes, L. A., Bex, P., Yu, D., and Lu, Z.-L. (2018). Bayesian adaptive assessment of the reading function for vision: the qReading method. J. Vis. 18:6. doi: 10.1167/18.9.6
Huang, C., Zhou, Y., and Lu, Z.-L. (2008). Broad bandwidth of perceptual learning in the visual system of adults with anisometropic amblyopia. Proc. Natl. Acad. Sci. U.S.A. 105, 4068–4073. doi: 10.1073/pnas.0800824105
Jia, W., Yan, F., Hou, F., Lu, Z.-L., and Huang, C.-B. (2014). qCSF in clinical applications: efficient characterization and classification of contrast sensitivity functions in aging. Invest. Ophthalmol. Vis. Sci. 55:762. doi: 10.1167/iovs.10-5468
Jindra, L. F., and Zemon, V. (1989). Contrast sensitivity testing: a more complete assessment of vision. J. Cataract Refract. Surg. 15, 141–148. doi: 10.1016/S0886-3350(89)80002-1
Johnson, C. A., Wall, M., and Thompson, H. S. (2011). A history of perimetry and visual field testing. Optom. Vis. Sci. 88, E8–E15. doi: 10.1097/OPX.0b013e3182004c3b
Keltgen, K. M., and Swanson, W. H. (2012). Estimation of spatial scale across the visual field using sinusoidal stimuli. Invest. Ophthalmol. Vis. Sci. 53, 633–639. doi: 10.1167/iovs.10-6674
Keltner, J. L., Johnson, C. A., Quigg, J. M., Cello, K. E., Kass, M. A., and Gordon, M. O. (2000). Confirmation of visual field abnormalities in the Ocular Hypertension Treatment Study. Arch. Ophthalmol. 118, 1187–1194. doi: 10.1001/archopht.118.9.1187
Kim, W., Pitt, M. A., Lu, Z.-L., Steyvers, M., and Myung, J. I. (2014). A hierarchical adaptive approach to optimal experimental design. Neural Comput. 26, 2465–2492. doi: 10.1162/NECO_a_00654
King-Smith, P. E., Grigsby, S. S., Vingrys, A. J., Benes, S. C., and Supowit, A. (1994). Efficient and unbiased modifications of the QUEST threshold method: theory, simulations, experimental evaluation and practical implementation. Vision Res. 34, 885–912. doi: 10.1016/0042-6989(94)90039-6
King-Smith, P. E., and Rose, D. (1997). Principles of an adaptive method for measuring the slope of the psychometric function. Vision Res. 37, 1595–1604. doi: 10.1016/S0042-6989(96)00310-0
Kiorpes, L., Tang, C., and Movshon, J. A. (1999). Factors limiting contrast sensitivity in experimentally amblyopic macaque monkeys. Vision Res. 39, 4152–4160. doi: 10.1016/S0042-6989(99)00130-3
Klein, S. A. (2001). Measuring, estimating, and understanding the psychometric function: a commentary. Percept. Psychophys. 63, 1421–1455. doi: 10.3758/BF03194552
Kontsevich, L. L., and Tyler, C. W. (1999). Bayesian adaptive estimation of psychometric slope and threshold. Vision Res. 39, 2729–2737. doi: 10.1016/S0042-6989(98)00285-5
Kujala, J. V., and Lukka, T. J. (2006). Bayesian adaptive estimation: The next dimension. J. Math. Psychol. 50, 369–389. doi: 10.1016/j.jmp.2005.12.005
Lascaratos, J., and Marketos, S. (1988). “A historical outline of Greek ophthalmology from the Hellenistic period up to the establishment of the first universities,” in History of Ophthalmology 1, eds H. E. Henkes and Cl. Zrenner (Dordrecht: Springer), 157–169. doi: 10.1007/978-94-009-1307-3_17
Leek, M. R. (2001). Adaptive procedures in psychophysical research. Percept. Psychophys. 63, 1279–1292. doi: 10.3758/BF03194543
Leek, M. R., Hanna, T. E., and Marshall, L. (1992). Estimation of psychometric functions from adaptive tracking procedures. Percept. Psychophys. 51, 247–256. doi: 10.3758/BF03212251
Legge, G. E., Kersten, D., and Burgess, A. E. (1987). Contrast discrimination in noise. JOSA A 4, 391–404. doi: 10.1364/JOSAA.4.000391
Lesmes, L. A., and Dorr, M. (2019). “Active learning for visual acuity testing,” in Proceedings of the 2nd International Conference on Applications of Intelligent Systems, (Las Palmas de Gran Canaria) 1–6. doi: 10.1145/3309772.3309798
Lesmes, L. A., Jeon, S.-T., Lu, Z.-L., and Dosher, B. A. (2006). Bayesian adaptive estimation of threshold versus contrast external noise functions: the quick TvC method. Vision Res. 46, 3160–3176. doi: 10.1016/j.visres.2006.04.022
Lesmes, L. A., Lu, Z.-L., Baek, J., and Albright, T. D. (2010). Bayesian adaptive estimation of the contrast sensitivity function: the quick CSF method. J. Vis. 10, 17–17. doi: 10.1167/10.3.17
Lesmes, L. A., Lu, Z.-L., Baek, J., Tran, N., Dosher, B. A., and Albright, T. D. (2015). Developing Bayesian adaptive methods for estimating sensitivity thresholds (d′) in Yes-No and forced-choice tasks. Front. Psychol. 6:1070. doi: 10.3389/fpsyg.2015.01070
Levi, D. M., and Carney, T. (2009). Crowding in peripheral vision: why bigger is better. Curr. Biol. 19, 1988–1993. doi: 10.1016/j.cub.2009.09.056
Li, R., Polat, U., Makous, W., and Bavelier, D. (2009). Enhancing the contrast sensitivity function through action video game training. Nat. Neurosci. 12, 549. doi: 10.1038/nn.2296
Li, R. W., Young, K. G., Hoenig, P., and Levi, D. M. (2005). Perceptual learning improves visual performance in juvenile amblyopia. Invest. Ophthalmol. Vis. Sci. 46, 3161–3168. doi: 10.1167/iovs.05-0286
Loshin, D. S., and White, J. (1984). Contrast sensitivity: the visual rehabilitation of the patient with macular degeneration. Arch. Ophthalmol. 102, 1303–1306. doi: 10.1001/archopht.1984.01040031053022
Lu, Z.-L., and Dosher, B. A. (1999). Characterizing human perceptual inefficiencies with equivalent internal noise. JOSA A 16, 764–778. doi: 10.1364/JOSAA.16.000764
Lu, Z.-L., and Dosher, B. A. (2008). Characterizing observers using external noise and observer models: assessing internal representations with external noise. Psychol. Rev. 115, 44. doi: 10.1037/0033-295X.115.1.44
Lu, Z.-L., Zhao, Y., Lesmes, L. A., Dorr, M., and Bex, P. (2019). Unbiased threshold estimates in Bayesian Adaptive qCSF and qFC with mismatched psychometric function slopes. Invest. Ophthalmol. Vis. Sci. 60:3908.
Lu, Z.-L., and Dosher, B. A. (2013). Visual Psychophysics: From Laboratory to Theory. Cambridge, MA: MIT Press. doi: 10.7551/mitpress/9780262019453.001.0001
Markowitz, S. N., and Muller, C. (2004). Macular perimetry in low vision. Can. J. Ophthalmol. 39, 56–60. doi: 10.1016/S0008-4182(04)80053-X
Massof, R. W., and Rubin, G. S. (2001). Visual function assessment questionnaires. Surv. Ophthalmol. 45, 531–548. doi: 10.1016/S0039-6257(01)00194-1
McLeod, S. D. (2001). Beyond snellen acuity: the assessment of visual function after refractive surgery. Arch. Ophthalmol. 119, 1371–1373. doi: 10.1001/archopht.119.9.1371
Mestre, D., Blin, O., Serratrice, G., and Pailhous, J. (1990). Spatiotemporal contrast sensitivity differs in normal aging and Parkinson's disease. Neurology 40:1710. doi: 10.1212/WNL.40.11.1710
Oshika, T., Klyce, S. D., Applegate, R. A., and Howland, H. C. (1999). Changes in corneal wavefront aberrations with aging. Invest. Ophthalmol. Vis. Sci. 40, 1351–1355.
Oshika, T., Okamoto, C., Samejima, T., Tokunaga, T., and Miyata, K. (2006). Contrast sensitivity function and ocular higher-order wavefront aberrations in normal human eyes. Ophthalmology 113, 1807–1812. doi: 10.1016/j.ophtha.2006.03.061
Pelli, D. G. (1997). The VideoToolbox software for visual psychophysics: transforming numbers into movies. Spat. Vis. 10, 437–442. doi: 10.1163/156856897X00366
Pelli, D. G., and Robson, J. G. (1988). The design of a new letter chart for measuring contrast sensitivity. Clin. Vision Sci. 2, 187–199.
Polat, U., Ma-Naim, T., Belkin, M., and Sagi, D. (2004). Improving vision in adult amblyopia by perceptual learning. Proc. Natl. Acad. Sci. U.S.A. 101, 6692–6697. doi: 10.1073/pnas.0401200101
Qiu, Z., Xu, P., Zhou, Y., and Lu, Z.-L. (2007). Spatial vision deficit underlies poor sine-wave motion direction discrimination in anisometropic amblyopia. J. Vis. 7:7. doi: 10.1167/7.11.7
Ramulu, P. Y., West, S. K., Munoz, B., Jampel, H. D., and Friedman, D. S. (2009). Glaucoma and reading speed: the Salisbury Eye Evaluation project. Arch. Ophthalmol. 127, 82–87. doi: 10.1001/archophthalmol.2008.523
Regan, D., Bartol, S., Murray, T. J., and Beverley, K. I. (1982). Spatial frequency discrimination in normal vision and in patients with multiple sclerosis. Brain 105, 735–754. doi: 10.1093/brain/105.4.735
Regan, D., and Hamstra, S. (1991). Shape discrimination for motion-defined and contrast-defined form: Squareness is special. Perception 20, 315–336. doi: 10.1068/p200315
Regan, D., Raymond, J., Ginsburg, A. P., and Murray, T. J. (1981). Contrast sensitivity, visual acuity and the discrimination of Snellen letters in multiple sclerosis. Brain 104, 333–350. doi: 10.1093/brain/104.2.333
Ross, J. E., Bron, A. J., and Clarke, D. D. (1984). Contrast sensitivity and visual disability in chronic simple glaucoma. Br. J. Ophthalmol. 68, 821–827. doi: 10.1136/bjo.68.11.821
Sample, P. A., and Weinreb, R. N. (1990). Color perimetry for assessment of primary open-angle glaucoma. Invest. Ophthalmol. Vis. Sci. 31, 1869–1875.
Sample, P. A., and Weinreb, R. N. (1992). Progressive color visual field loss in glaucoma. Invest. Ophthalmol. Vis. Sci. 33, 2068–2071.
Shepard, T. G., Hou, F., Bex, P. J., Lesmes, L. A., Lu, Z.-L., and Yu, D. (2019). Assessing reading performance in the periphery with a Bayesian adaptive approach: the qReading method. J. Vis. 19:5. doi: 10.1167/19.5.5
Snoeren, P. R., and Puts, M. J. (1997). Multiple parameter estimation in an adaptive psychometric method: MUEST, an extension of the QUEST method. J. Math. Psychol. 41, 431–439. doi: 10.1006/jmps.1997.1188
Sokol, S., Moskowitz, A., Skarf, B., Evans, R., Molitch, M., and Senior, B. (1985). Contrast sensitivity in diabetics with and without background retinopathy. Arch. Ophthalmol. 103, 51–54. doi: 10.1001/archopht.1985.01050010055018
Stamper, R. L. (1984). The effect of glaucoma on central visual function. Trans. Am. Ophthalmol. Soc. 82:792.
Stewart, W. C., and Hunt, H. H. (1993). Threshold variation in automated perimetry. Surv. Ophthalmol. 37, 353–361. doi: 10.1016/0039-6257(93)90065-F
Strasburger, H., Rentschler, I., and Jüttner, M. (2011). Peripheral vision and pattern recognition: a review. J. Vis. 11, 13–13. doi: 10.1167/11.5.13
Sunness, J. S., Schuchard, R. A., Shen, N., Rubin, G. S., Dagnelie, G., and Haselwood, D. M. (1995). Landmark-driven fundus perimetry using the scanning laser ophthalmoscope. Invest. Ophthalmol. Vis. Sci. 36, 1863–1874.
Swanson, W. H., Malinovsky, V. E., Dul, M. W., Malik, R., Torbit, J. K., Sutton, B. M., et al. (2014). Contrast sensitivity perimetry and clinical measures of glaucomatous damage. Optom. Vis. Sci. 91:1302. doi: 10.1097/OPX.0000000000000395
Tan, D. T., and Fong, A. (2008). Efficacy of neural vision therapy to enhance contrast sensitivity function and visual acuity in low myopia. J. Cataract Refract. Surg. 34, 570–577. doi: 10.1016/j.jcrs.2007.11.052
Thompson, H. S., Montague, P., Cox, T. A., and Corbett, J. J. (1982). The relationship between visual acuity, pupillary defect, and visual field loss. Am. J. Ophthalmol. 93, 681–688. doi: 10.1016/0002-9394(82)90460-3
Thompson, H. S., and Wall, M. (2010). Imaging and Perimetry Society (IPS). A history of perimetry. Available online at: http://perimetry.org/index.php/history
Travis, D., and Thompson, P. (1989). Spatiotemporal contrast sensitivity and colour vision in multiple sclerosis. Brain 112, 283–303. doi: 10.1093/brain/112.2.283
Trobe, J. D., Beck, R. W., Moke, P. S., and Cleary, P. A. (1996). Contrast sensitivity and other vision tests in the optic neuritis treatment trial. Am. J. Ophthalmol,. 121, 547–553. doi: 10.1016/S0002-9394(14)75429-7
van Gaalen, K. W., Jansonius, N. M., Koopmans, S. A., Terwee, T., and Kooijman, A. C. (2009). Relationship between contrast sensitivity and spherical aberration: Comparison of 7 contrast sensitivity tests with natural and artificial pupils in healthy eyes. J. Cataract Refract. Surg. 35, 47–56. doi: 10.1016/j.jcrs.2008.09.016
Walsh, T. (2010). Visual Fields: Examination and Interpretation. Oxford, NY: Oxford University Press.
Watson, A. B., and Pelli, D. G. (1983). QUEST: a Bayesian adaptive psychometric method. Percept. Psychophys. 33, 113–120. doi: 10.3758/BF03202828
Weinreb, R. N., and Kaufman, P. L. (2009). The glaucoma research community and FDA look to the future: a report from the NEI/FDA CDER Glaucoma Clinical Trial Design and Endpoints Symposium. Invest. Ophthalmol. Vis. Sci. 50, 1497–1505. doi: 10.1167/iovs.08-2843
Weinreb, R. N., and Kaufman, P. L. (2011). Glaucoma research community and FDA look to the future, II: NEI/FDA Glaucoma Clinical Trial Design and Endpoints Symposium: measures of structural change and visual function. Invest. Ophthalmol. Vis. Sci. 52, 7842–7851. doi: 10.1167/iovs.11-7895
Wetherill, G. B. (1963). Sequential estimation of quantal response curves. J. R. Stat. Soc. Ser. B Methodol. 25, 1–38. doi: 10.1111/j.2517-6161.1963.tb00481.x
Wetherill, G. B., and Levitt, H. (1965). Sequential estimation of points on a psychometric function. Br. J. Math. Stat. Psychol. 18, 1–10. doi: 10.1111/j.2044-8317.1965.tb00689.x
Wichmann, F. A., and Hill, N. J. (2001). The psychometric function: I. Fitting, sampling, and goodness of fit. Percept. Psychophys. 63, 1293–1313. doi: 10.3758/BF03194544
Woods, R. L., and Wood, J. M. (1995). The role of contrast sensitivity charts and contrast letter charts in clinical practice. Clin. Exp. Optom. 78, 43–57. doi: 10.1111/j.1444-0938.1995.tb00787.x
Xu, P., Lesmes, L. A., Yu, D., and Lu, Z.-L. (2019). A novel Bayesian adaptive method for mapping the visual field. J. Vis. 19:16. doi: 10.1167/19.14.16
Xu, P., Lu, Z.-L., Qiu, Z., and Zhou, Y. (2006). Identify mechanisms of amblyopia in Gabor orientation identification with external noise. Vision Res. 46, 3748–3760. doi: 10.1016/j.visres.2006.06.013
Yu, D., Cheung, S.-H., Legge, G. E., and Chung, S. T. (2010). Reading speed in the peripheral visual field of older adults: Does it benefit from perceptual learning? Vision Res. 50, 860–869. doi: 10.1016/j.visres.2010.02.006
Zhang, P., Zhao, Y., Dosher, B. A., and Lu, Z.-L. (2019). Assessing the detailed time course of perceptual sensitivity change in perceptual learning. J. Vis. 19:9. doi: 10.1167/19.5.9
Zhao, Y., Lesmes, L., and Lu, Z.-L. (2019b). Efficient assessment of the time course of perceptual sensitivity change. Vision Res. 154, 21–43. doi: 10.1016/j.visres.2018.10.009
Zhao, Y., Lesmes, L. A., Dorr, M., Bex, P., and Lu, Z.-L. (2019a). Accuracy and Precision of the ETDRS Chart, E-ETDRS and Bayesian qVA Method. Invest. Ophthalmol. Vis. Sci. 60:5908.
Zheng, H., Wang, C., Cui, R., He, X., Shen, M., Lesmes, L. A., et al. (2018). Measuring the contrast sensitivity function using the qCSF method with 10 Digits. Transl. Vis. Sci. Technol. 7:9. doi: 10.1167/tvst.7.6.9
Zhou, Y., Huang, C., Xu, P., Tao, L., Qiu, Z., Li, X., et al. (2006). Perceptual learning improves contrast sensitivity and visual acuity in adults with anisometropic amblyopia. Vision Res. 46, 739–750. doi: 10.1016/j.visres.2005.07.031
Keywords: Bayesian adaptive testing, automated perimetry, visual-filed map, peripheral vision, contrast sensitivity, active learning, Sloan letters
Citation: Xu P, Lesmes LA, Yu D and Lu Z-L (2020) Mapping the Contrast Sensitivity of the Visual Field With Bayesian Adaptive qVFM. Front. Neurosci. 14:665. doi: 10.3389/fnins.2020.00665
Received: 14 February 2020; Accepted: 29 May 2020;
Published: 07 July 2020.
Edited by:
Christopher DiMattina, Florida Gulf Coast University, United StatesReviewed by:
Woojae Kim, Howard University, United StatesJenny C. A. Read, Newcastle University, United Kingdom
Copyright © 2020 Xu, Lesmes, Yu and Lu. This is an open-access article distributed under the terms of the Creative Commons Attribution License (CC BY). The use, distribution or reproduction in other forums is permitted, provided the original author(s) and the copyright owner(s) are credited and that the original publication in this journal is cited, in accordance with accepted academic practice. No use, distribution or reproduction is permitted which does not comply with these terms.
*Correspondence: Zhong-Lin Lu, emhvbmdsaW5Abnl1LmVkdQ==