 Daphne Wang1
 Elizabeth Krebs1,2,3
 Joao Ricardo Nickenig Vissoci1,2Luciano de Andrade1,4Stephen Rulisa5
 Catherine A. Staton1,2*
- 1Department of Global Injury, Duke Global Health Institute, Duke University, Durham, NC, United States
- 2Division of Emergency Medicine, Department of Surgery, Duke University Medical Center, Durham, NC, United States
- 3Department of Emergency Medicine, Thomas Jefferson University, Philadelphia, PA, United States
- 4Department of Medicine, Universitário Maringá, Maringá, Brazil
- 5Department of Obstetrics and Gynecology, University Teaching Hospital of Kigali, University of Rwanda, Kigali, Rwanda
Introduction: Road traffic injuries (RTIs) are a significant cause of morbidity and mortality in Rwanda. Investigations of the high risk areas for road traffic crashes (RTCs) are urgently needed to guide improvements in road safety. This study aims to identify RTC hotspots in Kigali, Rwanda, and to conduct a built environment analysis of these hotspots.
Methods: RTC and RTC-prone locations were collected from the Kigali Traffic Police and high frequency road users, and hotspots were identified through kernel density estimation. Built environment characteristics (BEA), including road design, road safety, pedestrian safety, and traffic density, were collected for each hotspot. BEA characteristics were associated with risk of RTC using logistic regression and BEA scores were calculated using principal component analysis. Patterns of BEA were identified through exploratory cluster analysis and associated with risk for RTC using logistic regression.
Results: 25 RTC hotspots were identified. High crash risk locations were less likely to have unpaved roads (21%, p = 0.049) and road narrowing (21%, p = 0.049). High crash risk locations were also more likely to have pedestrian walkways (100%, p = 0.009), factors aiding pedestrian crossing (100%, p = 0.026), and poor road surfaces (86%, p = 0.005). Cluster analysis showed that hotspots with fewer urban characteristics, including road safety features, motor vehicle density, and pedestrian safety features, have significantly decreased odds of being a high mortality risk hotspot than a hotspot with more urban characteristics (OR = 0.13, 95% CI 0.02–0.79).
Conclusions: RTC hotspots were in the city center with high motor vehicle density but did have road and pedestrian safety features, suggesting that speeding is a major cause of RTCs. Effective traffic calming measures and enforcement of road safety laws may reduce the burden of road traffic injuries in Kigali but additional analyses are recommended.
Introduction
Globally, road traffic crashes (RTCs) cause 1.35 million deaths and many other non-fatal road traffic injuries (RTIs) (World Health Organization, 2018). RTIs create a significant health and economic burden in low- and middle-income countries (LMICs). African countries have a particularly disproportionate burden of RTCs and RTIs. According to the World Health Organization (WHO), the countries in the African region have the highest per capita rate of road deaths in the world despite having a small fraction of the world's vehicles (World Health Organization, 2018).
Modeled estimates find that Rwanda has the highest road traffic fatality rate at 22 deaths per 100,000 and the highest burden of RTIs at 1,173 disability-adjusted life years per 100,000 population compared to other East African countries [Institute for Health Metrics and Evaluation (IHME), 2015]. The Rwandan National Police (RNP) reported 2,270 RTIs including 270 (11.9%) deaths in 2010. While total RTIs in 2010 were grossly the same as 2015 (2,187), fatalities rose to 351 (16.0%). (National Institutes of Statistics of Rwanda, 2017). Rwanda, like many LMICs, lacks a comprehensive RTC data system that links police and hospital records. This limitation is associated with high rates of RTC and RTI underreporting, raising concern that true numbers of RTIs and road deaths are much higher than reported. (Chandran et al., 2010; World Health Organization, 2018), Epidemiologic Reviews; Patel et al., 2016, BMC Public Health; (Samuel et al., 2012), Under-reporting of road traffic mortality in developing countries).
Urban Rwanda, Kigali Province, is densely populated at 2,535 residents per square kilometer, but the majority of the population lives in rural areas (National Institutes of Statistics of Rwanda, 2017). Kigali also contains 70% of the registered vehicles in Rwanda (National Institutes of Statistics of Rwanda, 2014). In 2011, 72% of all RTCs in Rwanda took place in Kigali (Asiimwe, 2011). Retrospective studies of hospital records indicate that RTIs accounted for 73.4% of all injury cases and 61.2% of fatal injuries in Kigali [(Petroze et al., 2014), Patterns of injury at two university teaching hospitals in Rwanda: Baseline injury epidemiology using the Rwanda injury registry; (Kim et al., 2016), World journal of surgery; (Enumah et al., 2016)]. Although there have been investigations on the epidemiology of RTIs, little is known about the geographic locations nor built environment characteristics of crash hotspots in Kigali [(Petroze et al., 2014; Kim et al., 2016), World journal of surgery; (Enumah et al., 2016; Patel et al., 2016), BMC Public Health].
In the past decade, geographic information systems (GIS) has emerged as a powerful tool to analyze the spatial and temporal patterns of RTCs [(Anderson, 2009), Kernel density estimation and K-means clustering to profile road accident hotspots; (Bíl et al., 2013), Identification of hazardous road locations of traffic accidents by means of kernel density estimation and cluster significance evaluation; (Plug et al., 2011), Spatial and temporal visualization techniques for crash analysis; (Xie and Yan, 2013), Detecting traffic accident clusters with network kernel density estimation and local spatial statistics: an integrated approach]. Improved understanding of the physical environment at RTC hotspots in Kigali may facilitate effective road safety initiatives to improve the built environment infrastructure and reduced RTI risk encountered by vulnerable road users [(Ewing and Dumbaugh, 2009), The built environment and traffic safety: a review of empirical evidence; (Schurman et al., 2009), Pedestrian injury and the built environment: an environmental scan of hotspots; (Miranda-Moreno et al., 2011), The link between built environment]. Therefore, this study aims to use spatial analysis to identify RTC hotspots in Kigali, Rwanda then apply built environment analysis to identify implementable interventions that may decrease the incidence and severity of RTIs at these RTC hotspots.
Methods
Study Setting
The Republic of Rwanda is located in Eastern/Central Africa and has a population of nearly 13 million (Figure 1) (National Institutes of Statistics of Rwanda, 2017). Rwanda is the third most densely populated country in Africa and is undergoing rapid urbanization (National Institutes of Statistics of Rwanda, 2017). The province, and capital city of Kigali, is divided into three districts: Gasabo, Kicukiro, and Nyarugenge with a total population of more than 1.5 million inhabitants. (National Institutes of Statistics of Rwanda, 2014).
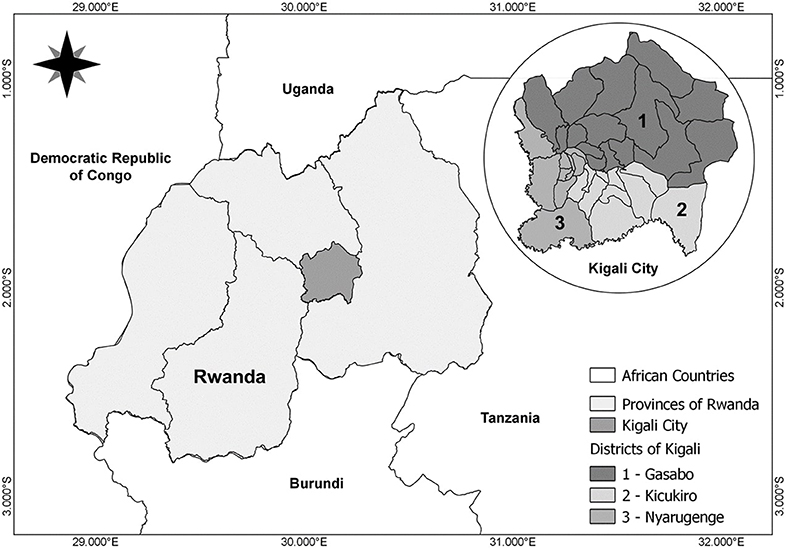
Figure 1. Location of the Republic of Rwanda and the province of Kigali City.
Road Traffic Crashes Hotspot Identification
RTC hotspots were identified by combining retrospective police report data and a high road utilizers survey. Each of these RTC hotspot localization methods were previously validated and described in depth by Staton and Patel [(Staton et al., 2016), High road utilizers surveys compared to police data for road traffic crash hotspot localization in Rwanda and Sri Lanka; (Patel et al., 2016), BMC Public Health]. A summarized description is provided below.
Retrospective Police Data
Data were collected from the standard police report form of all RTCs in Kigali that resulted in an injury. All accessible RTC reports between January 1 to December 31, 2013, were reviewed by trained data collectors in January, 2014. A total of 2,589 hand-written RTC reports were reviewed and tablet computers were used to record selected information in a secure Research Electronic Data Capture (REDCap) database hosted at Duke University. Information collected from police reports included crash logistics, locations of crash, involved persons, and injury. Geolocation of RTCs were determined by the address or description of location in the reports. If the precise location of the crash could not be determined it was noted during data collection. An independent reviewer assessed the data for completion and inconsistency.
RTCs that had no reports in the Kigali Traffic Police office at the time of data collection were not part of the data analysis. The primary reasons for not having access to RTC reports include active case review by the judicial system, RTCs resolved without having filed official reports with the police, and misplaced reports [(Patel et al., 2016), BMC Public Health]. It was impossible to quantify the number of missing reports due to the limited information about RTCs outside of the police reports.
Survey of Motorcycle Taxi Drivers
A brief, high road utilizer survey used in other settings where our research team works was adapted for Rwandan commercial motorcyclists [(Staton et al., 2016), High road utilizers surveys compared to police data for road traffic crash hotspot localization in Rwanda and Sri Lanka]. We ensured that respondents were high road utilizers by confirming their work history, the amount of time spent on roads, and their knowledge of the roads in Kigali City. Respondents were asked to identify locations with high RTC frequency and locations they perceived as high risk for RTCs, then to rate the severity of danger at each location on a scale from 0 to 100. The questionnaire was translated from English to the local language of Kinyarwanda, then back-translated to English to assure accuracy. Pilot-testing of the Kinyarwanda survey improved comprehension of questions, ease of use, and electronic data entry.
Between January 7–14th, 2014, 602 surveys were collected by trained, Kinyarwanda-speaking research assistants using tablet computers to record responses directly into REDCap. We aimed to make this sample representative of the entire commercial motorcyclist population by utilizing the formally designated national commercial motorcyclist association taxi stands in Kigali City. At each of these 43 stands, the first ten motorcyclists encountered who were parking awaiting a client were offered survey participation. An additional five motorcyclists circulating past the stand were stopped and offered participation. On average, the informed consent and survey required 10 min to complete. At the completion of the survey, motorcycle taxi drivers were compensated the average cost of a motorcycle taxi ride ($0.68USD). Completed survey data quality was checked by the research team and incomplete or inconsistent surveys were not included. Research staff familiar with Kigali city roads geolocated the survey-identified RTC hotspots with their corresponding levels of danger on a map by dropping a pin.
RTC Hotspot Identification Through Spatial Analysis
Using the geolocation information collected from the police RTC reports and high road utilizer surveys, we identified RTC hotspots in Kigali City following a validated spatial analysis protocol [(Patel et al., 2016), BMC Public Health; (Staton et al., 2016), High road utilizers surveys compared to police data for road traffic crash hotspot localization in Rwanda and Sri Lanka; (Reardon et al., 2017), The epidemiology and hotspots of road traffic injuries in Moshi, Tanzania: an observational study]. Briefly, we used the Kernel Density Estimator to create a point density map of RTC locations using the heatmap plugin in the Quantum GIS software, version 2.4 [(Anderson, 2009), Accident Analysis & Prevention; (Bithell, 1990); Quantum GIS Development (Team, 2017)]. The Kernel estimator creates a density raster by counting the number of points in a region of interest and creating a density map accounting for the frequency of points and the distance of each point to the region. The density mapping also accounts for the crash severity at each hotspot using the injury severity rating from the police RTC reports and the danger severity rating from the motorcycle taxi driver survey. We layered the RTC density raster over the map of Kigali City with district boundaries, national and district roads, and local road networks. The national and district road network vector data was created by the Rwanda Transport Development Agency in 2014 and the local road network vector data was created by the Rwanda Natural Resources Authority Lands and Mapping Department in 2010. These shapefiles are freely accessible from the Rwanda GeoPortal (Agency, 2016). Spatial data was also obtained from OpenStreetMap, a collaborative mapping project providing open-source spatial data under the Open Database License (OpenStreetMap contributors, 2015). To assess the risk for RTC relative to built environment characteristics, we classified each hotspot as “high” or “low” risk. These classifications were assessed according to the injury severity classification from the police database (grievous injuries requiring hospital care or deaths were high risk) or a self-reported evaluation from road users of the danger of a hotspot (scale of 0–10, 10 being the highest risk). Locations were considered high risk for RTC if they had at least one severity assessment above average.
Built Environment Analysis of Crash Hotspots
Built Environment Data Collection and Instrument
The RTC-dense regions yielded 25 specific locations at which we conducted built environment analyses (BEA). Since the geolocation data from the police and commercial motorcyclist surveys showed a high agreement (83.9% agreement and Cohen's Kappa 0.69-0.90), we selected BEA locations from police reports based on RTC frequency and severity of the associated injuries. [(Staton et al., 2016), High road utilizers surveys compared to police data for road traffic crash hotspot localization in Rwanda and Sri Lanka].
From March 17 to April 15, 2014, research staff trained to identify built environment characteristics visited each hotspot during day time and recorded data points from each location. Surveyed characteristics were grouped into 4 sections: road design (urbanicity, road hierarchy classification, intersections, number of lanes, auxiliary lanes, bus stops, bridges, curvature of road, and road visibility), road safety (pavement, surface condition, narrowing of road, road shoulder, police enforcement, speed bump, traffic light, traffic signs, and speed limit), pedestrian safety (pedestrian walkways, informal walkway, and factors aiding pedestrian crossing), and traffic density. Traffic density was measured at each hotspot by counting the number of cars, bikes, motorcycles, buses, and pedestrians that passed through the hotspot from all directions then was summed and divided by the number of directions to obtain a per minute average. If the hotspot occurs at an intersection, built environment characteristics were collected from all corners of the intersection. For each hotspot, the built environment survey was performed at least twice, with a 10-min interval between each repeat survey. Detailed descriptions of each built environment characteristic and the data dictionary used to construct our data collection form can be found in the Supplementary Material (Table S1).
All BEA data were aggregated using principal component analysis (PCA), built from a polychoric correlation matrix using a principal axis estimation approach. (Abdi and Williams, 2010) Further information on the methodology used to design the BEA instrument are described elsewhere [(Vissoci et al., 2018), Validation of a tool to conduct a Built Environment Analysis in a Low Income Country Setting]. Hotspots were labeled with the most frequently occurring built environment characteristics observed at the corners of intersections and over multiple observations. Overall traffic density for each hotspot was represented by the average traffic density over multiple observations. BEA was evaluated in 5 domains (Urban characteristics, rural characteristics, road safety, pedestrian safety and traffic density) in a standardized scale ranging from 0 to 100 (Table 1). A score of 0 in any given dimension refers to a low BEA score, referring to low characteristics of that given dimension for that hotspot area. Therefore, a low score in pedestrian safety would indicate that the area evaluated has fewer walkways, bus stops or sidewalks.
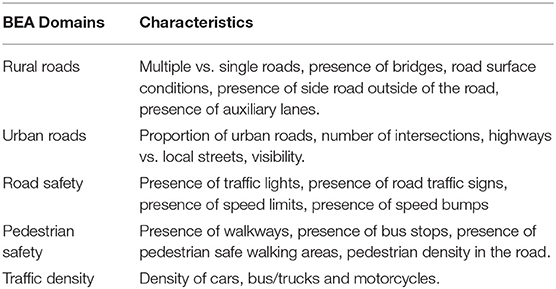
Table 1. Built environmenti analysis domains and characteristics.
Built Environment Data Analysis
Data were collected electronically using REDCap (Harris et al., 2009, Research electronic data capture [REDCap]—a metadata-driven methodology and workflow process for providing translational research informatics support) then hotspots were categorized into high and low crash risk and mortality risk locations. We calculated descriptive analysis for the BEA variables, including frequencies (absolute and relative) and medians (interquartile ranges). The distribution of built environment characteristics over crash risk was assessed using the chi-squared test of independence or Fisher's exact test where appropriate. Traffic densities were compared via Mann-Whitney U tests. All analyses were conducted with the R Language for Statistical Computing [(R Core Team, 2013), R: A language and environment for statistical computing].
K-means cluster analysis [(Lorr, 1983; Anderson, 2009), Accident Analysis & Prevention] was used to identify groups of hotspots that share similar profiles of the BEA domains. Clustering models were fit using a Hartigan-Wong algorithm. Models with different clusters were tested and selection was conducted by minimizing the bayesian information criterion (BIC) and sum of squared values. Empirical validity was measured by comparing with real images of the locations [(Vissoci et al., 2018), Validation of a tool to conduct a Built Environment Analysis in a Low Income Country Setting] and expert opinion including local researchers and road users. Odds ratios were calculated to compare risks for high crash frequency and high morality by hotspot clusters. Analysis of variance (ANOVA) was used to compare the similarity of built environment characteristics among the clusters of hotspots.
Results
Hotspots Identification
RTC locations recorded in the police database and locations at high risk for RTC as identified by commercial motorcyclist surveys were mapped (Figures 2A,B). Overall, we identified 12 RTC hotspots, mostly located in the city center, along the junction between Gasabo, Kicukiro, and Nyarugenge districts. All RTC hotspots were located at the intersection of major roads, four of which were roundabouts. Major roads on which crashes occur included KN 1 Rd, KN 2 Ave, KN 3 Rd, KN 5 Rd, KN 7 Rd, RN3, and RN15. Most regions are densely populated with some commercial buildings along major roads, while some are dense settlements along minor streets.
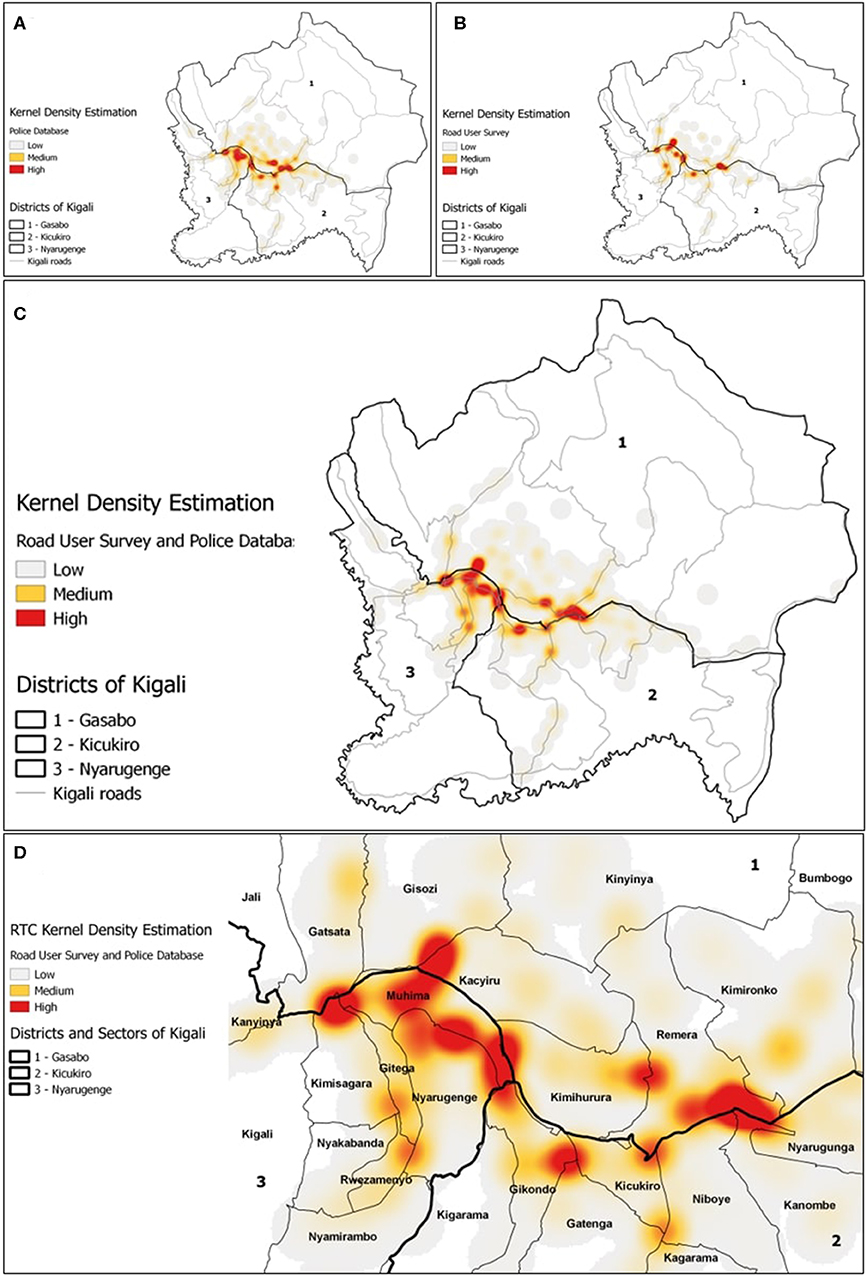
Figure 2. Kernel density estimation of RTCs in Kigali, generated from RTC crash locations from police database (A), crash-prone locations identified through the high frequency road user survey (B), and the combined data from both methods (C). RTC hotspots were overlaid with sector boundaries (D). RTC density was classified into low, medium, and high density regions, as indicated by the heatmap.
Of the 25 RTC hotspots where built environment characteristics were collected, 21 were located along national or district roads (Figure 3). We further classified the survey locations into 14 high crash risk and 11 low crash risk locations (Figure 3A), and 11 high mortality risk and 14 low mortality risk locations (Figure 3B). Survey locations that have both high crash risk and high mortality risk are the most dangerous areas because these locations are prone to both frequent and severe crashes. Of the 14 high crash risk sites, five (36%) were also high mortality crash sites. Four of these sites were located along KN 3 Rd and KN 5 Rd (RN3). Of the 11 low crash risk sites, six (55%) were high mortality crash sites. These locations were further away from the city center, along RN1, KN3 Rd, KG 15 Ave, KK 31 Ave, KG 7 Ave (RN3), and KG 11 Ave.
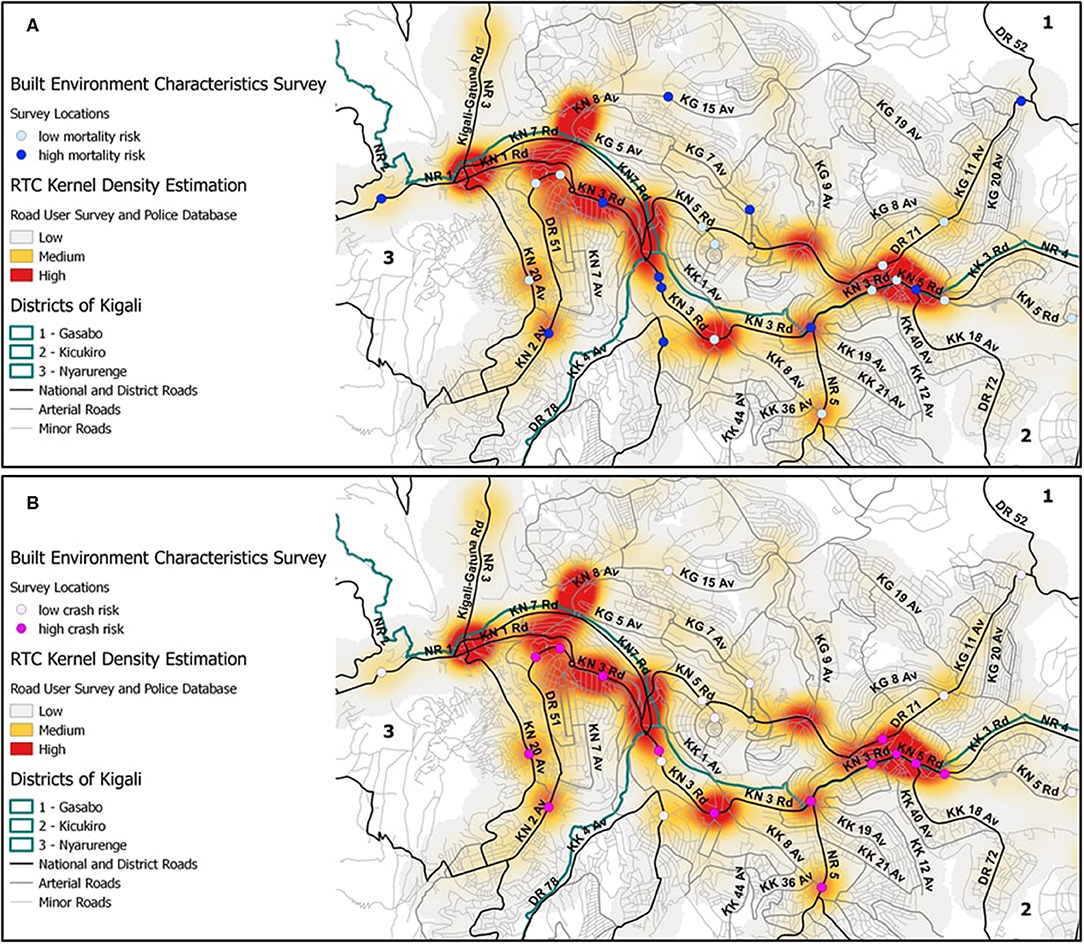
Figure 3. Locations of the built environment characteristics survey, overlaid with the road network and the RTC kernel density estimation from the combined data from the police and high frequency road user survey. Survey locations were categorized into high and low crash risk sites (A) and mortality risk sites (B). The green line depicts the borders of Gasabo, Kicukiro, and Nyarugenge districts.
Built Environment Characteristics of Hotspots
We collected information about 32 built environment characteristics on road design, road safety, traffic density, and pedestrian safety (Table 1). Most survey locations were on arterial or collector roads (n = 21; 84%), at intersections (n = 20; 80%), have two lanes (n = 21; 84%), and have auxiliary lanes (n = 14; 56%). Considering road safety characteristics, some locations also had bus stops and narrowing of the roads (both with n = 10; 40%), while more than half had inadequate visibility of the road (n = 14; 56%). Many roads were partially paved or dirt roads (n = 10, 40%) and had wet, flooded, slippery, or uneven surfaces (n = 15; 60%). While traffic signs (n = 17; 68%) and speed bumps (n = 10; 40%) were common; traffic lights (n = 1; 4%), the presence of marked speed limits (n = 5; 20%), and police enforcement (n = 4; 16%) were not. Over half of the surveyed locations had high traffic density (n = 13; 52%), with a higher median density of cars and motorcycles. Pedestrian walkways (n = 20; 80%), informal walkways (n = 13; 52%) and factors aiding pedestrians (n = 21; 84%) were common.
Road safety characteristics and pedestrian safety characteristics were associated with high crash risk. High crash risk hotspots were less likely to be partially paved or dirt roads (high crash risk n = 3 (21%), low crash risk n = 7 (64%), p = 0.049), less likely to have narrowing of road (high crash risk n = 3 (21%), low crash risk n = 7 (64%), p = 0.049), and more likely to have wet, flooded, slippery, or uneven road surfaces (high crash risk n = 12 (86%), low crash risk n = 3 (27%), p = 0.005). Pedestrian walkway and factors aiding pedestrian crossing, such as crosswalks, pedestrian traffic lights, and flower beds were more common in high crash risk locations (Table 2). As for high mortality risk; road-related bridges were present in higher fatal crash areas (mortality risk n = 4 (36%), low mortality risk n = 0 (0%), p = 0.026) (Table 2).
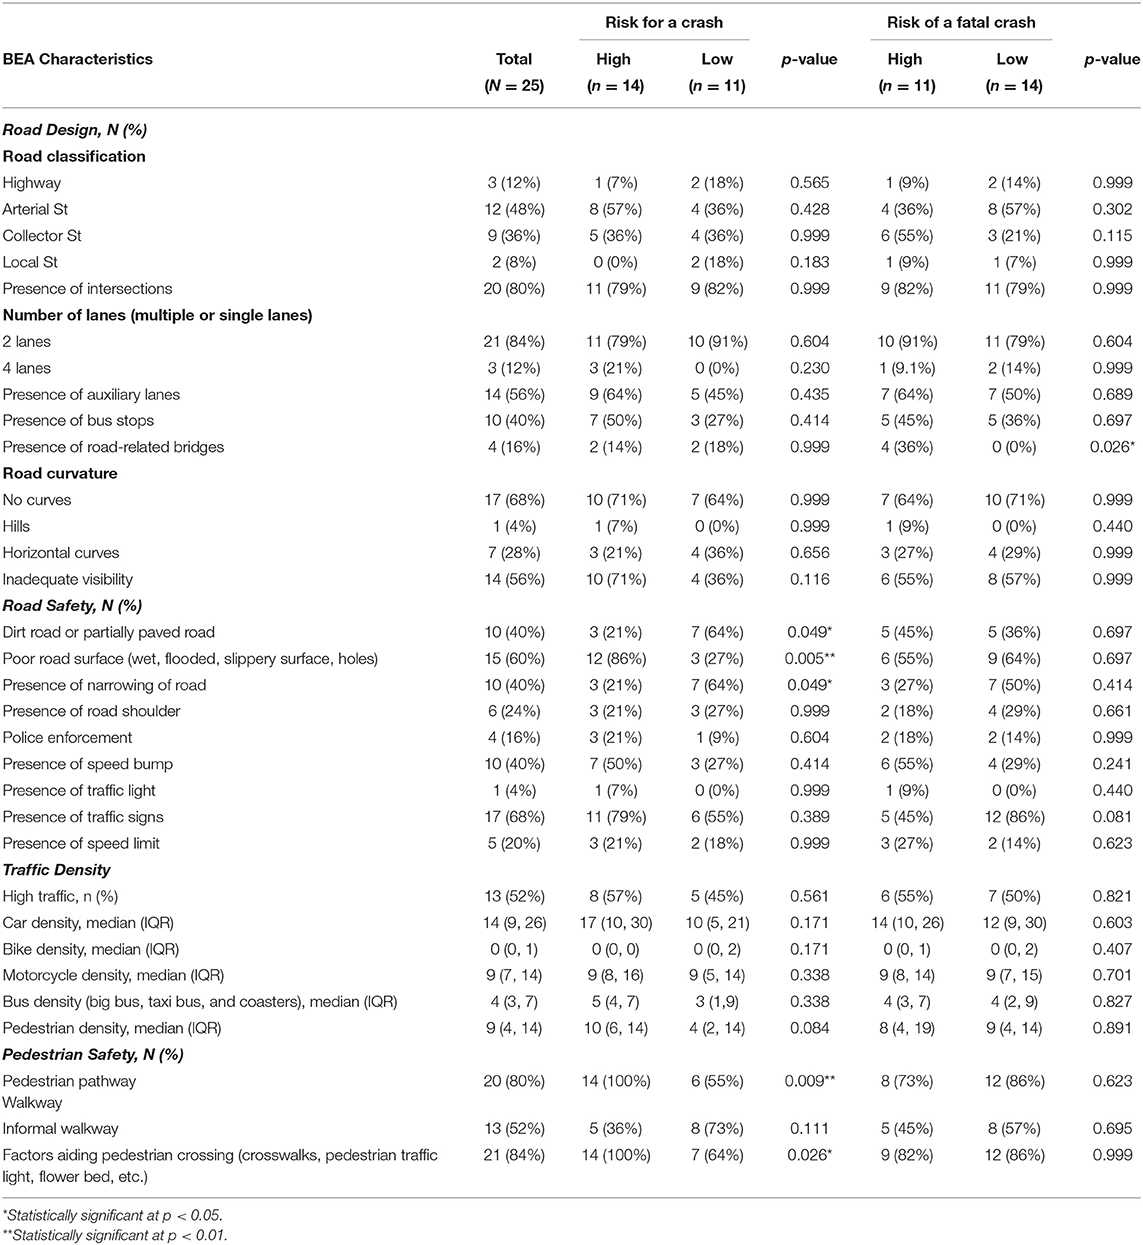
Table 2. Description and association of built environment characteristics and crash risk and mortality risk classifications of road traffic hotspots in Kigali, Rwanda.
Cluster Analysis of RTC Hotspots
We conducted cluster and principal component analysis to group hotspots into three clusters by road characteristics (urban or rural), road safety characteristics, motor vehicle density, and pedestrian safety characteristics (Table 3). Of the three clusters of hotspots, cluster A has the most urban road characteristics, road safety infrastructures, and traffic density. Cluster B hotspots have fewer urban road characteristics compared to cluster A, and the fewest road safety characteristics, lower motor vehicle density, and fewer pedestrian safety conditions. Cluster C hotspots are similar to cluster B; but with more road safety characteristics, greater motor vehicle density, and more pedestrian safety conditions. The three clusters of hotspots showed a similar degree of rural road characteristics but exhibited statistically significant differences in the levels of road safety conditions (p < 0.0001), motor vehicle density (p = 0.0010), and pedestrian safety conditions (p = 0.0083).
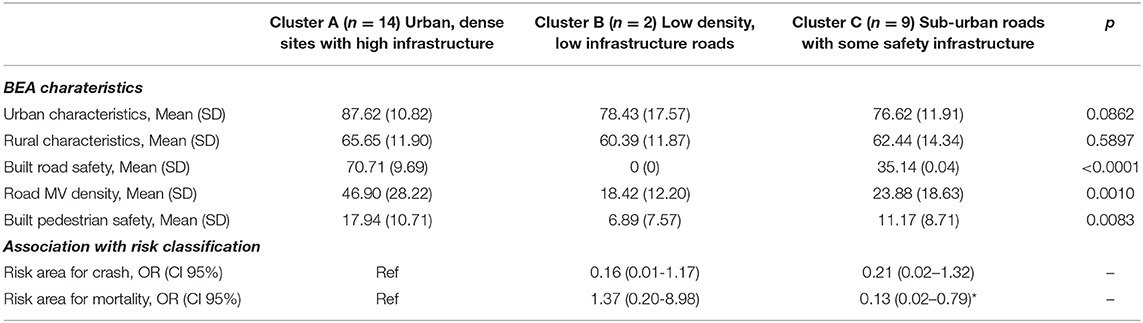
Table 3. Characteristics of built environment clusters and association with risk classification for RTC.
We calculated odds ratios for high crash risk and high mortality risk for clusters B and C hotspots using cluster A as the reference. Cluster B hotspots have a 0.16 times lower odds (95% CI 0.01–1.17) of being a high crash risk location and 1.37 times higher odds (95% CI 0.20–8.98) of being a high mortality risk location compared to cluster A hotspots. Cluster C hotspots have a 0.21 times lower odds (95% CI 0.02–1.32) of being a high crash risk location and 0.13 times lower odds (95% CI 0.02–0.79) of being a high mortality risk location compared to cluster A hotspots. Figure 4 shows the locations of hotspots by built environment clusters.
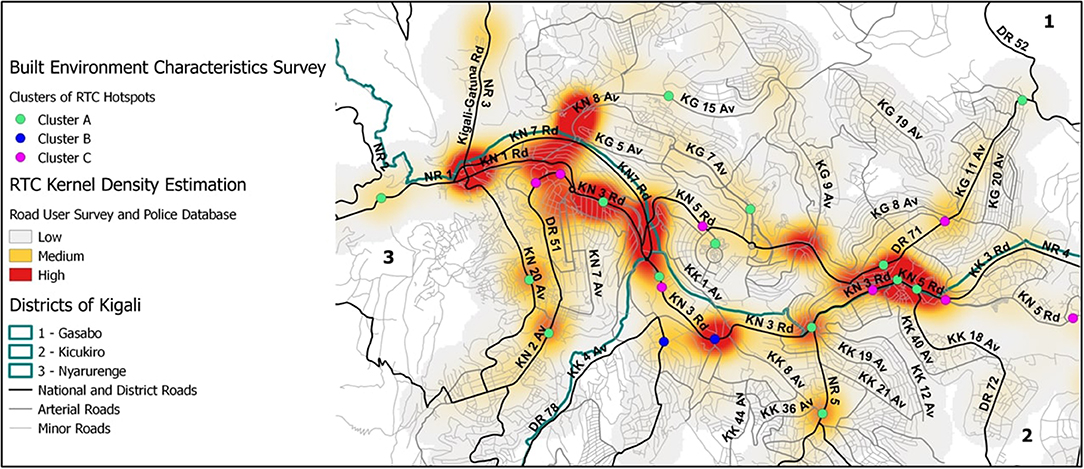
Figure 4. Clustering of RTC hotspots, overlaid with the road network and the RTC kernel density estimation from the combined data from the police and high frequency road user survey. Cluster analysis was used to group RTC hotspots into three clusters based on road characteristics (urban or rural), road safety characteristics, motor vehicle density, and pedestrian safety characteristics at each location. Cluster A hotspots have primarily urban road characteristics with high built road safety conditions, high motor vehicle density, and high built pedestrian safety conditions. Cluster B hotspots have less urban road characteristics, few road safety characteristics, lower motor vehicle density, and less pedestrian safety conditions compared to Cluster A. Cluster C hotspots is similar to Cluster B, but with more road safety characteristics, higher motor vehicle density, and more pedestrian safety conditions.
Discussion
The objective of this study was to characterize the built environments related to road safety at RTC hotspots in Kigali, Rwanda, and to quantify the association between built environment characteristics, crash risk, and mortality risk. To our knowledge, this is one of the first studies integrating spatial analysis and built environment to investigate RTCs in LMICs, and is the first such study in Rwanda. It is also the first study that identifies RTC hotspots through a synthesis of crash locations from police reports and crash-prone locations as described by commercial motorcyclist surveys. Overall, we found that high crash risk locations have urban road characteristics such as paved roads, no narrowing of roads, pedestrian walkways, factors aiding pedestrian crossing, and wet, flooded, slippery, or uneven road surfaces. High mortality risk locations were mostly located in urban areas, at road junctions along national or district roads with high motor vehicle density, and have many road safety and pedestrian safety characteristics, suggesting that speeding is the primary cause of crash risk at these locations. Most crash hotspots were located in sectors that have some of the highest population densities in Kigali City (Rwanda Environment Management Authority, 2013). The majority of the land use in these sectors is residential, with a very small percentage being wetland, commercial areas, public facilities, and government facilities (Rwanda Environment Management Authority, 2013).
Our finding that 82% of fatal crashes occur at intersections suggests that reducing the heightened crash risk at road junctions is critical to decreasing RTCs. This is a trend reflected in other urban regions in China, India, Ethiopia, and Cameroon; though few cities have intersection crash rates as high as Kigali [(Tulu et al., 2017), Injury severity of pedestrians involved in road traffic crashes in Addis Ababa, Ethiopia; (Ponnaluri, 2012), Road traffic crashes and risk groups in India: Analysis, interpretations, and prevention strategies; (Bhatti et al., 2010), Situational factors associated with road traffic crashes: A case-control study on the Yaoundé-Douala road section, Cameroon; (Wang et al., 2015), Prevention of taxi accidents in Xi'an, China: What matters most?]. Similarly, many studies also report that poor road surfaces such as wet, flooded, slippery, or uneven road surfaces contribute to crashes; suggesting that improvements in road condition can reduce crashes due to uneven surfaces or weather-related crashes [(Bhatti et al., 2011), Burden and factors associated with highway work-zone crashes, on a section of the Karachi-Hala Road, Pakistan; (Wang et al., 2015), Prevention of taxi accidents in Xi'an, China: What matters most?; (Matheka et al., 2015; Chen et al., 2016), Identification methods of key contributing factors in crashes with high numbers of fatalities and injuries in China]. Our data supports implementing road narrowing as a potential traffic calming measure to reduce crashes in Kigali. Road narrowing has been demonstrated as an effective road management technique to reduce traffic speed in high income countries, but very few studies have examined the impact of road narrowing in urban areas in low resource settings. One study in Iran showed that road narrowing caused 22,775 injuries and 4.23% of all fatalities in a year [(Lankarani et al., 2014), The impact of environmental factors on traffic accidents in Iran]. More built environment analyses need to be done to assess the impact of road narrowing on RTCs in densely populated areas in LMICs.
We found that roads with the highest mortality risk were in areas with the lowest motor vehicle density and the fewest road safety characteristics, followed by roads in areas with high motor vehicle density and more road safety characteristics. This suggests that exposure to fatal crash risk is impacted by both vehicular density and the number of road safety characteristics. However, in comparing built environment characteristics with respect to high and low mortality risks, the only difference we observed with statistical significance was the presence of road-related bridges. We did observe trends of increased numbers of speed bumps and the presence of speed limits in high mortality hotspots. This suggests that some infrastructure to decrease excessive speed is already in place, though these road safety infrastructures are severely lacking in most road traffic hotspots, marking an opportunity for the city of Kigali to intervene and reduce RTCs. Under-utilized resources to address excessive speed or intersection conflicts in Kigali may include speed limit signs, road traffic signs, police enforcement, speed bumps, and traffic lights.
We found that RTC hotspots identified from the police RTC database and the high frequency road user survey showed a high level of agreement. Supplementing the information collected from the police RTC reports with the road user survey reduces the impact of underreporting or bias in police records. While the extent of underreporting of RTCs in Kigali is unknown, this is a well-known issue in LMICs. Police records commonly miss from 50 to 80% of RTIs and road deaths observed in hospital or morgue data [(Periyasamy et al., 2013), Under reporting of road traffic injuries in the district of Kandy, Sri Lanka; (Chokotho et al., 2013), Assessing Quality of Existing Data Sources on Road Traffic Injuries (RTIs) and Their Utility in Informing Injury Prevention in the Western Cape Province, South Africa; (Qiu et al., 2015), Chinese Traffic Fatalities and Injuries in Police Reports, Hospital Records, and In-depth Records From One City; (Lateef, 2010), Estimation of fatalities due to road traffic crashes in Karachi, Pakistan, using capture-recapture method; (Bhalla et al., 2009), Building national estimates of the burden of road traffic injuries in developing countries from all available data sources: Iran; (Bhalla et al., 2017), Official government statistics of road traffic deaths in India under-represent pedestrians and motorized two wheeler riders; (Hatamabadi et al., 2011), Necessity of an integrated road traffic injuries surveillance system: A community-based study; (Matheka et al., 2015), Road traffic injuries in Kenya: A survey of commercial motorcycle drivers; (Salifu and Ackaah, 2012), Under-reporting of road traffic crash data in Ghana]. In addition to typical causes of underreporting, 15% of available police crash reports were excluded due to insufficient geolocation information, and could not be used for hotspot mapping. Finally, additional police reports were not included due to other unique local conditions such as the report being unavailable due to litigation in process. This condition could induce systematic biases, failing to capture some of the RTCs that resulted in loss of life and severe injuries. While there was good concordance generally between survey and crash report identified RTC hotspot locations, Incorporating the commercial motorcyclist survey allowed us to prospectively collect data prospectively from high road utilizers who are familiar with the crash-prone locations in the city. Police crash reports will, necessarily, fail to capture all of the near-miss crashes that symbolize perhaps the most potentially impactful sites at which interventions could reduce RTIs.
It has been suggested that effective, safe road systems must integrate the four E's of road safety - engineering, education, enforcement, and emergency medical services [(WHO, 2015), Global status report on road safety 2015]. The government of Rwanda has instituted policies and investments in infrastructure to improve road safety conditions. Road user regulations are in place such as seatbelt laws, national speed limits, vehicle inspections, helmet laws, and national anti-drink-driving laws [(WHO, 2015), Global status report on road safety 2015]. The government also requires formal audits for new road construction projects and regular inspection of existing road networks [(WHO, 2015), Global status report on road safety 2015]. There are public awareness campaigns such as National Traffic Week and National Police Week targeting road safety education and the importance of observing road safe behaviors [(Mugisha, 2011), Motorcyclists laud traffic week; (Babijja, 2012), Traffic Week kicks off; (Times Reporter, 2017e), RNP launches campaign to promote road safety; (Times Reporter, 2017b), Police embarks on marking road accident hotspots]. Without question, Rwanda has made valiant efforts to improve the safety of the roads, especially in Kigali. However, a comprehensive, coordinated road safety action plan is notably missing from Rwandan road safety initiatives implemented thus far.
Previously, traffic law enforcement was a challenge due to the under-resourced police and corruption, but in the past decade the government has demonstrated a strong commitment to upholding road safety regulations. Examples include bolstering of the police workforce [(Rwanda National Police, 2013), Strategic Plan 2013-2018], cracking down on corruption [(Times Reporter, 2016d), Corruption is a human right violation, police say; (Gatera, 2013), Police blacklist 100 taxi-motorists; Times (Times Reporter, 2016b), Police partners with stakeholders to curb corruption; (Times Reporter, 2017d), Eight drivers arrested over bribery; (Times Reporter, 2017c), Police explain dismissal of 200 officers], and investing in technology and infrastructure to support law enforcement [(Times Reporter, 2016a), Police launch two more vehicle inspection lanes; (Times Reporter, 2016c), Police launch new highway traffic control mechanism; Times (Times Reporter, 2017a), How the new hi-tech traffic control devices work; (Iradukunda, 2017), Public transporters commit to fast track installation of speed governors]. The goal of this project was to identify RTC hotspots in Kigali through police records and high frequency road users, conduct built environment analysis of these hotspots, and suggest possible interventions to decrease RTCs at these locations. While this analysis highlights associations between built environment characteristics, crash risk, and mortality risk, this study cannot conclude any causal relationships. This study also does not investigate risky road use behaviors associated with built environment characteristics at these crash hotspots. Future studies should incorporate observations to investigate road user behavior such as traffic flow in roundabouts, drivers lane use behaviors, speed near intersections, and pedestrian road crossing behaviors [(Jha et al., 2017), Analysis of pedestrian movement on Delhi roads by using naturalistic observation techniques; (Hatfield and Murphy, 2007), The effects of mobile phone use on pedestrian crossing behavior at signalized and unsignalised intersections; (Johnson et al., 2010), Naturalistic Cycling Study: Identifying Risk Factors for On-Road Commuter Cyclists; (Eenink et al., 2014), UDRIVE: the European naturalistic driving study; (Perumal, 2014), Study on pedestrian crossing behavior at signalized intersections]. Understanding risky road use behaviors can help assess the need for supplemental and improved safety infrastructure, while identifying critical needs in traffic law enforcement and road user behavior modification.
The results of this study should be considered in the context of its limitations. This study was a secondary analysis of crash reports from the Rwanda National Police. Reports were at times not accessible to our research team or did not have information sufficient for RTC geolocation and therefore were not included in the analysis. Possible reasons for the reports not being available include being requested for review by the judicial system or insurance companies. As described previously, police reports also have problems with under-reporting and incomplete reporting. It is impossible to determine whether the missing reports or incomplete reports were occurring at random. The RTC hotspot analysis also could not account for other confounding variables that impact crash risk, such as traffic volume, land use, and vehicle or pedestrian density approaching the hotspots. Another limitation of the study is the lack of built environment diversity among the surveyed hotspots. A majority of the surveyed hotspots were located in urban regions, resulting in similar built environment profiles. Future surveys of built environments of RTC hotspots in Kigali should be tailored to the characteristics, infrastructure, and crash risks associated with densely populated urban centers to further distinguish the built environment profiles of RTC hotspots in urban regions. Finally, the number of RTC hotspots is restricted given the size of the Kigali area. The small number of hotspots are an important limitation to the power of this analysis. To address this issue we included all RTCs in this analysis, aggregated as hotspots and providing the best scenario of BEA variability to our data analysis. In a similar tone, we could not perform subgroup analysis for pedestrians vs. non-pedestrians RTCs. This comparison would provide further clarity of the impact of built environment characteristics on RTCs and RTIs. However, it has been shown previously [(Patel et al., 2016), BMC Public Health] that the number of pedestrian related RTIs is too limited (N = 257) to identify unique hotspots for sequential analysis. Our approach of clustering the hotspots based on their built environment characteristics was chosen to provide an ecological perspective, and illustrate how hotspot characteristics differed when considering pedestrians and non-pedestrians based RTCs.
Conclusions
This study presents a built environment analysis of RTC hotspots in Kigali, Rwanda. Most hotspots were located at intersections of national, district, and arterial roads. We found that characteristics such as paving of roads, road narrowing, slippery or uneven road surfaces are associated with greater crash risk. Pedestrian oriented built environment characteristics such as having crosswalks, pedestrian traffic lights, and informal pedestrian walkways were also associated with greater crash risk. Traffic calming measures such as speed limit signs, road traffic signs, police enforcement, speed bumps, and traffic lights may be under-utilized in Kigali. Although this study identifies potential interventions to reduce RTCs in Kigali, more extensive studies are needed to determine which interventions are most appropriate at each RTC hotspot. Improved geolocation data, attempts to link with hospital RTI reports and digitization of police crash reports could improve the accuracy and precision of conclusions that can be made from similar spatial analyses.
Data Availability Statement
The datasets generated and/or analyzed during the current study are not publicly available due to the requirements of the ethics governing bodies, but are available from the corresponding author on reasonable request.
Ethics Statement
This study was approved by the University Teaching Hospital of Kigali Ethical Committee; Rwandan National Ethics Committee; National Health Research Council of the Ministry of Health of Rwanda; and the Institutional Review Board of Duke University, in Durham, North Carolina. We obtained permission from the commissioner of the Rwanda National Police to collect the police RTC reports from the Kigali Traffic Police. We also obtained permission from the Rwanda Federation of Transport Cooperative (RFTC) to interview motorcycle taxi drivers. The patients/participants provided their written informed consent to participate in this study.
Author Contributions
CS, SR, and EK conceived of the project. CS, SR, LA, and EK advised on the development of the project protocol. EK and SR managed data collection. DW, LA, and JN analyzed the data. JN, DW, and CS interpreted the data and created the first draft of the manuscript. All authors edited and approved of the final manuscript, EK completed extensive revisions after first reviews were received that were approved by authors.
Funding
Funding for this project was from the Duke Global Health Institute and the Global Health Institute of the Fudan University. The authors acknowledge funding for this study from the Fogarty International Center (K01 TW010000-01A1 to CS, R25 TW009887 to EK). The content is solely the responsibility of the authors and does not necessarily represent the official views of the NIH.
Conflict of Interest
The authors declare that the research was conducted in the absence of any commercial or financial relationships that could be construed as a potential conflict of interest.
Acknowledgments
We would like to thank the Rwandan National Police for granting access to records and facilitating data extraction. Additionally, we would like to acknowledge Fidele Byiringiro, MBBS for assisting with training of study staff and reviewing the protocol, our study coordinator Agnes Murebwayire, who trained and supervised other staff, and Cecile Kateretse, research assistant, for coordination of staff. Deepti Agnihotri assessed with manuscript and reference formatting.
Supplementary Material
The Supplementary Material for this article can be found online at: https://www.frontiersin.org/articles/10.3389/frsc.2020.00017/full#supplementary-material
Abbreviations
ANOVA, analysis of variance; GIS, geographic information systems; LMICs, low- and middle-income countries; REDCap, research electronic data capture; RFTC, Rwanda Federation of Transport Cooperative; RTC, road traffic crash; RTI, road traffic injury; WHO, World Health Organization.
References
Abdi, H., and Williams, L. J. (2010). Principal component analysis. Wiley Interdisc. Rev. 2, 433–459. doi: 10.1002/wics.101
Agency, R. T. D. (2016). Rwanda National and District Roads. Retrieved from: http://mininfra-geoinfo.maps.arcgis.com/home/item.html?id=1a00e775142a4cb8abe4d89015272883#overview (accessed April 1, 2020).
Anderson, T. K. (2009). Kernel density estimation and K-means clustering to profile road accident hotspots. Acc. Anal. Prevent. 41, 359–364. doi: 10.1016/j.aap.2008.12.014
Asiimwe, B. (2011, 30 May). 72% of road accidents occur in Kigali. The NewTimes. Available online at: http://www.newtimes.co.rw/section/article/2011-05-30/31637/.
Babijja, S (2012, 20 November). Traffic Week kicks off. The NewTimes. Available online at: http://www.newtimes.co.rw/section/read/59914/ (accessed February 27, 2020).
Bhalla, K., Khurana, N., Bose, D., Navaratne, K. V., Tiwari, G., and Mohan, D. (2017). Official government statistics of road traffic deaths in India under-represent pedestrians and motorized two wheeler riders. Injury Prevent. 23, 1–7. doi: 10.1136/injuryprev-2016-042053
Bhalla, K., Naghavi, M., Shahraz, S., Bartels, D., and Murray, C. J. L. (2009). Building national estimates of the burden of road traffic injuries in developing countries from all available data sources: Iran. Injury Prevent. 15, 150–156. doi: 10.1136/ip.2008.020826
Bhatti, J. A., Razzak, J. A., Lagarde, E., and Salmi, L. R. (2011). Burden and factors associated with highway work-zone crashes, on a section of the Karachi-Hala Road, Pakistan. Injury Prevent. 17, 79–83. doi: 10.1136/ip.2010.027532
Bhatti, J. A., Sobngwi-Tambekou, J., Lagarde, E., and Salmi, L. R. (2010). Situational factors associated with road traffic crashes: a case-control study on the Yaoundé-Douala road section, Cameroon. Int. J. Injury Control Safety Promot. 17, 215–222. doi: 10.1080/17457301003728510
Bíl, M., Andrášik, R., and Janoška, Z. (2013). Identification of hazardous road locations of traffic accidents by means of kernel density estimation and cluster significance evaluation. Acc. Anal. Prevent. 55, 265–273. doi: 10.1016/j.aap.2013.03.003
Bithell, J. F. (1990). An application of density estimation to geographical epidemiology. Stat. Med. 9, 691–701.
Chandran, A., Hyder, A. A., and Peek-Asa, C. (2010). The global burden of unintentional injuries and an agenda for progress. Epidemiol. Rev. 32, 110–120. doi: 10.1093/epirev/mxq009
Chen, Y., Li, Y., King, M., Shi, Q., Wang, C., and Li, P. (2016). Identification methods of key contributing factors in crashes with high numbers of fatalities and injuries in China. Traffic Injury Prevent. 17, 878–883. doi: 10.1080/15389588.2016.1174774
Chokotho, L. C., Matzopoulos, R., and Myers, J. E. (2013). Assessing quality of existing data sources on road traffic injuries (RTIs) and their utility in informing injury prevention in the Western Cape Province, South Africa. Traffic Injury Prevent. 14, 267–273. doi: 10.1080/15389588.2012.706760
Eenink, R., Barnard, Y., Baumann, M. R. K., Augros, X., and Utesch, F. (2014). “UDRIVE: the European naturalistic driving study,” in Proceedings of Transport Research Arena. TRA 2014 (Paris: IFSTTAR).
Enumah, S., Scott, J. W., Maine, R., Uwitonze, E., D'Arc Nyinawankusi, J., Riviello, R., and Jayaraman, S. (2016). Rwanda's model prehospital emergency care service: a two-year review of patient demographics and injury patterns in kigali. Prehosp. Disaster Med. 31, 614–620. doi: 10.1017/S1049023X16000807
Ewing, R., and Dumbaugh, E. (2009). The built environment and traffic safety: a review of empirical evidence. CPL Bibliograp. 23, 347–367. doi: 10.1177/0885412209335553
Gatera, G. (2013, 20 April). Police blacklist 100 taxi-motorists. The NewTimes. Available online at: http://www.newtimes.co.rw/section/read/65039/ (accessed April 1, 2020).
Harris, P. A., Taylor, R., Thielke, R., Payne, J., Gonzalez, N., and Conde, J. G. (2009). Research electronic data capture (REDCap)-A metadata-driven methodology and workflow process for providing translational research informatics support. J. Biomed. Inform. 42, 377–381. doi: 10.1016/j.jbi.2008.08.010
Hatamabadi, H. R., Vafaee, R., Haddadi, M., Abdalvand, A., and Soori, H. (2011). Necessity of an integrated road traffic injuries surveillance system: a community-based study. Traffic Injury Prevent. 12, 358–362. doi: 10.1080/15389588.2011.566656
Hatfield, J., and Murphy, S. (2007). The effects of mobile phone use on pedestrian crossing behaviour at signalised and unsignalised intersections. Acc. Anal. Prevent. 39, 197–205. doi: 10.1016/j.aap.2006.07.001
Institute for Health Metrics and Evaluation (IHME), I. f. H. M. a. E. (2015). GBD Compare Data Visualization. University of Washington. Retrieved from: http://vizhub.healthdata.org/gbd-compare (accessed April 1, 2020).
Iradukunda, A. V. (2017, 07 April). Public transporters commit to fast track installation of speed governors. The NewTimes. Available online at: http://www.newtimes.co.rw/section/read/210257/ (accessed March 17, 2020).
Jha, A., Tiwari, G., Mohan, D., Mukherjee, S., and Banerjee, S. (2017). Analysis of pedestrian movement on Delhi roads by using naturalistic observation techniques. Transp. Res. Rec. 2634, 95–100. doi: 10.3141/2634-14
Johnson, M., Charlton, J., Oxley, J., and Newstead, S. (2010). Naturalistic cycling study: identifying risk factors for on-road commuter cyclists. Ann. Adv. Automot. Med. 54, 275–283.
Kim, W. C., Byiringiro, J. C., Ntakiyiruta, G., Kyamanywa, P., Irakiza, J. J., Mvukiyehe, J. P., et al. (2016). Vital statistics: estimating injury mortality in kigali, rwanda. World J. Surg. 40, 6–13. doi: 10.1007/s00268-015-3258-3
Lankarani, K. B., Heydari, S. T., Aghabeigi, M. R., Moafian, G., Hoseinzadeh, A., and Vossoughi, M. (2014). The impact of environmental factors on traffic accidents in Iran. J. Injury Viol. Res. 6, 64–71. doi: 10.5249/jivr.v6i2.318
Lateef, M. U. (2010). Estimation of fatalities due to road traffic crashes in Karachi, Pakistan, using capture-recapture method. Asia Pac. J. Public Health 22, 332–341. doi: 10.1177/1010539509356808
Matheka, D. M., Omar, F. A., Kipsaina, C., and Witte, J. (2015). Road traffic injuries in Kenya: A survey of commercial motorcycle drivers. Pan Afr. Med. J. 21:17. doi: 10.11604/pamj.2015.21.17.5646
Miranda-Moreno, L. F., Morency, P., and El-Geneidy, A. M. (2011). The link between built environment, pedestrian activity and pedestrian–vehicle collision occurrence at signalized intersections. Acc. Anal. Prevent. 43, 1624–1634. doi: 10.1016/j.aap.2011.02.005
Mugisha, S. (2011, 11 June). Motorcyclists laud traffic week. The NewTimes. Available online at: http://www.newtimes.co.rw/section/read/31997/ (accessed March 1, 2020).
National Institutes of Statistics of Rwanda (2014). Statistical Yearbook. Available online at: http://www.statistics.gov.rw/publication/statistical-yearbook-2014 (accessed December 5, 2019).
National Institutes of Statistics of Rwanda (2017). Statistical Yearbook. Available online at: http://www.statistics.gov.rw/publication/statistical-yearbook-2017 (accessed December 5, 2019).
OpenStreetMap contributors (2015). Available online at: https://www.openstreetmap.org/copyright (accessed on November 1, 2019).
Patel, A., Krebs, E., Andrade, L., Rulisa, S., Vissoci, J. R., and Staton, C. A. (2016). The epidemiology of road traffic injury hotspots in Kigali, Rwanda from police data. BMC Pub. Health 16:697. doi: 10.1186/s12889-016-3359-4
Periyasamy, N., Lynch, C. A., Dharmaratne, S. D., Nugegoda, D., and Østbye, T. (2013). Under reporting of road traffic injuries in the district of Kandy, Sri Lanka. BMJ Open 3:e003640. doi: 10.1136/bmjopen-2013-003640
Perumal, V. (2014). Study on pedestrian crossing behavior at signalized intersections. J. Traffic Transport. Eng. 1, 103–110. doi: 10.1016/S2095-7564(15)30094-5
Petroze, R. T., Mumararungu, A., Ndayiragije, V., Ntakiyiruta, G., Kyamanywa, P., Reid, J., and Byiringiro, J. C. (2014). Patterns of injury at two university teaching hospitals in rwanda: baseline injury epidemiology using the rwanda injury registry. Rwanda Med. J. 71, 5–8. Retrieved from: https://www.scopus.com/inward/record.uri?eid=2-s2.0-84922022732&partnerID=40&md5=445d9be8fd922f72e0a9ee1dedf82930
Plug, C., Xia, J. C., and Caulfield, C. (2011). Spatial and temporal visualization techniques for crash analysis. Acc. Anal. Prevent. 43, 1937–1946. doi: 10.1016/j.aap.2011.05.007
Ponnaluri, R. V. (2012). Road traffic crashes and risk groups in India: analysis, interpretations, and prevention strategies. IATSS Res. 35, 104–110. doi: 10.1016/j.iatssr.2011.09.002
Qiu, J., Zhou, J., Zhang, L., Yao, Y., Yuan, D., Shi, J., and Evans, L. (2015). Chinese traffic fatalities and injuries in police reports, hospital records, and in-depth records from one city. Traffic Injury Prevent. 16, 565–570. doi: 10.1080/15389588.2014.973946
Reardon, J., Andrade, L., Hertz, J., Kiwango, G., Teu, A., Pesambili, M., et al. (2017). The epidemiology and hotspots of road traffic injuries in Moshi, Tanzania: an observational study. Injury 48:1363–1370. doi: 10.1016/j.injury.2017.05.004
Rwanda Environment Management Authority (2013). Available online at: https://www.rema.gov.rw/index.php?id=39 (accessed November 12, 2019).
Rwanda National Police (2013) Available online at: https://police.gov.rw/uploads/tx_download/RNP_A5_Booklet_FINAL_2015.pdf (accessed on November 20, 2019).
Salifu, M., and Ackaah, W. (2012). Under-reporting of road traffic crash data in Ghana. Int. J. Injury Control Safety Promo. 19, 331–339. doi: 10.1080/17457300.2011.628752
Samuel, J. C., Sankhulani, E., Qureshi, J. S., Baloyi, P., Thupi, C., Lee, C. N., and Charles, A. G. (2012). Under-reporting of road traffic mortality in developing countries: application of a capture-recapture statistical model to refine mortality estimates. PLoS ONE 7:e31091. doi: 10.1371/journal.pone.0031091
Schurman, N., Cinnamon, J., Crooks, V. A., and Hameed, S. M. (2009). Pedestrian injury and the built environment: an environmental scan of hotspots. BMC Pub. Health 9:233. doi: 10.1186/1471-2458-9-233
Staton, C. A., De Silva, V., Krebs, E., Andrade, L., Rulisa, S., Mallawaarachchi, B. C., and Østbye, T. (2016). High road utilizers surveys compared to police data for road traffic crash hotspot localization in Rwanda and Sri Lanka. BMC Pub. Health 16:53. doi: 10.1186/s12889-015-2609-1
Team, Q. G. D. (2017). Quantum GIS Geographic Information System. Open Source Geospatial Foundation Project.
Times Reporter (2016a, 07 October). Police launch two more vehicle inspection lanes. The NewTimes. Available online at: http://www.newtimes.co.rw/section/read/204230/ (accessed March 8, 2020).
Times Reporter (2016b, 11 December). Police partners with stakeholders to curb corruption. The NewTimes. Available online at: http://www.newtimes.co.rw/section/read/206158/ (accessed March 13, 2020).
Times Reporter (2016c, 27 August). Police launch new highway traffic control mechanism. The NewTimes. Available online at: http://www.newtimes.co.rw/section/read/202995/ (accessed February 23, 2020).
Times Reporter (2016d, 27 October). Corruption is a human right violation, police say. The NewTimes. Available online at: http://www.newtimes.co.rw/section/read/204806/ (accessed March 22, 2020).
Times Reporter (2017a, 02 February). How the new hi-tech traffic control devices work. The NewTimes. Available online at: http://www.newtimes.co.rw/section/read/207628/ (accessed March 20, 2020).
Times Reporter (2017b, 02 June). Police embarks on marking road accident hotspots. The NewTimes. Available online at: http://www.newtimes.co.rw/section/read/213553/ (accessed February 16, 2020).
Times Reporter (2017c, 06 February). Police explain dismissal of 200 officers. The NewTimes. Available online at: http://www.newtimes.co.rw/section/read/207738/ (accessed February 25, 2020).
Times Reporter (2017d, 16 January). Eight drivers arrested over bribery. The NewTimes. Available online at: http://www.newtimes.co.rw/section/read/207129/ (accessed March 11, 2020).
Times Reporter (2017e, 24 May). RNP launches campaign to promote road safety. The NewTimes. Available online at: http://www.newtimes.co.rw/section/read/213031/ (accessed March 4, 2020).
Tulu, G. S., Washington, S., Haque, M. M., and King, M. J. (2017). Injury severity of pedestrians involved in road traffic crashes in Addis Ababa, Ethiopia. J. Transport. Safety Security 9, 47–66. doi: 10.1080/19439962.2016.1199622
Vissoci, J. R. N., de Oliveira, L. P., Gong, E., El Gabri, D., Toomey, N., Ginalis, E., et al. (2018). Validation of a tool to conduct a built environment analysis in a low income country setting. PsyArXiv. doi: 10.31234/osf.io/xuefw
Wang, Y. G., Li, M., Du, J., and Mao, C. (2015). Prevention of taxi accidents in Xi'an, China: what matters most? Central Eur. J. Pub. Health 23, 77–83. doi: 10.21101/cejph.a3931
WHO (2015). Global Status Report on Road Safety 2015 (9241565063). Geneva. Available online at: http://www.who.int/violence_injury_prevention/road_safety_status/2015/en/
World Health Organization (2018). Global Status Report on Road Safety 2018: Summary. World Health Organization.
Keywords: road, traffic, crash, injury, Rwanda, hotspot, built-environment, LMIC
Citation: Wang D, Krebs E, Nickenig Vissoci JR, de Andrade L, Rulisa S and Staton CA (2020) Built Environment Analysis for Road Traffic Crash Hotspots in Kigali, Rwanda. Front. Sustain. Cities 2:17. doi: 10.3389/frsc.2020.00017
Received: 06 December 2019; Accepted: 17 April 2020;
Published: 05 June 2020.
Edited by:
Krzysztof Goniewicz, Military University of Aviation, PolandReviewed by:
Carmen Forciniti, University of Calabria, ItalyGiuseppe Loprencipe, Sapienza University of Rome, Italy
Copyright © 2020 Wang, Krebs, Nickenig Vissoci, de Andrade, Rulisa and Staton. This is an open-access article distributed under the terms of the Creative Commons Attribution License (CC BY). The use, distribution or reproduction in other forums is permitted, provided the original author(s) and the copyright owner(s) are credited and that the original publication in this journal is cited, in accordance with accepted academic practice. No use, distribution or reproduction is permitted which does not comply with these terms.
*Correspondence: Catherine A. Staton, Y2F0aGVyaW5lLnN0YXRvbkBkdWtlLmVkdQ==