 Anna Labetski
 Antony Chum
- 13D Geoinformation Group, Delft University of Technology, Delft, Netherlands
- 2Department of Applied Health Sciences, Brock University, St. Catharines, ON, Canada
Introduction: Approximately 2,552 individuals were killed or seriously injured through cycling accidents in the Greater London Area between 2010 and 2015. The purpose of this study is to investigate a wide range of built environmental correlates of cycling accidents resulting in KSI so that we can identify potential areas for targeted interventions.
Methods: We performed a cross-sectional analysis to examine the association between serious cycling injuries (2010-15), using road segment as the unit of analysis, and a wide range of built environmental characteristics. Multilevel models were used to account for potential spatial clustering.
Results: Serious cycling injuries were independently associated with higher commercial and residential densities, higher distance to speed camera, higher bus, car, and 2-wheeled (motorcycle and moped) traffic, and higher density of alcohol outlets. Greenspace was associated with decreased odds of injuries up to the 3rd quartile, but roads adjacent to the highest levels of green space (4th quartile) had increased odds of injuries. Findings from our study point to the potential of urban planning interventions to reduce serious cycling injuries (e.g., speed cameras, improving safety near alcohol outlets and in parks, and recreational areas, etc.). Further research using quasi-experimental approaches is required to evaluate whether the implementation of interventions leads to injury reductions.
1. Introduction
Policies to promote cycling has been taken up as a priority investment area for urban transformation across many local governments in Europe and North America. The benefits of cycling are well-documented in the public health literature: a review to assess the health impact of cycling found consistent evidence of a positive dose-response gradient between the amount of cycling and cardiovascular fitness for observational and intervention studies (Oja et al., 2011). However, cyclists also have an increased exposure to road accidents (De Hartog et al., 2010), and research to investigate the environmental determinants of cycling accidents can help to maximize the benefits of cycling by addressing risks associated with injuries.
Prior studies have investigated various types of built environmental correlates of cycling injuries, and have studied the relative levels of risk associated with (1) various route and intersection types (e.g., major streets, local roads, roundabouts, and signalized vs. non-signalized intersections) (Reynolds et al., 2009; Zahabi et al., 2011; Teschke et al., 2012; Hollingworth et al., 2015; Kaplan and Giacomo Prato, 2015; Polders et al., 2015), (2) presence and types of cycling infrastructures (e.g., on-road shared cycling routes, marked bike lanes, separated cycle paths via barrier, etc.) (Reynolds et al., 2009; Teschke et al., 2012; Pedroso et al., 2016; Pucher and Buehler, 2016), (3) land uses (e.g., density of retail establishments, residential/population density, industrial density, and proximity to parks) (Wedagama et al., 2006; Zahabi et al., 2011; Romanow et al., 2012; Kaplan and Giacomo Prato, 2015; Chen and Shen, 2016), (4) environmental factors affecting levels of visibility (e.g., slope, street lighting, and sinuosity) (Zahabi et al., 2011; Dozza and Werneke, 2014; Chen and Shen, 2016), and (5) traffic volume and proportion of cyclists to total traffic (Vandenbulcke et al., 2009; Jacobsen, 2015; Kaplan and Giacomo Prato, 2015; Elvik and Bjørnskau, 2017).
Some consistent patterns are emerging from this literature. A review of 23 studies investigating the association between transportation infrastructure and on-road cycling accidents (Reynolds et al., 2009) have identified a range of risk factors including multi-lane roundabouts, multi-use trails, and major roads (as compared to minor roads), while purpose-built cycling infrastructure including on-road bike routes and marked bike lanes have a significant protective effect. With regards to risk factors related to land use, some studies have found that commercial density, proximity to city-center, and industrial land use are associated with cycling accidents (Wedagama et al., 2006; Kaplan and Giacomo Prato, 2015); while another study found that the presence of parks, land use mix, and residential density had no influence on cycling injuries (Robinson, 2005). Lastly, a meta-analysis of 26 studies found consistent evidence that a high proportion of cyclists to total traffic had a protective effect (Elvik and Bjørnskau, 2017).
The purpose of this paper is to extend the literature on built environmental determinants of cycling accidents through an exploratory and descriptive study focusing on the associations between KSI risk and a full range of built environmental factors—including factors that were previously understudied or unique to the London context. Our study is intended to support London's Vision Zero Action Plan (Transport for London, 2018b) to eliminate road accidents leading to deaths and serious injuries. By quantifying the risk of a wide range of built environmental features associated with KSI, our study is aimed at identifying built environments for targeted interventions. In the next section, we outline some unique risk factors in the London context.
In cities across the UK, the rapidly growing market for on-demand food and cargo deliveries (where many workers rely on motorized 2-wheeled vehicles, i.e., motorcycles and mopeds) has prompted agencies, including Transport for London and the European Agency for Safety and Health at work, to call for additional studies to investigate the potential risks associated with using 2-wheeled motor vehicles, and risks posed to other road users (Baverstock et al., 2007; European Union OSHA, 2010; Transport for London, 2018a). In 2014, 9% of injuries to pedestrians on London's roads involved a motorcycle, which is surprisingly high considering the low modal share of motorcycles (Greater London Authority, 2016). In the UK, individuals aged 17 and above may obtain a provisional motorcycle license through a one-day compulsory basic training (with no practical or theoretical examination requirements) to ride a 2-wheeled motor vehicle up to 125 cc on public roads. Existing drivers (with any valid driver's license) are allowed to ride mopeds with a maximum speed of 50 km/h (UK Government). While the UK graduated motorcycle licensing pathway requires multiple tests toward riding larger capacity and faster motorcycles, Transport for London have noted the paucity of research related to the impact of growing demand for 2-wheeled motor vehicles given the relatively low barrier to become a beginner rider in the context of the growing demand for food and parcel delivery jobs. Since cyclists and motorcyclists often share the same physical space on the road (e.g., cycling lanes), there is a need to clarify the level of association between increased motorcycle traffic and KSI cycling accidents.
While a growing body of literature finds that speed cameras are associated with reductions in motor vehicle speeds and collisions (Delaney et al., 2005; Tay, 2010; De Pauw et al., 2014), no prior studies have addressed its association with cycling accidents. Moreover, the use of speed cameras is controversial and generally suffers from low public acceptance (Centre for Disease Control and Prevention, 2019). Opponents have argued that cameras invade privacy, are unable to denote when moderate speeding might be a safer option, or they question the reliability of the camera equipment (Delaney et al., 2005). In many jurisdictions, these arguments have led to government action to abolish the use of speed cameras (Associated Press, 2019; Bellefontaine and Riebe, 2019). Given the controversies around speed camera technology and the pervasiveness of speed cameras in the London context, it is important to generate evidence of its impact on cyclist KSI, which may help to inform current political debates.
Finally, given that public alcohol consumption is legal in England, the impact of pubs and bars on local levels of overcrowding (exacerbated by outdoor smoking) and anti-social behaviors is a salient concern in many London neighborhoods, and a potential risk factor for cycling accidents. While a growing number of cross-sectional and panel studies have noted the elevated independent risk associated with alcohol outlet density and motor vehicle accidents at the neighborhood level, relatively fewer studies have studied the association of alcohol outlets and cycling accidents, and none in the highly urbanized London context with its unique pubs and drinking culture.
To address these policy relevant concerns, we developed our descriptive/exploratory study to address the following research question: what is the cross-sectional association between the risk of KSI cycling accidents and built environmental risk factors? These risk factors include commercial density, green space density, population density, road type, traffic volume by vehicle type, cyclist numbers, cyclist as a proportion of total traffic, proximity to speed cameras, and proximity to alcohol outlets.
2. Methods
2.1. Dependent Variable: KSI Cycling Accidents
Cycling accidents data for the years 2010-2015 were obtained from Transport for London and included reports of 2552 KSI cycling accidents. Transport for London manages its traffic and accidents data through the ACCSTATS database, which is updated through the UK national Police accidents records. We used road segments (obtained from the Ordnance Survey) as the unit of analysis in our study, and covered a total of n = 233,549 road segments across the Greater London Area (excluding motorways/highways without any cycling traffic). Unlike minor accidents, KSI accidents are almost always represented in official statistics since police and ambulatory services are involved. Since KSI accidents are rare events, i.e., over the period of 2010-2015, the majority of road segments did not have any KSI accidents (98.9%) with only 1.03% with 1 accident, and 0.07% associated with 2 or more accidents, we have created a binary outcome variable (i.e., no accidents vs. at least one KSI accident).
2.2. Independent Variables: Built Environmental Predictors
To capture the complexity of the urban built environment, we examine the effects of a wide range of built environmental and socio-environmental characteristics, which include land use (i.e., green space and commercial density), alcohol establishments, proximity to speed cameras, population density, road type (e.g., dual carriageway, single carriageway, roundabouts, slip roads, traffic island link, traffic island link at junction), traffic volume (separate for motorcycle, car, large/heavy goods vehicles, and cyclists), and the proportion of cycle traffic to motor traffic. Sample characteristics and cross-tabulations with KSI cycling accidents is summarized in Table 1.
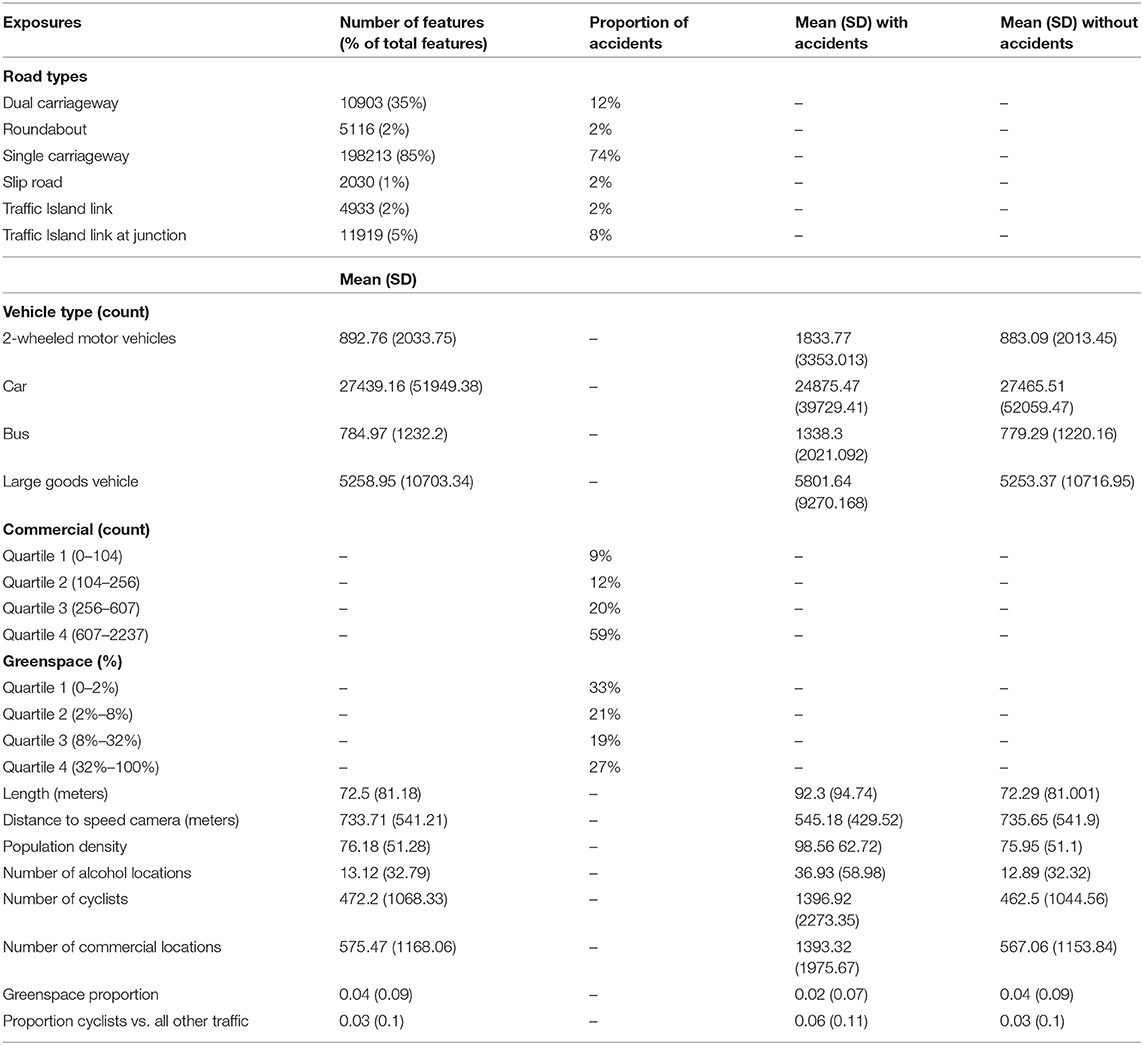
Table 1. Sample characteristics and cross-tabulations with KSI cycling accidents.
Given that the relationship between greenspace and cycling accidents has been examined in previous studies (Maas et al., 2008), it was included in our statistical model. Greenspace data was obtained from Greenspace Information for Greater London. We calculated the proportion of greenspace within 750 m of each road segment, which corresponds to the average 10-min walking distance and is considered an appropriate distance for examining land use density (Staricco and Vitale Brovarone, 2018). When we examined the relationship between greenspace and cycling KSIs graphically, we found that the relationship was potentially non-linear, and thus quartiles were used (instead a continuous variable) in our statistical model. Commercial density was obtained from the Ordnance Survey Points of Interest and were summed within a 750 m buffer of the road segment. Quartiles were also used to represent this data to detect potential non-linear effects. Data for alcohol outlets (i.e., any location that serves or sells alcohol) came from OpenStreetMap data, and were summed in the 750 m buffer of each road segment.
Traffic flow data were accessed from the Department for Transport for average annual traffic between 2000 and 2010 and were based on traffic monitoring points. London has 2791 traffic count points and an additional 300 automatic traffic counters. Annual traffic based on a wide time interval was used to ensure seasonality effects would be accounted for in the model (e.g., winter vs. summer traffic, occasional and rare sports events, etc.). Based on Euclidean distance the counts from the nearest traffic monitoring point were assigned to road segments based on the type of road and was divided based on vehicle type. Traffic flows are defined as the million vehicle kilometers traveled on a road in a year and using a year's worth of data helps smooth many temporal variations in traffic. This method of estimating traffic flow has been validated and used in other studies in road accident research.
Using Department for Transport data, network distance was also used to calculate proximity to the nearest speed camera (for the year 2014) based on the centroid of each road segment. Population density was calculated for each individual LSOA based on the 2011 Census, and was joined to the road segments. For road segments that are on the boundaries of two LSOAs, the average population density was calculated.
2.3. Statistical Method
To account for spatial dependence (e.g., road segments are clustered into neighborhoods that may be affected by a common set of neighborhood attributes such as land use, population density, or traffic volume), multilevel modeling is used to account for the spatial autocorrelation of KSI. In our multilevel model, our level 1 units (233,549 road segments) are nested within level-2 groups (neighborhoods proxied by 4671 UK census LSOAs for the Greater London Area), and random intercepts are included that allow each neighborhood context to vary (Larsen and Merlo, 2005). Borough fixed effects (k-1 dummy variables representing the 32 London Boroughs) is included to account for between-neighborhood spatial autocorrelation. This method was chosen since London boroughs have control over many aspects of their local transport planning strategy (e.g., parking fines and rules for bus lanes) and the regional fixed-effect can adjust for these similarities across adjacent LSOAs within the same local government. The fixed-effect coefficients also have the added benefit of estimating the relative odds of KSI associated with cycling in each borough. Given that the dependent variable has a binomial distribution, where probability of getting one or more KSI accident can be modeled using multilevel logistic regression (through a logit link function) summarized as:
where the ith road segment is nested in the jth neighborhood, β0 is the intercept (with u0j random intercept), and β1 is the slope of road-segment specific independent variable X. The models were estimated using the R package lme4 (version 1.1-23) in RStudio.
3. Results
Over the period of 2010-2015, 2552 KSI accidents were recorded across the Greater London Area, (Figure 1). Table 2 provides descriptive statistics of the proportion of road segments with KSI accidents for each of the socio-environmental exposures studied in our paper. Based on unadjusted cross-tabulations, higher 2-wheeled motor vehicle and car traffic counts, higher density of alcohol outlets, and higher commercial and population densities appear to contribute to accident risk.
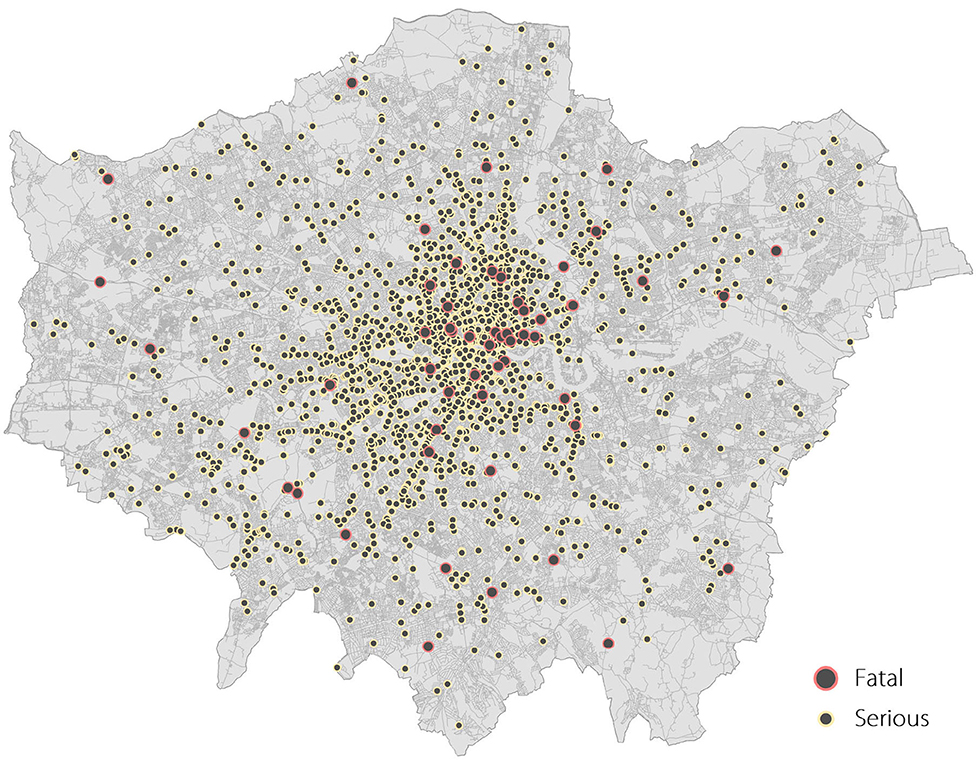
Figure 1. Location of KSI Cycling Accidents, 2010–2015.
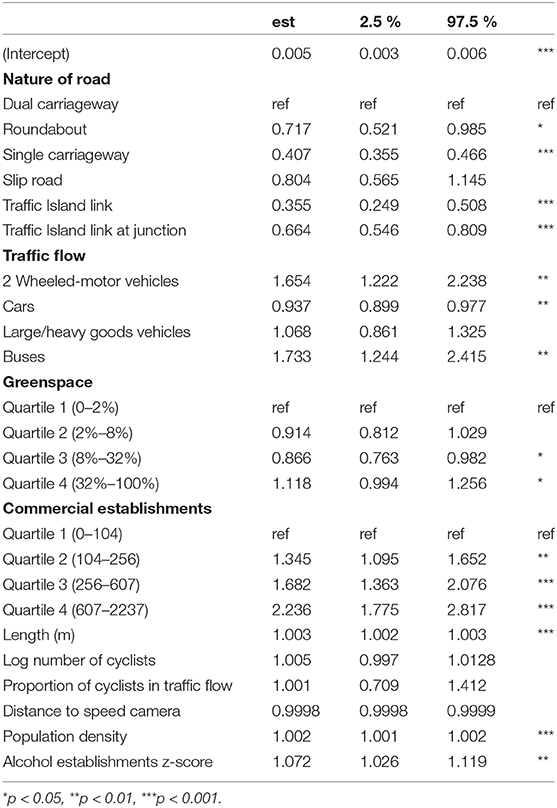
Table 2. Multilevel logistic regression model: factors associated with serious cycling accidents.
Figure 2 is a forest plot that presents the results of our mixed-effect logistic regression results predicting the risk of 1+ KSI cycling accidents for road segments. Adjusted intraclass correlation of the model was 0.082, which means that approximately 8.2% of the variations of the outcome could be explained at the LSOA level. Compared to dual carriageways (reference group), roundabouts have 28% lower odds of KSI (OR 0.72, 95% CI 0.52–0.99), and single carriageways have 59% lower odds of KSI (OR 0.41, 95% CI 0.36–0.47). As expected, longer roads have greater odds of KSI compared to shorter roads, with each additional meter of road increasing the odds of KSI by 0.3% (95% CI 1.002–1.003). Each 10,000 additional two-wheeled motor vehicle traffic per year increases the odds of KSI by 65% (OR 1.65, 95% CI 1.22–2.24). Commercial density has a dose-effect relationship with KSI: compared to areas with the lowest commercial density (Q1), roads in Q2 have a 35% increased odds of KSI (95% CI 1.1–1.65), roads in Q3 have a 68% increased odds of KSI (95% CI 1.36–2.08), and roads in the highest commercial density areas (Q4) have a 124% higher odds of KSI (95% CI 1.78–2.82). The association between greenspace appears to be non-linear: compared to roads in areas with the lower greenspace density (Q1), roads in Q2 have a similar odds of KSI (95% CI 0.81–1.03), roads in Q3 have 13% decreased odds of KSI (95% CI 0.76–0.98), but roads in areas with the highest greenspace have 12% increased odds of KSI (95% CI 0.99–1.26). Population density has a positive association with KSI, where an addition of 1,000 people/km2 increases the odds of KSI by 0.2% (95% CI 1.001–1.002). An increase of 1 standard deviation in the number of alcohol outlets (where 1 standard deviation is 32.79) increases odds of KSI by 7% (OR 1.07, 95% CI 1.03–1.12). Each 10,000 additional bus traffic per year increases the odds of KSI by 73% (OR 1.73, 95% CI 1.2–2.42). The proportion of cyclists to all traffic is not associated with KSIs.
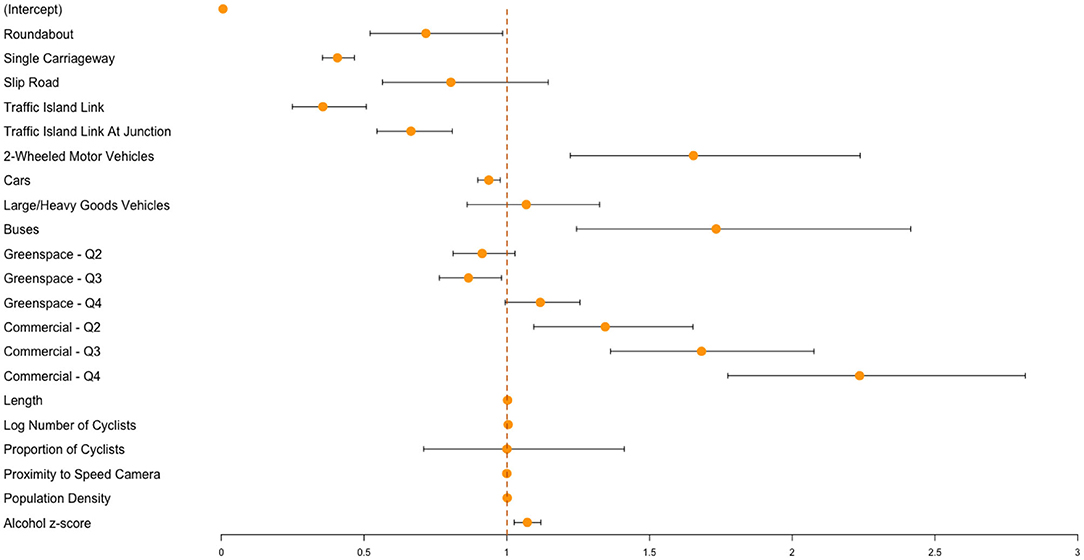
Figure 2. Odd ratios of at least 1 KSI accident with 95% confidence interval (dotted line) for selected social and environmental factors.
4. Discussion and Future Work
Our study provides evidence that reinforce findings from previous studies, including risks associated with road characteristics, i.e., higher risk of KSI on dual carriageways and lower on roundabouts and single carriageways (Yau et al., 2006) and land use characteristics, i.e., higher in commercial and residential dense areas (Spoerri et al., 2011). Our study also confirms previous findings that higher car and bus traffic had a positive association with cycling accidents. Since the majority of bus lanes in London are also designated as official cycling lanes (Transport for London, 2020), specific mechanisms of how buses impact cycling accidents, including the role of shared bus and cycling lanes, should be investigated in future research. Furthermore, with the push by Transport for London and the mayor's office of London to increase cycling in the city, it is worth studying the impact on bus journey times and the potential increase in delays due to cyclists and buses sharing the same lanes (Aldred et al., 2019). We would like to further highlight that we use the term accidents since it is the official term from the UK national Police accidents records—but it does not imply that these are unavoidable.
Given the exploratory nature of this study, we note a number of interesting findings in our study regarding the influence of 2-wheeled traffic, alcohol outlets, and greenspace that will require further investigation. First, the independent association between 2-wheeled (motorcycle and moped) traffic and KSI accidents suggests the possibility that increased motorcyclist traffic may be linked to serious cycling accidents. The significance in the relationship between two-wheeled motor vehicle traffic and KSI accidents has important implications for policy-makers. There are a large number of companies in London that specialize in delivery and courier services, especially in the food service industry. Given the high level of traffic on London roads, many courier services employ cyclists and motorcyclists as a way to avoid congestion (Greater London Authority, 2016), which contributes to the growing number of both groups on the road. Many of these companies employ free-lance motorcyclists with a provisional license, since a provisional license alone is sufficient to ride a motorcycle or moped in the UK. Further research should examine the on-road behaviors and interactions between motorcyclists and cyclists using longitudinal data or in situ observational studies to improve safety for both groups. Since Transport for London is currently in the process of standardizing the allowance of 2-wheeled motor vehicles on bus lanes across London as part of their Motorcycle Safety Action Plan (London Assembly Transport Committee, 2018), the risk associated with having bicycles, buses, and 2-wheeled motor vehicles on a shared lane needs to be further investigated.
Second, the finding that the presence of alcohol outlets was associated with KSI accidents provides preliminary evidence that warrants further investigations. Based on the findings of this study, it is unclear whether the elevated independent risk associated with alcohol outlet density is due to any number of factors including (1) outdoor drinking and smokers from pubs creating potential road hazards, (2) proximity to points of sales for alcohol leading to impaired cycling or driving, or (3) residual confounding due to imperfectly measured levels of commercial density and activity. While a growing number of studies have noted the elevated independent risk associated with alcohol outlet density and motor vehicle accidents at the neighborhood level, evidence from our study suggests that further investigation using a more rigorous method (e.g., longitudinal data or natural experiments to study the impact of new pub openings in KSI accidents) is required.
While most studies investigating the relationship between greenspace and cycling have focused on the role of the former to increase cycling as a form of active transport (Maas et al., 2008; Yang et al., 2019), there is a dearth of studies investigating the role of greenspace in cycling injury risk. Our study found evidence that the relationship between greenspace and cycling accident risk may be non-linear: as greenspace increased, we saw gradual decreases in the odds of accidents, but at the highest level of greenspace, we saw a 15% increased odds of KSI (95% CI 1.02–1.29) compared to the lowest level. The u-shaped relationship we found could be attributed to several reasons. The first is that risk is higher in areas with low levels of greenspace because those areas also tend to be densely populated with people and/or commercial areas and infrastructure. While we have controlled for cycling and motor vehicle traffic, population density, and commercial density in our models, there may still be a possibility for residual confounding. Risk can also be higher in areas with the highest levels of greenspace because cyclists may feel safer in areas such as parks and be less aware of dangers. Furthermore, commuter cyclists and recreational cyclists may have different risk profiles, and their travel patterns across parks vs. non-green areas are likely to have an uneven distribution. A study in London found that while the overall number of bicycles from the London bicycle sharing scheme made up only 16% of the bicycles they observed in their study around London, this proportion rose to 60% at one of the two recreational sites they chose: the large Hyde Park in the city center (Goodman et al., 2014). There is limited evidence that suggests that recreational greenspace may pose unique risks to cyclists. In a Los Angeles based study, Jerrett et al. (2016) found that areas adjacent to parks had the highest level of cyclist injuries. After controlling for potential confounders, being within a quarter mile of a park is associated with a 52% higher risk of serious cycling injuries compared to areas outside that buffer. The unique risk factors associated with recreational cycling that often occurs in parks and recreational areas should be investigated in future research.
Unlike previous studies (Richter et al., 2005; De Pauw et al., 2014), we did not find evidence that speed cameras are associated with KSI cycling accidents. Further research in the London context may draw on a field-based randomized controlled study design to investigate the introduction of speed cameras on roads (compared to similar control roads without cameras). A more nuanced design may also consider the potential differential effect between the presence of speed cameras vs. being issued a traffic violation citation & being fined. In this case, the introduction of two levels of intervention (sites with mockup non-functional cameras vs. real cameras that would record violations) along with control sites can be used to isolate and identify the effectiveness of speed cameras as an intervention.
While higher numbers of cyclist traffic has been cited as a significant protective factor against cycling accidents (Robinson, 2005; Fyhri et al., 2017), we did not find evidence that cyclist traffic (or proportion of cyclists to total traffic) to have a protective effect against KSI accidents after controlling for potential confounders, which was an unexpected finding. In a prior observational study based in Western Australia (Robinson, 2005), as the number of cyclists doubled over a 7 year period, cycling-related hospitalization decreased from 29 to 15 per 10,000 cyclist-years, and reported deaths and serious injuries fell from 5.6 to 3.8 per 10,000 cyclist-years. The authors suggested that the reasons for improvements in cycling safety were (1) motorists being more aware due to their regular encounters with cyclists on the road, and (2) larger groups of cyclists are more visible to motorists. The divergence of our results from previous literature may be due to the unique mega-urban context of Greater London or the number of confounders controlled in our study. Given the exploratory and cross-sectional nature of our study, it cannot preclude that an increase in cycling traffic on a given road over time would not lead to decreases in cycling accidents, which should be investigated in future longitudinal studies preferably with a fixed-effect (i.e., within-subject) approach that controls out the effects of time-invariant confounders. Further research should also investigate whether increased cyclist traffic may be protective against different levels of cycling accidents from minor to severe to fatal.
There are a number of limitations of note for this study. (1) The study is cross-sectional, where the KSI outcome and various exposures are simultaneously assessed, which precludes us from drawing causal inferences from the observed associations. (2) Data available to us from Transport for London on cycle paths in London do not differentiate between different types of cycling paths (e.g., dedicated and protected cycle paths vs. paths shared with other traffic such as buses). Since London has designated all bus lanes to be cycle paths (i.e., the majority of cycle paths in the city), cycle paths in the data may represent different cycling conditions with vastly different risk profiles. For this reason, we have not included this variable in our final model. (3) The KSI data did not include many details of the cyclist (e.g., gender and age) and whether the trip was for recreational or commute purposes, which precluded us from investigating whether the observed associations between the exposures and KSI may be different for recreational vs. commuting cyclists, or stratified by socio-demographic characteristics.
The major strengths of our study are (1) the inclusion of a broad range of social and environmental predictors of KSI accidents, (2) spatially referenced variables to account for neighborhood-level effects, and (3) the use of KSI accidents as an outcome that are well represented by official statistics (compared to minor accidents). A number of novel built-environmental correlates of KSI (such as with speed cameras, alcohol outlets, and greenspace) we identified have important policy implications, and we suggest that further investigations into these built-environmental characteristics may yield information to design effective interventions to reduce KSIs. These interventions may include the use of speed cameras in areas with a high risk of KSIs (e.g., dual carriageway roads), and improving cycling safety infrastructure in areas with the highest density of greenspace and alcohol outlets.
Data Availability Statement
The raw data supporting the conclusions of this article will be made available by the authors, without undue reservation.
Author Contributions
AL came up with the concept for the paper. AL and AC decided on the model and the independent variables and drafted the paper together. Both authors contributed to the article and approved the submitted version.
Funding
This project has received funding from the European Research Council (ERC) under the European Unions Horizon 2020 research and innovation programme (grant agreement No. 677312 UMnD), Chair of Geoinformatics at Delft University of Technology.
Conflict of Interest
The authors declare that the research was conducted in the absence of any commercial or financial relationships that could be construed as a potential conflict of interest.
References
Aldred, R., Best, L., and Jones, P. (2019). “Cyclists in shared bus lanes: could there be unrecognised impacts on bus journey times?,” in Proceedings of the Institution of Civil Engineers-Transport, Vol. 172 (Thomas Telford Ltd), 135–151. doi: 10.1680/jtran.16.00072
Associated Press (2019). As debate over red-light and speed cameras rages on, some states take a U-Turn. HuffPost.
Baverstock, A., Reeve, W., and Burgess, A. (2007). Understanding Road Safety Issues for Courier and Food Delivery Riders Quantitative Research Report. Technical report, Synovate.
Centre for Disease Control and Prevention (2019). Automated Speed-Camera Enforcement | Motor Vehicle Safety | CDC Injury Center. Technical report, Centre for Disease Control and Prevention.
Chen, P., and Shen, Q. (2016). Built environment effects on cyclist injury severity in automobile-involved bicycle crashes. Accid. Anal. Prev. 86, 239–246. doi: 10.1016/j.aap.2015.11.002
De Hartog, J. J., Boogaard, H., Nijland, H., and Hoek, G. (2010). Do the health benefits of cycling outweigh the risks? Environ. Health Perspect. 118, 1109–1116. doi: 10.1289/ehp.0901747
De Pauw, E., Daniels, S., Brijs, T., Hermans, E., and Wets, G. (2014). An evaluation of the traffic safety effect of fixed speed cameras. Saf. Sci. 62, 168–174. doi: 10.1016/j.ssci.2013.07.028
Delaney, A., Ward, H., Cameron, M., and Williams, A. F. (2005). Controversies and speed cameras: lessons learnt internationally. J. Public Health Policy 26, 404–415. doi: 10.1057/palgrave.jphp.3200044
Dozza, M., and Werneke, J. (2014). Introducing naturalistic cycling data: what factors influence bicyclists' safety in the real world? Transport. Res. Part F Traffic Psychol. Behav. 24, 83–91. doi: 10.1016/j.trf.2014.04.001
Elvik, R., and Bjørnskau, T. (2017). Safety-in-numbers: a systematic review and meta-analysis of evidence. Saf. Sci. 92, 274–282. doi: 10.1016/j.ssci.2015.07.017
European Union OSHA (2010). Delivery and Despatch Riders' Safety and Health. Technical report, European Agency for Safety and Health at Work.
Fyhri, A., Sundfør, H. B., Bjørnskau, T., and Laureshyn, A. (2017). Safety in numbers for cyclists conclusions from a multidisciplinary study of seasonal change in interplay and conflicts. Accid. Anal. Prev. 105, 124–133. doi: 10.1016/j.aap.2016.04.039
Goodman, A., Green, J., and Woodcock, J. (2014). The role of bicycle sharing systems in normalising the image of cycling: an observational study of London cyclists. J. Transport Health 1, 5–8. doi: 10.1016/j.jth.2013.07.001
Greater London Authority (2016). Easy Rider, Improving Motorcycle Safety on London's Roads. Technical report, Transport Committee.
Hollingworth, M. A., Harper, A. J., and Hamer, M. (2015). Risk factors for cycling accident related injury: the UK cycling for health survey. J. Transport Health 2, 189–194. doi: 10.1016/j.jth.2015.01.001
Jacobsen, P. L. (2015). Safety in numbers: more walkers and bicyclists, safer walking and bicycling. Inj. Prev. 21, 271–275. doi: 10.1136/ip.9.3.205rep
Jerrett, M., Su, J. G., MacLeod, K. E., Hanning, C., Houston, D., and Wolch, J. (2016). Safe routes to play? Pedestrian and bicyclist crashes near parks in Los Angeles. Environ. Res. 151, 742–755. doi: 10.1016/j.envres.2016.07.029
Kaplan, S., and Giacomo Prato, C. (2015). A spatial analysis of land use and network effects on frequency and severity of cyclist–motorist crashes in the Copenhagen region. Traffic Inj. Prev. 16, 724–731. doi: 10.1080/15389588.2014.1003818
Larsen, K., and Merlo, J. (2005). Appropriate assessment of neighborhood effects on individual health: integrating random and fixed effects in multilevel logistic regression. Am. J. Epidemiol. 161, 81–88. doi: 10.1093/aje/kwi017
London Assembly Transport Committee (2018). Motorcycle Safety in London: Update Report . Technical report, London Assembly.
Maas, J., Verheij, R. A., Spreeuwenberg, P., and Groenewegen, P. P. (2008). Physical activity as a possible mechanism behind the relationship between green space and health: a multilevel analysis. BMC Public Health 8:206. doi: 10.1186/1471-2458-8-206
Oja, P., Titze, S., Bauman, A., De Geus, B., Krenn, P., Reger-Nash, B., et al. (2011). Health benefits of cycling: a systematic review. Scand. J. Med. Sci. Sports 21, 496–509. doi: 10.1111/j.1600-0838.2011.01299.x
Pedroso, F. E., Angriman, F., Bellows, A. L., and Taylor, K. (2016). Bicycle use and cyclist safety following Boston's bicycle infrastructure expansion, 2009–2012. Am. J. Public Health 106, 2171–2177. doi: 10.2105/AJPH.2016.303454
Polders, E., Daniels, S., Casters, W., and Brijs, T. (2015). Identifying crash patterns on roundabouts. Traffic Inj. Prev. 16, 202–207. doi: 10.1080/15389588.2014.927576
Pucher, J., and Buehler, R. (2016). Safer Cycling Through Improved Infrastructure. Technical report.
Reynolds, C. C., Harris, M. A., Teschke, K., Cripton, P. A., and Winters, M. (2009). The impact of transportation infrastructure on bicycling injuries and crashes: a review of the literature. Environ. Health 8:47. doi: 10.1186/1476-069X-8-47
Richter, E. D., Friedman, L. S., Berman, T., and Rivkind, A. (2005). Death and injury from motor vehicle crashes: a tale of two countries. Am. J. Prev. Med. 29, 440–449. doi: 10.1016/j.amepre.2005.08.035
Robinson, D. L. (2005). Safety in numbers in Australia: more walkers and bicyclists, safer walking and bicycling. Health Promot. J. Aust. 16, 47–51. doi: 10.1071/HE05047
Romanow, N. T., Couperthwaite, A. B., McCormack, G. R., Nettel-Aguirre, A., Rowe, B. H., and Hagel, B. E. (2012). Environmental determinants of bicycling injuries in Alberta, Canada. J. Environ. Public Health 2012:487681. doi: 10.1155/2012/487681
Spoerri, A., Egger, M., von Elm, E., and Swiss National Cohort Study (2011). Mortality from road traffic accidents in Switzerland: longitudinal and spatial analyses. Accid. Anal. Prev. 43, 40–48. doi: 10.1016/j.aap.2010.06.009
Staricco, L., and Vitale Brovarone, E. (2018). Implementing TOD around suburban and rural stations: an exploration of spatial potentialities and constraints. Urban Res. Pract. 13, 276–299. doi: 10.1080/17535069.2018.1541475
Tay, R. (2010). Speed cameras improving safety or raising revenue? J. Transport Econ. Policy 44, 247–257. doi: 10.2307/40600025
Teschke, K., Harris, M. A., Reynolds, C. C., Winters, M., Babul, S., Chipman, M., et al. (2012). Route infrastructure and the risk of injuries to bicyclists: a case-crossover study. Am. J. Public Health 102, 2336–2343. doi: 10.2105/AJPH.2012.300762
Transport for London (2018a). Measures Planned to Raise Motorcycle Standards. Technical report, Transport for London.
Transport for London (2018b). Vision Zero Action Plan, Taking Forward the Mayor's Transport Strategy. Technical report, Transport for London.
Vandenbulcke, G., Thomas, I., de Geus, B., Degraeuwe, B., Torfs, R., Meeusen, R., et al. (2009). Mapping bicycle use and the risk of accidents for commuters who cycle to work in Belgium. Transport Policy 16, 77–87. doi: 10.1016/j.tranpol.2009.03.004
Wedagama, D. P., Bird, R. N., and Metcalfe, A. V. (2006). The influence of urban land-use on non-motorised transport casualties. Accid. Anal. Prev. 38, 1049–1057. doi: 10.1016/j.aap.2006.01.006
Yang, Y., Wu, X., Zhou, P., Gou, Z., and Lu, Y. (2019). Towards a cycling-friendly city: an updated review of the associations between built environment and cycling behaviors (2007–2017). J. Transport Health 14:100613. doi: 10.1016/j.jth.2019.100613
Yau, K. K., Lo, H.-P., and Fung, S. H. (2006). Multiple-vehicle traffic accidents in Hong Kong. Accid. Anal. Prev. 38, 1157–1161. doi: 10.1016/j.aap.2006.05.002
Keywords: injuries, built environment, urban planning, transportation, cycling
Citation: Labetski A and Chum A (2020) Built Environmental Correlates of Cycling Accidents Involving Fatalities and Serious Injuries in London, UK. Front. Sustain. Cities 2:599635. doi: 10.3389/frsc.2020.599635
Received: 27 August 2020; Accepted: 20 October 2020;
Published: 19 November 2020.
Edited by:
Dorota Lasota, Medical University of Warsaw, PolandReviewed by:
Pengpeng Xu, The University of Hong Kong, Hong KongKaterina Folla, National Technical University of Athens, Greece
Copyright © 2020 Labetski and Chum. This is an open-access article distributed under the terms of the Creative Commons Attribution License (CC BY). The use, distribution or reproduction in other forums is permitted, provided the original author(s) and the copyright owner(s) are credited and that the original publication in this journal is cited, in accordance with accepted academic practice. No use, distribution or reproduction is permitted which does not comply with these terms.
*Correspondence: Antony Chum, YWNodW1AYnJvY2t1LmNh