 Susan A. Arnold
 Simon R. Platt
 Karine P. Gendron
 Franklin D. West
- 1Department of Veterinary Clinical Sciences, University of Minnesota Twin Cities, St. Paul, MN, United States
- 2Department of Small Animal Medicine and Surgery, University of Georgia, Athens, GA, United States
Strokes, both ischemic and hemorrhagic, are the most common underlying cause of acute, non-progressive encephalopathy in dogs. In effect, substantial information detailing the underlying causes and predisposing factors, affected vessels, imaging features, and outcomes based on location and extent of injury is available. The features of canine strokes on both computed tomography (CT) and magnetic resonance imaging (MRI) have been described in numerous studies. This summary article serves as a compilation of these various descriptions. Drawing from the established and emerging stroke evaluation sequences used in the investigation of strokes in humans, this summary describes all theoretically available sequences. Particular detail is given to logistics of image acquisition, description of imaging findings, and each sequence's advantages and disadvantages. As the imaging features of both forms of strokes are highly representative of the underlying pathophysiologic stages in the hours to months following stroke onset, the descriptions of strokes at various stages are also discussed. It is unlikely that canine strokes can be diagnosed within the same rapid time frame as human strokes, and therefore the opportunity for thrombolytic intervention in ischemic strokes is unattainable. However, a thorough understanding of the appearance of strokes at various stages can aid the clinician when presented with a patient that has developed a stroke in the days or weeks prior to evaluation. Additionally, investigation into new imaging techniques may increase the sensitivity and specificity of stroke diagnosis, as well as provide new ways to monitor strokes over time.
Introduction
Strokes, also commonly referred to as cerebrovascular accidents, are becoming increasingly recognized as a common cause of acute neurologic dysfunction in dogs. Frequency data are lacking, however, the incidence reported at one referral hospital was an estimated 1.5–2% of neurological referrals (1). Stroke is the sudden onset of focal neurological deficits resulting from an intracranial vascular event with clinical signs lasting for at least 24 h (1–3). Cerebrovascular disease refers to any abnormality in the brain resulting from a pathological process of the cerebral blood vessels, such as thrombosis, embolism, or hemorrhage (1–3).
It is suspected that the prevalence of strokes is higher than previously considered, as advanced imaging modalities have become more widely used and validated. The purpose of this review is to describe the imaging sequences, both established and emerging, that are available for evaluation of both ischemic and hemorrhagic strokes in dogs. Firstly, a summary of cerebral vascular anatomy as it applies to the development of strokes in dogs is followed by a review of the pathophysiology associated with the development of ischemic and hemorrhagic strokes in dogs. Subsequently, through a review of the sequences used in both human and veterinary medicine, the applications, benefits, drawbacks, and special considerations of each sequence are described. When possible, direct examples of their application in veterinary medical patients are described.
Anatomy Review (Figure 1)
As the focus of this review is to describe established and emerging imaging modalities for characterizing vascular accidents, knowledge of the vascular anatomy of the brain is essential. Five major paired arteries supply the dog brain, namely, the rostral, middle, and caudal cerebral arteries and the rostral and caudal cerebellar arteries (1, 4). All but the caudal cerebellar arteries branch from a ring at the base of the brain, called the cerebral arterial circle or the Circle of Willis, which is formed from the paired internal carotid arteries and the basilar artery (1, 4). The caudal cerebellar arteries branch from the basilar artery (4).
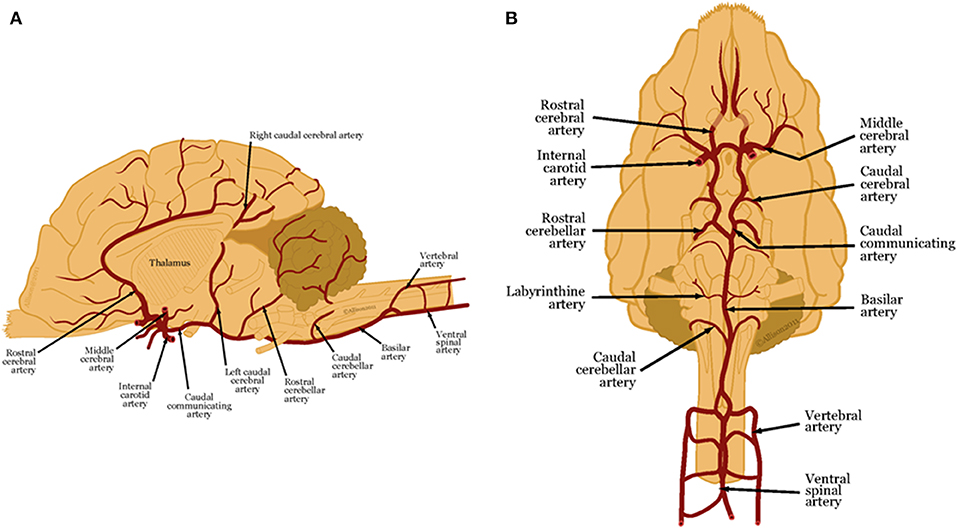
Figure 1. (A) Lateral and (B) ventral views of arterial blood supply to the canine brain. These illustrations were created by Allison L. Wright MS CMI, Athens, Georgia, USA and are reproduced with permission from the BSAVA Manual of Canine and Feline Neurology 4th edition.
These main arteries branch into deep and superficial perforating arteries. The proximal, distal and caudal deep perforating arteries arise from the caudal communicating arteries and the basilar artery and supply the thalamus, midbrain, and part of the pons (1, 4–6). Striate arteries emerge from the arterial circle, supplying the basal nuclei, internal capsule, amygdala, optic tract and thalamus (1, 4, 7). Superficial perforating arteries supply the brain surface and deep white matter (1, 6–8). The rostral cerebral artery sends branches that supply the rostral cerebral cortex, and deeper gray and white matter (4). The middle cerebral artery is the largest artery of the brain. As it courses along the ventral surface of the brain, it divides into two large branches that each supplies the whole cerebral cortex on the lateral surface of the cerebral hemisphere (4). The caudal cerebral artery supplies the medial aspect of the occipital lobe and caudal aspect of the marginal gyrus (4).
The rostral cerebellar artery arises either from the basilar artery or the caudal cerebral artery. The cerebellar arteries have variable distributions to the cerebellum and cerebellar peduncles. Generally, the rostral cerebellar artery supplies the cerebellar hemispheres and the vermis (9–13).
Section 1: Stroke Classification Review
Broadly, two forms of stroke occur (ischemic and hemorrhagic), with major differences in frequency and imaging characteristics.
Ischemic Strokes in Dogs: Epidemiology and Pathophysiology
The majority of strokes in dogs are ischemic strokes. Ischemic strokes result from vascular obstruction from emboli originating in other vascular beds, from the heart, or from local thrombus formation within a vessel (14, 15). Ischemic strokes are also referred to as cerebral ischemic strokes. As a result of ischemia, tissue infarction occurs. In dogs, one study found that the most common artery to develop emboli is the rostral cerebellar artery (47%), followed by the perforating arteries of the caudal thalamus and rostral brainstem (42%), the cerebral striate arteries (26%), middle cerebral artery (21%) and rostral cerebral artery (10%) (16). Depending on the location and extent of vessel occlusion, ischemic strokes are classified as territorial if affecting a large artery or lacunar if affecting a small, perforating artery (1).
Several underlying disorders in dogs are associated with embolic strokes, including septic diseases such as endocarditis, parasites such as Dirofilaria immitis, primary or metastatic neoplasia and various endocrine disorders and organ dysfunctions (9, 10, 13, 15, 17–23). Hypercoagulable states associated with hyperadrenocorticism, protein-losing nephropathy, hypothyroidism-induced and diabetes mellitus-induced atherosclerosis, as well as secondary hypertension have been detected in dogs with ischemic strokes, although the causal relationship between these conditions and ischemic stroke has not been definitively linked (13, 17, 21, 22, 24). In one retrospective study, a concurrent medical condition was found in 18/33 (54%) of dogs with ischemic strokes, with chronic kidney disease and hyperadrenocorticism being most common (13, 15).
In ischemic strokes, insufficient blood supply diminishes maintenance of normal cellular functions (1–3, 25–28). A reduction of cerebral blood flow below an ischemic threshold leads to hypoxia, decreased tissue glucose, and accumulation of potentially toxic metabolites that contribute to cell damage (1, 3). Hypoperfusion leads to anaerobic glycolysis and a decrease in production of adenosine triphosphate (ATP) (1, 3). Reduced intracellular ATP supply limits energy-dependent processes required to maintain homeostasis, including the maintenance of a resting transmembrane electrochemical potential, leading to cytotoxic edema (1). Focal ischemia also causes a breakdown of the blood-brain barrier that leads to a net influx of water into the affected tissue, resulting in vasogenic edema and extension of ischemic lesions (29). Complete obstruction of blood flow for >4–5 min produces irreversible cellular damage (1, 10).
Following arterial occlusion, a core of brain tissue dies rapidly as an area of infarction due to severe hypoperfusion (1, 3). Surrounding this core is an area of brain tissue that is hypoperfused but still viable, having retained borderline levels of blood flow and metabolic function (1, 26). This peripheral tissue is called the penumbra (1, 26). The penumbra is at risk for devitalization but is comprised of potentially salvageable tissue (1, 3, 16, 26). The evolution of the infarct core and penumbra is a dynamic process. The ratio between core and penumbra depends on the availability of collateral flow, and timing and extent of reperfusion of the ischemic tissue (30).
Differentiation of the infarct core and ischemic penumbra is based on the concept of cerebral vascular autoregulation (30–33). Complex neurobiochemical mechanisms maintain the stability of regional cerebral blood flow across a wide range of local metabolic activity and local arterial perfusion pressure (30–33). In the infarcted core, cerebral blood flow is low, leading to low cerebral blood volume and loss of ability to maintain autoregulatory vasodilatory compensation. Comparatively, in the penumbra, the autoregulation is intact or only mildly jeopardized (30–33).
Additionally, the relationship between cerebral blood flow, cerebral blood volume, and mean transit time differs between the infarcted core and the penumbra (34–38). Cerebral blood flow (CBF) is calculated as cerebral blood volume (CBV) divided by mean transit time (MTT) (34–38). MTT is the time difference between arterial inflow and venous outflow, designated by the average time required for a contrast bolus to cross a capillary network (30, 31, 34–39) It is the most sensitive measure used to evaluate cerebral blood flow abnormalities (34–38). The infarcted core has both decreased CBF and CBV due to loss of the autoregulatory ability (34–38). Decreased CBV is the most specific indicator that the area will infarct and therefore will be non-salvageable (34–38). Alternatively, the penumbra will have prolonged MTT, but the CBV is maintained or increased due to compensatory vasodilation (34, 40).
Hemorrhagic Strokes in Dogs: Epidemiology and Pathophysiology
The prevalence of hemorrhagic strokes in dogs is unknown, but is estimated to account for the same percentage of strokes as it does in people (15–22%) (1, 9, 14, 41, 42). Hemorrhagic strokes are associated with a vessel rupture, with or without an obvious underlying cause, or a coagulopathy (1, 43–45) Hemorrhage can also occur as a secondary effect of ischemic strokes following reperfusion or if venous drainage is occluded (1).
There are numerous reported underlying etiologies for hemorrhagic strokes in dogs. Both primary and metastatic brain tumors can develop spontaneous intracranial hemorrhage (1, 46). Extracranial diseases that lead to disseminated intravascular coagulopathy or other causes of spontaneous bleeding, such as ingestion of anticoagulant rodenticide, can result in spontaneous intracranial hemorrhage. Additionally, bacterial infection, congenital vascular malformations, necrotizing vasculitis and brain atrophy leading to tearing of blood vessels have been reported as causes of hemorrhagic strokes (1, 45, 47, 48). In people, the main primary cause of hemorrhagic strokes is spontaneous rupture of an otherwise normal vessel secondary to hypertension. Conversely, hypertension leading to primary hemorrhagic strokes is rarely reported in dogs (1, 43, 46). Cerebral amyloid angiopathy results from amyloid deposits in cerebral arteries, leading to weakening of arterial walls (1). This condition is a common cause of intracranial hemorrhage in people and has been reported in a population of older dogs (1, 45, 49, 50). Hypertensive lesions are typically deep (such as in the thalamus and basal nuclei) and cerebral amyloid angiopathy spares these regions, being typically at the gray/white matter junction (51).
Hemorrhagic stroke results in extravasation of blood and formation of an intraparenchymal hematoma or diffuse infiltrate within the parenchyma (25, 45, 52). If the vessel rupture or coagulopathy occurs in the ventricles, subdural or subarachnoid space, then an extraparenchymal hematoma develops (25, 45, 52). Hemorrhagic strokes lead to an increase in cerebral volume, brain edema, and herniation (25, 45, 52). Clot expansion occurs mainly within the first 6 h of hemorrhage. It is often self-limiting due to increased cerebral perfusion pressure and brain tissue elastic resistance. Edema surrounding the clot can develop over several days, and ischemia can occur as a consequence of compressed brain tissue or limited blood flow (1, 49).
Section 2: Established Stroke Imaging Modalities
According to established guidelines of the National Institute of Neurological Disorders and Stroke and the American Stroke Association, components of a hyperacute stroke imaging evaluation should include parenchymal, penumbral, susceptibility-weighted imaging and vascular imaging in a single study, consisting of either multimodal computed tomography (CT) or magnetic resonance (MR) (30, 53). These components fulfill the following criteria: (1) characterize the form of stroke (ischemic or hemorrhagic) and exclude other ischemic stroke mimics; (2) provide reliable information about the location and extent of ischemia in ischemic strokes; (3) identify the existence and extent of potentially salvageable brain; and (4) identify the site of vascular occlusion and degree of collateral flow (30, 53)
Evaluating Parenchymal Changes
Computed Tomography (Figure 2)
In people, non-contrast CT (NCT) is typically used to rule out hemorrhage and stroke mimics and to potentially detect the presence of early, subtle acute ischemic signs (30, 54–56). A major benefit of CT imaging is the rapidity of image acquisition; a complete protocol using NCT, perfusion CT (CTP), and CT-angiography (CTA) can be performed in <10 min (30, 53).
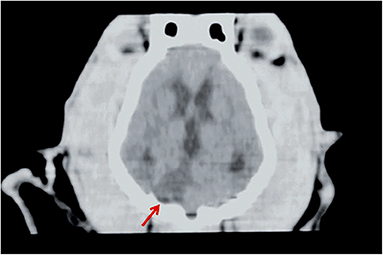
Figure 2. CT of a dog head, dorsal plane reconstruction. In the right lateral aspect of the cerebellum, there is a triangular, sharply margined and hypoattenuating lesion (red arrow) corresponding to an ischemic stroke in the territory of the right cerebellar artery. Image courtesy Wiley (Paul AEH, Lenard Z and Mansfield CS. Computed tomography diagnosis of eight dogs with brain infarction. Aust Vet J 2010; 88(10): 374-380.
NCT is used primarily based on its high sensitivity for detecting hemorrhage due to differences in Hounsfield units (HU) of acute hemorrhage (40–60 HU) compared to gray (39 HU) or white (32 HU) matter (57). Within hours of the onset of hemorrhage, attenuation of the hematoma rapidly increases up to 60–80 HU due to the formation of a fibrin and globulin meshwork, and remain visible on NCT for approximately 1 week (58, 59).
Overall, NCT is inferior to MRI for detection of ischemic infarction (15, 30). Infarct detection with NCT in the first 3 h following a stroke has poor sensitivity, as low as 25% (30, 60). Another major drawback of NCT is that it provides solely structural rather than physiologic information. It cannot reliably differentiate between penumbral and irreversibly damaged tissue (30). Nonetheless, there are three main stages (acute, subacute, and chronic) used to describe NCT manifestations in ischemic strokes (34).
In the acute stage (<24 h), cytotoxic edema changes are subtle on NCT and include loss of normal gray matter to white matter interface and effacement of cortical sulci, which may result in “loss of the insular ribbon sign” or in the “disappearing basal nuclei sign,” which are established changes observed in middle cerebral artery strokes in people. These findings occur due to partial disappearance or loss of definition of the gray-white matter interface (30, 61). A thrombus in the proximal middle cerebral artery may also be observed in the acute phase as an area of hyper-attenuation (30, 34).
In the subacute stage (24 h to 5 days), vasogenic edema leads to greater mass effect, hypoattenuation, and well-defined margins (34).
In the chronic stage (>5 days to weeks), loss of brain tissue and hypoattenuation are observable on NCT (34). In these tissues, hypo-attenuation is highly specific for tissue infarct (30, 62) In addition, its extent is predictive for the risk of hemorrhagic transformation, clinical outcome, and final infarct volume (30, 63).
NCT studies for strokes in veterinary patients are subject to the same benefits and drawbacks as in people (64, 65). The lesions observed on NCT with stroke can be either hyper-attenuating or hypo-attenuating, depending on whether they are hemorrhagic or ischemic, with varying degrees and distribution of contrast enhancement and distinction from surrounding tissue. Furthermore, hemorrhagic lesions can be associated with mass effect. Since numerous other etiologies can cause similar imaging findings on NCT, and the more specific yet subtle findings are not always present or appreciable, interpretation of NCT findings should be interpreted with caution when considering potential vascular accidents (30, 64).
MRI: Conventional T1- and T2-Weighted Pre- and Post-Contrast Imaging
For Ischemic Strokes (Figure 3)
The classic appearance of an ischemic stroke is a sharply delineated lesion primarily within the gray matter that is hypointense to surrounding tissue on T1-w, hyperintense on T2-w and fluid attenuated inversion recovery (FLAIR), with weak to no contrast enhancement in the periphery 7–10 days after the onset of stroke (4, 7, 29, 66, 67). Cerebral ischemia becomes visible on T2-w images 6–12 h after the onset of signs, but is usually not seen until at least 8 h after the ischemic insult (68, 69). Furthermore, changes consistent with cerebral ischemia are evident earlier on T2-w FLAIR images than conventional T2-w images (68).
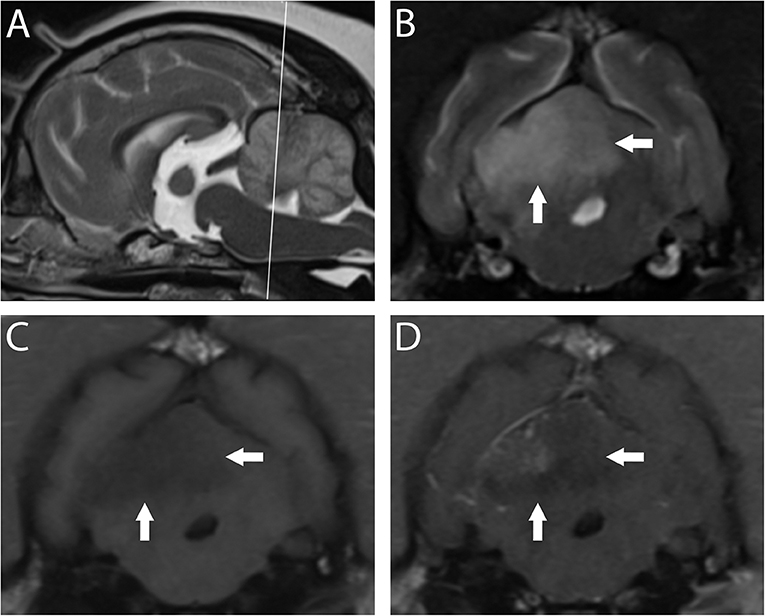
Figure 3. 3T MR of the brain of a 10-year-old spayed female Pug with acute right-sided vestibular syndrome of estimated 6–16 h duration at time of imaging. In T2-w sagittal (A), the reference line indicates the orientation of the transverse planes. In T2-w (B) the territory of the right rostral cerebellar artery (white arrows) is hyperintense and swelling causes mild leftward midline shift. This region is hypointense in T1-w (C) with patchy contrast enhancement of the cerebellar cortex and meninges (D). Findings are consistent with ischemic stroke; however, this combination of signals suggests a lesion several days older than the reported history. The dog is facing to the left in A, and the patient's right is shown on the left in transverse images; this image orientation is maintained throughout this review.
The overall sensitivity and specificity of conventional MRI protocols that include T2-w, T2-w FLAIR, and post-contrast images for ischemic strokes shortly after injury in dogs is poor (70–72). Substantial overlap in signal characteristics and lesion morphology between vastly different intracranial pathologies in dogs has been observed (70–72). In one study using conventional, high-field MRI to compare gliomas and cerebral infarcts in dogs, as many as 12% of histologically confirmed gliomas were incorrectly classified as infarcts (71)/ Additionally, the sensitivity for histologically-confirmed vascular events was 38.9% (70). Furthermore, as many as 47% of presumed cerebrovascular accidents were misdiagnosed as gliomas by reviewers who retrospectively reviewed MR images without knowledge of basic case information (70). Gliomas are characterized as round or ovoid enhancing lesions surrounded by some degree of vasogenic edema, which are features that are generally not encountered in the initial hours following stroke onset (73) Ultimately, the delay between canine stroke onset and imaging contributes to the challenge in distinguishing strokes from gliomas. Additional sequences (see below in Diffusion Weighted Imaging section) have been demonstrated to aid in the distinction.
For Hemorrhagic Strokes (Figure 4)
In the case of hemorrhagic strokes, T1- and T2-w sequences are fairly sensitive for blood detection, but lack specificity (72). Hemorrhagic strokes can be confirmed on MR imaging because blood breakdown products are paramagnetic (74).
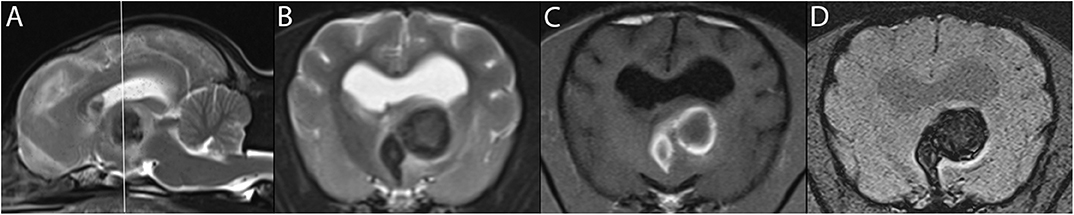
Figure 4. 3T MR of the brain of an 11-year-old female American Hairless Terrier, 3 days after acute onset of mentation changes and compulsive circling to the left. The reference line in T2-w sagittal (A) indicates the orientation of the transverse planes. In T1-w (B), a large hemorrhagic stroke is present in the left thalamus. The hyperintense ring in T1-w matches a hypointense ring in T2-w (C), consistent with early subacute stage of 3 days or more. The center of the lesion is of intermediate signal intensity in these same sequences, suggesting an earlier stage of hemorrhage. GRE sequences including SWI (D) demonstrate signal drop out, confirming the presence of blood products. The patient showed steady improvement on progress examination 3 weeks later.
The appearance of intracranial hemorrhage is multifactorial and depends on intrinsic technical and biological variables (57). While the age of the hematoma is considered the main intrinsic contributor to its signal intensities, size of the lesion, intra- or extra-parenchymal location, and episodes of recurrent bleeding will influence MRI findings (7) Higher field strengths result in an increased T1 relaxation time (75). A near linear relationship has been described between field strength and magnetic susceptibility. Higher field strengths result in an increased T1 relaxation time, which reduces contrast between gray and white matter (74).
The transition from hyperacute to acute hemorrhage is characterized by a transition from oxygenated to deoxygenated blood (7). The different stages have different magnetic properties based on whether or not they contain unpaired electrons (7). This process generally starts at the periphery, leading to a rim effect to the lesion (7).
Five distinct stages of MRI appearance of intracranial hemorrhage have been defined (7, 57, 76–78) (Table 1) (Figure 5). The hyperacute (<12 h) stage appears isointense on T1 and hyperintense on T2-w images (7, 57, 76–78) The acute (1–3 days) stage is associated with intracellular deoxyhemoglobin, appearing iso- to hypointense on T1-w and hypointense on T2-w (7, 57, 76–78). The early subacute (4–7 days) stage is associated with intracellular methemoglobin with intact red blood cells, appearing hyperintense on T1-w and hypointense on T2-w images (7, 57, 76–78). Methemoglobin produces T1-w shortening effects on adjacent hydrogen nuclei in water and other molecules, leading to intrinsically high signal intensity on T1-w images (7, 57, 76–78). The late subacute (7–14 days to 1 month) is associated with extracellular methemoglobin and erythrolysis, appearing hyperintense on both T1-w and T2-w (7, 57, 76–78). In the chronic (>14 days) stage, ferritin and hemosiderin conversion and storage within macrophages results in iso- to hypointense T1-w and hypointense T2-w lesions (7, 57, 76–78). This final stage may last indefinitely, although recent evidence suggests that it may also resolve with time (79).
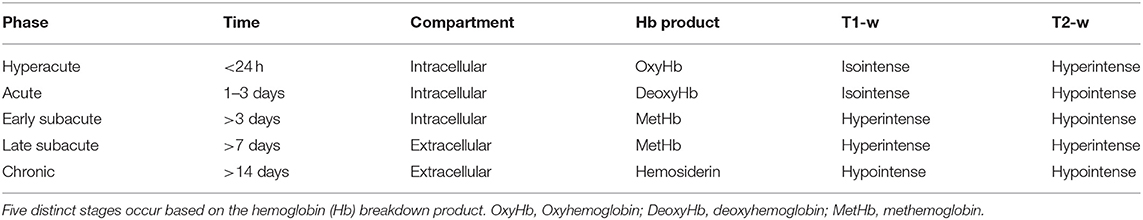
Table 1. T1-w and T2-w characteristics of hemorrhagic stroke lesions by stages of hemoglobin breakdown.
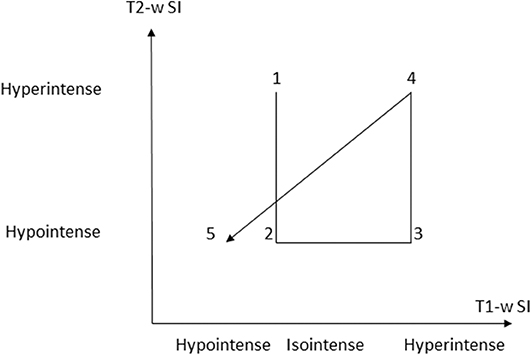
Figure 5. Graphic depiction of appearance of the 5 temporal stages of hemorrhage on T1-w and T2-w sequences. (SI = signal intensity). Modified from Maizlin Z, Shewchuk J, Clement J. Easy ways to remember the progression of MRI signal intensity changes of intracranial hemorrhage. Canadian Assocn of Radiologists Journal 2009; 60:88-90.
Three pulse sequence strategies are routinely employed for evaluation of cerebral hemorrhage and should be simultaneously examined: T1-w, T2-w, and GRE (below). T1-w hyperintensity alone is unspecific and may represent various blood breakdown products, fat, proteinaceous fluid, melanin, calcification, necrosis and other paramagnetic substances such as iron, manganese, and copper (1, 73, 80–86).
T2-w Fluid Attenuated Inversion Recovery (FLAIR) (Figure 6)
FLAIR, along with several other sequences, was developed to evaluate white matter, including in strokes (87, 88). Canine models have been used to track the appearance of ischemic strokes over time on T2-w FLAIR (88–90). Based on these studies, ischemic stroke generally becomes visible within the first 3–8 h after a stroke (7, 30, 88–93). T2-w FLAIR images are also highly sensitive in detecting any fluid-rich lesions, including subarachnoid hemorrhage and acute cerebral venous sinus thrombosis, which both appear hyperintense on T2-w FLAIR (30, 34, 94–96). T2-w FLAIR is particularly useful for evaluating possible lesions adjacent to areas filled with cerebrospinal fluid or in areas normally filled with cerebrospinal fluid, because FLAIR suppresses the signal intensity of bulk water (97).
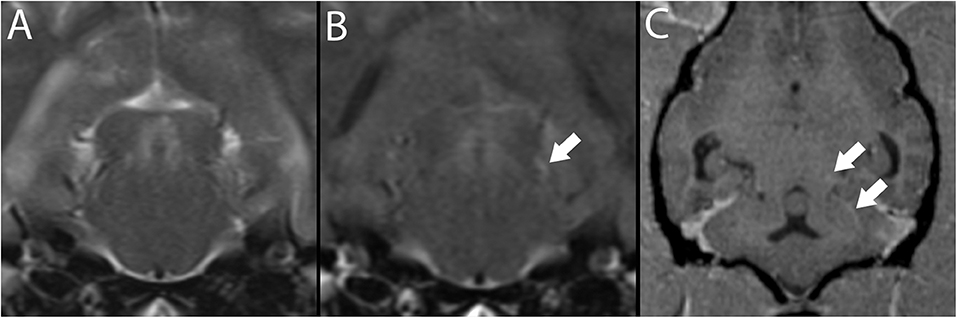
Figure 6. 3T brain MR of a 7-year-old neutered male Pug with ischemic stroke of the territory of the left rostral cerebellar artery (not shown). Depicted are T2-w transverse plane at the level of the caudal colliculus (A) and matching slice in T2-w FLAIR (B). Depicted in B, a hyperintense vessel sign is present (white arrow). This vessel, consistent with the base of the rostral cerebellar artery, may be followed in T1-w post-contrast MPR in dorsal reconstruction arrows, (C).
Inter-observer agreement on T2-w FLAIR sequences of ischemic lesions is considered excellent (69). T2-w FLAIR specificity and positive predictive value are high for ischemic lesions <5 h old, but sensitivity and negative predictive value are low (92, 98–100). Therefore, in people, a substantial number of patients in this hyperacute time window who could benefit from thrombolytics are missed if solely evaluated based on T2-w FLAIR, as the intravenous use of this drug is only effective if given within 4.5 h of stroke onset (98).
Strokes in many dogs are diagnosed in the subacute stage, between 24 h to 6 weeks following vascular insult (9, 16, 88, 101). This delay relative to diagnosis in people is due to time lag between onset of signs and referral for diagnostic imaging as well as lack of standardized imaging protocols for strokes in dogs (9, 16, 88, 101). In dogs, the median interval between onset of signs and MRI exceeds 2 days, which explains why reported lesions have been hyperintense on T2-w FLAIR (9, 16, 88, 101). Over time, the sensitivity of T2-w FLAIR increases, which can help in identifying strokes even if the interventional window has long passed (90). Although reaching a diagnosis of an ischemic stroke within the critical time window of 4.5 h for administration of thrombolytics is an unlikely expectation in dogs, these studies have provided insight regarding the appearance of strokes over time, which can aid in demarcating lesion size and predicting recovery time (89, 90).
T2-w FLAIR can be used to evaluate two findings consistent with strokes <24 h old: hyperintense vessel signs and hyperintense, swollen cortical gyri (97, 102). In some cases, a hyperintense vessel sign can be the only indication of infarction (97, 102). This sign has been established to result from slow flow, in both anterograde and retrograde leptomeningeal directions, which may explain why its detection is substantially reduced in post-contrast T2-w FLAIR images (103–105).
The sensitivity of these findings is highest during the first 6 h after stroke onset and declines over time (96, 105). In people, the most common locations for this finding on T2-w FLAIR are the sylvian fissure (87%), cortical sulci (54%) and horizontal segments of the middle cerebral arteries (97, 106). Furthermore, infarcts with a signal intensity ratio of <1.37 on FLAIR are <36 h old (68).
Additionally, in people, delayed post-contrast T1-w FLAIR images can be used to detect the presence of the hyperintense acute reperfusion marker (HARM) sign, which is potentially an indicator of early blood-brain barrier disruption (53). In evaluating chronic ischemic infarcts, lesion outlining on FLAIR compared to T2-w images leads to superior inter-rater agreement for lesion borders because it causes a more distinct border between tissue and cerebrospinal fluid compared to T2-w images (107).
Susceptibility-Weighted Imaging/Gradient Echo (Figures 4, 7)
Combining susceptibility-weighted imaging (SWI) or gradient echo (GRE) imaging such as T2-* with conventional T1-w and T2-w images can increase both the sensitivity and specificity for hemorrhagic strokes (29, 73, 80, 108). GRE MRI uses a gradient to rephase protons, which makes susceptibility effects more visually prominent (7, 109). Hemorrhage appears an-intense (signal void) lesions on these sequences, as hemosiderin is strongly paramagnetic (7, 74, 109–113). Although several other substances can create hypointense lesions on T2*-GRE and SWI, such as mineralization, gas, fibrous tissue, and iron deposits, these alternative findings (aside from iron deposits) are both T1-w and T2-w hypointense, unlike hemorrhagic stroke lesions (45, 74). On T2*-w images, chronic hemorrhage is characterized by a hyperintense center surrounded by a hypointense rim (114).
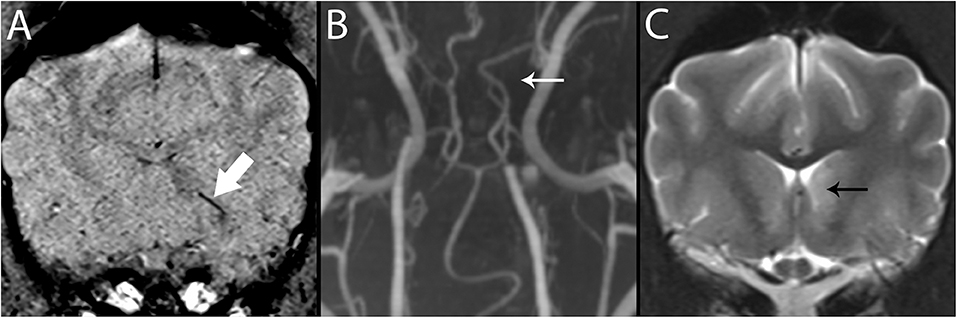
Figure 7. 3T MR of the brain of an 8-year-old neutered male Greyhound with ischemic stroke to the left caudate nucleus. In SWI (A), Susceptibility Vessel Sign is present (bold arrow). In TOF (B), a branch of the rostral cerebral artery is not identified (arrow), corresponding to the vessel shown in A, and to the recurrent artery of Heubner which feeds the basal nuclei in this region. In T2-w (C), immediately caudal to the level shown in A, the left caudate nucleus is hyperintense (black arrow).
Compared to CT, GRE is equally, if not more, sensitive for detection of acute intracranial hemorrhage (115–117). Currently, T2*-GRE is the most commonly used sequence for evaluating hemorrhage in dogs and has been demonstrated to be the most accurate of all MR pulse sequences and more accurate than CT in dog models in predicting the extent of hemorrhage (23, 80). T2*-GRE sequences are not 100% sensitive for the detection of all stages of intracranial hemorrhage because after erythrolysis, methemoglobin moves into the extracellular space and becomes homogeneously distributed in plasma (73) This means that the magnetic field within the voxel also becomes homogeneous, which causes loss of susceptibility artifact (73, 118). Furthermore, the artifact distortion is directly proportional to the magnetic field strength, so the size of hemorrhage can vary between scanners (23, 73). Subsequently, SWI has been demonstrated to be more reliable for cerebral microbleeds than T2*-GRE (98).
Diffusion-Weighted Imaging (Figure 8)
Diffusion-weighted imaging (DWI) provides an image signal that is dependent on the molecular motion of water (30, 35). The disruption in energy metabolism that results from ischemic stroke leads to failure of the sodium-potassium pump, resulting in cytotoxic edema (30, 119). Intracellular water flow leads to reduced extracellular volume. Within the extracellular space, water mobility is more facilitated than within the intracellular space. Given the altered distribution of water between these two compartments, a net reduction of Brownian motion and osmosis results (30, 35, 120). This diffusion impairment is detected on DWI within minutes of vessel occlusion as a well-demarcated hyperintense signal on DW source images (30, 34, 35, 120). The defined area tends to be larger than the area of tissue that directly experiences ion pump failure, amplifying its visibility (67, 121). Additional pathologic processes can contribute to the DW source images' hyperintensity, including alterations in pH at the periphery due to anaerobic metabolism (67, 121).
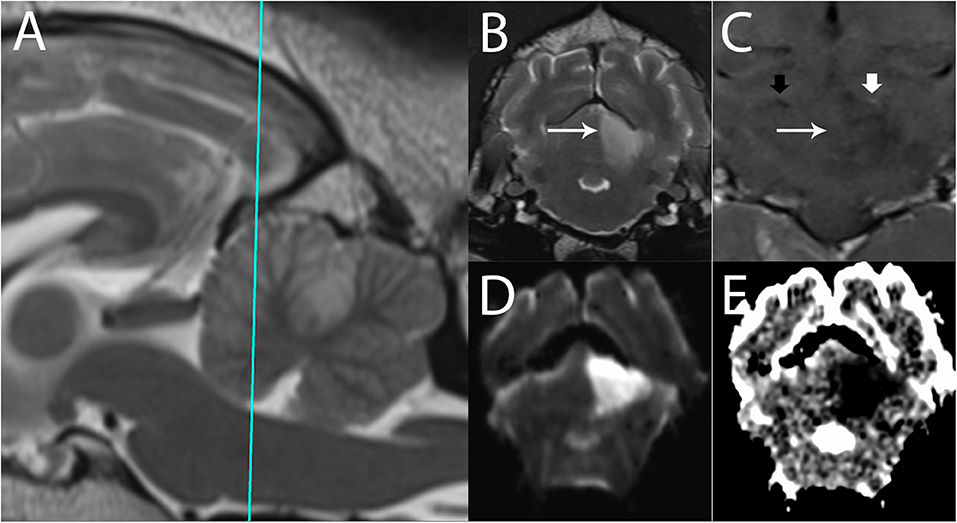
Figure 8. 3T MR of an 11-year-old spayed female boxer dog with ischemic stroke of the left rostral cerebellar artery, 2 days after onset of signs. The patient presented mentally appropriate in lateral recumbency with opisthotonus and decerebellate rigidity. Shown are (A) T2-w sagittal with a reference line for the transverse planes (B) T2-w transverse, (C) T1-w FLAIR dorsal after administration of contrast (D) Trace DW, and (E) ADC map in transverse plane. In the left rostral cerebellum, there is a well-defined, wedge-shaped T2-w hyperintense area (B, arrow). This lesion is hyperintense in Trace DW (D) and hypointense in ADC map, consistent with restricted diffusion. In dorsal plane (C), the edge of the lesion is marked by the long arrow. Intravascular enhancement of the left rostral cerebellar artery is present (thick white arrow, compare with the right, thick black arrow); vascular enhancement is a common finding and is related to slow flow. No predisposing causes were found on bloodwork and abdominal ultrasound. The patient gradually improved over 14 days and was subsequently discharged as ambulatory with mild cerebellovestibular ataxia.
An apparent diffusion coefficient (ADC) map is constructed to quantify the extent of restricted diffusion observed on the DWI image (30). ADC maps quantify the degree of water proton mobility between magnetic fields. Normal ADC values vary substantially depending on the brain region and the age of the dog (122, 123). True reduced diffusion, as occurs in cytotoxic edema, appears hypointense on the ADC map, confirming acute ischemia (7, 29, 72, 124, 125). The comparison between the DWI and ADC is necessary because DWI hyperintensity is not exclusively specific for restricted diffusion. Additional conditions that lead to restricted diffusion include pyogenic abscesses, highly cellular tumors, status epilepticus, and global ischemia (126). Areas of high signal, such as vasogenic edema, can also appear hyperintense on DWI because DWI is T2-w-based (7, 9, 34, 125). Vasogenic edema, being extracellular edema, will not show restricted diffusion and will appear hyperintense on an ADC map, by a phenomenon termed T2-w-shine through (7, 9, 34, 123). Over time, the appearance of the DWI and ADC abnormalities reverse as the stroke moves into a subacute phase within 24 h to 5 days (34, 35). This progression makes it possible to estimate the age of the infarct core to some degree (34, 35, 88).
DWI is most sensitive for detecting ischemic strokes immediately following onset. Changes can be observed as early as 45 min following a stroke (127). In addition to T2-w FLAIR, it is the most sensitive method for detecting ischemic infarcts with high diagnostic accuracy and is considered the gold standard for identifying acute stroke in people (115). Once a hemorrhagic stroke has been ruled out, DWI improves stroke detection from 50% to more than 95% (34, 40, 128). On DWI, the sensitivity and specificity in diagnosing hyperacute cerebral infarction is 88–100% and 86–100%, respectively (126). DWI is also more sensitive for smaller lesions than CT and more accurately reflects pathophysiologic changes induced by acute ischemia compared to T2-w images and is also a better predictor of final infarct volume (30, 127, 129). Another advantage of DWI is its capability to discern between acute vs. chronic ischemia, which is useful in identifying new lesions in patients with prior ischemic injury (30). It also is useful in distinguishing between ischemic stroke and glioma. As the ADC value is inversely proportional to cell density, high grade gliomas generally have a classically lower ADC value in comparison to ischemic tissue (73).
Comparing findings between FLAIR and DWI can help determine the age of an ischemic stroke (Figure 9). In patients evaluated shortly after development of signs, a DWI lesion and normal FLAIR image suggests a time window of <3 h with >90% specificity and positive predictive value for an ischemic stroke (30, 89, 92, 100). This mismatch is critically important in human medicine in identifying candidates for thrombolysis, which is only effective if delivered within 4.5 h of injury (30, 89, 92, 98, 130). Furthermore, use of a calculated DWI-FLAIR mismatch increases sensitivity over visual mismatch analysis (89).
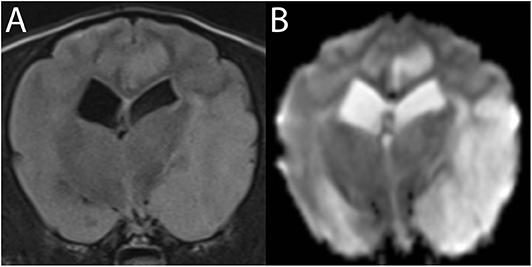
Figure 9. 3T MR of the brain of an 8-year-old neutered male Cavalier King Charles Spaniel with severe endocardiosis. In T2-w FLAIR (A) the territory of the left middle cerebral artery is moderately hyperintense and swollen. The same lesions are much more conspicuous in Trace DW, with the hyperintensity being consistent with edema (B). Similar lesions in the left cingulate gyrus are consistent with ischemic stroke of a branch of the rostral cerebral artery. Following the patient's cardiovascular arrest 2 days later, necropsy confirmed acute to subacute ischemic stroke.
There are several limitations and important considerations regarding DWI and ADC imaging. For one, DWI lesions can be at least partially reversible in the early stages of ischemia. The initial DWI abnormality therefore does not necessarily reflect the infarct core (30, 131). Additionally, in the time frame in which DWI is most sensitive for detecting strokes, the greatest variability in lesion measurement between observers has been documented (132). Even with manual editing and the development of threshold values, ADC can include visibly normal tissue and miss visibly abnormal tissue (133). Furthermore, changes on ADC 3 h after an ischemic event are not reliable predictors of the reversibility of tissue damage (89).
Currently, DWI and comparison to the ADC map is the most widely used and most sensitive and specific sequence used in evaluating strokes in dogs (7, 9, 64). In a study of 40 dogs with suspected infarcts that underwent MRI within 1–5 days of presumed stroke onset, lesions were more readily visible on DWI than on conventional fast spin echo images (16).
Perfusion Studies
MR Perfusion-Weighted Imaging (MR-PWI)
Comparison of DWI images with perfusion-weighted imaging (PWI) images can be useful in determining the fate of ischemic tissue. PWI provides a measurement of cerebral perfusion by tracking the passage of an intravenously delivered bolus of contrast agent (115, 134). The temporal passage of contrast is tracked in repeated contiguous slices throughout the brain using gradient echo techniques (115). The tissue signal change caused by the susceptibility effect of contrast is used to create a hemodynamic time-to-signal intensity curve (115, 135). This curve is then used to generate a set of semiquantitative perfusion maps (112, 132). The maps establish relative cerebrovascular hemodynamic measures such as relative CBF, MTT, CBV and time-to-peak (TTP) (115, 129, 130, 136, 137). Ischemic tissue has increased MTT, decreased CBF, and normal CBV (61). Infarcted brain tissue, or necrosis due to complete and prolonged ischemia, has increased MTT, decreased CBF, and markedly decreased to no CBV (61).
One of the major uses of PWI in stroke patients is to identify at-risk yet salvageable penumbra tissue by detecting perfusion-diffusion mismatches when comparing lesions on DWI to PWI (61, 138–141). DWI detected abnormality reflects the irreversibly damaged infarcted core, whereas PWI reflects the overall area of hypoperfusion (61). Mismatch is defined as PWI lesion volume that exceeds the DWI lesion volume by at least 20% (137).
There are substantial drawbacks to evaluating the PWI/DWI mismatch. The model does not take into consideration that DWI lesions do not necessarily turn into infarction and that PWI abnormalities might represent areas of benign oligemia that are not at risk (115, 132, 141). Despite reported correlation of the PWI/DWI mismatch with salvageable vs. irreversible tissue damage, there are reports of salvageable tissue that was hyperintense on initial DWI (67, 142, 143). Therefore, the reliability of this comparison might not be as strong as previously considered (67).
Although PWI is not performed conventionally in veterinary medical practice, numerous studies using canine models have been performed (88). Therefore, PWI could be employed in MRI protocols in canine patients with suspected strokes. However, as currently there are no specific therapies aimed at restoring penumbral or oligemic tissue, its application may be impractical and could prolong time under general anesthesia. Another limitation of PWI in veterinary medicine is the highly equipment-dependent variation in resolution and/or strong distortion artifact.
CT Perfusion Imaging
Perfusion imaging is also feasible using CT and offers several advantages over non-contrast CT and over MR-PWI. CT perfusion imaging is performed using a single injected bolus of iodinated contrast material. The passage of the bolus is tracked through the cerebral circulation under sequential helical CT scanning. Similar to MRI-PWI, CBF, CBV, TTP, and MTT are all acquired using CT perfusion imaging, and the same patterns attributable to infarcted and penumbral tissue are visible on CT perfusion. Both CT perfusion imaging and MR-PWI may derive CBV, CBF, and MTT, among others, as quantitative data (144). The main advantages of CT perfusion imaging over NCT is the ability to use hemodynamic differences to evaluate intracranial vascular physiology. The main advantage of CT perfusion imaging over MRI-PWI is the shorter time to image acquisition with CT perfusion imaging (145).
Vascular Studies
Computed Tomography Angiography (CTA)
This is the most common first-line diagnostic modality for vascular imaging in acute strokes in people (146, 147). This minimally invasive study requires a time-optimized bolus injection of intravenous contrast material and thin-section helical CT images obtained in the arterial phase (132, 146, 148, 149). CTA can reliably detect intracranial proximal arterial occlusions and stenosis (146, 150). The presence of occlusion on CTA predicts functional outcome, final infarct size, and response to intravenous thrombolytics (146, 149, 151). It can also provide information on the quality of collateral circulation if the scanner possesses sufficient spatial resolution capability and can improve the sensitivity in identifying ischemic areas that are not apparent on non-enhanced CT (30, 146, 152–155). Post-processing techniques can also be used to create three-dimensional images that can aid in detection of arterial occlusions (146, 155, 156). CTA is widely available and well-tolerated by the majority of patients, and provides crucial information in a short period of time (34, 146).
Although CTA is the established modality for evaluating strokes in people, there are no published studies on using CTA in dogs. This paucity is likely due to several reasons. For one, most dogs undergo imaging long after the possible administration of thrombolytic agents would have any benefit. The main reason that CTA is the most common modality chosen for human stroke patients is its rapidity and high sensitivity for arterial occlusion and hemorrhagic infarcts. This means that it can provide the fastest way to reach a diagnosis and provide an opportunity for administration of thrombolytic agents within a 4-h window of stroke onset. Additionally, the clinical signs of stroke in dogs overlap with other etiologies, such as brain tumors and immune-mediated meningoencephalitis. Whereas, strokes are one of the most common neurologic diseases in people and their signs are more apparent to the general public, the same principles do not apply to strokes in dogs. Therefore, MRI is preferred over CT, and CTA is not often pursued because the standard MRI protocol for dogs generally yields a definitive diagnosis for stroke patients. Furthermore, in most cases, general anesthesia is required for CT angiographies in dogs, so the reduction in time spent obtaining a diagnosis via CT compared to MRI is relatively minimal.
Magnetic Resonance Angiography (MRA) (Figures 7, 10)
Like CTA, MRA is used to visualize both intracranial and extracranial vasculature (30). The two most commonly used types of MRA are time-of-flight (TOF-MRA) and contrast-enhanced MRA (CE-MRA) (146, 157). Both are based on gradient echocardiographic sequences with either two-dimensional or three-dimensional volume acquisition (17).
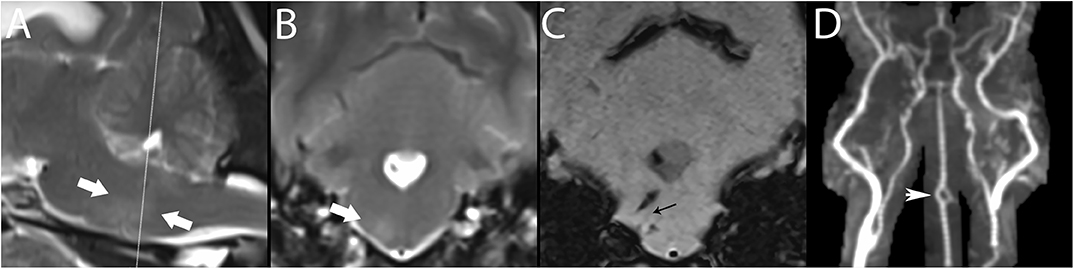
Figure 10. 3T MR of the brain of a 7-year-old female spayed Maltese with central vestibular disease secondary to hemorrhagic stroke. Centered on a right-sided perforating pontine vessel, there is a T2-w hyperintense halo, shown here between arrows in paramedian (A) and transverse (B) planes. In SWI (C), linear signal void is associated with the vessel (black arrow); linear hemorrhagic lesions are present dorsal and ventral to this vessel, as well as in the fourth ventricle. While pontine vessels are not clearly visualized in TOF (D), large artery disease is ruled out, classifying this lesion as basilar artery branch disease. CE-MRA may resolve such small vessels. The basilar artery is fenestrated, thought to be an incidental finding (white arrowhead). Necropsy confirmed the stroke and identified an adrenal pheochromocytoma, presumed to have resulted in systemic hypertension, a major risk factor for stroke.
Three-dimensional (3D) TOF-MRA is the standard technique for examination of intracranial vessels, although CE-MRA is also recommended in protocols for ischemic brain disease (93, 115, 158). TOF-MRA does not require a contrast agent and is instead based on macroscopic motion of water proteins (157, 159, 160). In this sequence, saturation pulses are repeatedly applied to a volume of tissue; inflowing blood is unsaturated and provides signal against a background of low intensity (93, 115, 158). TOF-MRA is ideal for evaluating arterial flow because venous blood is suppressed except on a few entry slices due to its slower flow and thicker slab (161). Additionally, TOF-MRA can be used to evaluate venous blood by applying a saturation band and pulse on the opposite side (162).
Limitations of TOF-MRA are based mainly on vascular saturation and flow or motion artifacts. In 3D-TOF-MRA, volume coverage is limited by vascular saturation effects, making it best suited for evaluation of intracranial rather than extracranial vasculature (146, 150, 163, 164). 3D-TOF acquisitions have intrinsically higher spatial and contrast resolution, a characteristic which is amplified at higher magnetic fields, so the ability to follow vessels is superior in 7.0T scanners compared to 3.0T scanners (7, 17) TOF-MRA also tends to overestimate the degree and length of arterial stenosis, especially in the presence of turbulence, is relatively insensitive to slow or reversed blood flow and tends to be affected by saturation effects that limit the maximum thickness of slabs acquired (141). This factor means that it can be difficult to visualize the distal aspect of vessels (146). Furthermore, slow flow or large blood volume can eliminate the visible intrinsic contrast between blood and stationary tissue (165).
CE-MRA is the standard technique for examination of extracranial arteries such as the vertebral or carotid arteries (30, 146). It utilizes an intravenous injection of gadolinium to reduce the T1-w relaxation time of tissue and to generate contrast between the intravascular lumen and surrounding tissues (17, 30, 135, 146, 164). Since it is independent of flow dynamics, unlike TOF, artifacts or effects associated with altered flow are substantially reduced (30, 146, 164).
Unlike CTA, MRA has been studied relatively extensively in dogs. Prior to its availability, and given lack of CTA studies, the intracranial vessels of dogs were historically evaluated using conventional x-ray angiography or digital subtraction angiography, which require iodinated contrast agents and are relatively invasive techniques (17, 41, 165). MRA has now been used in numerous studies of both normal anatomic structures and pathologic processes in dogs, including strokes (7, 17, 41, 157, 165–170). In assessing canine strokes, it has been demonstrated to be a relatively easy sequence to include in an MRI protocol when a stroke is suspected (17).
CE-MRA has been demonstrated to show all major intra- and extra-cranial arteries and veins and the venous sinuses and plexuses of the canine brain (151). Its use may be limited by magnetic field strength; 1.5T units may not be sufficient for producing images that can be interpreted easily, and while 3T units provide the same image quality as 7T units, quantitatively, more vessels may be visible on 7T units (17). A study performed using a 1.5T unit facilitated visualization of the rostral cerebral artery, cranial and caudal communicating arteries, middle cerebral artery, and the rostral cerebellar artery (157). There is discrepancy regarding whether or not the rostral cerebellar artery is readily visible on scanners other than 7T units. In one study, the rostral cerebellar artery was not reliably observed (17). In another study that used a 1.5T scanner, the rostral cerebellar artery was the only cerebellar artery that could be reliably detected (157).
TOF-MRA has demonstrated efficacy in confirming vessel occlusion in a canine experimental model of permanent occlusion of the middle cerebral artery (157). When evaluated 2–3 days following occlusion, the angiograms of all dogs demonstrated either complete or partial flow attenuation, depending on the degree of vessel occlusion (157). Overall, based on the relative ease of performing MRA and the diagnostic utility, either TOF-MRA or CE-MRA, or ideally both, should be incorporated into canine MRI protocols when an ischemic stroke is suspected. One logistical benefit of CE-MRA over TOF-MRA is the time to image acquisition. CE-MRA, typically performed as T1-w fast-field echo (T1-FFE) or fast low-angle shot (FLASH) sequences, have scan times in the 10–30 second time range and allow for breath-hold acquisitions. TOF-MRA scan times range from 8–10 min for human heads, with similar ranges expected for dogs (171).
Section 3: Select Emerging Sequences
Measuring Cerebral Blood Flow
PWI has been demonstrated to provide useful information regarding hemodynamic status in human patients actively undergoing stroke or at risk for stroke (30, 115). However, its use in human medicine is limited clinically by the risk of contrast-associated nephrogenic systemic fibrosis in patients with moderate to severe renal impairment (115, 172). This has led to the development of new studies of cerebral blood flow and hemodynamics that do not require gadolinium-based contrast (115). These sequences are newly emerging in human medicine and have yet to be investigated in veterinary patients.
Arterial Spin Labeling MRI
Currently, arterial spin labeling (ASL) is the most popular MRI hemodynamic analysis method that does not require exogenous contrast administration (115). To perform ASL, radiofrequency pulses are applied to the blood water proximal to the tissue of interest (115). A delay time is permitted and the radiofrequency-labeled blood water protons travel to the brain and exchange with tissue water (115). This leads to a small but measurable reduction in the tissue water magnetization proportional to the amount of exchange, which approximates CBF (115). The change is relatively small compared to the total amount of signal, so it is amplified by subtracting the images from a control image (115). Models of tracer kinetics are then applied to the ASL difference signal to quantify cerebral blood flow in units of milliliter of blood per 100 grams of tissue per minute (115, 173).
There are numerous ASL techniques that differ regarding the labeling application. In general, they can be grouped into two categories- pulsed ASL and continuous ASL (115, 174–176). Pulsed ASL uses one or two radiofrequency pulses of a duration of 3–15 milliseconds, which labels blood water over a large volume (80–120 millimeters) in the neck (115, 175, 176). Continuous ASL uses a long labeling pulse (1.5–2 s) at a single location in the neck (115, 177, 178). The signal to noise ratio in continuous ASL is 30–50% higher than pulsed ASL, so in principle continuous ASL is more desirable (115, 179). However, it requires special local transmit coils, whereas pulsed ASL can be performed using standard MRI coils (115, 180). A new labeling strategy is vessel-selective ASL (115, 181–183). In this technique, different feeding arteries, such as the left and right internal carotid arteries and basilar artery are separately labeled (115, 181–183). This gives a measure of perfusion territories and collateralization (112, 181–183).
There are currently no canine studies evaluating the use of ASL. ASL is a useful technique in human stroke evaluation because it does not require administration of a contrast agent. This eliminates the risk of contrast administration-associated morbidity. This appealing feature could be exploited in diagnostic investigation in dogs with suspected strokes and its use may reduce scan time. Based on clinical suspicion of a stroke, could be performed as one of the first sequences, eliminating the need for subsequent time-consuming, low-yield sequences.
Tractography
Diffusion Tensor Imaging (DTI) (Figure 11)
DTI-based tractography is a technique used to localize specific neuronal white matter fiber tracts (73). It is used in evaluation of intracranial space-occupying lesions such as brain tumors and vascular malformations associated with white matter (73, 184–189). It has also been used in stroke imaging to assess the relationship between fiber tracts and infarcts (73, 115, 190, 191). DTI was developed to visualize the orientation and properties of white matter and relies on anisotropy, or the direction-dependent diffusion of water (73). Diffusion is faster in the direction of fiber tracts rather than perpendicular to them (73). This is represented mathematically and graphically by a diffusion ellipsoid or tensor (73). When there is no directionality, the tensor is spherical, whereas in white matter tracts, the tensor is normally cigar shaped (73). The tensors of cerebral white matter can then be reconstructed to track the three-dimensional orientation of the fibers. The DTI data are also presented as two-dimensional fractional anisotropy maps. (73) Fractional anisotropy has been shown to decrease after stroke disintegration of gray-white matter distinction (73, 190, 191). It has demonstrated a fair correlation with clinical signs and may also be used to predict human patient outcomes after stroke (73, 192, 193). The main drawback to DTI-based tract-graphs is that it is not fully validated (73, 194–198). Additionally, tractography may underestimate or overestimate the quantity of fiber tracts (73, 199).
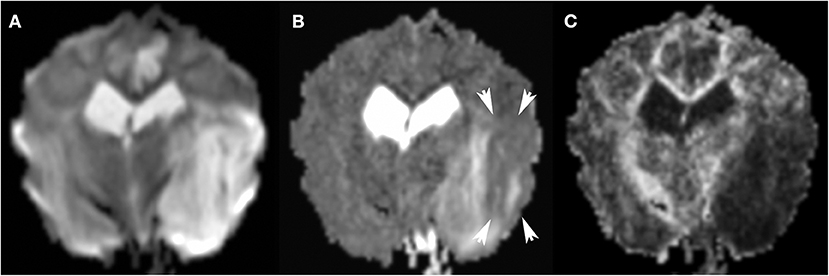
Figure 11. 3T MR, same dog as in Figure 9. The large areas of hyperintensity in Trace DW (A) are greatly attenuated in ADC map (B): persistent hyperintensity corresponds to vasogenic edema, and zones which transitioned to ADC hypointensity (arrows) correspond to cytotoxic edema. Many factors may affect the degree of ADC hypointensity, most importantly time since onset. In FA (C), the matching dark region indicates reduced anisotropy.
There are currently no canine studies evaluating the use of DTI in the context of vascular disease. However, currently in progress are feasibility and mapping studies in dogs (200). Fractional anisotropy has been demonstrated to reflect features that constrain water diffusion in white matter, including myelination and other microstructural factors (201). With optimization of these parameters, DTI may become a more useful tool in diagnosing strokes in dogs (200–202).
Long Term Monitoring
In general, most dogs recover from strokes with time and supportive care only (7, 23, 72). No specific treatment is available that affects the outcome of either ischemic or hemorrhagic strokes in dogs (7, 23, 71). Rather, treatment focuses on preventing secondary brain damage or complications associated with the underlying disease (7, 23).
There are limited studies evaluating the long-term MRI findings of stroke over time. In general, the lesion volume tends to increase in the 24 h to 8 days following stroke onset. Secondary changes, such as vasogenic edema and leukocyte infiltration, can lead to this increased volume, detectable on FLAIR sequences. In the chronic phase, infarct lesion volume decrements due to consolidation and pseudocystic tissue change and tissue loss (203, 204).
Conclusions
There are numerous established and novel CT and MRI modalities for evaluating stroke that hold promise for application in veterinary medicine. The main limitations for their use include temporal and resource associated factors. In general, few canine patients that undergo a stroke are evaluated in the same acute time frame as in people. This is likely because the features of strokes in dogs are less familiar than those in people. The temporal patterns observed between some of the imaging modalities used in human medicine may not be applicable to veterinary medicine. Additionally, while an increasing number of MR-equipped veterinary facilities are available, the investment in specialized coils or training for advanced techniques is lacking. Furthermore, no studies exist regarding interventions for canine stroke patients, which makes it challenging to defend advanced imaging modalities that add time under general anesthesia but otherwise have little impact on patient outcome. In cases where a stroke cannot be definitively distinguished as the cause of disease using standard T1-w, T2-w, FLAIR, SWI, and DWI/ADC images, the more novel modalities discussed in this review may be beneficial. Ultimately, the translational impact of veterinary use of these modalities may prove to be their most important application, particularly regarding establishing guidelines for long-term outcome in acute strokes.
Author Contributions
SP contributed to the study conceptualization. SA contributed to the manuscript composition. KG contributed to manuscript editing and image composition. FW contributed to manuscript editing.
Conflict of Interest
The authors declare that the research was conducted in the absence of any commercial or financial relationships that could be construed as a potential conflict of interest.
References
1. Wessmann A, Chandler K, Garosi L. Ischaemic and haemorrhagic stroke in the dog. Vet J. (2009) 180:290–303. doi: 10.1016/j.tvjl.2007.12.023
2. Victor M, Ropper AH (editors). Cerebrovascular disease. In: Adams and Victor's Principles of Neurology. McGraw Hill Professional (2001). p. 821–924.
3. Kalimo H, Kaste M, Haltia M. Vascular diseases In: Graham DI, Lantos PL, editors. Greenfield's Neuropathology. London: Arnold (1997). p. 315–96.
5. Inoue T, Kobayashi S, Sugita K. Dye injection method for the demonstration of territories supplied by individual perforating arteries of the posterior communicating artery in the dog. Stroke. (1985) 16:684–6. doi: 10.1161/01.STR.16.4.684
6. Kuwabara S, Uno J, Ishikawa S. A new model of brainstem ischemia in dogs. Stroke. (1988) 19:365–71. doi: 10.1161/01.STR.19.3.365
7. Martin-Vaquero P, Da Costa RC, Echandi RL, Tosti CL, Knopp MV, Sammet S. Time-of-flight magnetic resonance angiography of the canine brain at 3.0 Tesla and 7.0 Tesla. Am J Vet Res. (2011) 72:350–6. doi: 10.2460/ajvr.72.3.350
8. Levine JM, Levine GJ, Hoffman AG, Bratton G. Comparative anatomy of the horse, ox, and dog: the brain and associated vessels. Neurology. (2008) 3:153–164.
9. McConnell J, Garosi L, Platt S. Magnetic resonance imaging findings of presumed cerebellar cerebrovascular accident in twelve dogs. Vet Radiol Ultrasound. (2005) 46:1–10. doi: 10.1111/j.1740-8261.2005.00001.x
10. Platt SR, Garosi L. Canine cerebrovascular disease: do dogs have strokes? J Am Anim Hosp Assoc. (2003) 39:337–42. doi: 10.5326/0390337
11. Kapoor K, Kak V, Singh B. Morphology and comparative anatomy of circulus arteriosus cerebri in mammals. Anat Histol Embryol. (2003) 32:347–55. doi: 10.1111/j.1439-0264.2003.00492.x
12. Anderson WD, Kubicek W. The vertebral-basilar system of dog in relation to man and other mammals. Dev Dyn. (1971) 132:179–88. doi: 10.1002/aja.1001320205
13. Garosi L, McConnell J, Platt S, Barone G, Baron J, Lahunta A, et al. Results of diagnostic investigations and long-term outcome of 33 dogs with brain infarction (2000–2004). J Vet Intern Med. (2005) 19:725–31. doi: 10.1111/j.1939-1676.2005.tb02752.x
14. Joseph R, Greenlee P, Carrillo J, Kay W. Canine cerebrovascular disease: clinical and pathological findings in 17 cases. J Am Anim Hosp Assoc. (1988) 24:569–76.
15. Salger F, Stahl C, Vandevelde M, Piersigilli A, Henke D. Multifocal ischemic brain infarctions secondary to spontaneous basilar artery occlusion in a dog with systemic thromboembolic disease. J Vet Intern Med. (2014) 28:1875–80. doi: 10.1111/jvim.12447
16. Garosi L, McConnell J, Platt S, Barone G, Baron J, Lahunta Ad, et al. Clinical and topographic magnetic resonance characteristics of suspected brain infarction in 40 dogs. J Vet Intern Med. (2006) 20:311–21. doi: 10.1111/j.1939-1676.2006.tb02862.x
17. Kent M, Glass EN, Haley AC, March P, Rozanski EA, Galban EM, et al. Ischemic stroke in greyhounds: 21 cases (2007–2013). J Am Vet Med Assoc. (2014) 245:113–7. doi: 10.2460/javma.245.1.113
18. Kent M, Delahunta A, Tidwell AS. MR imaging findings in a dog with intravascular lymphoma in the brain. Vet Radiol Ultrasound. (2001) 42:504–10. doi: 10.1111/j.1740-8261.2001.tb00977.x
19. Cook LB, Coates JR, Dewey CW, Gordon S, Miller MW, Bahr A. Vascular encephalopathy associated with bacterial endocarditis in four dogs. J Am Anim Hosp Assoc. (2005) 41:252–8. doi: 10.5326/0410252
20. Patton C, Garner F. Cerebral infarction caused by heartworms (Dirofilaria immitis) in a dog. J Am Vet Med Assoc. (1970) 156:600–5.
21. Axlund TW, Isaacs AM, Holland M, O'Brien DP. Fibrocartilaginous embolic encephalomyelopathy of the brainstem and midcervical spinal cord in a dog. J Vet Intern Med. (2004) 18:765–7. doi: 10.1111/j.1939-1676.2004.tb02620.x
22. Patterson J, Rusley M, Zachary J. Neurologic manifestations of cerebrovascular atherosclerosis associated with primary hypothyroidism in a dog. J Am Vet Med Assoc. (1985) 186:499–503.
23. Garosi LS. Cerebrovascular disease in dogs and cats. Vet Clin Small Anim Pract. (2010) 40:65–79. doi: 10.1016/j.cvsm.2009.09.001
24. Hess RS, Kass PH, Winkle TJ. Association between diabetes mellitus, hypothyroidism or hyperadrenocorticism, and atherosclerosis in dogs. J Vet Intern Med. (2003) 17:489–94. doi: 10.1111/j.1939-1676.2003.tb02469.x
26. Adams HP Jr, Hachinski V, Norris JW. Ischemic Cerebrovascular Disease. New York, NY: Oxford University Press (2001).
27. Sacco RL, Toni D, Brainin M, Mohr JP. Classification of Ischemic Stroke. In: Mohr JP, Choi DW, Grotta JC, Weir B, Wolf PA, editors. STROKE-Pathophysiology, Diagnosis, and Management, 4th ed. London: Churchill Livingstone (2004). p. 61–74. doi: 10.1016/B0-44-306600-0/50008-0
28. Fox PR, Petrie JP, Hohenhaus AE. Peripheral vascular disease. In: Ettinger SJ, Feldman EC, Cote E, editors. Textbook of Veterinary Internal Medicine. 6th ed. Philadelphia, PA: St. Louis Elsevier (2005).
29. Gerriets T, Stolz E, Walberer M, Müller C, Kluge A, Bachmann A, et al. Noninvasive quantification of brain edema and the space-occupying effect in rat stroke models using magnetic resonance imaging. Stroke. (2004) 35:566–71. doi: 10.1161/01.STR.0000113692.38574.57
30. Leiva-Salinas C, Wintermark M, Kidwell CS. Neuroimaging of cerebral ischemia and infarction. Neurotherapeutics. (2011) 8:19–27. doi: 10.1007/s13311-010-0004-2
31. Wintermark M, Maeder P, Thiran J-P, Schnyder P, Meuli R. Quantitative assessment of regional cerebral blood flows by perfusion CT studies at low injection rates: a critical review of the underlying theoretical models. Eur Radiol. (2001) 11:1220–30. doi: 10.1007/s003300000707
32. Wintermark M, Reichhart M, Thiran JP, Maeder P, Chalaron M, Schnyder P, et al. Prognostic accuracy of cerebral blood flow measurement by perfusion computed tomography, at the time of emergency room admission, in acute stroke patients. Ann Neurol. (2002) 51:417–32. doi: 10.1002/ana.10136
33. Heiss W-D, Sobesky J, Hesselmann V. Identifying thresholds for penumbra and irreversible tissue damage. Stroke. (2004) 35(Suppl. 1):2671–4. doi: 10.1161/01.STR.0000143329.81997.8a
34. Birenbaum D, Bancroft LW, Felsberg GJ. Imaging in acute stroke. West J Emerg Med. (2011) 12:67–76.
35. Srinivasan A, Goyal M, Azri FA, Lum C. State-of-the-art imaging of acute stroke. Radiographics. (2006) 26(suppl. 1):S75–95. doi: 10.1148/rg.26si065501
36. Lin K, Rapalino O, Law M, Babb J, Siller K, Pramanik B. Accuracy of the alberta stroke program early CT score during the first 3 hours of middle cerebral artery stroke: comparison of noncontrast CT, CT angiography source images, and CT perfusion. Am J Neuroradiol. (2008) 29:931–6. doi: 10.3174/ajnr.A0975
37. Konstas A, Goldmakher G, Lee T-Y, Lev M. Theoretic basis and technical implementations of CT perfusion in acute ischemic stroke, part 1: theoretic basis. Am J Neuroradiol. (2009) 30:662–8. doi: 10.3174/ajnr.A1487
38. Gasparotti R, Grassi M, Mardighian D, Frigerio M, Pavia M, Liserre R, et al. Perfusion CT in patients with acute ischemic stroke treated with intra-arterial thrombolysis: predictive value of infarct core size on clinical outcome. Am J Neuroradiol. (2009) 30:722–7. doi: 10.3174/ajnr.A1439
39. Eastwood JD, Lev MH, Provenzale JM. Perfusion CT with iodinated contrast material. Am J Roentgenol. (2003) 180:3–12. doi: 10.2214/ajr.180.1.1800003
41. Collaborators NMSS, Sacco RL, Boden-Albala B, Gan R, Chen X, Kargman DE, et al. Stroke incidence among white, black, and hispanic residents of an urban community: the northern manhattan stroke study. Am J Epidemiol. (1998) 147:259–68. doi: 10.1093/oxfordjournals.aje.a009445
42. Sahni R, Weinberger J. Management of intracerebral hemorrhage. Vasc Health Risk Manag. (2007) 3:701–9.
43. Muhle A, Jaggy A, Kircher P, Lang J, Fazer R, Scheidegger J. Intracranial haemorrhage in an eight-week-old puppy. Vet Res. (2004) 154:338–9. doi: 10.1136/vr.154.11.338
44. Subramaniam S, Hill MD. Controversies in medical management of intracerebral hemorrhage. Can J Neurol Sci. (2005) 32:S13–21.
45. Lowrie M, De Risio L, Dennis R, Llabrés-Díaz F, Garosi L. Concurrent medical conditions and long-term outcome in dogs with nontraumatic intracranial hemorrhage. Vet Radiol Ultrasound. (2012) 53:381–8. doi: 10.1111/j.1740-8261.2012.01934.x
46. Fankhauser R, Luginbühl H, McGrath J. Cerebrovascular disease in various animal species. Ann NY Acad Sci. (1965) 127:817–60. doi: 10.1111/j.1749-6632.1965.tb49447.x
47. Sasaki M, Pool R, Summers B. Vasculitis in a dog resembling isolated angiitis of the central nervous system in humans. Vet Pathol. (2003) 40:95–7. doi: 10.1354/vp.40-1-95
48. Asakawa MG, Mackillop E, Olby NJ, Robertson ID, Cullen JM. Imaging diagnosis—neuronal ceroid lipofuscinosis with a chronic subdural hematoma. Vet Radiol Ultrasound. (2010) 51:155–8. doi: 10.1111/j.1140-8261.2009.01642.x
49. Auer RN, Sutherland GR. Primary intracerebral hemorrhage: pathophysiology. Can J Neurol Sci. (2005) 32:S3–12.
50. Uchida K, Miyauchi Y, Nakayama H, Goto N. Amyloid angiopathy with cerebral hemorrhage and senile plaque in aged dogs. Nihon Juigaku Zasshi. (1990) 52:605–11. doi: 10.1292/jvms1939.52.605
51. Haller S, Vernooij MW, Kuijer JPA, Larsson EM, Jager HR, Barkhof F. Cerebral microbleeds: imaging and clinical significance. Radiology. (2018) 287:11–28. doi: 10.1148/radiol.2018170803
52. Dewey C, Downs M, Aron D, Mahaffey E. Acute traumatic intracranial haemorrhage in dogs and cats. Vet Comp Orthop. Traumatol. (1993) 6:153–9. doi: 10.1055/s-0038-1633114
53. Wintermark M, Albers GW, Alexandrov AV, Alger JR, Bammer R, Baron J-C, et al. Acute stroke imaging research roadmap. Stroke. (2008) 39:1621–8. doi: 10.1161/STROKEAHA.107.512319
54. Truwit C, Barkovich A, Gean-Marton A, Hibri N, Norman D. Loss of the insular ribbon: another early CT sign of acute middle cerebral artery infarction. Radiology. (1990) 176:801–6. doi: 10.1148/radiology.176.3.2389039
55. Tomura N, Uemura K, Inugami A, Fujita H, Higano S, Shishido F. Early CT finding in cerebral infarction: obscuration of the lentiform nucleus. Radiology. (1988) 168:463–7. doi: 10.1148/radiology.168.2.3393665
56. Tomsick T, Brott TG, Chambers A, Fox A, Gaskill M, Lukin R, et al. Hyperdense middle cerebral artery sign on CT: efficacy in detecting middle cerebral artery thrombosis. Am J Neuroradiol. (1990) 11:473–7.
57. Parizel P, Makkat S, Van Miert E, Van Goethem J, Van den Hauwe L, De Schepper A. Intracranial hemorrhage: principles of CT and MRI interpretation. Eur Radiol. (2001) 11:1770–83. doi: 10.1007/s003300000800
58. Bergström M, Ericson K, Levander B, Svendsen P, Larsson S. Variation with time of the attenuation values of intracranial hematomas. J Comp Assist tomogr. (1977) 1:57–63. doi: 10.1097/00004728-197701000-00008
59. Scotti G, Ethier R, Melançon D, Terbrugge K, Tchang S. Computed tomography in the evaluation of intracranial aneurysms and subarachnoid hemorrhage. Radiology. (1977) 123:85–90. doi: 10.1148/123.1.85
60. Barber P, Darby D, Desmond P, Gerraty R, Yang Q, Li T, et al. Identification of major ischemic change: diffusion-weighted imaging versus computed tomography. Stroke. (1999) 30:2059–65. doi: 10.1161/01.STR.30.10.2059
61. Khan R, Nael K, Erly W. Acute stroke imaging: what clinicians need to know. Am J Med. (2013) 126:379–86. doi: 10.1016/j.amjmed.2012.11.014
62. von Kummer R, Bourquain H, Bastianello S, Bozzao L, Manelfe C, Meier D, et al. Early prediction of irreversible brain damage after ischemic stroke at CT. Radiology. (2001) 219:95–100. doi: 10.1148/radiology.219.1.r01ap0695
63. Larrue V, von Kummer RR, Muller A, Bluhmki E. Risk factors for severe hemorrhagic transformation in ischemic stroke patients treated with recombinant tissue plasminogen activator: a secondary analysis of the European-Australasian acute stroke study (ECASS II). Stroke. (2001) 32:438–41. doi: 10.1161/01.STR.32.2.438
64. Paul AE, Lenard Z, Mansfield CS. Computed tomography diagnosis of eight dogs with brain infarction. Aust Vet J. (2010) 88:374–80. doi: 10.1111/j.1751-0813.2010.00629.x
65. Thomas WB. Cerebrovascular disease. Vet Clin North Am Small Anim Pract. (1996) 26:925–43. doi: 10.1016/S0195-5616(96)50112-9
66. Berg JM, Joseph RJ. Cerebellar infarcts in two dogs diagnosed with magnetic resonance imaging. J Am Anim Hosp Assoc. (2003) 39:203–7. doi: 10.5326/0390203
67. Kranz PG, Eastwood JD. Does diffusion-weighted imaging represent the ischemic core? An evidence-based systematic review. AJNR Am J Neuroradiol. (2009) 30:1206–12. doi: 10.3174/ajnr.A1547
68. Allen LM, Hasso AN, Handwerker J, Farid H. Sequence-specific MR imaging findings that are useful in dating ischemic stroke. RadioGraphics. (2012) 32:1285–97. doi: 10.1148/rg.325115760
69. Gauvrit JY, Leclerc X, Girot M, Cordonnier C, Sotoares G, Henon H, et al. Fluid–attenuated inversion recovery (FLAIR) sequences for the assessment of acute stroke. J Neurol. (2006) 253:631–5. doi: 10.1007/s00415-005-0075-x
70. Wolff CA, Holmes SP, Young BD, Chen AV, Kent M, Platt SR, et al. Magnetic resonance imaging for the differentiation of neoplastic, inflammatory, and cerebrovascular brain disease in dogs. J Vet Intern Med. (2012) 26:589–97. doi: 10.1111/j.1939-1676.2012.00899.x
71. Cervera V, Mai W, Vite CH, Johnson V, Dayrell-Hart B, Seiler GS. Comparative magnetic resonance imaging findings between gliomas and presumed cerebrovascular accidents in dogs. Vet Radiol Ultrasound. (2011) 52:33–40. doi: 10.1111/j.1740-8261.2010.01749.x
72. Vite CH, Cross JR. Correlating magnetic resonance findings with neuropathology and clinical signs in dogs and cats. Vet Radiol Ultrasound. (2011) 52(Suppl. 1):S23–31. doi: 10.1111/j.1740-8261.2010.01782.x
73. Adam G, Ferrier M, Patsoura S, Gramada R, Meluchova Z, Cazzola V, et al. Magnetic resonance imaging of arterial stroke mimics: a pictorial review. Insights Imaging. (2018) 9:815–31. doi: 10.1007/s13244-018-0637-y
74. Fulkerson CV, Young BD, Jackson ND, Porter B, Levine JM. MRI characteristics of cerebral microbleeds in four dogs. Vet Radiol Ultrasound. (2012) 53:389–93. doi: 10.1111/j.1740-8261.2011.01910.x
75. Yao B, Li TQ, Gelderen P, Shmueli K, de Zwart JA, Duyn JH. Susceptibility contrast in high field MRI of human brain as a function of tissue iron content. NeuroImage. (2009) 44:1259–66. doi: 10.1016/j.neuroimage.2008.10.029
76. Bradley WG Jr. MR appearance of hemorrhage in the brain. Radiology. (1993) 189:15–26. doi: 10.1148/radiology.189.1.8372185
77. Thomas WB, Adams WH, McGavin MD, Gompf RE. Magnetic resonance imaging appearance of intracranial hemorrhage secondary to cerebral vascular malformation in a dog. Vet Radiol Ultrasound. (1997) 38:371–5. doi: 10.1111/j.1740-8261.1997.tb02100.x
78. Wasenko JJ, Lieberman KA, Rodziewicz GS, Holsapple JW. Magnetic resonance imaging characteristics of hyperacute hemorrhage in the brain and spine. Clin Imaging. (2002) 26:330–7. doi: 10.1016/S0899-7071(02)00444-8
79. Liu W, Soderlund K, Senseney JS, Joy D, Yeh P-H, Ollinger J, et al. Imaging cerebral microhemorrhages in military service members with chronic traumatic brain injury. Radiology. (2015) 278:536–45. doi: 10.1148/radiol.2015150160
80. Weingarten K, Zimmerman RD, Deo-Narine V, Markisz J, Cahill PT, Deck MD. MR imaging of acute intracranial hemorrhage: findings on sequential spin-echo and gradient-echo images in a dog model. AJNR Am J Neuroradiol. (1991) 12:457–67.
81. Henkelman RM, Watts JF, Kucharczyk W. High signal intensity in MR images of calcified brain tissue. Radiology. (1991) 179:199–206. doi: 10.1148/radiology.179.1.1848714
82. Cakirer S, Karaarslan E, Arslan A. Spontaneously T1-hyperintense lesions of the brain on MRI: a pictorial review. Curr Probl Diagn Radiol. (2003) 32:194–217. doi: 10.1016/S0363-0188(03)00026-4
83. Malghem J, Lecouvet FE, Francois R, Vande Berg BC, Duprez T, Cosnard G, et al. High signal intensity of intervertebral calcified disks on T1-weighted MR images resulting from fat content. Skelet Radiol. (2005) 34:80–6. doi: 10.1007/s00256-004-0843-1
84. Hasegawa D, Kobayashi M, Fujita M, Uchida K, Orima H. A meningioma with hyperintensity on T1-weighted images in a dog. J Vet Med Sci. (2008) 70:615–7. doi: 10.1292/jvms.70.615
85. Kinoshita T, Ogawa T, Yoshida Y, Tamura H, Kado H, Okudera T. Curvilinear T1 hyperintense lesions representing cortical necrosis after cerebral infarction. Neuroradiology. (2005) 47:647–51. doi: 10.1007/s00234-005-1398-0
86. Ginat DT, Meyers SP. Intracranial lesions with high signal intensity on T1-weighted MR images: differential diagnosis. Radiographics. (2012) 32:499–516. doi: 10.1148/rg.322105761
87. Hajnal JV, De Coene B, Lewis PD, Baudouin CJ, Cowan FM, Pennock JM, et al. High signal regions in normal white matter shown by heavily T2-weighted CSF nulled IR sequences. J Comput Assist Tomogr. (1992) 16:506–13. doi: 10.1097/00004728-199207000-00002
88. Kang BT, Jang DP, Gu SH, Lee JH, Jung DI, Lim CY, et al. MRI features in a canine model of ischemic stroke: correlation between lesion volume and neurobehavioral status during the subacute stage. Comp Med. (2009) 59:459–64.
89. Xu XQ, Cheng QG, Zu QQ, Lu SS, Yu J, Sheng Y, et al. Comparative study of the relative signal intensity on DWI, FLAIR, and T2 images in identifying the onset time of stroke in an embolic canine model. Neurol Sci. (2014) 35:1059–65. doi: 10.1007/s10072-014-1643-6
90. Xu XQ, Zu QQ, Lu SS, Cheng QG, Yu J, Sheng Y, et al. Use of FLAIR imaging to identify onset time of cerebral ischemia in a canine model. AJNR Am J Neuroradiol. (2014) 35:311–6. doi: 10.3174/ajnr.A3689
91. Mohr JP, Biller J, Hilal SK, Yuh WT, Tatemichi TK, Hedges S, et al. Magnetic resonance versus computed tomographic imaging in acute stroke. Stroke. (1995) 26:807–12. doi: 10.1161/01.STR.26.5.807
92. Thomalla G, Rossbach P, Rosenkranz M, Siemonsen S, Krutzelmann A, Fiehler J, et al. Negative fluid-attenuated inversion recovery imaging identifies acute ischemic stroke at 3 hours or less. Ann Neurol. (2009) 65:724–32. doi: 10.1002/ana.21651
93. Vu D, González RG, Schaefer PW. Conventional MRI and MR angiography of stroke. In: González RG, Hirsch JA, Koroshetz WJ, Lev MH, Schaefer PW, editors. Acute Ischemic Stroke: Imaging and Intervention. Berlin. Heidelberg: Springer Berlin Heidelberg. (2006) p. 115–37. doi: 10.1007/3-540-30810-5_6
94. Fiebach JB, Schellinger PD, Geletneky K, Wilde P, Meyer M, Hacke W, et al. MRI in acute subarachnoid haemorrhage; findings with a standardised stroke protocol. Neuroradiology. (2004) 46:44–8. doi: 10.1007/s00234-003-1132-8
95. Boukobza M, Crassard I, Bousser MG, Chabriat H. MR imaging features of isolated cortical vein thrombosis: diagnosis and follow-up. AJNR Am J Neuroradiol. (2009) 30:344–8. doi: 10.3174/ajnr.A1332
96. Lovblad KO, Bassetti C, Schneider J, Guzman R, El-Koussy M, Remonda L, et al. Diffusion-weighted mr in cerebral venous thrombosis. Cerebrovasc Dis. (2001) 11:169–76. doi: 10.1159/000047634
97. Makkat S, Vandevenne JE, Verswijvel G, Ijsewijn T, Grieten M, Palmers Y, et al. Signs of acute stroke seen on fluid-attenuated inversion recovery MR imaging. AJR Am J Roentgenol. (2002) 179:237–43. doi: 10.2214/ajr.179.1.1790237
98. Cheng B, Brinkmann M, Forkert ND, Treszl A, Ebinger M, Kohrmann M, et al. Quantitative measurements of relative fluid-attenuated inversion recovery (FLAIR) signal intensities in acute stroke for the prediction of time from symptom onset. J Cereb Blood Flow Metab. (2013) 33:76–84. doi: 10.1038/jcbfm.2012.129
99. Ebinger M, Galinovic I, Rozanski M, Brunecker P, Endres M, Fiebach JB. Fluid-attenuated inversion recovery evolution within 12 hours from stroke onset: a reliable tissue clock? Stroke. (2010) 41:250–5. doi: 10.1161/STROKEAHA.109.568410
100. Aoki J, Kimura K, Iguchi Y, Shibazaki K, Sakai K, Iwanaga T. FLAIR can estimate the onset time in acute ischemic stroke patients. J Neurol Sci. (2010) 293:39–44. doi: 10.1016/j.jns.2010.03.011
101. Rossmeisl JH Jr, Rohleder JJ, Pickett JP, Duncan R, Herring IP. Presumed and confirmed striatocapsular brain infarctions in six dogs. Vet Ophthalmol. (2007) 10:23–36. doi: 10.1111/j.1463-5224.2007.00487.x
102. Noguchi K, Ogawa T, Inugami A, Fujita H, Hatazawa J, Shimosegawa E, et al. MRI of acute cerebral infarction: a comparison of FLAIR and T2-weighted fast spin-echo imaging. Neuroradiology. (1997) 39:406–10. doi: 10.1007/s002340050433
103. Sanossian N, Saver JL, Alger JR, Kim D, Duckwiler GR, Jahan R, et al. Angiography reveals that fluid-attenuated inversion recovery vascular hyperintensities are due to slow flow, not thrombus. AJNR Am J Neuroradiol. (2009) 30:564–8. doi: 10.3174/ajnr.A1388
104. Liu W, Xu G, Yue X, Wang X, Ma M, Zhang R, et al. Hyperintense vessels on FLAIR: a useful non-invasive method for assessing intracerebral collaterals. Eur J Radiol. (2011) 80:786–91. doi: 10.1016/j.ejrad.2010.09.043
105. Dani KA, Latour LL, Warach S. Hyperintense vessel sign on fluid-attenuated inversion recovery MR imaging is reduced by gadolinium. AJNR Am J Neuroradiol. (2012) 33:E112–4. doi: 10.3174/ajnr.A2482
106. Maeda M, Koshimoto Y, Uematsu H, Yamada H, Kimura H, Kawamura Y, et al. Time course of arterial hyperintensity with fast fluid-attenuated inversion-recovery imaging in acute and subacute middle cerebral arterial infarction. J Magn Reson Imaging JMRI. (2001) 13:987–90. doi: 10.1002/jmri.1142
107. Neumann AB, Jonsdottir KY, Mouridsen K, Hjort N, Gyldensted C, Bizzi A, et al. Interrater agreement for final infarct MRI lesion delineation. Stroke. (2009) 40:3768–71. doi: 10.1161/STROKEAHA.108.545368
108. Hoggard N, Wilkinson ID, Paley MN, Griffiths PD. Imaging of haemorrhagic stroke. Clin Radiol. (2002) 57:957–68. doi: 10.1053/crad.2002.0954
109. Hayman LA, Taber KH, Ford JJ, Bryan RN. Mechanisms of MR signal alteration by acute intracerebral blood: old concepts and new theories. AJNR Am J Neuroradiol. (1991) 12:899–907.
110. Greenberg SM, Nandigam RN, Delgado P, Betensky RA, Rosand J, Viswanathan A, et al. Microbleeds versus macrobleeds: evidence for distinct entities. Stroke. (2009) 40:2382–6. doi: 10.1161/STROKEAHA.109.548974
111. Sueda Y, Naka H, Ohtsuki T, Kono T, Aoki S, Ohshita T, et al. Positional relationship between recurrent intracerebral hemorrhage/lacunar infarction and previously detected microbleeds. AJNR Am J Neuroradiol. (2010) 31:1498–503. doi: 10.3174/ajnr.A2100
112. Werring DJ, Frazer DW, Coward LJ, Losseff NA, Watt H, Cipolotti L, et al. Cognitive dysfunction in patients with cerebral microbleeds on T2*-weighted gradient-echo MRI. Brain J Neurol. (2004) 127:2265–75. doi: 10.1093/brain/awh253
113. Cordonnier C, Al-Shahi Salman R, Wardlaw J. Spontaneous brain microbleeds: systematic review, subgroup analyses and standards for study design and reporting. Brain J Neurol. (2007) 130:1988–2003. doi: 10.1093/brain/awl387
114. Macellari F, Paciaroni M, Agnelli G, Caso V. Neuroimaging in intracerebral hemorrhage. Stroke. (2014) 45:903–8. doi: 10.1161/STROKEAHA.113.003701
115. Donahue MJ, Strother MK, Hendrikse J. Novel MRI approaches for assessing cerebral hemodynamics in ischemic cerebrovascular disease. Stroke. (2012) 43:903–15. doi: 10.1161/STROKEAHA.111.635995
116. Fiebach JB, Schellinger PD, Gass A, Kucinski T, Siebler M, Villringer A, et al. Stroke magnetic resonance imaging is accurate in hyperacute intracerebral hemorrhage: a multicenter study on the validity of stroke imaging. Stroke. (2004) 35:502–6. doi: 10.1161/01.STR.0000114203.75678.88
117. Kidwell CS, Chalela JA, Saver JL, Starkman S, Hill MD, Demchuk AM, et al. Comparison of MRI and CT for detection of acute intracerebral hemorrhage. JAMA. (2004) 292:1823–30. doi: 10.1001/jama.292.15.1823
118. Tidwell AS, Robertson ID. Magnetic resonance imaging of normal and abnormal brain perfusion. Vet Radiol Ultrasound. (2011) 52(Suppl. 1):S62–71. doi: 10.1111/j.1740-8261.2010.01786.x
119. Astrup J, Siesjo BK, Symon L. Thresholds in cerebral ischemia - the ischemic penumbra. Stroke. (1981) 12:723–5. doi: 10.1161/01.STR.12.6.723
120. Read SJ, Hirano T, Abbott DF, Markus R, Sachinidis JI, Tochon-Danguy HJ, et al. The fate of hypoxic tissue on 18F-fluoromisonidazole positron emission tomography after ischemic stroke. Ann Neurol. (2000) 48:228–35. doi: 10.1002/1531-8249(200008)48:2<228::AID-ANA13>3.0.CO;2-B
121. Kohno K, Hoehn-Berlage M, Mies G, Back T, Hossmann KA. Relationship between diffusion-weighted MR images, cerebral blood flow, and energy state in experimental brain infarction. Magn Reson Imaging. (1995) 13:73–80. doi: 10.1016/0730-725X(94)00080-M
122. Sener RN. Diffusion MRI: apparent diffusion coefficient (ADC) values in the normal brain and a classification of brain disorders based on ADC values. Comput Med Imaging Graph. (2001) 25:299–326. doi: 10.1016/S0895-6111(00)00083-5
123. MacLellan MJ, Ober CP, Feeney DA, Jessen CR. Diffusion-weighted magnetic resonance imaging of the brain of neurologically normal dogs. J Am Vet Med Assoc. (2017) 78:601–8. doi: 10.2460/ajvr.78.5.601
124. Fisher M, Albers GW. Applications of diffusion-perfusion magnetic resonance imaging in acute ischemic stroke. Neurology. (1999) 52:1750–6. doi: 10.1212/WNL.52.9.1750
125. Schaefer PW, Grant PE, Gonzalez RG. Diffusion-weighted MR imaging of the brain. Radiology. (2000) 217:331–45. doi: 10.1148/radiology.217.2.r00nv24331
126. Moritani T, Ekholm S, Westesson P. Diffusion-Weighted MR Imaging of the Brain. 2nd ed. Berlin: Springer (2009).
127. Moseley ME, Kucharczyk J, Mintorovitch J, Cohen Y, Kurhanewicz J, Derugin N, et al. Diffusion-weighted MR imaging of acute stroke: correlation with T2-weighted and magnetic susceptibility-enhanced MR imaging in cats. AJNR Am J Neuroradiol. (1990) 11:423–9.
128. Kunz A, Hahn G, Mucha D, Muller A, Barrett KM, von Kummer R, et al. Echo-enhanced transcranial color-coded duplex sonography in the diagnosis of cerebrovascular events: a validation study. AJNR Am J Neuroradiol. (2006) 27:2122–7.
129. Wang Y, Cheung PT, Shen GX, Bhatia I, Wu EX, Qiu D, et al. Comparing diffusion-weighted and T2-weighted MR imaging for the quantification of infarct size in a neonatal rat hypoxic-ischemic model at 24h post-injury. Int J Dev Neurosci. (2007) 25:1–5. doi: 10.1016/j.ijdevneu.2006.12.003
130. Liu S, Xu X, Cheng Q, Zu Q, Lu S, Yu J, et al. Simple quantitative measurement based on DWI to objectively judge DWI-FLAIR mismatch in a canine stroke model. Diagn Interv Radiol. (2015) 21:348–54. doi: 10.5152/dir.2015.14443
131. Fiehler J, Knudsen K, Kucinski T, Kidwell CS, Alger JR, Thomalla G, et al. Predictors of apparent diffusion coefficient normalization in stroke patients. Stroke. (2004) 35:514–9. doi: 10.1161/01.STR.0000114873.28023.C2
132. Rivers CS, Wardlaw JM, Armitage PA, Bastin ME, Hand PJ, Dennis MS. Acute ischemic stroke lesion measurement on diffusion-weighted imaging–important considerations in designing acute stroke trials with magnetic resonance imaging. J Stroke Cerebrovasc Dis. (2007) 16:64–70. doi: 10.1016/j.jstrokecerebrovasdis.2006.11.003
133. Thomas RG, Lymer GK, Armitage PA, Chappell FM, Carpenter T, Karaszewski B, et al. Apparent diffusion coefficient thresholds and diffusion lesion volume in acute stroke. J Stroke Cerebrovasc Dis. (2013) 22:906–9. doi: 10.1016/j.jstrokecerebrovasdis.2012.09.018
134. Grandin CB. Assessment of brain perfusion with MRI: methodology and application to acute stroke. Neuroradiology. (2003) 45:755–66. doi: 10.1007/s00234-003-1024-y
135. Rosen BR, Belliveau JW, Vevea JM, Brady TJ. Perfusion imaging with NMR contrast agents. Magn Reson Med. (1990) 14:249–65. doi: 10.1002/mrm.1910140211
136. Maeda M, Yamamoto T, Daimon S, Sakuma H, Takeda K. Arterial hyperintensity on fast fluid-attenuated inversion recovery images: a subtle finding for hyperacute stroke undetected by diffusion-weighted MR imaging. AJNR Am J Neuroradiol. (2001) 22:632–6.
137. Lu SS, Liu S, Zu QQ, Xu XQ, Wang JW, Yu J, et al. Multimodal magnetic resonance imaging for assessing lacunar infarction after proximal middle cerebral artery occlusion in a canine model. Chin Med J. (2013) 126:311–7.
138. Hacke W, Albers G, Al-Rawi Y, Bogousslavsky J, Davalos A, Eliasziw M, et al. The desmoteplase in acute ischemic stroke trial (DIAS): a phase II MRI-based 9-hour window acute stroke thrombolysis trial with intravenous desmoteplase. Stroke. (2005) 36:66–73. doi: 10.1161/01.STR.0000149938.08731.2c
139. Albers GW, Thijs VN, Wechsler L, Kemp S, Schlaug G, Skalabrin E, et al. Magnetic resonance imaging profiles predict clinical response to early reperfusion: the diffusion and perfusion imaging evaluation for understanding stroke evolution (DEFUSE) study. Ann Neurol. (2006) 60:508–17. doi: 10.1002/ana.20976
140. Davis SM, Donnan GA, Parsons MW, Levi C, Butcher KS, Peeters A, et al. Effects of alteplase beyond 3 h after stroke in the echoplanar imaging thrombolytic evaluation trial (EPITHET): a placebo-controlled randomised trial. Lancet Neurol. (2008) 7:299–309.
141. Wechsler LR. Imaging evaluation of acute ischemic stroke. Stroke. (2011) 42(Suppl.):S12–5. doi: 10.1161/STROKEAHA.110.599555
142. Kidwell CS, Saver JL, Mattiello J, Starkman S, Vinuela F, Duckwiler G, et al. Thrombolytic reversal of acute human cerebral ischemic injury shown by diffusion/perfusion magnetic resonance imaging. Ann Neurol. (2000) 47:462–9. doi: 10.1002/1531-8249(200004)47:4&<462::AID-ANA9&>3.0.CO;2-Y
143. Grant PE, He J, Halpern EF, Wu O, Schaefer PW, Schwamm LH, et al. Frequency and clinical context of decreased apparent diffusion coefficient reversal in the human brain. Radiology. (2001) 221:43–50. doi: 10.1148/radiol.2211001523
144. Boxerman KW, Kalnin A, Kaufmann T, Shiroishi M, Wintermark M. ASFNR Recommendations for clinical performance of MR dynamic susceptibility contrast perfusion imaging of the brain. Am J Neuroradiol. (2015) 36:E41–51. doi: 10.3174/ajnr.A4341
145. Munich SA, Shakir HJ, Snyder V. Role of CT perfusion in acute stroke management. Cor Vasa. (2016) 58:215–24. doi: 10.1016/j.crvasa.2016.01.008
146. Barlinn K, Alexandrov AV. Vascular imaging in stroke: comparative analysis. Neurotherapeutics. (2011) 8:340–8. doi: 10.1007/s13311-011-0042-4
147. Schellinger PD. The evolving role of advanced MR imaging as a management tool for adult ischemic stroke: a Western-European perspective. Neuroimaging Clin N Am. (2005) 15:245–58. doi: 10.1016/j.nic.2005.06.003
148. Tomandl BF, Klotz E, Handschu R, Stemper B, Reinhardt F, Huk WJ, et al. Comprehensive imaging of ischemic stroke with multisection CT. Radiographics. (2003) 23:565–92. doi: 10.1148/rg.233025036
149. Vieco PT. CT angiography of the intracranial circulation. Neuroimaging Clin N Am. (1998) 8:577–92.
150. Bash S, Villablanca JP, Jahan R, Duckwiler G, Tillis M, Kidwell C, et al. Intracranial vascular stenosis and occlusive disease: evaluation with CT angiography, MR angiography, and digital subtraction angiography. AJNR Am J Neuroradiol. (2005) 26:1012–21.
151. Saqqur M, Uchino K, Demchuk AM, Molina CA, Garami Z, Calleja S, et al. Site of arterial occlusion identified by transcranial doppler predicts the response to intravenous thrombolysis for stroke. Stroke. (2007) 38:948–54. doi: 10.1161/01.STR.0000257304.21967.ba
152. Lev MH, Farkas J, Rodriguez VR, Schwamm LH, Hunter GJ, Putman CM, et al. CT angiography in the rapid triage of patients with hyperacute stroke to intraarterial thrombolysis: accuracy in the detection of large vessel thrombus. J Comput Assist Tomogr. (2001) 25:520–8. doi: 10.1097/00004728-200107000-00003
153. Prokop M. Multislice CT angiography. Eur J Radiol. (2000) 36:86–96. doi: 10.1016/S0720-048X(00)00271-0
154. Schramm P, Schellinger PD, Fiebach JB, Heiland S, Jansen O, Knauth M, et al. Comparison of CT and CT angiography source images with diffusion-weighted imaging in patients with acute stroke within 6 hours after onset. Stroke. (2002) 33:2426–32. doi: 10.1161/01.STR.0000032244.03134.37
155. Lell MM, Anders K, Uder M, Klotz E, Ditt H, Vega-Higuera F, et al. New techniques in CT angiography. Radiographics. (2006) 26(Suppl. 1):S45–62. doi: 10.1148/rg.26si065508
156. Blank M, Kalender WA. Medical volume exploration: gaining insights virtually. Eur J Radiol. (2000) 33:161–9. doi: 10.1016/S0720-048X(99)00140-0
157. Kang BT, Jang DP, Gu SH, Kim YB, Lim CY, Lee JH, et al. Three-dimensional time-of-flight magnetic resonance angiography of intracranial vessels in a canine model of ischemic stroke with permanent occlusion of the middle cerebral artery. Comp Med. (2009) 59:72–7.
158. Miyazaki M, Lee VS. Nonenhanced MR angiography. Radiology. (2008) 248:20–43. doi: 10.1148/radiol.2481071497
159. Beckmann N, Stirnimann R, Bochelen D. High-resolution magnetic resonance angiography of the mouse brain: application to murine focal cerebral ischemia models. J Magn Reson. (1999) 140:442–50. doi: 10.1006/jmre.1999.1864
160. Besselmann M, Liu M, Diedenhofen M, Franke C, Hoehn M. MR angiographic investigation of transient focal cerebral ischemia in rat. NMR Biomed. (2001) 14:289–96. doi: 10.1002/nbm.705
161. Kim SE, Parker DR. Time-of-flight angiograpy. In: Carr JC, Carroll TJ, editors. Magnetic Resonance Angiography: Principles and Applications. New York, NY: Elsevier (2012).
162. Ko SB, Kim DE, Kim SH, Roh JK. Visualization of venous systems by time-of-flight magnetic resonance angiography. J Neuroimaging. (2006) 16:353–6. doi: 10.1111/j.1552-6569.2006.00057.x
163. Schellinger PD, Richter G, Kohrmann M, Dorfler A. Noninvasive angiography (magnetic resonance and computed tomography) in the diagnosis of ischemic cerebrovascular disease. Techniques and clinical applications. Cerebrovasc Dis. (2007) 24(Suppl. 1):16–23. doi: 10.1159/000107375
164. Turski PA KF. MR angiography of the head and neck. In: Edelman RR, Zlatkin MB, Crues JV III, editor. Clinical Magnetic Resonance Imaging. Philadelphia: Saunders-Elsevier. (2006). p. 1499–537.
165. Sager M, Assheuer J, Trummler H, Moormann K. Contrast-enhanced magnetic resonance angiography (CE-MRA) of intra- and extra-cranial vessels in dogs. Vet J. (2009) 179:92–100. doi: 10.1016/j.tvjl.2007.08.032
166. Contreras S, Vazquez JM, Miguel AD, Morales M, Gil F, Lopez O, et al. Magnetic resonance angiography of the normal canine heart and associated blood vessels. Vet J. (2008) 178:130–2. doi: 10.1016/j.tvjl.2007.06.027
167. Seguin B, Tobias KM, Gavin PR, Tucker RL. Use of magnetic resonance angiography for diagnosis of portosystemic shunts in dogs. Vet Radiol Ultrasound. (1999) 40:251–8. doi: 10.1111/j.1740-8261.1999.tb00357.x
168. Cavrenne R, Mai W. Time-resolved renal contrast-enhanced MRA in normal dogs. Vet Radiol Ultrasound. (2009) 50:58–64. doi: 10.1111/j.1740-8261.2008.01490.x
169. Rodriguez D, Rylander H, Vigen KK, Adams WM. Influence of field strength on intracranial vessel conspicuity in canine magnetic resonance angiography. Vet Radiol Ultrasound. (2009) 50:477–82. doi: 10.1111/j.1740-8261.2009.01574.x
170. Sharpley J, Thode H, Sestina L, Park R, Monnet E, Kraft SL. Distal abdominal aortic thrombosis diagnosed by three-dimensional contrast-enhanced magnetic resonance angiography. Vet Radiol Ultrasound. (2009) 50:370–5. doi: 10.1111/j.1740-8261.2009.01552.x
171. Gibbs GF, Huston J 3rd, Bernstein MA, Riederer SJ, Brown RD Jr. 3.0-Tesla MR angiography of intracranial aneurysms: comparison of time-of-?ight and contrast-enhanced techniques. J Magn Reson Imaging. (2005) 21:97–102. doi: 10.1002/jmri.20247
172. Jalandhara N, Arora R, Batuman V. Nephrogenic systemic fibrosis and gadolinium-containing radiological contrast agents: an update. Clin Pharmacol Ther. (2011) 89:920–3. doi: 10.1038/clpt.2010.346
173. Buxton RB, Frank LR, Wong EC, Siewert B, Warach S, Edelman RR. A general kinetic model for quantitative perfusion imaging with arterial spin labeling. Magn Reson Med. (1998) 40:383–96. doi: 10.1002/mrm.1910400308
174. Golay X, Hendrikse J, Lim TC. Perfusion imaging using arterial spin labeling. Top Magn Reson Imaging TMRI. (2004) 15:10–27. doi: 10.1097/00002142-200402000-00003
175. Golay X, Stuber M, Pruessmann KP, Meier D, Boesiger P. Transfer insensitive labeling technique (TILT): application to multislice functional perfusion imaging. J Magn Reson Imaging JMRI. (1999) 9:454–61. doi: 10.1002/(SICI)1522-2586(199903)9:3&<454::AID-JMRI14&>3.0.CO;2-B
176. Kim SG. Quantification of relative cerebral blood flow change by flow-sensitive alternating inversion recovery (FAIR) technique: application to functional mapping. Magn Reson Med. (1995) 34:293–301. doi: 10.1002/mrm.1910340303
177. Wong EC, Buxton RB, Frank LR. A theoretical and experimental comparison of continuous and pulsed arterial spin labeling techniques for quantitative perfusion imaging. Magn Reson Med. (1998) 40:348–55. doi: 10.1002/mrm.1910400303
178. Alsop DC, Detre JA. Multisection cerebral blood flow MR imaging with continuous arterial spin labeling. Radiology. (1998) 208:410–6. doi: 10.1148/radiology.208.2.9680569
179. Wu WC, Fernandez-Seara M, Detre JA, Wehrli FW, Wang J. A theoretical and experimental investigation of the tagging efficiency of pseudocontinuous arterial spin labeling. Magn Reson Med. (2007) 58:1020–7. doi: 10.1002/mrm.21403
180. Alsop DC, Connick TJ, Mizsei G. A spiral volume coil for improved RF field homogeneity at high static magnetic field strength. Magn Reson Med. (1998) 40:49–54. doi: 10.1002/mrm.1910400107
181. Hendrikse J, van der Grond J, Lu H, van Zijl PC, Golay X. Flow territory mapping of the cerebral arteries with regional perfusion MRI. Stroke. (2004) 35:882–7. doi: 10.1161/01.STR.0000120312.26163.EC
182. Wong EC. Vessel-encoded arterial spin-labeling using pseudocontinuous tagging. Magn Reson Med. (2007) 58:1086–91. doi: 10.1002/mrm.21293
183. Bokkers RP, van Osch MJ, Klijn CJ, Kappelle LJ, Hendrikse J. Cerebrovascular reactivity within perfusion territories in patients with an internal carotid artery occlusion. J Neurol Neurosurg Psychiatr. (2011) 82:1011–6. doi: 10.1136/jnnp.2010.233338
184. Mori S, Crain BJ, Chacko VP, van Zijl PC. Three-dimensional tracking of axonal projections in the brain by magnetic resonance imaging. Ann Neurol. (1999) 45:265–9. doi: 10.1002/1531-8249(199902)45:2&<265::AID-ANA21&>3.0.CO;2-3
185. Witwer BP, Moftakhar R, Hasan KM, Deshmukh P, Haughton V, Field A, et al. Diffusion-tensor imaging of white matter tracts in patients with cerebral neoplasm. J Neurosurg. (2002) 97:568–75. doi: 10.3171/jns.2002.97.3.0568
186. Wiegell MR, Larsson HB, Wedeen VJ. Fiber crossing in human brain depicted with diffusion tensor MR imaging. Radiology. (2000) 217:897–903. doi: 10.1148/radiology.217.3.r00nv43897
187. Nimsky C, Ganslandt O, Merhof D, Sorensen AG, Fahlbusch R. Intraoperative visualization of the pyramidal tract by diffusion-tensor-imaging-based fiber tracking. NeuroImage. (2006) 30:1219–29. doi: 10.1016/j.neuroimage.2005.11.001
188. Yamada K, Kizu O, Mori S, Ito H, Nakamura H, Yuen S, et al. Brain fiber tracking with clinically feasible diffusion-tensor MR imaging: initial experience. Radiology. (2003) 227:295–301. doi: 10.1148/radiol.2271020313
189. Yamada K, Kizu O, Ito H, Nishimura T. Tractography for an arteriovenous malformation. Neurology. (2004) 62:669. doi: 10.1212/01.WNL.0000101677.99607.75
190. Kunimatsu A, Aoki S, Masutani Y, Abe O, Mori H, Ohtomo K. Three-dimensional white matter tractography by diffusion tensor imaging in ischaemic stroke involving the corticospinal tract. Neuroradiology. (2003) 45:532–5. doi: 10.1007/s00234-003-0974-4
191. Yamada K, Mori S, Nakamura H, Ito H, Kizu O, Shiga K, et al. Fiber-tracking method reveals sensorimotor pathway involvement in stroke patients. Stroke. (2003) 34:E159–62. doi: 10.1161/01.STR.0000085827.54986.89
192. Nelles M, Gieseke J, Flacke S, Lachenmayer L, Schild HH, Urbach H. Diffusion tensor pyramidal tractography in patients with anterior choroidal artery infarcts. AJNR Am J Neuroradiol. (2008) 29:488–93. doi: 10.3174/ajnr.A0855
193. Kunimatsu A, Itoh D, Nakata Y, Kunimatsu N, Aoki S, Masutani Y, et al. Utilization of diffusion tensor tractography in combination with spatial normalization to assess involvement of the corticospinal tract in capsular/pericapsular stroke: feasibility and clinical implications. J Magn Reson Imaging JMRI. (2007) 26:1399–404. doi: 10.1002/jmri.20945
194. Qazi AA, Radmanesh A, O'Donnell L, Kindlmann G, Peled S, Whalen S, et al. Resolving crossings in the corticospinal tract by two-tensor streamline tractography: Method and clinical assessment using fMRI. NeuroImage. (2009) 47(Suppl. 2):T98–106. doi: 10.1016/j.neuroimage.2008.06.034
195. Lin CP, Tseng WY, Cheng HC, Chen JH. Validation of diffusion tensor magnetic resonance axonal fiber imaging with registered manganese-enhanced optic tracts. NeuroImage. (2001) 14:1035–47. doi: 10.1006/nimg.2001.0882
196. Ciccarelli O, Toosy AT, Parker GJ, Wheeler-Kingshott CA, Barker GJ, Miller DH, et al. Diffusion tractography based group mapping of major white-matter pathways in the human brain. NeuroImage. (2003) 19:1545–55. doi: 10.1016/S1053-8119(03)00190-3
197. Okada T, Mikuni N, Miki Y, Kikuta K, Urayama S, Hanakawa T, et al. Corticospinal tract localization: integration of diffusion-tensor tractography at 3-T MR imaging with intraoperative white matter stimulation mapping–preliminary results. Radiology. (2006) 240:849–57. doi: 10.1148/radiol.2403050916
198. Parker GJ, Stephan KE, Barker GJ, Rowe JB, MacManus DG, Wheeler-Kingshott CA, et al. Initial demonstration of in vivo tracing of axonal projections in the macaque brain and comparison with the human brain using diffusion tensor imaging and fast marching tractography. NeuroImage. (2002) 15:797–809. doi: 10.1006/nimg.2001.0994
199. Kinoshita M, Yamada K, Hashimoto N, Kato A, Izumoto S, Baba T, et al. Fiber-tracking does not accurately estimate size of fiber bundle in pathological condition: initial neurosurgical experience using neuronavigation and subcortical white matter stimulation. NeuroImage. (2005) 25:424–9. doi: 10.1016/j.neuroimage.2004.07.076
200. Pierce TT, Calabrese E, White LE, Chen SD, Platt SR, Provenzale JM. Segmentation of the canine corpus callosum using diffusion-tensor imaging tractography. AJR Am J Roentgenol. (2014) 202:W19–25. doi: 10.2214/AJR.12.9791
201. Leong D, Calabrese E, White LE, Wei P, Chen S, Platt SR, et al. Correlation of diffusion tensor imaging parameters in the canine brain. Neuroradiol J. (2015) 28:12–8. doi: 10.15274/nrj-2014-10110
202. Wei PT, Leong D, Calabrese E, White L, Pierce T, Platt S, et al. Diffusion tensor imaging of neural tissue organization: correlations between radiologic and histologic parameters. Neuroradiol J. (2013) 26:501–10. doi: 10.1177/197140091302600502
203. Ritzl A, Meisel S, Wittsack HJ, Fink GR, Siebler M, Modder U, et al. Development of brain infarct volume as assessed by magnetic resonance imaging (MRI): follow-up of diffusion-weighted MRI lesions. J Magn Reson Imaging JMRI. (2004) 20:201–7. doi: 10.1002/jmri.20096
Keywords: ischemic stroke, hemorrhagic stroke, canine, MRI, CT
Citation: Arnold SA, Platt SR, Gendron KP and West FD (2020) Imaging Ischemic and Hemorrhagic Disease of the Brain in Dogs. Front. Vet. Sci. 7:279. doi: 10.3389/fvets.2020.00279
Received: 12 February 2020; Accepted: 27 April 2020;
Published: 27 May 2020.
Edited by:
Luisa De Risio, Animal Health Trust, United KingdomReviewed by:
Sarah A. Moore, The Ohio State University, United StatesDaisuke Hasegawa, Nippon Veterinary and Life Science University, Japan
Copyright © 2020 Arnold, Platt, Gendron and West. This is an open-access article distributed under the terms of the Creative Commons Attribution License (CC BY). The use, distribution or reproduction in other forums is permitted, provided the original author(s) and the copyright owner(s) are credited and that the original publication in this journal is cited, in accordance with accepted academic practice. No use, distribution or reproduction is permitted which does not comply with these terms.
*Correspondence: Simon R. Platt, c3JwbGF0dEB1Z2EuZWR1