 Dolf Kuemmerlen
 Thomas Echtermann
 Cedric Muentener
 Xaver Sidler1
- 1Division of Swine Medicine, Department for Farm Animals, Vetsuisse Faculty, University of Zurich, Zurich, Switzerland
- 2Institute of Veterinary Pharmacology and Toxicology, Vetsuisse Faculty, University of Zurich, Zurich, Switzerland
Introduction: While treatment frequency as an indicator of antimicrobial consumption is often assessed using defined doses, it can also be calculated directly as an Animal Treatment Index (ATI). In this study, the correlation of calculating antimicrobial usage on Swiss pig farms using either national Defined Daily Doses (DDDch) or an ATI (number of treatments per animal per year) and the agreement between the different methods for the identification of high usage farms were investigated.
Material and Methods: The antimicrobial consumption of 893 Swiss pig herds was calculated separately for suckling piglets, weaned piglets, fattening pigs, lactating and gestating sows using the indicators nDDDch (number of DDDch) per animal per year and ATI. Correlations between the indicators were investigated by calculating Spearman's Rho coefficients. The 5, 10, and 25% highest usage farms were determined by applying both methods and the interrater reliability was described using Cohen's Kappa coefficients and visualized by Bland-Altman plots.
Results: The Spearman's Rho coefficients showed strong correlations (r > 0.5) between nDDDch/animal/year and ATI. The lowest coefficient was shown for the correlation of both indicators in gestating sows (r = 0.657) and the highest in weaned piglets (r = 0.910). Kappa coefficients identifying high usage farms were the highest in weaned piglets (k = 0.71, 0.85, and 0.91, respectively for 5, 10, and 25% most frequent users) and the lowest in gestating sows (k = 0.54, 0.58, and 0.55 for 5, 10, and 25% most frequent users).
Conclusions: In general, the investigated indicators showed strong correlations and a broad agreement in terms of the calculated levels of antimicrobial usage and the identification of high usage farms. Nevertheless, a certain proportion of the farms were defined differently depending on the indicator used. These differences varied by age category and were larger in all age categories except weaned piglets when a higher percentage benchmark was used to define high usage farms. These aspects should be considered when designing scientific studies or monitoring systems and considering which indicator to use.
Introduction
Antimicrobial resistance poses a threat to both human and animal health (1). The use of antimicrobials is a key factor in the development of antimicrobial resistance in human and veterinary medicine (2, 3). Links between the use of antimicrobials and an increase or decrease in the frequency of antimicrobial resistance have already been described in many studies (4–10). Monitoring systems have been implemented in several countries as an important measure to investigate and control the use of antimicrobials on farms (11–15). In Switzerland, the Suissano Health Programme was developed and launched in 2015 to monitor antimicrobial usage on pig farms (16).
At the beginning of monitoring antimicrobial usage (AMU), only sales of antimicrobial products at the wholesale level were known, so analyses of antimicrobial usage could only be carried out based on these data. In order to be able to compare the calculated amounts of active substances between different populations of farm animals, the European Medicines Agency (EMA) introduced the so-called “Population Correction Unit (PCU).” For each animal species, an average value for the weight at the time of antibiotic treatment is assumed. In this way, all antibiotic quantities can be standardized with a value in kilograms of PCU and different animal species can be compared with each other. However, if the consumption of all antibiotics is given as a total quantity of active substance, no account is taken of the fact that the different classes of active substance, for example penicillins and fluoroquinolones, are used in different dosages (17). For this reason, other indicators were subsequently developed to describe the usage of antimicrobials (18, 19). In human medicine, Defined Daily Doses (DDD) were developed to analyze the usage of various medicines. In analogy, DDD have also been published for veterinary medicine (20). These units describe the daily amount of active ingredient required for the treatment of an animal with a standardized weight. Recently, the EMA published guidelines for the development and publication of indicators for the description of antimicrobial use in veterinary medicine, but has also made such indicators available in the form of Defined Daily Doses (DDDvet) and Defined Course Doses (DCDvet) (21). The DDDvet values based on data from nine European countries have been shown in some cases to differ considerably from the dosages specified in the respective national summaries of product characteristics (SPCs). Therefore, national DDDs and DCDs have been developed in several countries (15, 22, 23). For this reason, separate Defined Daily Doses (DDDch) and Defined Course Doses (DCDch) were developed for Switzerland, some of which consequently showed considerable deviations from the indicators published by the EMA (21, 23–26). Due to these discrepancies, some authors consider the so-called treatment incidence based on used daily doses, which describes the proportion of treated animals at a specific point in time as the method of choice to describe the usage of antimicrobials (19, 27–30). Moreover, an Animal Treatment Index (ATI) was introduced, which described the proportion of treated animals on a farm (31).
The indicators described above are not only used in various monitoring systems to describe the usage of antimicrobials, but in most cases can also be used to identify high usage farms by setting a benchmark, and to determine interventions to lower AMU (11, 32). In this way a successful reduction of antimicrobial usage in pig farms could be demonstrated (32, 33). As the calculation methods sometimes varied considerably, differences in the identification of high usage farms were also possible: a recent study by Kasabova et al. (33) presented such differences for the evaluation of antimicrobial usage in pig and poultry farms in Germany based on Defined Daily Doses or the Used Daily Doses (17, 34, 35).
The joint Suissano/Safety+ Health Programme was launched in 2018 in cooperation of Swiss pig producers, veterinary authorities, pig trading companies and retailers. The aim of the programme was to improve transparency concerning AMU. For participating farms, it is obligatory to record each antimicrobial treatment of pigs by an electronic treatment journal, which is run on personal computers or smart phone applications. All treatments are allocated to five categories (suckling piglets, weaned piglets, fattening pigs, lactating and gestating sows). Each participating farm is quarterly provided with a feedback concerning AMU including a comparison with the AMU levels of all other participating farms. Although being a voluntary programme, the number of participating farms increases every year and by the end of 2020 it is expected that around 2200 farms, or over 50% of all Swiss pig herds will be part of the programme (Service and competence center of the Swiss pig industry, SUISAG; personal communication).
In the present study, antimicrobial usage in five different age categories (suckling piglets, weaned piglets, fattening pigs, gestating and lactating sows) was calculated for 893 pig herds participating in the Suissano/Safety+ Health Programme, either as an ATI or number of DDDch (nDDDch) per animal per year. Correlations between the two indicators and differences in the definition of high usage farms were investigated and visualized.
Materials and Methods
Data Collection
All farms involved in the study participated in the Suissano/Safety+ Health Programme in Switzerland. Farmers recorded their antimicrobial usage using electronic treatment journals which were linked to a central database from which all data used in this study were retrieved. For each individual treatment, in addition to the antimicrobial product used and the amount administered, the number of animals treated and the duration of the treatment were recorded. Each treatment was assigned to an age category (suckling piglets, weaned piglets, fattening pigs, gestating sows, and lactating sows). In addition, the numbers of suckling piglets, weaned piglets and fattening pigs produced from all the herds participating in this study once a year had to be reported by the farmer and were registered in the electronic treatment journal, as well as the number of gestating and lactating sows housed on the study farms.
A total of 893 farms provided data for our study. Three hundred and ninety-nine were fattening farms providing data concerning fattening pigs and 481 were breeding farms (housing sows, suckling piglets, and weaned piglets), of which 190 were connected to a sow pool system (housing lactating sows, suckling piglets and weaned piglets or only gestating sows). Thirteen farms kept both weaned piglets and fattening pigs. Two hundred and seventy-seven of the 481 breeding farms also kept at least 30 fattening pigs (farrow-finish farms) and thus provided data concerning all age categories (Table 1).
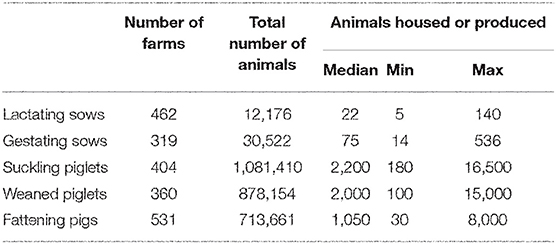
Table 1. Number of farms out of the 893 study farms providing complete datasets of AMU for each age category; minimum (min), median, maximum (max), and the total number of animals of the respective age category on these farms.
For each age category, data were only included in the dataset if they had been recorded continuously for the study period. The second inclusion criteria meant that data must be entered in the electronic treatment journal no later than 7 days after application, according to the requirements of the Suissano/Safety+ Health Programme.
The total amount of each active substance, administered during the study period (1 year) was added up and divided by the corresponding DDDch value defined by Echtermann et al. (24) multiplied by the standard weight of the corresponding animal group (suckling piglets: 4 kg; weaned piglets: 12 kg; fattening pigs: 50 kg; sows: 220 kg) (36). This calculation was performed separately for each active substance used and then the calculated nDDDch of all active substances used in each age category were summed up. The results for nDDDch were divided by the number of animals kept (sows) or produced (suckling piglets, weaned piglets, fattening pigs) during the study period (1. October 2018 to 30. September 2019). The nDDDch/animal/year was calculated according to the following formula.
The ATI was calculated for each active substance and age category by adding up all treatments performed (number of treatments, NT) and dividing the sum by the number of animals kept or produced during the study period. One treatment was equivalent to one application per animal per day. If, for example, 20 animals were treated on 3 days during a therapy, this corresponded to 60 treatments. For treatments with products containing several antimicrobial agents, each agent was individually evaluated as a treatment.
For treatments with long-acting products, multiplying factors corresponding to the duration of the pharmaceutical activity were used to adjust the treatment duration. However, since these factors only served to compare the usage of antimicrobial ingredients with different pharmaceutical activity, it had no influence on the comparison of the two calculation methods and was disregarded in this study. Recorded treatments that could be clearly identified as incorrect, due to markedly differing numbers of animals, treatment duration or quantities of Veterinary Medical Products (VMPs), were removed from the analysis.
Statistical Analyses
All datasets were prepared with Microsoft Excel® Version 16.30. Statistical analysis was carried out using IBM SPSS® Version 25. All datasets were tested for normal distribution by Shapiro-Wilk test. For not normally distributed datasets, correlations between the indicators were investigated by calculating Spearman's Rho coefficients. Further, the relationship between both indicators was visualized by scatterplots and by linear regression lines using a generalized linear model for the age categories with the lowest and the highest Spearman's Rho coefficients. The interrater reliability between the tested calculation methods for identifying the 5, 10, and 25% highest usage farms was described using Cohen's Kappa coefficients and visualized by Bland-Altman plots of means and differences between ATI and nDDDch/animal/year. Values of ±1.96 multiplied with the standard deviation of the differences mentioned were defined as outliers. The percentage of farms for which agreement could be found when determining frequent users by either nDDDch/animal/year or ATI was calculated for each age category.
Results
Tables 2–6 give an overview of the antimicrobial classes used in the study farms in the different age categories. A total AMU of 649,290 treatments, respectively, 557,830 DDDch was calculated for the study period. This represents a deviation of 14%, when calculating NT or nDDDch, respectively. For the different classes of active substances, strongly deviating agreement of the indicators could be observed: While the results for the usage of sulfonamides in lactating sows were almost identical when calculated with both indicators, the NT with tetracyclines in weaning piglets was almost three times higher than the nDDDch and on the other hand, the nDDDch for treatments with aminoglycosides was 2.5 times higher than the NT. Table 7 shows the correlation between the calculations of the AMU as ATI or nDDDch/animal/year and the agreement of the definition of 5, 10, and 25% high usage farms, depending on the method chosen. The highest correlation coefficients between both indicators could be found for lactating sows and weaned piglets and the lowest for gestating sows and fattening pigs. Both agreement (a) and the interrater reliability (Kappa coefficient) of the investigated indicators were higher when identifying the 5 and 10% high usage farms, compared to the identified 25% high usage farms (Table 7). Exception were the weaned piglets, where Kappa coefficient became higher when larger proportions of farms were identified as high users. Generally, weaned piglets showed the best agreement (≥96%) irrespective of the percentage of high usage farms identified and the best correlation between the indicators.
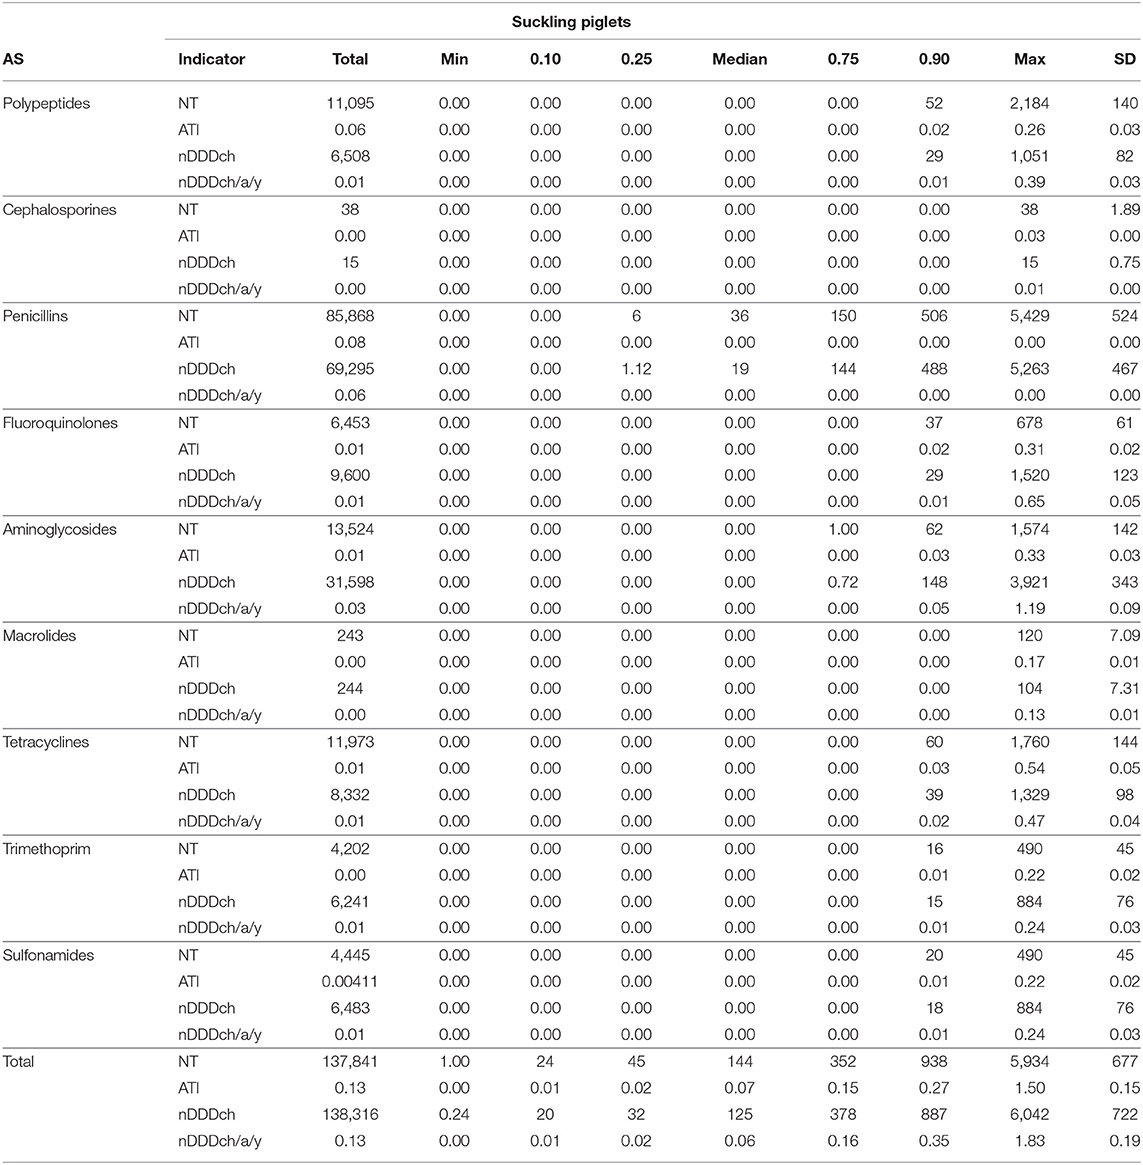
Table 2. Total, minimum (min), median, maximum (max), 10% (0.1), 25% (0.25), 75% (0.75), 90% (0.9) percentiles and standard deviation (SD) of AMU in suckling piglets of the study farms measured using the indicators NT, ATI, nDDDch, and nDDDch/animal/year (nDDDch/a/y) displayed by active substance (AS).
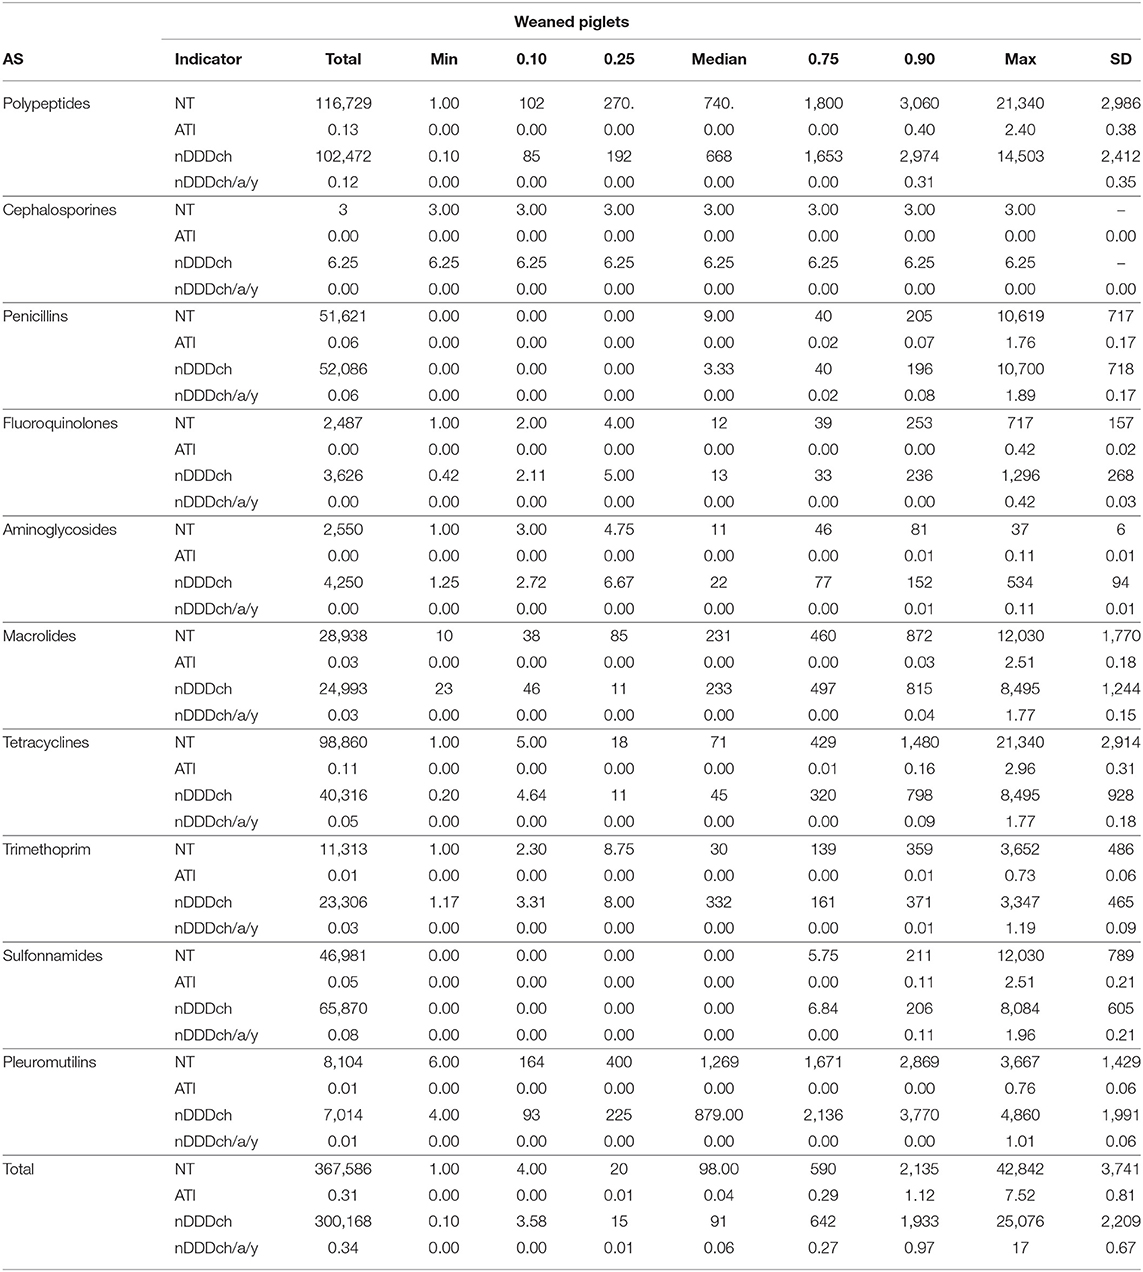
Table 3. Total, minimum (min), median, maximum (max), 10% (0.1), 25% (0.25), 75% (0.75), 90% (0.9) percentiles and standard deviation (SD) of AMU in weaned piglets of the study farms measured using the indicators NT, ATI, nDDDch, and nDDDch/animal/year (nDDDch/a/y) displayed by active substance (AS).
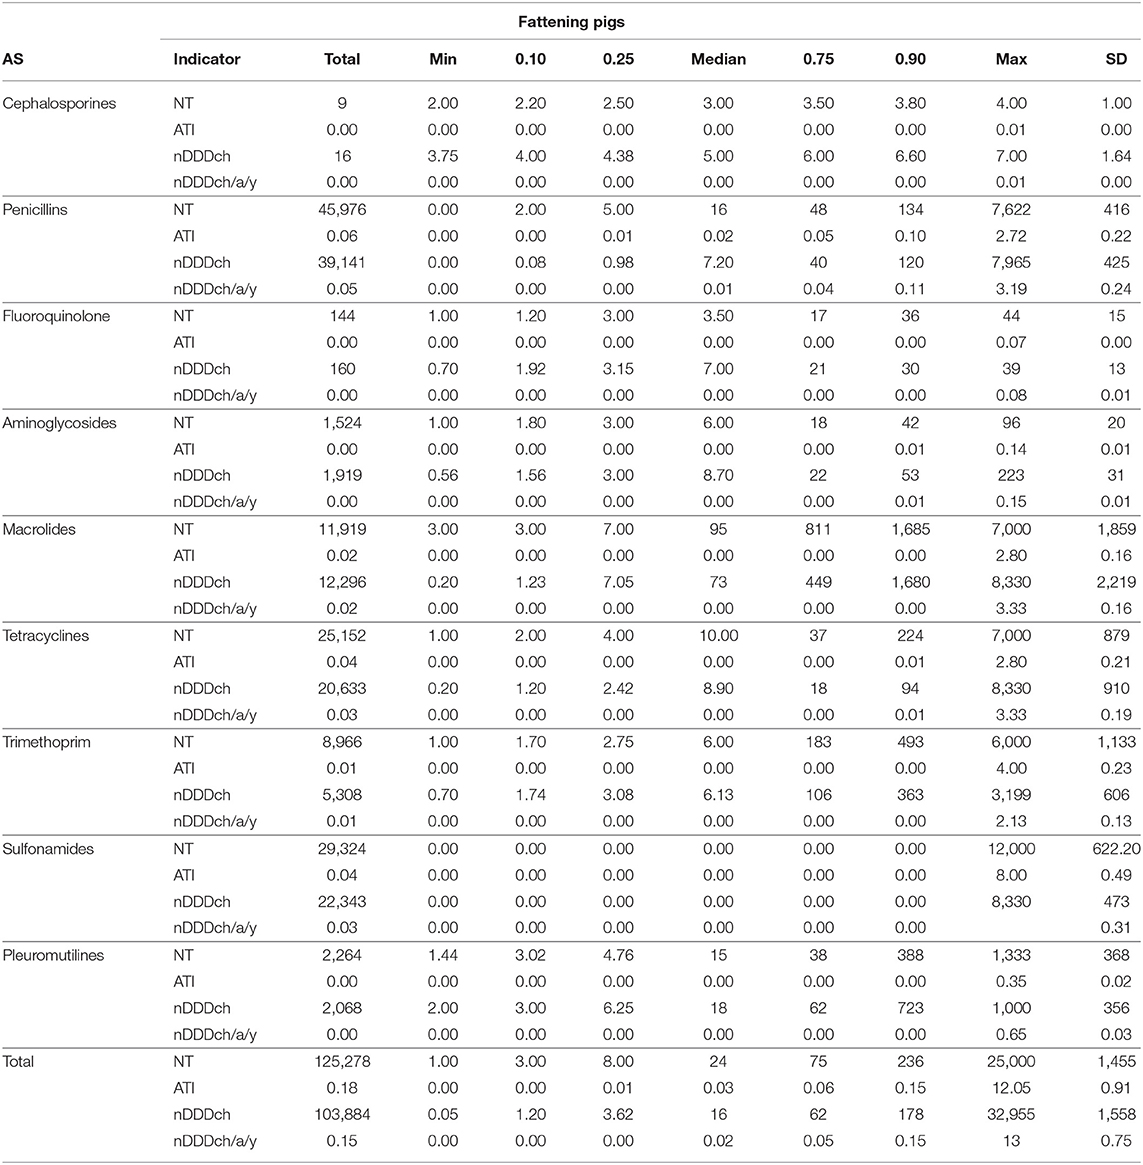
Table 4. Total, minimum (min), median, maximum (max), 10% (0.1), 25% (0.25), 75% (0.75), 90% (0.9) percentiles and standard deviation (SD) of AMU in fattening pigs of the study farms measured using the indicators NT, ATI, nDDDch and nDDDch/animal/year (nDDDch/a/y) displayed by active substance (AS).
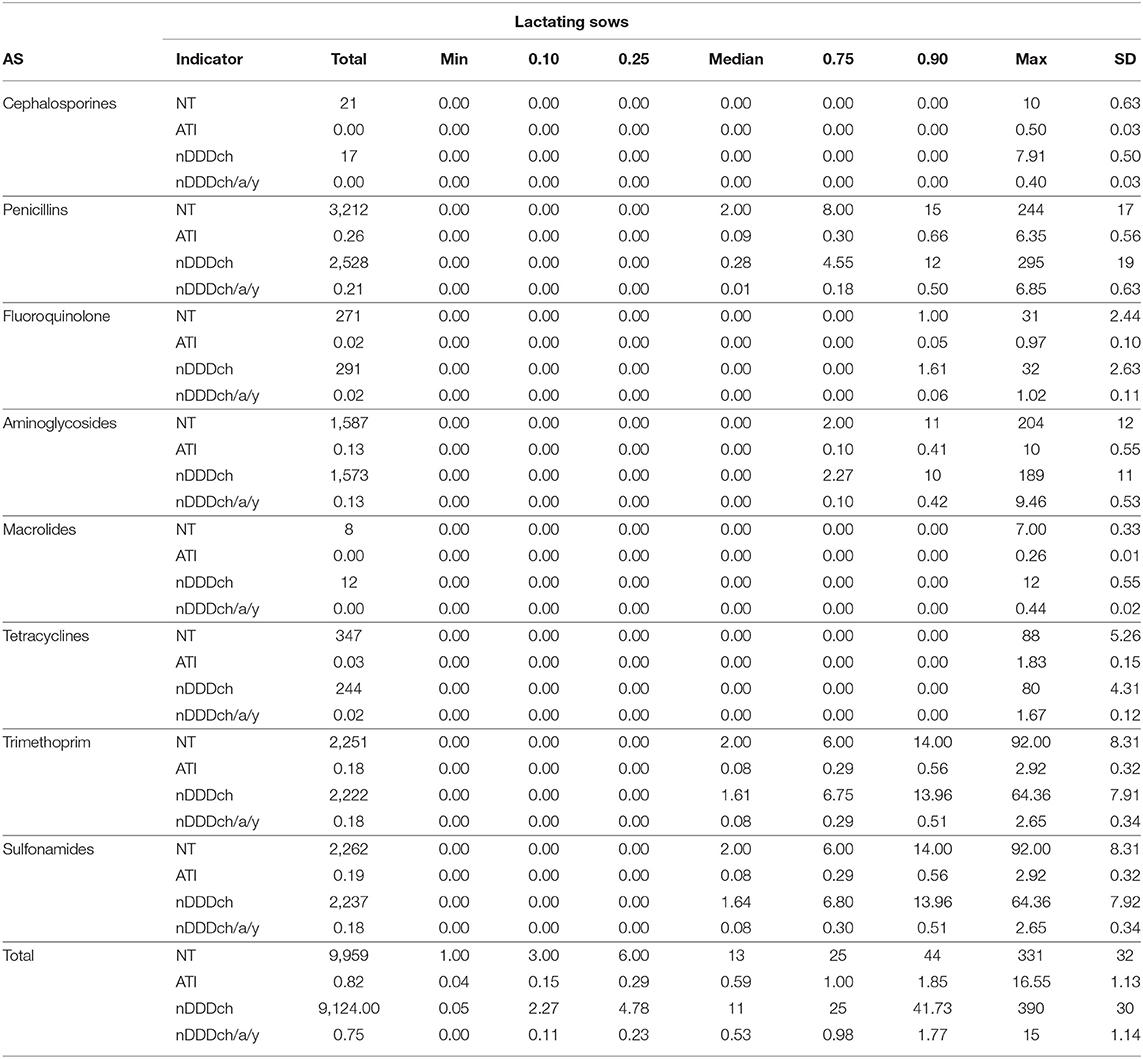
Table 5. Total, minimum (min), median, maximum (max), 10% (0.1), 25% (0.25), 75% (0.75), 90% (0.9) percentiles and standard deviation (SD) of AMU in lactating sows of the study farms measured using the indicators NT, ATI, nDDDch and nDDDch/animal/year (nDDDch/a/y) displayed by active substance (AS).
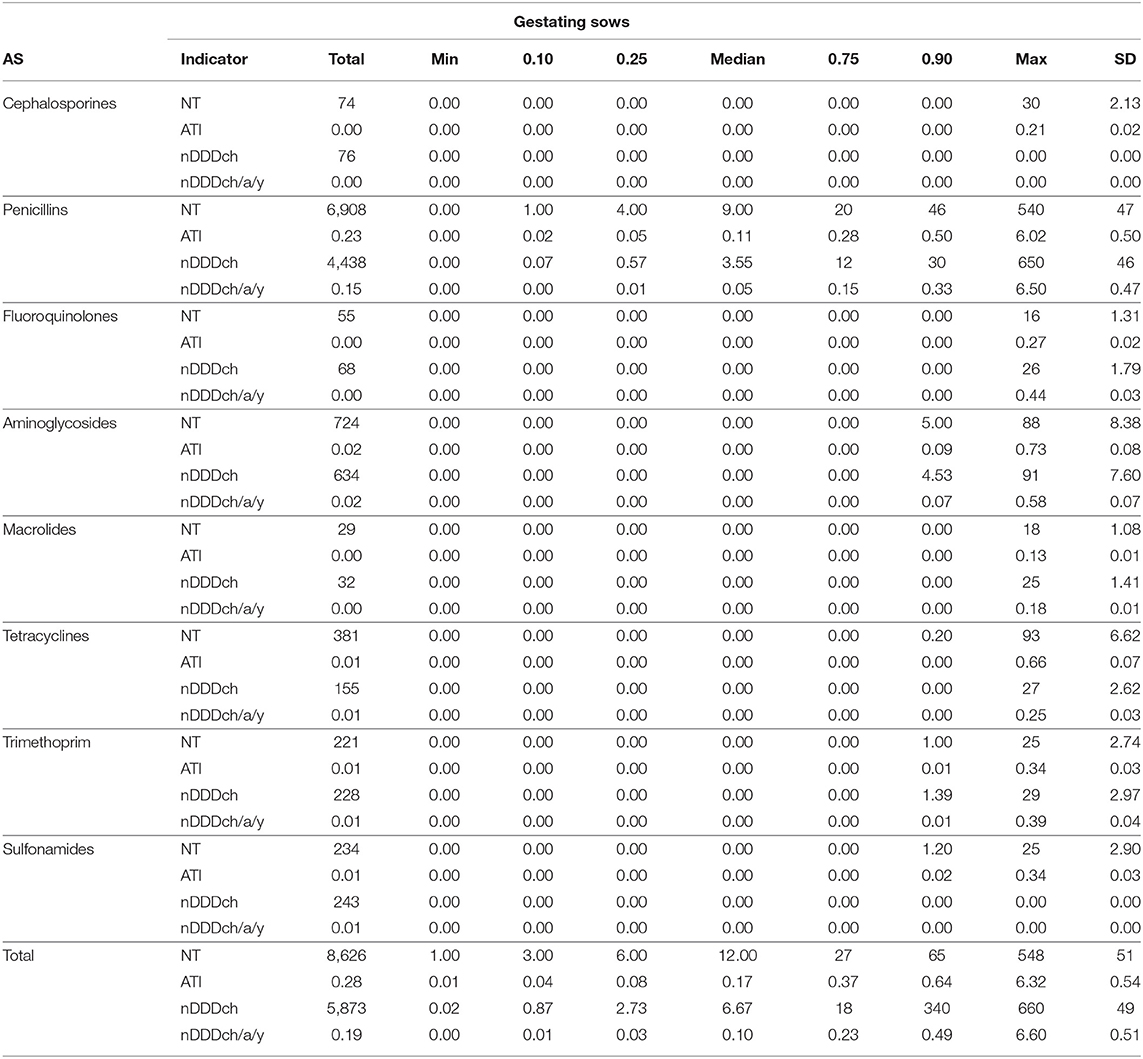
Table 6. Total, minimum (min), median, maximum (max), 10% (0.1), 25% (0.25), 75% (0.75), 90% (0.9) percentiles and standard deviation (SD) of AMU in gestating sows of the study farms measured using the indicators NT, ATI, nDDDch and nDDDch/animal/year (nDDDch/a/y) displayed by active substance (AS).
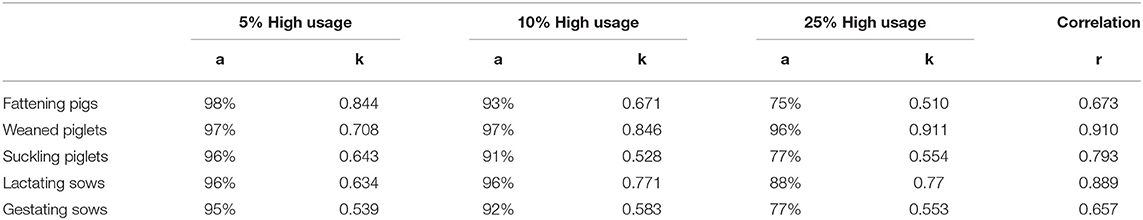
Table 7. Agreement (a) in percent when defining 5, 10, and 25% high usage farms by calculating AMU with either ATI or nDDDch/animal/year for five age categories (fattening pigs, weaned piglets, suckling piglets, lactating and gestating sows), interrater reliability between both indicators expressed as Kappa coefficient (k) and correlation between both indicators displayed using Spearman's Rho (r) coefficients.
The correlation between both methods is further demonstrated with the data from weaned piglets as the age category with the best correlation between both indicators and with gestating sows, where the lowest correlation was found (Figures 1, 2). The interrater reliability is visualized by Bland-Altman plots for these age categories (Figures 3, 4). Bland Altman plots of weaned piglets showed five out of 360 (2%) to be outliers, while in gestating sows this was shown to be 13 out of 319 (4%).
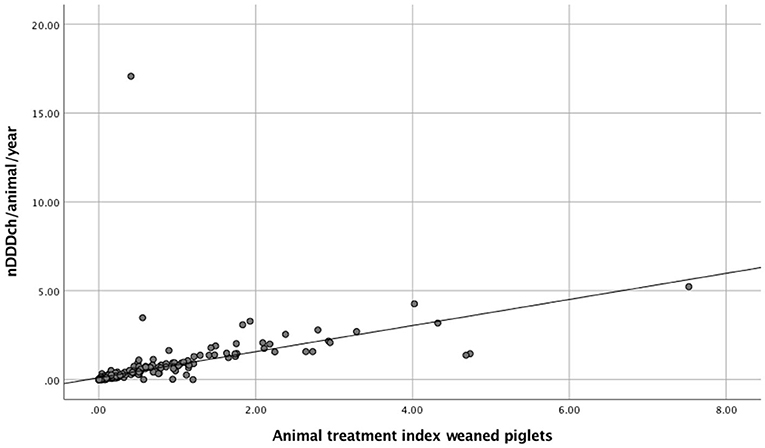
Figure 1. Scatterplots and linear regression of AMU calculated either as Animal Treatment Index (ATI) or the number of DDDch/animal/year (nDDDch/animal/year) for weaned piglets from 360 study farms.
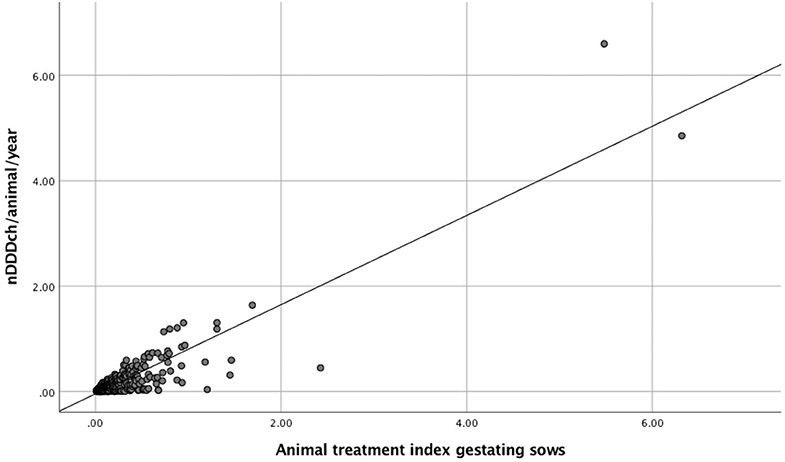
Figure 2. Scatterplots and linear regression of AMU calculated either as Animal Treatment Index (ATI) or the number of DDDch/animal/year (nDDDch/animal/year) for gestating sows from 319 study farms.
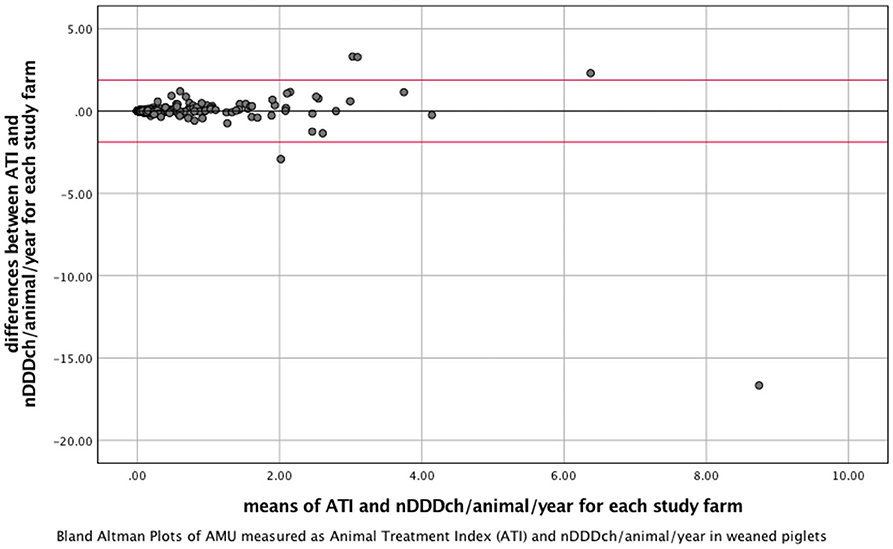
Figure 3. Bland-Altman Plots visualizing interrater reliability of the indicators Animal Treatment Index (ATI) and number of DDDch (nDDDch)/animal/year for 360 farms housing weaned piglets. X-Axis: means of ATI and nDDDch/animal/year; Y-axis: differences between ATI and nDDDch/animal/year. Red lines: ±1.96 * standard deviation of the datasets calculated from the differences between ATI and nDDDch/animal/year.
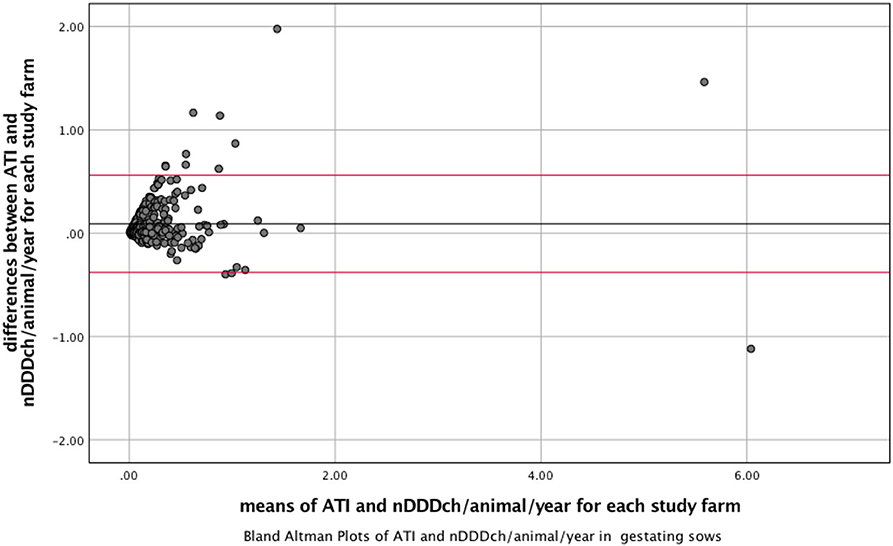
Figure 4. Bland-Altman Plots visualizing interrater reliability of the indicator Animal Treatment Index (ATI) and number of DDDch (nDDDch)/animal/year for 319 farms housing gestating sows. X-Axis: mean of ATI and nDDDch/animal/year; Y-axis: differences between ATI and nDDDch/animal/year. Red lines: ±1.96 * standard deviation of the datasets calculated from the differences between ATI and nDDDch/animal/year.
Discussion
In the present study we were able to assess the correlation of the indicators nDDDch/animal/year and ATI when measuring AMU on pig farms and the agreement in the definition of high usage farms. The number of treatment days NT and nDDDch calculated for the study farms showed marked differences for some active substances, while for others the results were similar. The degree of agreement between the two indicators was therefore most likely dependent on which antimicrobial substances were used in an age category.
The Spearman's Rho coefficients for correlations between the indicators ATI and nDDDch/animal/year observed were statistically determined as moderate (>0.6) for fattening pigs and gestating sows and as strong or very strong (>0.7) for suckling piglets, weaned piglets and lactating sows (37). The Kappa coefficient demonstrated a substantial agreement (>0.6) when defining 5% high usage farms for all age categories, except gestating sows. If defining 10 and 25% high usage farms, a moderate (>0.4) to substantial agreement was shown for all age categories except weaned piglets, where very good agreement (>0.8) could be shown (38).
The agreement of both indicators concerning the identification of high usage farms generally was the better, the smaller the percentage of farms was determined as high usage farms. If only 5% of the farms were determined as high users, even in age categories showing lower Kappa coefficient and lower correlations between both indicators, such as gestating sows or fattening pigs, more than 95% of the high usage farms were identified in agreement of both indicators. When 25% of the farms were determined as high users, the agreement between both indicators decreased to 75 and 77% in fattening pigs and gestating sows, respectively, due to the lower correlation and Kappa coefficient, while in weaned piglets with the best correlation and highest Kappa coefficient, the agreement still was 96%.
A final statement on whether the agreement between two indicators is sufficient or not cannot be made. Since only the degree of agreement can be shown, an extensive discussion is necessary to precisely evaluate which indicator is more suitable when planning a scientific study or when establishing and implementing a monitoring system for which a benchmark should be set (39).
Since the DDDch have been defined on the basis of SPCs in Switzerland, in order to achieve a good agreement between the indicators it is necessary that antimicrobial treatments are carried out as closely as possible to the recommendations found in the SPCs. Any change in dosage leads to a change in the number of DDD, but not in the number of treatments. According to our analyses, for some substances, significantly different levels of DDDch and ATI were calculated per age category. This result is probably due to the effect described above and is also responsible for both the outlier shown in our Bland-Altman Plots and decreased agreement when identifying high usage farms. On the other hand, the simultaneous calculation of both indicators may contribute to a mutual plausibility check of the results by, for example, identifying incorrect entries into the electronic treatment journal.
The divergent agreement between the indicators when comparing the different age categories could also be due to different indications, treatment patterns and antimicrobials used. For example, gestating sows often are suffering from lameness compared to weaned piglets which are more frequently affected by diarrhea. Further research is needed on this issue. Also, if actual weights at treatment deviate from the standard weights used for the calculation of DDDch, it may contribute to differences between DDDch and ATI. While, for example, a rather uniform weight during treatment can be expected for sows particularly in the case of suckling pigs, stronger deviations can be assumed between a newly born piglet with an average weight of 1.2 kg compared to a 4-week-old piglet with a multiple of this weight.
Differences between the indicators for AMU have been shown before (25, 34, 40). An increasing number of monitoring systems are being established worldwide, however, the harmonization of the measurement of usage has so far been less advanced (17). While in some countries the evaluation of antimicrobial usage is based on DDDs, an ATI or comparable methods are also used in other countries, including Switzerland (14, 15).
Treatment frequency calculations based on DDD are only an estimate of AMU on farms because they are calculated using standardized weights and doses. This indicator may be more appropriate if it is difficult to obtain precise information concerning the AMU, especially the number of treatments, the dosage used, and the weight of the treated animals. However, if this information can be collected reliably and accurately, the calculation of an ATI or treatment frequency based on used daily doses is feasible (27). On the other hand, it must also be taken into account that development of bacterial resistance also occurs outside the animal by excreted metabolites after antimicrobial therapy. In this situation, the quantities of antimicrobials used on a farm should also be taken into account (41, 42). These can be derived more reliably from DDDs, where standard weights and dosages are used and thus standardized antimicrobial quantities. To calculate the quantities of active substances used from an ATI, further information on the weight of the treated animals and the dosage applied is necessary.
In the present study it could be shown that despite the generally good agreement between the two indicators, a considerable proportion of the farms were nevertheless rated differently as high usage farms depending on the indicator used. In Switzerland, different monitoring systems are concurrently measuring AMU on farms. The use of different indicators may cause a considerable lack of compliance by farm managers when farm rating varies depending on the monitoring system used and may adversely affect the acceptance of such programmes.
Although many discussions are taking place regarding the comparability of different indicators, other factors should be taken into account which also influence the calculation of AMU: different data sources and deviating values provided, e.g., concerning the kept animals, may also result in different outcomes. In Switzerland, the numbers of animals reported to the veterinary authorities are in some cases significantly different from those used by the on-farm reproduction software, which is used as a data source for the number of animals on the farms (43).
Our earlier investigations have shown that within the Suissano/Safety+ Health Programme significant changes in the usage of antimicrobials could be achieved by only measuring and communicating levels of antimicrobial usage, without defining a benchmark (44). Thus, if a benchmark is not necessarily needed and the good correlation of both indicators found in the present study is taken into consideration, it may be of secondary importance which indicator to choose for the aim of reducing AMU.
It is also important to point out that irrespective of the method of calculation, a long-term reduction in the usage of antimicrobials while respecting animal health standards can only be feasibly achieved through close collaboration with veterinary professionals. Improving biosecurity as well as animal health e.g., by introducing vaccination protocols, has a positive impact on AMU (45). Ideally, any AMU monitoring programme will intensify veterinary advice and ensure a reduced AMU without impairing animal health rather than rating farms based only on their antimicrobial usage.
Conclusions
In the present study, strong correlations and a broad agreement in identifying high usage farms could be demonstrated for the indicators nDDDch/animal/year and ATI. Nevertheless, depending on the indicator used a considerable proportion of the study farms were assessed differently. These differences varied by age category and were larger with a higher proportion of farms determined as high usage farms. These aspects have to be considered when designing scientific studies or monitoring systems and when deciding on which indicator to use.
Data Availability Statement
The raw data supporting the conclusions of this article will be made available by the authors, without undue reservation.
Author Contributions
DK drafted the manuscript. DK, CM, and XS designed and directed the study design. TE prepared data processing. All authors contributed to the article and approved the submitted version.
Conflict of Interest
The authors declare that the research was conducted in the absence of any commercial or financial relationships that could be construed as a potential conflict of interest.
Acknowledgments
We would like to thank SUISAG and Qualiporc and all participating farmers for providing the data for this study.
Abbreviations
AMU, antimicrobial usage; AS, active substance; ATI, Animal Treatment Index; DDDch, Defined Daily Dose Switzerland; DCDch, Defined Course Dose Switzerland; DDDvet, Defined Daily Dose (EMA); DCDvet, Defined Course Dose (EMA); EMA, European Medicines Agency; Min, minimum; Max, maximum; NT, number of treatment days; nDDDch, number of DDDch; SD, standard deviation; SW, standard weight; VMP, Veterinary Medical Product.
References
1. Prestinaci F, Pezzotti P, Pantosti A. Antimicrobial resistance: a global multifaceted phenomenon. Pathog Glob Health. (2015) 109:309–18. doi: 10.1179/2047773215Y.0000000030
2. Alali WQ, Scott HM, Harvey RB, Norby B, Lawhorn DB, Pillai SD. Longitudinal study of antimicrobial resistance among Escherichia coli isolates from integrated multisite cohorts of humans and swine. Appl Environ Microbiol. (2008) 74:3672–81. doi: 10.1128/AEM.02624-07
3. Alali WQ, Scott HM, Christian KL, Fajt VR, Harvey RB, Lawhorn DB. Relationship between level of antibiotic use and resistance among Escherichia coli isolates from integrated multi-site cohorts of humans and swine. Prev Vet Med. (2009) 90:160–7. doi: 10.1016/j.prevetmed.2009.05.018
4. Aarestrup FM. Association between the consumption of antimicrobial agents in animal husbandry and the occurrence of resistant bacteria among food animals. Int J Antimicrob Agents. (1999) 12:279–85. doi: 10.1016/S0924-8579(99)90059-6
5. Akwar HT, Poppe C, Wilson J, Reid-Smith RJ, Dyck M, Waddington J, et al. Associations of antimicrobial uses with antimicrobial resistance of fecal Escherichia coli from pigs on 47 farrow-to-finish farms in Ontario and British Columbia. Can J Vet Res. (2008) 72:202–10.
6. Statens Serum Institut National Veterinary Institute TUoDNFI Technical University of Denmark. DANMAP 2017 - Use of Antimicrobial Agents and Occurrence of Antimicrobial Resistance in Bacteria From Food Animals, Food and Humans in Denmark. (2018). Available online at: https://www.danmap.org/-/media/arkiv/projekt-sites/danmap/danmap-reports/danmap-2017/danmap2017.pdf?la=en (accessed May 01, 2020).
7. MARAN 2018. Monitoring of Antimicrobial Resistance and Antibiotic Usage in Animals in the Netherlands in 2017. Available online at: https://www.wur.nl/en/show/Maran-rapport-2018.htm (accessd May 01, 2020).
8. Callens B, Cargnel M, Sarrazin S, Dewulf J, Hoet B, Vermeersch K, et al. Associations between a decreased veterinary antimicrobial use and resistance in commensal Escherichia coli from Belgian livestock species (2011-2015). Prev Vet Med. (2018) 157:50–8. doi: 10.1016/j.prevetmed.2017.10.013
9. Andersen VD, DE Knegt LV, Munk P, Jensen MS, Agersø Y, Aarestrup FM, et al. The association between measurements of antimicrobial use and resistance in the faeces microbiota of finisher batches. Epidemiol Infect. (2017) 145:2827–37. doi: 10.1017/S0950268817001285
10. Andersen VD, Munk P, de Knegt LV, Jensen MS, Aarestrup FM, Vigre H. Validation of the register-based lifetime antimicrobial usage measurement for finisher batches based on comparison with recorded antimicrobial usage at farm level. Epidemiol Infect. (2018) 146:1–9. doi: 10.1017/S0950268818000134
11. Dupont N, Diness LH, Fertner M, Kristensen CS, Stege H. Antimicrobial reduction measures applied in Danish pig herds following the introduction of the “Yellow Card” antimicrobial scheme. Prev Vet Med. (2017) 138:9–16. doi: 10.1016/j.prevetmed.2016.12.019
12. Stege H BF, Jacobsen E, Thougaard A. VETSTAT-the Danish system for surveillance of the veterinary use of drugs for production animals. Prev Vet Med. (2003) 57:105–15. doi: 10.1016/S0167-5877(02)00233-7
13. Merle R, Hajek P, Käsbohrer A, Hegger-Gravenhorst C, Mollenhauer Y, Robanus M, et al. Monitoring of antibiotic consumption in livestock: a German feasibility study. Prev Vet Med. (2012) 104:34–43. doi: 10.1016/j.prevetmed.2011.10.013
14. Hemme M, Ruddat I, Hartmann M, Werner N, van Rennings L, Käsbohrer A, et al. Antibiotic use on German pig farms - A longitudinal analysis for 2011, 2013 and 2014. PLoS ONE. (2018) 13:e0199592. doi: 10.1371/journal.pone.0199592
15. AACTING-network. Description of Existing Monitoring Systems for Collection, Analysis, Benchmarking and Reporting of Farm-Level Veterinary Antimicrobial Usage-Version. Available online at: https://aacting.org/monitoring-systems/ (accessed May 1, 2020).
16. Schaller C, Caspari K, Kümmerlen D. SUIS Sano – Messung, Bewertung und Steuerung des Antibiotikaverbrauchs in schweizerischen Schweinebetrieben. Klauentierpraxis. (2015) 23:171–5.
17. Büttner S, Müntener CR, Torriani K, Overesch G. ARCH-Vet Bericht über den Vertrieb von Antibiotika in der Veterinärmedizin und das Antibiotikaresistenzmonitoring bei Nutztieren in der Schweiz GESAMTBERICHT 2013. Available online at: https://www.zora.uzh.ch/id/eprint/106067/1/ARCH-Vet_2013_final.pdf (accessed May 1, 2020).
18. ESVAC. Sales of Veterinary Antimicrobial Agents in 30 European Countries in 2017. Available online at: https://www.ema.europa.eu/documents/report/sales-veterinary-antimicrobial-agents-31-european-countries-2017_en.pdf (accessed May 1, 2020).
19. Jensen VF, Jacobsen E, Bager F. Veterinary antimicrobial-usage statistics based on standardized measures of dosage. Prev Vet Med. (2004) 64:201–15. doi: 10.1016/j.prevetmed.2004.04.001
20. EMA. Defined Daily Doses for Animals (DDDvet) and Defined Course Doses for Animals (DCDvet). Available online at: https://www.ema.europa.eu/en/documents/other/defined-daily-doses-animals-dddvet-defined-course-doses-animals-dcdvet-european-surveillance_en.pdf (accessed May 1, 2020).
21. Tarakdjian J, Capello K, Pasqualin D, Santini A, Cunial G, Scollo A, et al. Antimicrobial use on Italian pig farms and its relationship with husbandry practices. Animals. (2020) 10:417. doi: 10.3390/ani10030417
22. Bosman AL, Loest D, Carson CA, Agunos A, Collineau L, Léger DF. Developing Canadian defined daily doses for animals: a metric to quantify antimicrobial use. Front Vet Sci. (2019) 6:220. doi: 10.3389/fvets.2019.00220
23. Echtermann T, Müntener CR, Torgerson PR, Sidler X, Kümmerlen D. [Defining daily doses and total doses for the measurement of antibiotic usage in Swiss pig production]. Schweiz Arch Tierheilkd. (2018) 160:597–605. doi: 10.17236/sat00179
24. Echtermann T, Muentener C, Sidler X, Kümmerlen D. Antimicrobial drug consumption on swiss pig farms: a comparison of Swiss and European defined daily and course doses in the field. Front Vet Sci. (2019) 6:240. doi: 10.3389/fvets.2019.00240
25. Postma M, Sjölund M, Collineau L, Lösken S, Stärk KD, Dewulf J, et al. Assigning defined daily doses animal: a European multi-country experience for antimicrobial products authorized for usage in pigs. J Antimicrob Chemother. (2015) 70:294–302. doi: 10.1093/jac/dku347
26. Collineau L, Belloc C, Stärk KD, Hémonic A, Postma M, Dewulf J, et al. Guidance on the selection of appropriate indicators for quantification of antimicrobial usage in humans and animals. Zoonoses Public Health. (2017) 64:165–84. doi: 10.1111/zph.12298
27. van Rennings L, Merle R, von Münchhausen C, Stahl J, Honscha W, Käsbohrer A, et al. Variables describing the use of antibiotics in food-producing animals. Berl Munch Tierarztl Wochenschr. (2013) 126:297–309.
28. Timmerman T, Dewulf J, Catry B, Feyen B, Opsomer G, de Kruif A, et al. Quantification and evaluation of antimicrobial drug use in group treatments for fattening pigs in Belgium. Prev Vet Med. (2006) 74:251–63. doi: 10.1016/j.prevetmed.2005.10.003
29. Chauvin C, Madec F, Guillemot D, Sanders P. The crucial question of standardisation when measuring drug consumption. Vet Res. (2001) 32:533–43. doi: 10.1051/vetres:2001145
30. Qualität und Sicherheit. Eingesetzte Antbiotikamengen Erneut Gesunken. (2018). Available online at: https://www.q-s.de/pressemeldungen/eingesetzte-antibiotikamengen-erneut-gesunken.html (accessed August 26, 2020).
31. Blaha T, Dickhaus P., Meemken D. The “Animal Treatment Index” benchmarking pig herd health. In: Proceedings 19TH Congress International Pig Veterinary Society. Copenhagen, Denmark (2006). p. 189.
32. Jensen VF, de Knegt LV, Andersen VD, Wingstrand A. Temporal relationship between decrease in antimicrobial prescription for Danish pigs and the “Yellow Card” legal intervention directed at reduction of antimicrobial use. Prev Vet Med. (2014) 117:554–64. doi: 10.1016/j.prevetmed.2014.08.006
33. Kasabova S, Hartmann M, Werner N, Käsbohrer A, Kreienbrock L. Used daily dose vs. defined daily dose-contrasting two different methods to measure antibiotic consumption at the farm level. Front Vet Sci. (2019) 6:116. doi: 10.3389/fvets.2019.00116
34. Hemme M, Kaesbohrer A, von Münchhausen C, Hartmann M, Merle R, Kreienbrock L. Unterschiede in der Berechnung des betriebsbezogenen Antibiotika-Einsatzes in Monitoringsystemen in Deutschland–eine Übersicht. Berl und Münch Tierärztl. Wochenschr. (2017) 3:93–101.
35. Werner N, McEwen S, Kreienbrock L. Monitoring antimicrobial drug usage in animals: methods and applications. Microbiol Spectr. (2018) 6:569–94. doi: 10.1128/9781555819804.ch27
36. EMA. Principles on Assignment of Defined Daily Dose for Animals (DDDvet) and Defined Course Dose for Animals (DCDvet). Available online at: https://www.ema.europa.eu/en/documents/scientific-guideline/principles-assignment-defined-daily-dose-animals-dddvet-defined-course-dose-animals-dcdvet_en.pdf (accessed May 1, 2020).
37. Akoglu H. User's guide to correlation coefficients. Turk J Emerg Med. (2018) 18:91–3. doi: 10.1016/j.tjem.2018.08.001
38. Landis JR, Koch GG. The measurement of observer agreement for categorical data. Biometrics. (1977) 33:159–74. doi: 10.2307/2529310
39. Giavarina D. Understanding Bland Altman analysis. Biochem Med. (2015) 25:141–51. doi: 10.11613/BM.2015.015
40. Taverne FJ, Jacobs JH, Heederik D, Mouton JW, Wagenaar JA, van Geijlswijk IM, et al. Influence of applying different units of measurement on reporting antimicrobial consumption data for pig farms. BMC Vet Res. (2015) 11:250. doi: 10.1186/s12917-015-0566-7
41. Schulz J, Kemper N, Hartung J, Janusch F, Mohring SAI, Hamscher G. Analysis of fluoroquinolones in dusts from intensive livestock farming and the co-occurrence of fluoroquinolone-resistant Escherichia coli. Sci Rep. (2019) 9:5117. doi: 10.1038/s41598-019-41528-z
42. Xie WY, Yang XP, Li Q, Wu LH, Shen QR, Zhao FJ. Changes in antibiotic concentrations and antibiotic resistome during commercial composting of animal manures. Environ Pollut. (2016) 219:182–90. doi: 10.1016/j.envpol.2016.10.044
43. Schnetzer P, Brügger M, Naegeli H, Müntener C. [Calculation of therapeutic intensity for pigs treated using medicated feed]. Schweiz Arch Tierheilkd. (2017) 159:381–6. doi: 10.17236/sat00121
44. Kümmerlen D, Echtermann T, von Gerlach F, Müntener C, Sidler X. Reduced usage of High Priority Critically Important Antimicrobial (HPCIAs) as a result of legal regulations and private initiatives in Switzerland. In: Proceedings AACTING. Berne (2019).
Keywords: antimicrobial usage, benchmarking, defined daily dose, animal treatment index, Suissano
Citation: Kuemmerlen D, Echtermann T, Muentener C and Sidler X (2020) Agreement of Benchmarking High Antimicrobial Usage Farms Based on Either Animal Treatment Index or Number of National Defined Daily Doses. Front. Vet. Sci. 7:638. doi: 10.3389/fvets.2020.00638
Received: 02 May 2020; Accepted: 04 August 2020;
Published: 09 September 2020.
Edited by:
Lucie Collineau, Agence Nationale de Sécurité Sanitaire de l'Alimentation, de l'Environnement et du Travail (ANSES), FranceReviewed by:
Yosuke Sasaki, University of Miyazaki, JapanMadelaine Norström, Norwegian Veterinary Institute (NVI), Norway
Copyright © 2020 Kuemmerlen, Echtermann, Muentener and Sidler. This is an open-access article distributed under the terms of the Creative Commons Attribution License (CC BY). The use, distribution or reproduction in other forums is permitted, provided the original author(s) and the copyright owner(s) are credited and that the original publication in this journal is cited, in accordance with accepted academic practice. No use, distribution or reproduction is permitted which does not comply with these terms.
*Correspondence: Dolf Kuemmerlen, ZG9sZi5rdWVtbWVybGVuQHV6aC5jaA==