 Adnan Aminu Adnan1,2,3
 Jan Diels2
 Jibrin Mohammed Jibrin3
 Alpha Yaya Kamara4,5Peter Craufurd6
 Abdulwahab Salisu Shaibu1
 Ismail Ibrahim Garba3,7*
- 1Department of Agronomy, Bayero University Kano, Kano, Nigeria
- 2Division of Soil and Water Management, Department of Earth and Environmental Sciences, Katholieke Universiteit te Leuven, Leuven, Belgium
- 3Centre for Dryland Agriculture (CDA), Bayero University Kano, Kano, Nigeria
- 4International Institute of Tropical Agriculture, Ibadan, Nigeria
- 5C/o IITA Ltd., Croydon, United Kingdom
- 6Agricultural Botany Division, International Maize and Wheat Improvement Centre, NARC Research Station Khumaltor, Kathmandu, Nepal
- 7School of Agriculture and Food Sciences, The University of Queensland, Gatton, QLD, Australia
Selection of appropriate sowing density is an important yield enhancing management decision in maize (Zea mays L.) production particularly in rainfed conditions. This study aimed at evaluating the optimum stand densities (OSDs) of 10 recently released maize varieties under different crop management decisions and environments. Ten maize varieties of varying characteristics were planted in the Northern Guinea Savanna of Nigeria across 30 farmer's fields in the rainy seasons of 2016 and 2017 under three stand densities: 2.6, 5.3, and 6.6 plants m−2. Grain yield and yield components were greatest under the high density in both years across all locations. The intermediate maturing varieties produced higher grain yields compared to the early and late maturing varieties in both years and locations. The environmental indices from the Factor Analytic Model showed 20% of the fields were optimal, 28.3% moderate, 31.7% poor, and 20% were very poor environments. Increasing planting density did not significantly affect the grain yield of the varieties in very poor environments. A linear increase in grain yield was observed in moderate and optimum environments with every increase in stand density for all varieties except Sammaz 32, however, optimum planting densities could not be reached for all the varieties. Therefore, tropical maize varieties should be planted under specific densities that account for environmental and management conditions to maximize yield.
Introduction
Over the years, maize has become an important crop in Nigeria, taking over acreages from traditional crops such as millet and sorghum (Kamara et al., 2009). In 2016, about 10.4 million tons of maize were produced from 6.4 million hectares, making Nigeria the highest producer of maize in Africa (FAO, 2018). The increase in maize production in Nigeria since the 1960s have been attributed to expansion in production area not the much needed intensification (FAO, 2017). Yield per unit area of maize is relatively low in the country, at about 2 tons per hectare, <40% of the yield potential of most cultivars is achieved. The low per hectare yield of maize has been attributed to many factors, as highlighted by Adnan et al. (2017). Research efforts by breeders and agronomists have led to the production of many technologies, including breeding high-yielding varieties tolerant of drought, diseases, low nitrogen, and Striga infestation (Badu-Apraku et al., 2009; Kamara et al., 2009; Ifie et al., 2015). Some of these varieties are early or extra early, which led to the expansion of maize into the drier parts of Nigeria, where production was originally unfeasible (Badu-Apraku et al., 2011).
The increasing demand for maize in Nigeria for both human and commercial consumption has prompted the need for improved intensification. Furthermore, the rise in population has prevented continuous land expansion, as land is now needed for more non-agricultural activities (Pretty et al., 2011). It has since been agreed that to improve maize intensification, a dynamic change in how maize is produced must be explored. These changes must consider making agronomic recommendations that deviate from the current generalized and blanket advice which do not recognize the wide variations in climatic and edaphic conditions (NAERLS and FDAE, 2017). Firstly, the selection of adaptable varieties with traits suitable to the peculiarities of each production zone must be encouraged (Badu-Apraku et al., 2009; Kamara et al., 2009). Secondly, appropriate site-specific fertilizer management that encompasses optimal nutrient-use must be adopted (Kamara et al., 2014; Shehu et al., 2018). Thirdly, smart agronomic practices that incorporate appropriate time of sowing and selection of optimal sowing densities must be promoted (Jibrin et al., 2012).
Optimum stand density (OSD) in annual crops is the intermediate seeding density that maximizes yield at harvest (Deng et al., 2012). OSD selection is an agronomic practice that determines the growth and yield of maize, and its importance has long been established all over the world (Liu and Tollenaar, 2009; Duvick et al., 2010; Casini, 2012; Al-Naggar et al., 2015). Optimum stand density of maize varies across environments and management practices, although several arguments in the literature suggest that recent cultivated varieties differ in their OSD even if planted in similar environments (Mokhtarpour et al., 2011; Li et al., 2015; Jia et al., 2018). In optimum environments (neither nutrients nor water limiting), grain yields are maximized under higher OSD due to the following: increase in LAI and net crop assimilation (Echarte et al., 2000; Sangoi et al., 2002), increase in the number of cobs per area, and the capacity of maize plants to develop new reproductive structures with an increase in available resources per plant (Lauer and Rankin, 2004). It is accepted that greater crowding tolerance of newly released maize cultivars allows for using higher stand densities when compared to older ones even under sub-optimal nutrient conditions (Di Matteo et al., 2016).
Currently, sowing densities of up to 8.5 plants m−2 are recommended under intensive production in North America (Li et al., 2015). In Nigeria, the recommended sowing density for maize is 5.3 plants m−2 irrespective of varietal characteristics, environment, or management practice (NAERLS and FDAE, 2017). Under sole cropping, the density is usually achieved by sowing and thinning to 1 plant hole−1 at a spacing of 75 cm inter and 25 cm intra row while in mixed cropping, two plants ha−1 are usually sown at a spacing of 75 x 50 cm inter and intra row, respectively. Most farmers adopt sowing densities below 50% of the recommended rates, majorly due to lack of knowledge and fear of yield losses associated with high-density sowing under low fertilization and possible intermittent droughts. The low output in smallholder farms in the Nigerian Savannas is partly attributed to the adoption of sub-optimal sowing densities (Sani et al., 2008). The absence of a standard OSD for maize varieties in the Nigerian Savannas makes it necessary to undertake research to better understand the optimum density of maize in varying environments and management practices. Therefore, the objective of the present investigation was to evaluate the response of maize yield and yield components of variable maturity groups of maize to different sowing densities in on-farm conditions of varying management, edaphic and seasonal characteristics.
Materials and Methods
Experimental Sites
Field trials were conducted in the rainy seasons of 2016 and 2017 across the Northern Guinea Savanna (NGS) zones of Kano and Kaduna States, both located in North-Western Nigeria. One Local Government Area (LGA) was selected in Kano (Doguwa) and two selected in Kaduna (Ikara and Lere). The selection of sites was made purposefully to cover areas with high maize production potentials and where research for development and extension support activities of the Sasakawa Africa Association (SAA) are active. In each LGA, 10 farmers were selected through stratified random sampling to cover the different groupings of farmers in the SAA extension programs. SAA farmers were grouped into five distinct classes based on how long they have been in the program. Subsequently, two farmers were randomly selected from each group in each LGA to cover all classes; a total of 30 farmers were used for the entire research. The same farmers and fields selected in 2016 were maintained and used in 2017, giving a total of 60 environments (30 farmers × 2 years combinations). Detail description of the location of the LGAs, characteristics of the experimental fields, and trial management have described in Adnan et al. (2020).
Experimental Design
The trial involved a factorial design of 10 varieties and three densities implemented in 30 farmers' fields. Each field had 10 treatment combinations that were allocated using the design of experiment (DOE) platform of JMP version 14 software (SAS, 2018) according to the D-optimality criterion (Atkinson and Donev, 1989) for a model that had variety, the experience of a farmer, density, density*density, variety*density and variety*density*density as fixed effects and farmer (=block) and farmer nested in locations as random effects. The D-optimum design is efficient, especially when the response variable depends on quantitative and qualitative factors, and the qualitative factor usually represents blocking variables (Atkinson and Donev, 1989). In generating our design, the qualitative factor, experience of a farmer, was also used as a blocking variable and necessitated the need to generate a D-optimum design. The above situation generated an imbalance in the complete data since the variety × density combinations were different in the individual farmer's field. In each farmer's field, the experiment was laid out in a randomized complete block design and each farmer represents a replicate. In this study, the environment was defined as the combination of farmers, densities, and the year. Here, environments may refer to individual locations in a year or several locations across the two years, such that environment is condensed and commonly refers to the combination of location (farmer, densities, and farmer's plot) and year.
Treatments and Trial Descriptions
Ten maize varieties of varying maturity levels (two early, two intermediate, and six late varieties) were used in the experiment (Table 1). The varieties were planted under three sowing density levels: the national recommendation (5.33 plants m−2), 50% lower (2.66 plants m−2), and 20% higher (6.66 plants m−2). The density selection was done to capture the reality of sowing densities currently found in farmers' fields (2.66 and 5.33 plants m−2) and a slight increase (6.66 plants m−2) over the recommendation. The densities were achieved by maintaining the same inter-row spacing (75 cm) and then varying the intra-row spacing. For 2.66 plants m−2, an intra-row spacing of 50 cm was used; for 5.33 plants m−2, a spacing of 25 cm was used; and for 6.66 plants m−2, a spacing of 20 cm was used. Under all densities, two plants were sown per hole and then thinned to 1 plant per hole at two weeks after sowing. Sowing was done by Bayero University Kano (BUK) team on the same planting date as the one used by the farmer in his field as soon as the rains were established. In 2016, sowing was delayed due to the late establishment of rains, with sowing carried out on 20th June in Doguwa, 21st June in Ikara, and 24th June in Lere. In 2017 however, the fields in Doguwa were sown on 31st May while Ikara and Lere were sown on 2nd and 4th June. Fertilizer application was done according to the regional recommendation (120N:60P2O5:60K2O kg ha−1); potassium (K) was applied in the form of muriate of potash, phosphorus in the form of single super phosphate, and nitrogen was applied in the form of Urea. While all the P and K fertilizers were applied at sowing, only half of the N fertilizer was applied at the time of sowing (via incorporated band row placement), and the other half applied 21 days later. The farmers implemented the rest of the crop management practices while harvesting was also done by BUK. Specifically in each location, fields were managed according to farmers experience class to maintain the Farmers' experience gradient (A-E). Each farmer field was planted with 10 plots, ensuring that all 10 varieties are sown together with random combinations of the 3 sowing densities according to the experimental design. The individual plot size was 30 m2 (8 ridges of 0.75 x 5 m length), and the net plot for yield assessment was 12 m2 (4 m × 4 inner ridges).
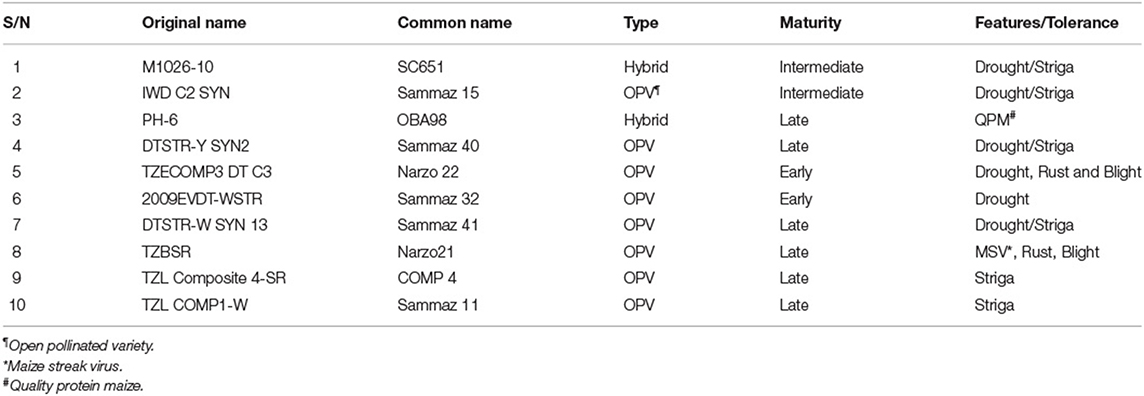
Table 1. Characteristics of maize varieties used for the experiment.
Plant Data Measurements
Plant measurements were carried out at harvest and post-harvest stages. Plants from the net plot were cut at ground level; ears were removed, leaving husks intact on the plant. Ear number was calculated by dividing the number of all the ears by the net plot area and extrapolated to ear number m−2. The weight of all cobs was then taken and recorded. A sub-sample of 10 cobs was sampled following a strategic procedure where all cobs are laid side by side; based on the number of cobs, selections are made at intervals. For example, in a plot with 20 cobs, even or odd-numbered cobs are selected until the 10 needed cobs are reached. To measure kernel number per m−2 and kernel weight in grams, kernels are removed from the 10 sub sampled cobs before drying, three sets of 100 kernels are counted and weighed, the average weight was then recorded. Cob and kernel subsamples were dried to constant weight at 70°C for at least 72 h, after which the seed and cob sub samples were weighed and logged separately. However, the remaining plant parts (stover without ears) were separated into various components (leaf blade, sheath, husk, and stem including tassel) and weighed separately for above ground measurement. The various components are then chopped separately, with each component adequately mixed and 500 g sub-sample oven-dried to constant weight at 65°C for 72 h. Measurements of all components followed methods proposed by Ogoshi et al. (1999).
Soil and Weather Measurements
For soil data measurements, one composite sample was taken from each farmer field from four sampling points collected at 0–20 cm depth using soil augers during establishment before planting and fertilizer application. The V zig-zag random sampling approach was adopted, and the four sampling points were taken from each field. Collected soil samples were thoroughly mixed and passed through a 2 mm sieve. Afterward, one disturbed composite sample representing each farmer's field was taken to analyze major soil characteristics using wet chemistry. Total nitrogen (TN) was determined using the micro-Kjeldahl digestion method (Bremner, 1996). Total soil organic carbon (TC) was measured using a modified Walkley and Black chromic acid wet chemical oxidation and spectrophotometric method (Heanes, 1984). Soil pH in water (soil to water ratio of 1:1) was measured using a glass electrode pH meter and the particle size distribution was determined following the hydrometer method (Gee, 2002). Available phosphorus (avail. P) was analyzed based on the Mehlich-3 extraction procedure (Mehlich, 1984) preceding inductively coupled plasma optical emission spectroscopy (ICP-OEC, Optima 800, Winlab 5.5, PerkinElmer Inc., Waltham, MA, USA). One undisturbed core sample was also taken near the four auger points in each field. These undisturbed core samples were used for bulk density (BD) analysis using the thermo-gravimetric core method (Blake and Hartge, 1986); the results were averaged to have one bulk density value per field. Bulk density values ranged between 1.73 and 1.40 g cm−3, with wide variation across farmer fields (Supplementary Table S1). The soils are categorized as moderately acidic (5.6–6.0) to slightly acidic (6.1–6.5). There was a wide variation in the soil TC contents, with all locations in Lere and Ikara having TC contents below 10 g kg−1. Across all locations, TN contents were low although moderate variability existed across the different farmer fields based on rating suggested by Møberg and Esu (1991). High variability existed in the available phosphorus contents, although all the soils were largely poor in available P. Most of fields had sandy clay loam texture, with only a few having sandy loam textures.
Statistical Analyses
All measured variables were subjected to analysis of variance. A linear mixed model was adopted, farmer fields nested in both LGAs and years ([Field|LGA] and [Field|Year]) were random effects. The main effects of year, sowing density, variety and farmer experience, and individual second-order interactions were estimated as fixed effects. We used standard simplification procedures to eliminate non-significant terms in the model; we started with a null model with only random effect only and added the main effects of year, sowing density, variety and farmer experience, and individual second-order interactions. The model with the lowest corrected Akaike′s Information Criterion (AICc) was selected as the best-fitting model that minimize risks of overparametization (Bozdogan, 1987). The result of grain yield, harvest biomass, kernels number per square meter, and 100 kernel weights from the design ANOVA are shown in Table 2.
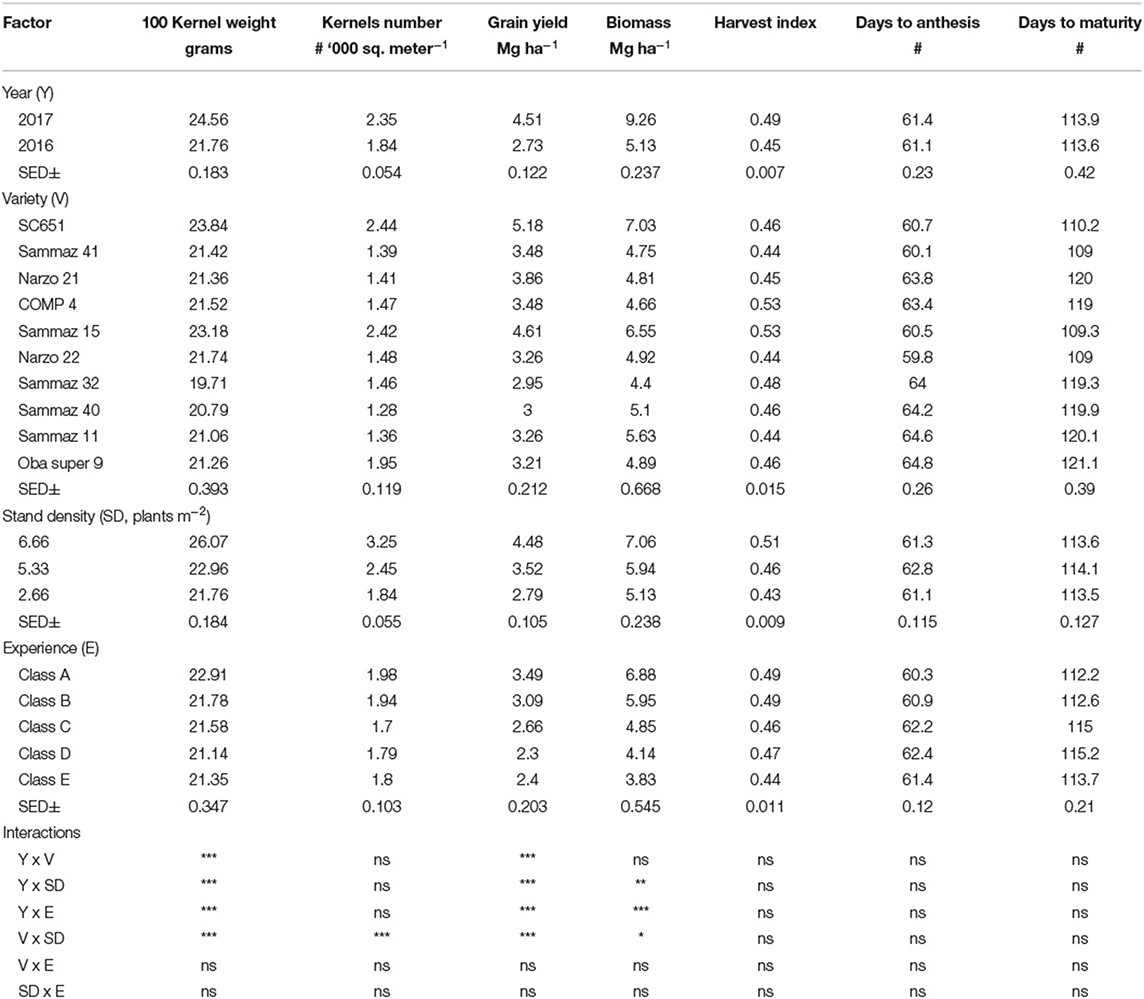
Table 2. Mean 100 kernel weight, kernels number, grain yield, aboveground biomass, harvest index, and number of days to anthesis and to physiological maturity of maize as affected by year, variety, stand density, farmer and farmer experience.
A Factor Analytic Model (FAM) (Meyer, 2009) was adopted for analyzing the multi-environment effects of farmer fields and year variations on the grain yields of the different maize varieties as recommended by Piepho (1999) and Smith et al. (2001). For this analysis, an environmental index (EI) was first created by dividing the individual model estimate of each variety in a particular farmer field by the overall estimate of that farmer for a particular year. It is commonly assumed that environments are considered random effects to make inferences to other unobserved environments (Piepho, 1997). Piepho (1999) showed that the predictive accuracy of best linear unbiased prediction (BLUP) from a two-way ANOVA model has slight differences, which mainly depends on whether varieties, location, or both, are considered as random; however, the most vital assumption is for the interactions to be random. Based on these assertions, the FA model can be expressed as mixed models with FA variance-covariance structure as follows:
Where, X is the incidence matrix for the fixed effects of SD, and Z is the incidence matrices for the random effects of environments that combine the main effects of genotypes and G × E. Vector β is the fixed effect of SD and vectors μ and e are the random effects of environments and residuals within environments, respectively, and are assumed to be random and normally distributed with zero mean vectors and variance-covariance matrices. Similar to Crossa et al. (2016), a representation of these matrices is as follows:
A different approach was adopted for a detailed analysis of grain yield across environments, i.e. the farmers' fields × year combinations. Genotype-environment interactions are best described with multiplicative terms. As the environments are best considered as random, this gives rise to a mixed model with factor-analytic covariance structures (Piepho, 1997). The experimental data were described with the following mixed model:
where yijk is the grain yield for the ith variety sown at a given density jth environment in a field plot k, where the fixed effects parameters βi, β2i, and β3i describe the (non-linear) response of variety i to sowing density, and d1ij, d2ij and d3ij are random effect parameters that describe the interaction between variety i and environment j in the variety's response to sowing density.
In this study, we used the FA structure for modeling variety in terms of a few hypothetical (unobservable) factors. The unobservable factor effect of the ith variety in the jthenvironment can be expressed as , where δik is the kth random regression coefficient of the ith variety (loading or genotypic sensitivity) to the kth unobserved (latent) variable related to the jth environment (environmental potentiality), xjk, and dij are the residuals interaction term. The score of the ith variety in the kth factor component is estimated as a covariance parameter; thus, the model has a random regression coefficient form.
Therefore, the factor-analytic structure with q ≤ e factors or components [FA(q)] is of the form ΔΔ' + D, where Δ is an e × q matrix of δ's and D is an e × e diagonal matrix with e non-negative parameters on the diagonal. Each column of Δ contains the varieties scores for one of the multiplicative terms. For q = 1, the model denoted as FA (1) has one multiplicative term and 2e parameters to be estimated, for q = 2, i.e., model FA (2), the model has 3e parameters to be estimated, and so on for FA (3), etc.
A simple multiplicative model for the random effect parameters is given by Piepho (1997):
Where; u1i, u2i and u3i being the 3 parameters for variety i, and wj being an underlying (unobserved) environmental factor or index that represents some gradient (e.g., the inherent fertility of a field and how well the rainfall was distributed at that location in that year). Equation 4 means that the covariance structure of the random effects corresponds to the Eberhart-Russell stability model (Eberhart and Russell, 1966), a factor analytic model noted as FA (1) in SAS (Piepho, 1999). According to Piepho (1999), FA with one factor together with equal or unequal specific variances for the treatments are usually of the Finlay–Wilkinson (FA1) (Finlay and Wilkinson, 1963) or the Eberhart–Russell (FA) (Eberhart and Russell, 1966) model groups.
Using the MIXED procedure in SAS version 14.3 (SAS, 2018), the FA structures were specified with the TYPE option in the RANDOM statement. Parameters of variance-covariance were estimated by restricted maximum likelihood (REML) with Newton–Raphson iteration solutions in the MIXED procedure. Since the Kenward-Roger method (Kenward and Roger, 1997) is superior for the analysis of unbalanced data sets (Spilke et al., 2005), we used this method for the calculation of degrees of freedom for the contrast test of variety effects because our design was also unbalanced.
Results
Weather Conditions
Figure 1 shows the climatic conditions of the 3 LGAs in 2016 and 2017. Lere had the highest cumulative rainfall for both years, although the variation between the LGAs was higher in 2016 than in 2017. In 2016, Lere LGA had 78.1 mm more rainfall than Ikara and 148.1 mm more rainfall than Doguwa, while in 2017, the difference was 58.7 and 106.7 mm, respectively. Due to early establishment and late cessation of rainfall, the trials were sown earlier and harvested later in 2017 than in 2016 across all 3 LGAs. In 2016, Lere had the least number of rainy days and the highest cumulative rainfall, while Doguwa had the highest number of rainy days and the lowest amount of cumulative rainfall. In 2017 however, Lere had the greatest number of rainy days and the highest amount of cumulative rainfall, while Doguwa had more rainy days but lower cumulative rainfall than Ikara. Overall, 2017 was a better year than 2016 across all 3 LGAs, as evidenced by higher cumulative rainfall and a more significant number of rainy days.
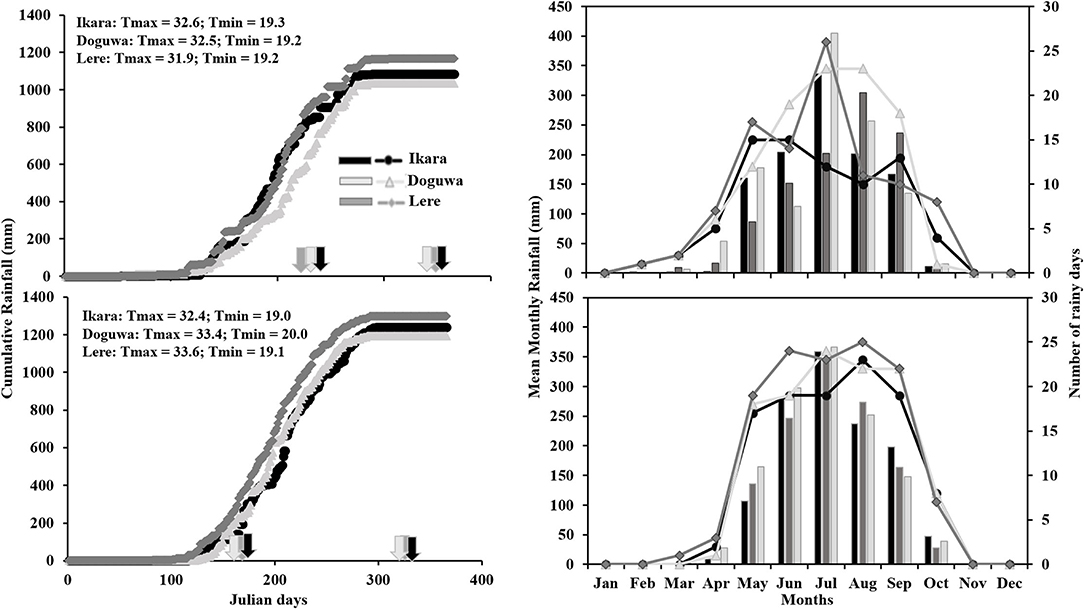
Figure 1. Cumulative rainfall (solid lines with markers), number of rainy days (lines with markers), and monthly rainfall (bars) for the study areas in 2016 and 2017. Arrows indicate sowing and harvest dates for the individual locations in 2016 and 2017.
Yield Components
The effects of sowing density, variety, year, farmer's experience, and their interactions on 100-kernel weight (g), sink size (kernel number m−2), grain yield (Mg ha−1), aboveground biomass (Mg ha−1), flowering and maturity dates (days) were presented in Table 2. The grain yield and aboveground biomass were significantly (P < 0.05) higher in 2017 (4.51 and 9.26 Mg ha−1, respectively) compared to 2016 (2.73 and 5.13 Mg ha−1, respectively). The variety SC651 had the highest grain yield (5.18 Mg ha−1) and aboveground biomass (7.03 Mg ha−1). Both grain yield and aboveground biomass were higher in class A farmer's field while the lowest grain yield was in class D farmer's experience even though it was statistically at par with class C and E. Interactions of year, variety, sowing density and farmer's experience did not significantly affect numbers of days to anthesis and physiological maturity. Harvest index increased from 0.43 to 0.51 with increased sowing density.
Environmental Indices and Factor Analytic Model Parameters
Figure 2 shows the result of the environmental index calculated in 2016 and 2017, together with the cumulative probabilities for both years combined. Across both years, the environmental indices ranged between +2.23 to −1.55 (Figure 2). A higher value of an environment index indicates optimum conditions for the growth and development of maize with respect to soil, management, and weather conditions. Out of the 60 environments, 12 environments (20%) had index values between 1.07 and 2.23 and were classified as optimum environments, 17 environments (28.3%) have indices between 0.006 and 0.89 and are classified as moderate environments, 19 environments (31.7%) have index values <0 but >-1 and are classified as poor environments, while 12 environments (20%) have index values between −1 and −1.5 and were classified as very poor environments.
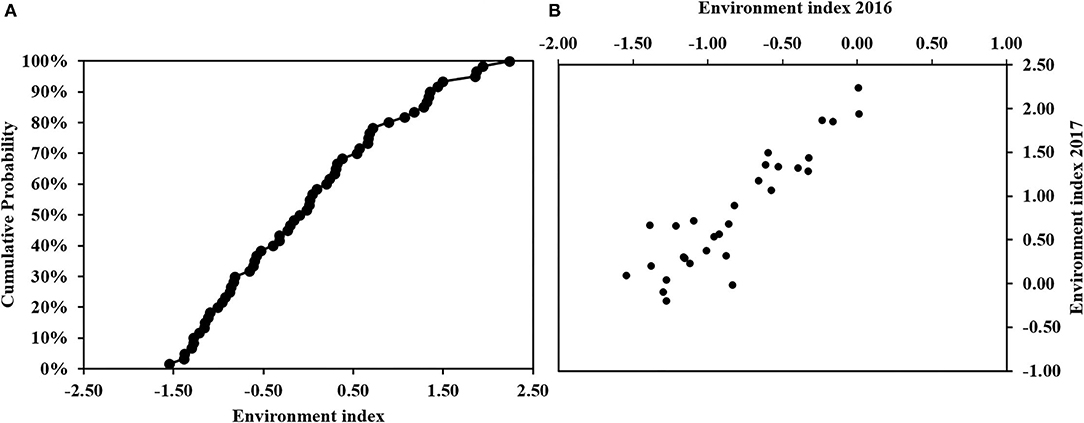
Figure 2. (A) Cumulative Probability of environmental indices and (B) actual environmental indices in 2016 and 2017.
Table 3 shows the estimated probability values of the fixed effect (intercept, density, and density2) parameter estimates of the 10 maize varieties modeled using the Eberhart-Russell (FA) model combined across all environments. The intercept was statistically significant for all the varieties except Sammaz 40 and Sammaz 32. The highest estimate for the intercept was observed for Sammaz 15, while the lowest was observed for Sammaz 40. The effect of density was significant only for SC651, Sammaz 11 and OBA98 with Narzo 22 having a P-value slightly higher than 0.05. However, for the quadratic effect of density, P-value was significant for SC651, Narzo 22, and OBA98.
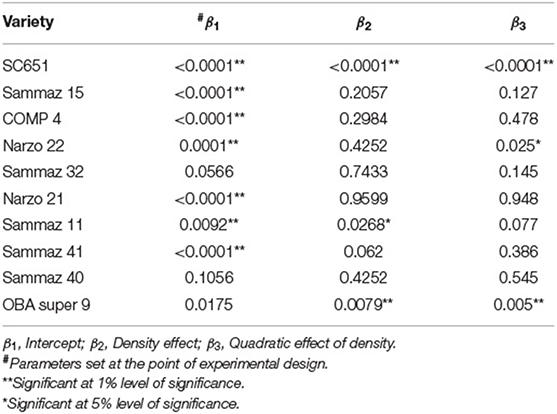
Table 3. Fixed effect parameter estimates, and their corresponding probability values averaged across environments for the 10 varieties used in the study.
Estimated Grain Yields
Figure 3 shows the estimated grain yield of the different maize varieties under varying sowing densities. In good environments (Environment index = 1.5) linear increase in grain yield was observed with every increase in planting density for all the varieties except for Sammaz 32, although the magnitude of yield increase was variety specific. In the moderate environment (Environment index = 0.5), a linear increase in grain yield was observed with every increase in planting density up to the highest density tested for Sammaz 15, SC651, OBA98, Narzo 21 and Sammaz 11. For Sammaz 32 and Sammaz 41 however, an increase in planting density from 2.66 to 5.33 plants m−2 led to a significant increase in yield, but the further increase did not produce any significant yield increase. In poor environments (Environment index = −0.5), a linear increase in grain yield was observed with an increase in planting density for Sammaz 32, Sammaz 15, Sammaz 11, Oba 98, and Narzo 21. Sammaz 40 and Narzo 21 did not respond to increasing density, while for COMP 4 and SC 651, increasing planting density from 2.66 to 5.33 plants m−2 did not lead to a significant increase in grain yield, but further increase to 6.66 plants m−2 resulted in a significant yield increase. Increasing planting density from 2.66 plants to 5.33 plants m−2 did not significantly affect the grain yield of all the varieties in very poor environments (Environment index = −1.5).
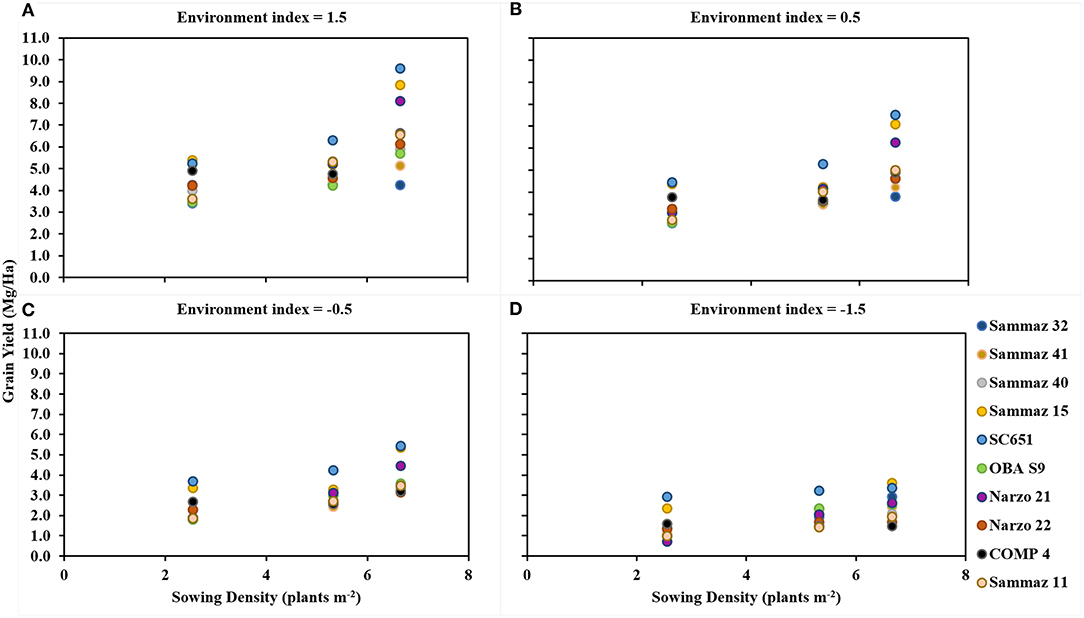
Figure 3. Grain yield of ten maize under different environments. Panels represent: very good environment (A), moderate environment (B), poor environment (C), and very poor environment (D).
The response of individual varieties to increase in planting density across different environments was shown in Figure 4. The highest grain yields were recorded for variety SC 651 irrespective of the environment. Grain yields of 9.6, 7.5, 5.4 and 3.4 Mg Ha−1 were recorded under the highest planting density (6.6 plants m−2) in the good (EI = 1), moderate (EI = 0.5), poor (EI = −0.5) and very poor (−1) environments respectively. When the variety was planted under 5.3 plants m−2, a yield of 6.95, 5.72, 4.48, and 3.25 Mg Ha−1 was recorded for good, moderate, poor, and very poor environments. The variety produced grain yields of 5.12, 4.39, 3.66, and 2.94 Mg Ha−1 for good, moderate, poor, and very poor environments when planted under the lowest sowing density. For the high-density planting, a yield difference of 44.2% was observed between SC 651 and the lowest yielding variety (Sammaz 32) when planted in good environments, while the difference was 86.6% in very poor environments. A yield difference of 61.7 and 65.5% was observed between the good environments and the poor environments for the medium-density planting. However, for the low-density planting, the difference in yield between SC 651 and Sammaz 32 was 34.4 and 67.8% under the very poor and good environments, respectively.
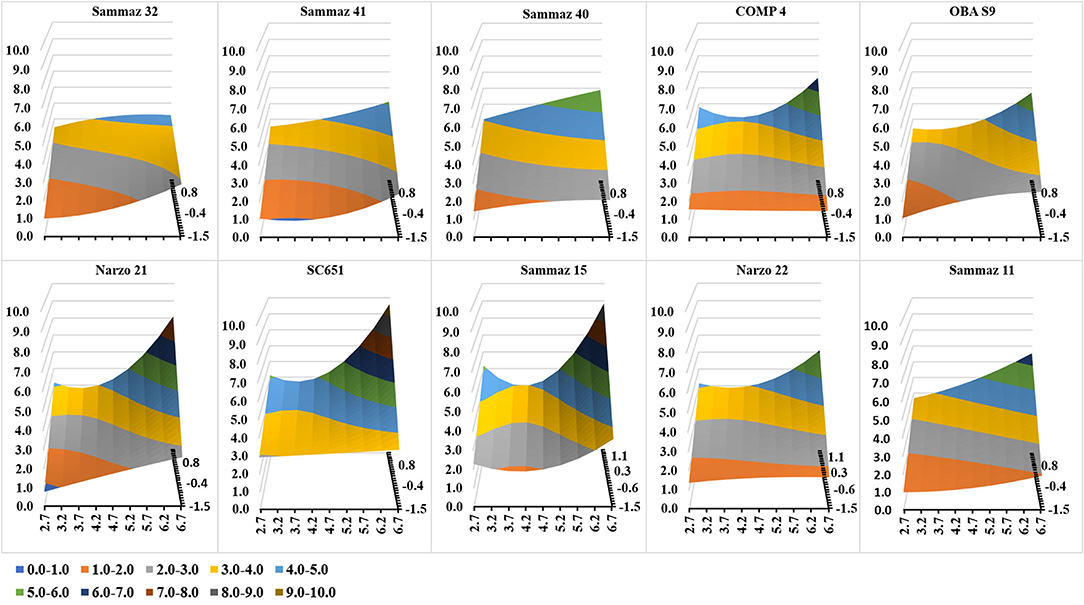
Figure 4. Grain yield of different maize varieties under varying sowing densities across environments. X-axis, Sowing Density (plants m−2); Y-axis, Grain Yield (Mg Ha−1); Z-axis, Environmental index (Negative values indicate poor environments).
Discussion
Generally, the response of maize yield and yield components to increasing stand density was asymptotic irrespective of the environment. Similarly, our results showed that OSD is environment-dependent (climate and crop management) as we found that the biomass and grain yield of all varieties were higher in years with less variable and greater cumulative precipitation. The yield and yield components were also higher with class A farmers' group with timely weeding, and N fertilization and proper adherence to extension services. Several authors reported variation in maize OSDs across diverse environments in the literature (Echarte et al., 2000; Sangoi et al., 2002; Tollenaar and Lee, 2002; Boomsma et al., 2009; Liu and Tollenaar, 2009; Hernández et al., 2014). Yield increases with elevated sowing densities have been reported all over the world. In Egypt, for example, Al-Naggar et al. (2015) reported a yield increase with increasing planting density up to 9.5 plants per meter square under high nitrogen applications. Historical yield gains for maize in the United States have been attributed to increased planting density (Tokatlidis and Koutroubas, 2004). Dramatic increases in grain yield due to elevated density have been reported in Brazil, Argentina, Canada, and France (Duvick, 2005). In Nigeria, Kamara et al. (2006) and Adeniyan (2014) reported grain yield gains with an increase in planting density. Although optimum stand density of maize has been shown to be variety dependent (Widdicombe and Thelen, 2002; Sarlangue et al., 2007), even the best hybrids will produce low yields when agronomic management is not optimum (Boomsma et al., 2009). This is because maize varieties interact with the environment and crop management in producing grain yields (Mastrodomenico et al., 2018). Therefore, maximizing the yield potential of a variety under elevated planting density requires an adequate understanding of the dynamics between plant genetics and agronomic management (Tollenaar and Lee, 2002).
Recently, researchers have suggested using FA mixed models for analyzing multi-environment trials (METs) data (Malosetti et al., 2013; Smith et al., 2015; Crossa et al., 2016; Tang et al., 2018; Hoefler et al., 2020). The use of FA variance-covariance structures for variety effects has been demonstrated to produced better predictors than the normal assumption that variety effects are independent (Piepho, 1997; Thompson and Resende, 2004). Since the FA is a linear mixed model, it also has the advantages of accommodation of error variance modeling (in particular, heterogeneity of block and error variance between environments and within-environment spatial correlation) and easy handling of incomplete data (Crossa et al., 2010). In the current study also, which was a MET, the use of the FA mixed model resulted in the identification of varietal response under varying environments.
In our experiments, farmers with varying characteristics were selected such that some groups (A and B) are known to follow all recommended agronomic practices, have good soils due to history of proper residue management and manure application, and have for long belonged to farmer groups where they frequently access extension services. The second groups of farmers (C, D, and E) follow their own practices that entail non-optimal nutrient management, inadequate weed control, and often lack access to extension services. Additionally, the amount and distribution of rainfall in the two years of experimentation were very different, leading to variations in the observed environmental indices. Since the environmental indices were created by combining the soil characteristics in different farmer fields, location and year; a tremendous variability among the test environments was observed. About 20% of the environments were very good and are the most optimum for maize production. About 30% of the environments are moderate environments and could be used for maize production but are not optimal. The remaining environments are not appropriate for maize production, basically due to poor soils and improper agronomic management coinciding with low and improperly distributed rainfall. Since agronomic decisions are blanket in Nigeria, farmers have been consistently advised to increase their planting densities, especially under sole and strip cropping systems, without considering the variation among farmers, soil types, and weather conditions (Adeniyan, 2014; Gilbert, 2016; NAERLS and FDAE, 2017). The higher yields recorded in the optimum environments are attributed to better agronomic management, good soils, and higher rainfall amounts. Ruffo et al. (2015) suggested that increased planting density must be synergistic with other optimal management factors, including weed control and better soil fertility management. Grain yield responses showed a convex shape in the poor environments where increasing planting density from 2.6 to 5.3 plants m−2 did not affect grain yield but further increase to 6.6 plants m−2 resulted in yield increases. This response is typical in weed-infested maize fields (Tollenaar et al., 1994; Page et al., 2012). Maize suffers competition from early weeds, but the competitive ability is improved by increasing planting density (Tollenaar and Lee, 2002).
Results from the present research showed an apparent variation in yield responses due to elevated planting densities across the test varieties. All the varieties responded to increasing planting density in the optimum environments, although all the responses were linear with no evidence of attainment of optimum density. Higher grain yields were recorded for the highest planting density for all the varieties in the optimum environments except for Sammaz 32. This is an unexpected result as the variety is early maturing, and previous reports by Edwards et al. (2005) suggested that higher planting densities are expected for early maturing varieties than full season varieties. This is because early varieties usually have smaller leaves, meaning more plants are needed per area to reach the same amount of cumulative intercepted radiation (Tollenaar et al., 2006).
The intermediate varieties (SC 651 and Sammaz 15) produced higher yields than the early and late varieties under all tested planting densities and across all environments, although the variation in yield was greater in elevated planting densities. Even though the early varieties mature earlier than the intermediates and share similar morphological characteristics, their lower yields are clearly due to low genetic yield potentials and shorter grain fill duration. The intermediate varieties had low biomass plasticity and low reproductive partitioning, which provided them the ability to respond to increasing population densities due to: (i) reduction of sink limitation, which resulted in increased harvest index and (ii) increase in their ability to explore resource and tolerate biotic stresses which leads higher biomass production (Sarlangue et al., 2007). In addition, all the intermediate varieties were drought and Striga tolerant, and because breeding for Striga is done under low soil Nitrogen (Ifie et al., 2015), they had the added advantage of utilizing the available nitrogen even under high density. It is interesting to note that the early maturing varieties produced grain yields that were statistically similar to the late varieties that have been reported in the literature to have relatively higher potential yields. The late-maturing varieties produced grain yields that were significantly lower under high density. This could be due to the high shading ability caused by vigorous vegetative structures that lowered harvest index. The lower grain yields could also be attributed to the longer time it takes for the late varieties to end juvenility and reach full grain filling (van Roekel and Coulter, 2011). This research demonstrated that the response of grain yield of maize to plant density was dependent on varietal characteristics and environmental conditions in the Nigerian Savannas. Furthermore, under elevated planting densities, varieties with the ability to tolerate the crowding stress and, to some extent, drought and low nitrogen should be adopted. While the selection of appropriate varieties with good tolerance to both environment-specific biotic and abiotic stresses may result in increased grain yield, Adnan et al. (2020) reported that under elevated density beyond the current recommendation in the Guinea Savannah, economic gains are possible in environments there is concomitant increase in N fertilizer application rates. This necessitates additional research to determine the “best-fit” stand density that maximizes maize yield and economic returns to provide farmers with a better understanding of the economic risks associated with adoption high stand density.
Conclusion
Sowing density recommendations all over Nigeria have been blanket without consideration for varietal characteristics, soil type, climatic conditions, and or management decisions. We conducted experiments in farmer fields with different management skills using maize varieties of different characteristics planted under different stand densities. Yields of tested varieties were different under both low and high stand densities indicating a difference in both potential yield and tolerance to crowding. The intermediate maturing varieties which have both high yield potentials and tolerance to crowding, drought, and low nitrogen, produced the highest grain yields under all the tested stand densities. The study shows that the planting density of maize can be increased, leading to a corresponding increase in grain yield under suitable environmental conditions.
Data Availability Statement
The raw data supporting the conclusions of this article will be made available by the authors, without undue reservation.
Author Contributions
AA: conceptualization and writing—original draft preparation. AA, JD, JJ, AK, and PC: methodology. AA and AS: validation. AA, JD, AS, and IG: formal analysis. AA and IG: investigation. PC, AK, and JJ: resources and funding acquisition. AA, IG, and AS: data curation and visualization. JJ, AK, AS, and IG: writing—review and editing. JD and JJ: supervision. JJ: project administration. All authors have read and agreed to the published version of the manuscript.
Funding
This research was supported by the Bill and Melinda Gates Foundation (Grant No: OPP1113374) through the Taking Maize Agronomy to Scale in Africa (TAMASA) project and the Centre for Dryland Agriculture, Bayero University Kano, Nigeria.
Conflict of Interest
AK was employed by C/o IITA Ltd.
The remaining authors declare that the research was conducted in the absence of any commercial or financial relationships that could be construed as a potential conflict of interest.
Publisher's Note
All claims expressed in this article are solely those of the authors and do not necessarily represent those of their affiliated organizations, or those of the publisher, the editors and the reviewers. Any product that may be evaluated in this article, or claim that may be made by its manufacturer, is not guaranteed or endorsed by the publisher.
Supplementary Material
The Supplementary Material for this article can be found online at: https://www.frontiersin.org/articles/10.3389/fagro.2022.773012/full#supplementary-material
References
Adeniyan, O. N. (2014). Effect of different population densities and fertilizer rates on the performance of different maize varieties in two rain forest agro ecosystems of South West Nigeria. Afr. J. Plant Sci. 8, 410–415. doi: 10.5897/AJPS2014.1182
Adnan, A. A., Diels, J., Jibrin, J. M., Kamara, A. Y., Shaibu, A. S., Craufurd, P., et al. (2020). Optimizing sowing density-based management decisions with different nitrogen rates on smallholder maize farms in Northern Nigeria. Exp. Agric. 56, 866–883. doi: 10.1017/S001447972000037X
Adnan, A. A., Jibrin, J. M., Kamara, A. Y., Bassam, A. L., Shaibu, A. S., and Garba, I. (2017). CERES–maize model for determining the optimum planting dates of early maturing maize varieties in Northern Nigeria. Front. Plant Sci. 8, 1118. doi: 10.3389/fpls.2017.01118
Al-Naggar, A. M. M., Shabana, R. A., Atta, M. M. M., and Al-Khalil, T. H. (2015). Maize response to elevated plant density combined with lowered N-fertilizer rate is genotype-dependent. Crop J. 3, 96–109. doi: 10.1016/j.cj.2015.01.002
Atkinson, A. C., and Donev, A. N. (1989). The construction of exact D-optimum experimental designs with application to blocking response surface designs. Biometrika 76, 515–526. doi: 10.1093/biomet/76.3.515
Badu-Apraku, B., Fakorede, M. A. B., Fontem, L. A., and Akinwale, R. O. (2009). Improvement of yield and other traits of extra-early maize under stress and nonstress environments. Agron. J. 101, 381–389. doi: 10.2134/agronj2008.0089x
Badu-Apraku, B., Oyekunle, M., Akinwale, R. O., and Fontem Lum, A. (2011). Combining ability of early-maturing white maize inbreds under stress and nonstress environments. Agron. J. 103, 544–557. doi: 10.2134/agronj2010.0345
Blake, G. R., and Hartge, K. (1986). “Bulk density, methods of soil analysis,” in Methods of Soil Analysis, Part 1—Physical and Mineralogical Methods Book Series, ed A. Klute (Madison: American Society of Agronomy [ASA]; Madison, WI: Soil Science Society of America [SSSA]), 363–382. doi: 10.2136/sssabookser5.1.2ed.c13
Boomsma, C. R., Santini, J. B., Tollenaar, M., and Vyn, T. J. (2009). Maize morphophysiological responses to intense crowding and low nitrogen availability: an analysis and review. Agron. J. 101, 1426–1452. doi: 10.2134/agronj2009.0082
Bozdogan, H. (1987). Model selection and Akaike's Information Criterion (AIC): the general theory and its analytical extensions. Psychometrika 52, 345–370. doi: 10.1007/BF02294361
Bremner, M. (1996). Nitrogen-Total. Madison, WI: American Society of Agronomy and Soil Science Society of America.
Casini, P. (2012). Maize production as affected by sowing date, plant density and row spacing in the Bolivian Amazon. J. Agric. Environ. Int. Dev. 106, 75–84. doi: 10.12895/jaeid.20122.64
Crossa, J., De Los Campos, G., Maccaferri, M., Tuberosa, R., Burgueño, J., and Pérez-Rodríguez, P. (2016). Extending the marker × Environment interaction model for genomic-enabled prediction and genome-wide association analysis in durum wheat. Crop Sci. 56, 2193–2209. doi: 10.2135/cropsci2015.04.0260
Crossa, J., Vargas, M., and Joshi, A. K. (2010). Linear, bilinear, and linear-bilinear fixed and mixed models for analyzing genotype × environment interaction in plant breeding and agronomy. Can. J. Plant Sci. 90, 561–574. doi: 10.4141/CJPS10003
Deng, J., Ran, J., Wang, Z., Fan, Z., Wang, G., Ji, M., et al. (2012). Models and tests of optimal density and maximal yield for crop plants. Proc. Natl. Acad. Sci. 109, 15823–15828. doi: 10.1073/pnas.1210955109
Di Matteo, J. A., Ferreyra, J. M., Cerrudo, A. A., Echarte, L., and Andrade, F. H. (2016). Yield potential and yield stability of Argentine maize hybrids over 45 years of breeding. F. Crop. Res. 197, 107–116. doi: 10.1016/j.fcr.2016.07.023
Duvick, D. N. (2005). The contribution of breeding to yield advances in maize (Zea mays L.). Adv. Agron. 86, 83–145. doi: 10.1016/S0065-2113(05)86002-X
Duvick, D. N., Smith, J. S. C., and Cooper, M. (2010). “Long-term selection in a commercial hybrid maize breeding program,” in Plant Breeding Reviews, ed J. Janick (Oxford: John Wiley & Sons, Inc.), 109–151. doi: 10.1002/9780470650288.ch4
Eberhart, S. A., and Russell, W. A. (1966). Stability parameters for comparing varieties1. Crop Sci. 6, 36. doi: 10.2135/cropsci1966.0011183X000600010011x
Echarte, L., Luque, S., Andrade, F. H., Sadras, V. O., Cirilo, A., Otegui, M. E., et al. (2000). Response of maize kernel number to plant density in Argentinean hybrids released between 1965 and 1993. F. Crop. Res. 68, 1–8. doi: 10.1016/S0378-4290(00)00101-5
Edwards, J. T., Purcell, L. C., and Vories, E. D. (2005). Light interception and yield potential of short-season maize (Zea mays L.) hybrids in the midsouth. Agron. J. 97, 225–234. doi: 10.2134/agronj2005.0225
Finlay, K. W., and Wilkinson, G. N. (1963). The analysis of adaptation in a plant-breeding programme and G. N. Wilkinson? by K. W. Finlay*. Aust. J. Agric. Res. 14, 742–754. doi: 10.1071/AR9630742
Gee, G. (2002). “Particle-size analysis,” in Methods of Soil Analysis, Part 4, Physical Methods Soil Science Society of America Book Series No 5, eds J. H. Dane and G. C. Topp (Madison, WI: Soil Science Society of America), 255–293.
Gilbert, N. . (2016). Response of maize (Zea mays L)varieties to planting densities. IOSR J. Agric. Vet. Sci. 9, 01–06. doi: 10.9790/2380-0910010106
Heanes, D. L. (1984). Determination of total organic-C in soils by an improved chromic acid digestion and spectrophotometric procedure. Commun. Soil Sci. Plant Anal. 15, 1191–1213. doi: 10.1080/00103628409367551
Hernández, F., Amelong, A., and Borrás, L. (2014). Genotypic differences among argentinean maize hybrids in yield response to stand density. Agron. J. 106, 2316. doi: 10.2134/agronj14.0183
Hoefler, R., González-barrios, P., Bhatta, M., Nunes, J. A. R., Berro, I., Nalin, R. S., et al. (2020). Do spatial designs outperform classic experimental designs? J. Agric. Biol. Environ. Stat. 25, 523–552. doi: 10.1007/s13253-020-00406-2
Ifie, B. E., Badu-Apraku, B., Gracen, V., and Danquah, E. Y. (2015). Genetic analysis of grain yield of IITA and CIMMYT early-maturing maize inbreds under -infested and low–soil-nitrogen environments. Crop Sci. 55, 610. doi: 10.2135/cropsci2014.07.0470
Jia, Q., Sun, L., Ali, S., Zhang, Y., Liu, D., Kamran, M., et al. (2018). Effect of planting density and pattern on maize yield and rainwater use efficiency in the Loess Plateau in China. Agric. Water Manag. 202, 19–32. doi: 10.1016/j.agwat.2018.02.011
Jibrin, J. M., Kamara, A. Y., and Ekeleme, F. (2012). Simulating planting date and cultivar effects on dryland maize production using CERES-maize model. African J. Agric. Res. 7, 5530–5536. doi: 10.5897/AJAR12.1303
Kamara, A. Y., Ekeleme, F., Chikoye, D., and Omoigui, L. O. (2009). Planting date and cultivar effects on grain yield in dryland corn production. Agron. J. 101, 91. doi: 10.2134/agronj2008.0090
Kamara, A. Y., Ewansiha, S. U., and Menkir, A. (2014). Assessment of nitrogen uptake and utilization in drought tolerant and Striga resistant tropical maize varieties. Arch. Agron. Soil Sci. 60, 195–207. doi: 10.1080/03650340.2013.783204
Kamara, A. Y., Menkir, A., Kureh, I., Omoigui, L. O., and Ekeleme, F. (2006). Performance of old and new maize hybrids grown at high plant densities in the tropical Guinea savanna. Int. J. Fac. Agric. Biol. 1, 41–48. doi: 10.1017/S0014479704002479
Kenward, M. G., and Roger, J. H. (1997). Small Sample Inference for Fixed Effects from Restricted Maximum Likelihood. Biometrics 53, 983–997. doi: 10.2307/2533558
Lauer, J. G., and Rankin, M. (2004). Corn response to within row plant spacing variation. Agron. J. 96, 1464. doi: 10.2134/agronj2004.1464
Li, J., Xie, R. Z., Wang, K. R., Ming, B., Guo, Y. Q., Zhang, G. Q., et al. (2015). Variations in maize dry matter, harvest index, and grain yield with plant density. Agron. J. 107, 829–834. doi: 10.2134/agronj14.0522
Liu, W., and Tollenaar, M. (2009). Response of yield heterosis to increasing plant density in maize. Crop Sci. 49, 1807–1816. doi: 10.2135/cropsci2008.07.0422
Malosetti, M., Ribaut, J. M., and van Eeuwijk, F. A. (2013). The statistical analysis of multi-environment data: modeling genotype-by-environment interaction and its genetic basis. Front. Physiol. 4, 44. doi: 10.3389/fphys.2013.00044
Mastrodomenico, A. T., Haegele, J. W., Seebauer, J. R., and Below, F. E. (2018). Yield stability differs in commercial maize hybrids in response to changes in plant density, nitrogen fertility, and environment. Crop Sci. 58, 230–241. doi: 10.2135/cropsci2017.06.0340
Mehlich, A. (1984). Mehlich 3 soil test extractant: a modification of Mehlich 2 extractant. Commun. Soil Sci. Plant Anal. 15, 1409–1416. doi: 10.1080/00103628409367568
Meyer, K. (2009). Factor-analytic models for genotype × environment type problems and structured covariance matrices. Genet. Sel. Evol. 41, 1–11. doi: 10.1186/1297-9686-41-21
Møberg, J. P., and Esu, I. E. (1991). Characteristics and composition of some savanna soils in Nigeria. Geoderma 48, 113–129. doi: 10.1016/0016-7061(91)90011-H
Mokhtarpour, H., Teh, C., Saleh, G., Selamat, A., Asadi, M. E., and Kamkar, B. (2011). Corn yield response to crowding stress and cropping season. Arch. Agron. Soil Sci. 57, 853–871. doi: 10.1080/03650340.2010.499901
NAERLS and FDAE (2017). Agricultural Performance Survey of 2016 Wet Season in Nigeria. Zaria: NAERLS Press.
Ogoshi, R. M., Caguan, B., and Tsuji, G. (1999). “Field and laboratory methods for collection of minimum data sets.,” in DSSAT, Version 3, Vol. 4, eds G. Hoogenboom and G. Y. Tsuji (Honolulu: IBSNAT-ICASA, University of Hawaii), 217–286.
Page, E. R., Cerrudo, D., Westra, P., Loux, M., Smith, K., Foresman, C., et al. (2012). Why early season weed control is important in maize. Weed Sci. 60, 423–430. doi: 10.1614/WS-D-11-00183.1
Piepho, H. P. (1997). “Mixed models with multiplicative terms for cultivar trial data,” in Advances in Biometrical Genetics. Proceedings of the Tenth Meeting of the EUCARPIA Section Biometrics in Plant Breeding, eds P. Krajewski and Z. Kaczmarek (Poznan, Poland: EUCARPIA), 215–220.
Piepho, H. P. (1999). Stability analysis using the SAS system. Agron. J. 91, 154–160. doi: 10.2134/agronj1999.00021962009100010024x
Pretty, J., Toulmin, C., and Williams, S. (2011). Sustainable intensification in African agriculture. Int. J. Agric. Sustain. 9, 5–24. doi: 10.3763/ijas.2010.0583
Ruffo, M. L., Gentry, L. F., Henninger, A. S., Seebauer, J. R., and Below, F. E. (2015). Evaluating management factor contributions to reduce corn yield gaps. Agron. J. 107, 495–505. doi: 10.2134/agronj14.0355
Sangoi, L., Gracietti, M. A., Rampazzo, C., and Bianchetti, P. (2002). Response of Brazilian maize hybrids from different eras to changes in plant density. F. Crop. Res. 79, 39–51. doi: 10.1016/S0378-4290(02)00124-7
Sani, B. M., Oluwasemire, K. O., and Mohammed, H. I. (2008). Effect of irrigation and plant density on the growth, yield and water use efficiency of early maize in the Nigerian Savanna. J. Agric. Biol. Sci. 3, 8.
Sarlangue, T., Andrade, F. H., Calviño, P. A., and Purcell, L. C. (2007). Why do maize hybrids respond differently to variations in plant density? Agron. J. 99, 984. doi: 10.2134/agronj2006.0205
Shehu, B. M., Merckx, R., Jibrin, J. M., Kamara, A. Y., and Rurinda, J. (2018). Quantifying variability in maize yield response to nutrient applications in the Northern Nigerian Savanna. Agronomy 8, 18. doi: 10.3390/agronomy8020018
Smith, A., Cullis, B., and Thompson, R. (2001). Analyzing variety by environment data using multiplicative mixed models and adjustments for spatial field trend. Biometrics 57, 1138–1147. doi: 10.1111/j.0006-341X.2001.01138.x
Smith, A. B., Ganesalingam, A., Kuchel, H., and Cullis, B. R. (2015). Factor analytic mixed models for the provision of grower information from national crop variety testing programs. Theor. Appl. Genet. 128, 55–72. doi: 10.1007/s00122-014-2412-x
Spilke, J., Piepho, H. P., and Hu, X. (2005). Analysis of unbalanced data by mixed linear models using the MIXED procedure of the SAS system. J. Agron. Crop Sci. 191, 47–54. doi: 10.1111/j.1439-037X.2004.00120.x
Tang, L., Ma, W., Noor, M. A., Li, L., Hou, H., Zhang, X., et al. (2018). Density resistance evaluation of maize varieties through new “Density–Yield Model” and quantification of varietal response to gradual planting density pressure. Sci. Rep. 8, 1–16. doi: 10.1038/s41598-018-35275-w
Thompson, R., and Resende, M. (2004). Factor analytic multiplicative mixed models in the analysis of multiple experiments. Rev. Mat. e Estat., 31–52.
Tokatlidis, I. S., and Koutroubas, S. D. (2004). A review of maize hybrids' dependence on high plant populations and its implications for crop yield stability. F. Crop. Res. 88, 103–114. doi: 10.1016/j.fcr.2003.11.013
Tollenaar, M., Deen, W., Echarte, L., and Liu, W. (2006). Effect of crowding stress on dry matter accumulation and harvest index in maize. Agron. J. 98, 930. doi: 10.2134/agronj2005.0336
Tollenaar, M., Dibo, A. A., Aguilera, A., Weise, S. F., and Swanton, C. J. (1994). Effect of crop density on weed interference in maize. Agron. J. 86, 591–595. doi: 10.2134/agronj1994.00021962008600040003x
Tollenaar, M., and Lee, E. A. (2002). Yield potential, yield stability and stress tolerance in maize. F. Crop. Res. 75, 161–169. doi: 10.1016/S0378-4290(02)00024-2
van Roekel, R. J., and Coulter, J. A. (2011). Agronomic responses of corn to planting date and plant density. Agron. J. 103, 1414–1422. doi: 10.2134/agronj2011.0071
Keywords: sowing density, environmental index, crowding tolerance, Factor Analytic Model, row spacing
Citation: Adnan AA, Diels J, Jibrin JM, Kamara AY, Craufurd P, Shaibu AS and Garba II (2022) Optimum Stand Density of Tropical Maize Varieties: An On-farm Evaluation of Grain Yield Responses in the Nigerian Savanna. Front. Agron. 4:773012. doi: 10.3389/fagro.2022.773012
Received: 09 September 2021; Accepted: 28 February 2022;
Published: 24 March 2022.
Edited by:
Eric Scopel, Agroecology and Sustainable Intensification of Annual Crops (AIDA) Research Unit, FranceReviewed by:
Amir Sadeghpour, Southern Illinois University Carbondale, United StatesChristophe Naudin, Groupe Ecole Supérieure d'Agriculture d'Angers, France
Copyright © 2022 Adnan, Diels, Jibrin, Kamara, Craufurd, Shaibu and Garba. This is an open-access article distributed under the terms of the Creative Commons Attribution License (CC BY). The use, distribution or reproduction in other forums is permitted, provided the original author(s) and the copyright owner(s) are credited and that the original publication in this journal is cited, in accordance with accepted academic practice. No use, distribution or reproduction is permitted which does not comply with these terms.
*Correspondence: Ismail Ibrahim Garba, aS5nYXJiYUB1cS5lZHUuYXU=