 Katrin Ahrens
 Andreas Herbst
 Jens Karl Wegener
- Institute for Application Techniques in Plant Protection, Julius Kuehn Institute (JKI), Braunschweig, Germany
Unmanned aerial spraying systems (UASS, hereafter ‘drones’) are increasingly deployed for pesticide application, yet field evidence on spray drift—particularly for rotary atomizers (RAT)—remains limited. We conducted ISO 22866 drift trials over short grass using two drones: a DJI Agras T30 fitted with air-induction nozzles (AIN) and a DJI Agras T25 fitted with rotary atomizers. Droplet-size spectra were determined in accordance with ISO 25358 for AIN and via an adapted scanning procedure for RAT. Target application rate was ~75 L ha-¹ at a working width of 4 m, flight heights of 1.5–3.0 m, and flight speeds of 2.5–4.5 m s-¹. Drift sediment was sampled 3–20 m downwind and expressed as a percentage of the application rate. Quantile regression (τ = 0.5, 0.9) on log-transformed sediment tested effects of distance, flight height, flight speed, atomizer type, and their interactions. Distance, flight height, atomizer type, and atomizer-specific interactions with flight speed and flight height were significant for the median response. RAT tended to produce higher drift under more extreme operating settings; however, at practical settings (2 m height, 2.5 m s-¹ speed) RAT drift was equal to or lower than AIN, with only small and distance-specific median differences. These findings indicate that atomizer choice and operating envelope jointly determine UASS drift. We discuss safe operating windows, limitations of RAT droplet sizing relative to ISO 25358, and provide open data and code to support meta-analysis and modeling.
1 Introduction
Spray drones, also called Unmanned Aerial Spraying Systems (UASS), have been increasingly used worldwide for the application of plant protection products (PPPs). Until recently in Germany this is limited to chemical application in steep slope trial fields according to European (EU, 2009) and German (DE, 2012) legislation.
When PPPs are applied, spray drift is one of the major hazards for non-target organisms downwind from the treated areas. Herbst et al. (2023) could show that spray drift from drone applications in trial fields does not exceed existing basic drift values for ground sprayers (BBA, 2000; BVL 2020) providing that the UASS is equipped with air-induction nozzles (AIN).
Novel UASSs equipped with rotary atomizers (RAT) were introduced into the market recently. In contrast to conventional nozzles providing hydraulic atomization, these atomizers produce droplets by centrifugal force of a spinning disk with a toothed edge. Droplet-size is determined by size and shape of the teeth, the rotational frequency of the disk and the liquid volume rate applied. The concept of these atomizers is known for many years but the utilization for chemical application is very limited in general. This is why it is very difficult to find theoretical basics as well as experimental data describing the droplet formation from RAT. In general, it is assumed that RATs would produce more uniform droplet-size spectra compared to hydraulic nozzles. Another, more obvious difference is that RATs that are mounted on a drone with a vertical rotary axis would eject the spray in horizontal orientation while hydraulic nozzles spray downwards. In combination with the downwash of the drone fans, this would result in different droplet trajectories and finally different spray distribution and spray drift potential.
An OECD study (OECD, 2021) states that reliable spray drift data from UASSs are hardly available worldwide. It does not mention any data from RATs.
Several recent studies have specifically compared the behavior of rotary atomizers and hydraulic nozzles. Wang et al. (2023) conducted wind tunnel tests in which rotary atomizers and flat fan nozzles were tested under identical conditions. Even with comparable median droplet-sizes (DV50), it was found that RATs caused significantly higher drift: In 3.5 m s-¹ wind, the cumulative drift percentage at a distance of 2 m was 90.1% for the rotary atomizer compared to 40.6% for the hydraulic nozzle. The cause is identified as the horizontal discharge direction and the lack of a downward component of the droplet movement in RAT. At low rpm, a higher DV50 is produced. Here, the cumulative drift percentage does not differ significantly from the fine-droplet nozzles. Similar trends are confirmed by field trials in which drones with RAT showed increased drift compared to (AIN), especially under unfavorable parameters such as high flight height or high flight speed.
Ranabhat and Price (2025) show in field studies that rotary atomizers on drones produce particularly fine and uniform droplets, which is advantageous for good coverage at low spray volumes, but at the same time increases drift. Hydraulic nozzles, on the other hand, produce coarser droplets with better penetration depth but less uniformity.
In addition, there are studies that examine drones with RAT without direct comparison to AIN. Yang et al. (2023) optimize the rotation speed, flow rate, number of teeth and tooth shape of rotary atomizers in a wind tunnel. With the optimized atomizer, the influence of rotation speed, flow rate and flight height on the effective swath width was investigated. Wang et al. (2020) and Butler-Ellis et al. (2025) investigated the spray drift of drones with rotary atomizers using UASS from XAG. Wang reports the influence of droplet-size on drift and emphasized the effect of wind speed and droplet-size on downwind drift. Martin et al. (2025) also came to this conclusion in a study with UASS with AIN.
Review articles (Chen et al., 2022) emphasize that UASS – regardless of the nozzle system – fundamentally carry an increased risk of drift due to their mode of operation (flight-height, multi-rotor downwash, low spray volumes). This risk is particularly pronounced for RAT, as they can produce very fine droplet spectra.
The aim of this study was to compare spray drift from UASSs equipped with AINs and RATs in a field test. This should help to clarify whether the German authorization of PPPs for application using AINs is also valid for the use of RATs. The variation of application parameters in this study should help to obtain results with sufficient practical relevance for a reasonable range of conditions. It was not possible to equip the same drone with both atomizer types but the influence of the drone design on spray drift was minimized by selecting drone models similar in size and weight. The comparison should be focused as much as possible on the differences between the atomizer types for the same application parameters, like application rate, flight speed and flight height, and for similar droplet-size spectra.
The tests were conducted on a flat, grass-covered field. It is assumed that the relative differences between the atomizer types are similar for different cropping scenarios, such as vineyards or arable crops. Using this approach, it is also possible to compare the results with existing spray drift data from horizontal boom sprayers or other sprayers.
Measurements of lateral spray distribution in the target area were also collected to examine potential differences between the atomizer types; however, their evaluation lies outside the scope of this manuscript.
2 Material and methods
A spray drift study according to ISO 22866 (ISO, 2005) was conducted with two different UASS models (Figure 1): a DJI Agras T25 equipped with two RAT and a DJI Agras T30 fitted with twelve Agrotop Airmix 110°flat fan air-induction nozzles (see Table 1).
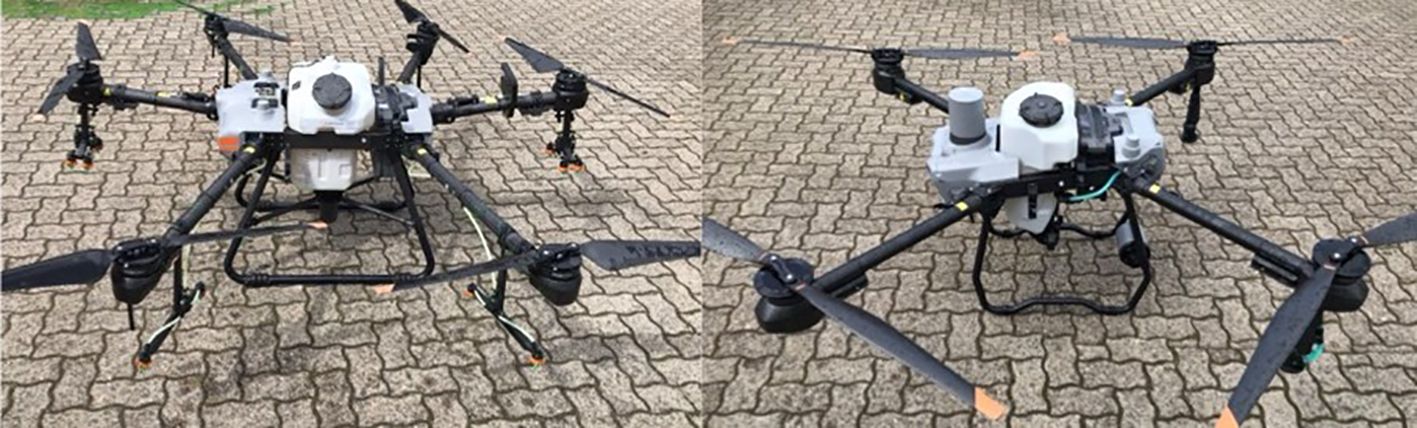
Figure 1. Experimental drones used in this study: DJI Agras T30 (max. take-off mass 66.5 kg, max. payload 30 kg) equipped with air-induction nozzles (AIN, left) and DJI Agras T25 (52 kg, 20 kg) equipped with rotary atomizers (RAT, right). Alt text: Two agricultural drones side by side: the DJI Agras T30 equipped with downward-facing air-induction nozzles, and the DJI Agras T25 equipped with horizontal spraying rotary atomizers.
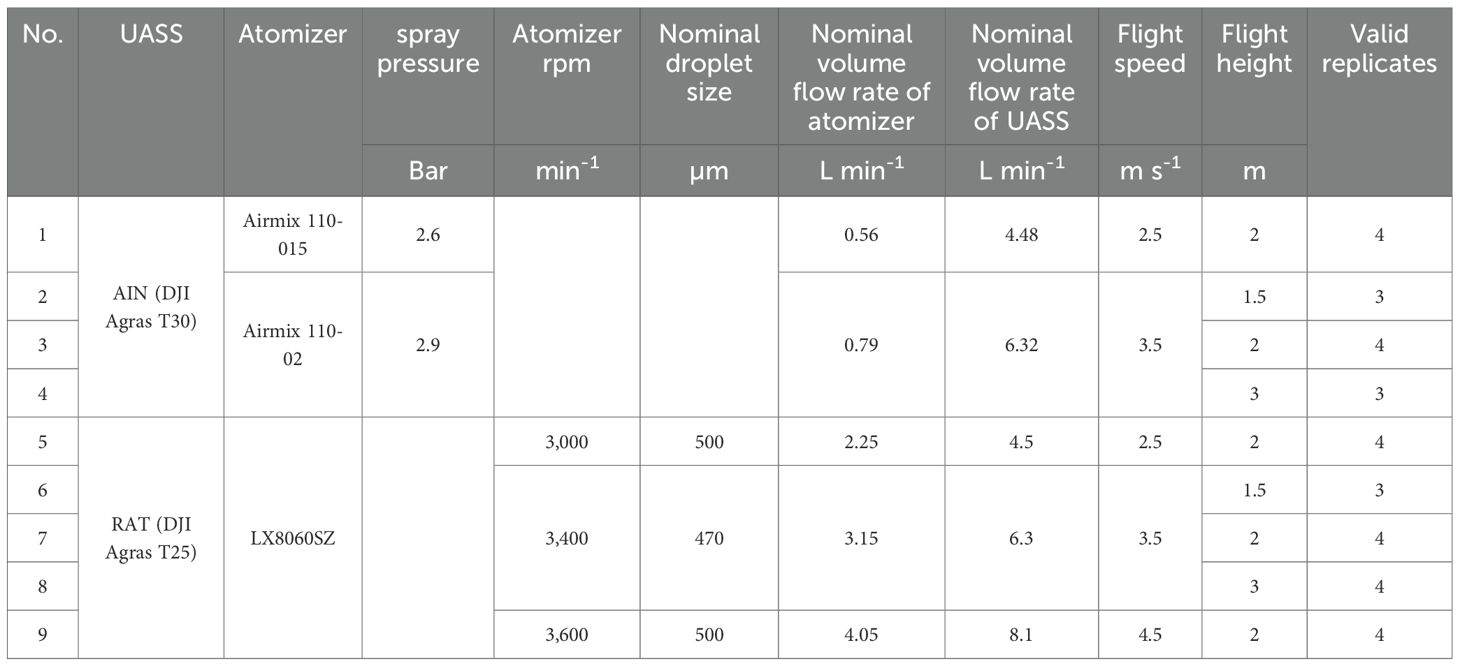
Table 1. Tested UASS variants and application parameters, including atomizer type, spray pressure (AIN), atomizer rpm (RAT), nominal droplet size (RAT), flow rates, flight speed and height, and number of valid replicates.
Prior to the drift tests, it was necessary to measure the droplet-size spectra from the atomizers used. This was conducted according to ISO 25358 (ISO, 2018) for the AIN. RAT are not in the scope of this standard and due to its working principle and the conditions in the JKI droplet sizing lab it was not possible to cover the entire footprint of the RAT spray. As the spray from RAT is initially rotating, it is also not necessary to scan the whole footprint of the spray. Positioning the RAT relative to the droplet sizing system, in our case the VisiSizer (Oxford Lasers), and moving the RAT vertically with steps of 10 mm across the spray fan as shown in Figure 2, this ensured that the droplet sampling was representative for the whole RAT spray fan. After measuring the droplets at each vertical position, the data were subsequently merged to obtain the volumetric 50th percentile of droplet diameter (DV50), the corresponding droplet-size class according to ISO 25358 as well as the fraction of the spray volume with a diameter < 100 µm (V100) for the whole spray fan. The adapted RAT procedure was checked for internal repeatability across rpm settings.
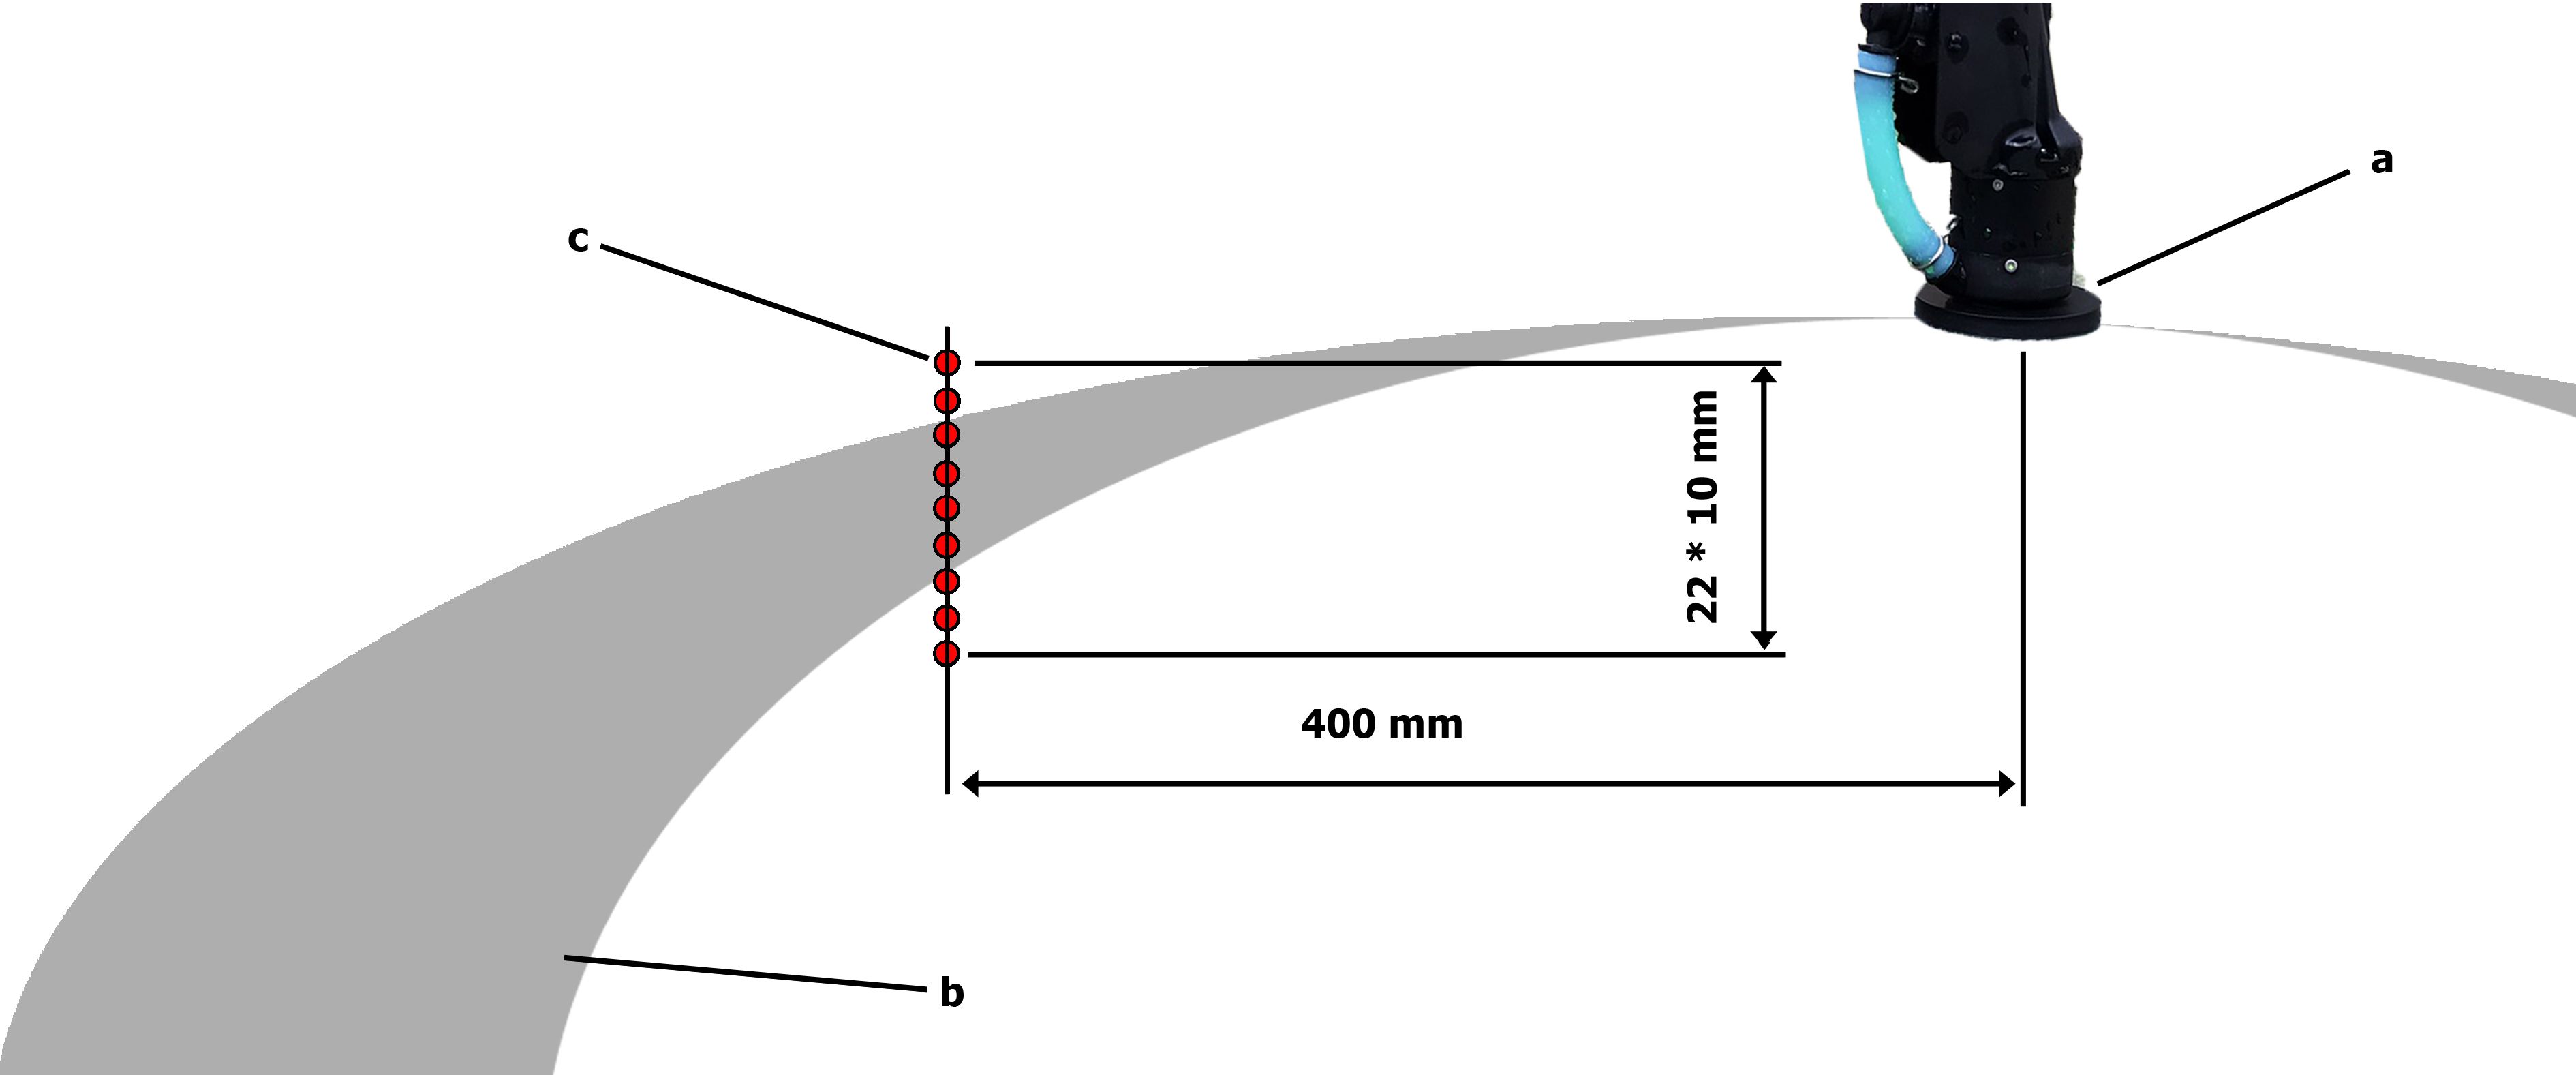
Figure 2. Setup for droplet-size measurements of the rotary atomizer (RAT), showing atomizer (a), spray fan (b), and vertical measurement points (c). Alt text: Graphical illustration of the rotary atomizer test setup with the atomizer generating a spray fan and multiple measurement points marked vertically across the fan.
The spray drift test site was a level field located at the experimental farm of the Julius Kuehn Institute near Sickte, southeast of Braunschweig (52°12’09.7” N; 10°36’21.9” E). The field surface was covered with short grass trimmed to a maximum height of 10 cm (Figure 3). ISO 22866 specifies that spray drift measurements must be performed outdoors under typical field conditions or over a defined surface including grass turf. Therefore, the trials were conducted over short, homogeneous grass to avoid canopy interception and to ensure compliance with the standard. The homogeneous grass surface ensured that no crop canopy, row structure, or plant interception influenced the drift measurements, so that all downwind sediment originated solely from the UASS application.
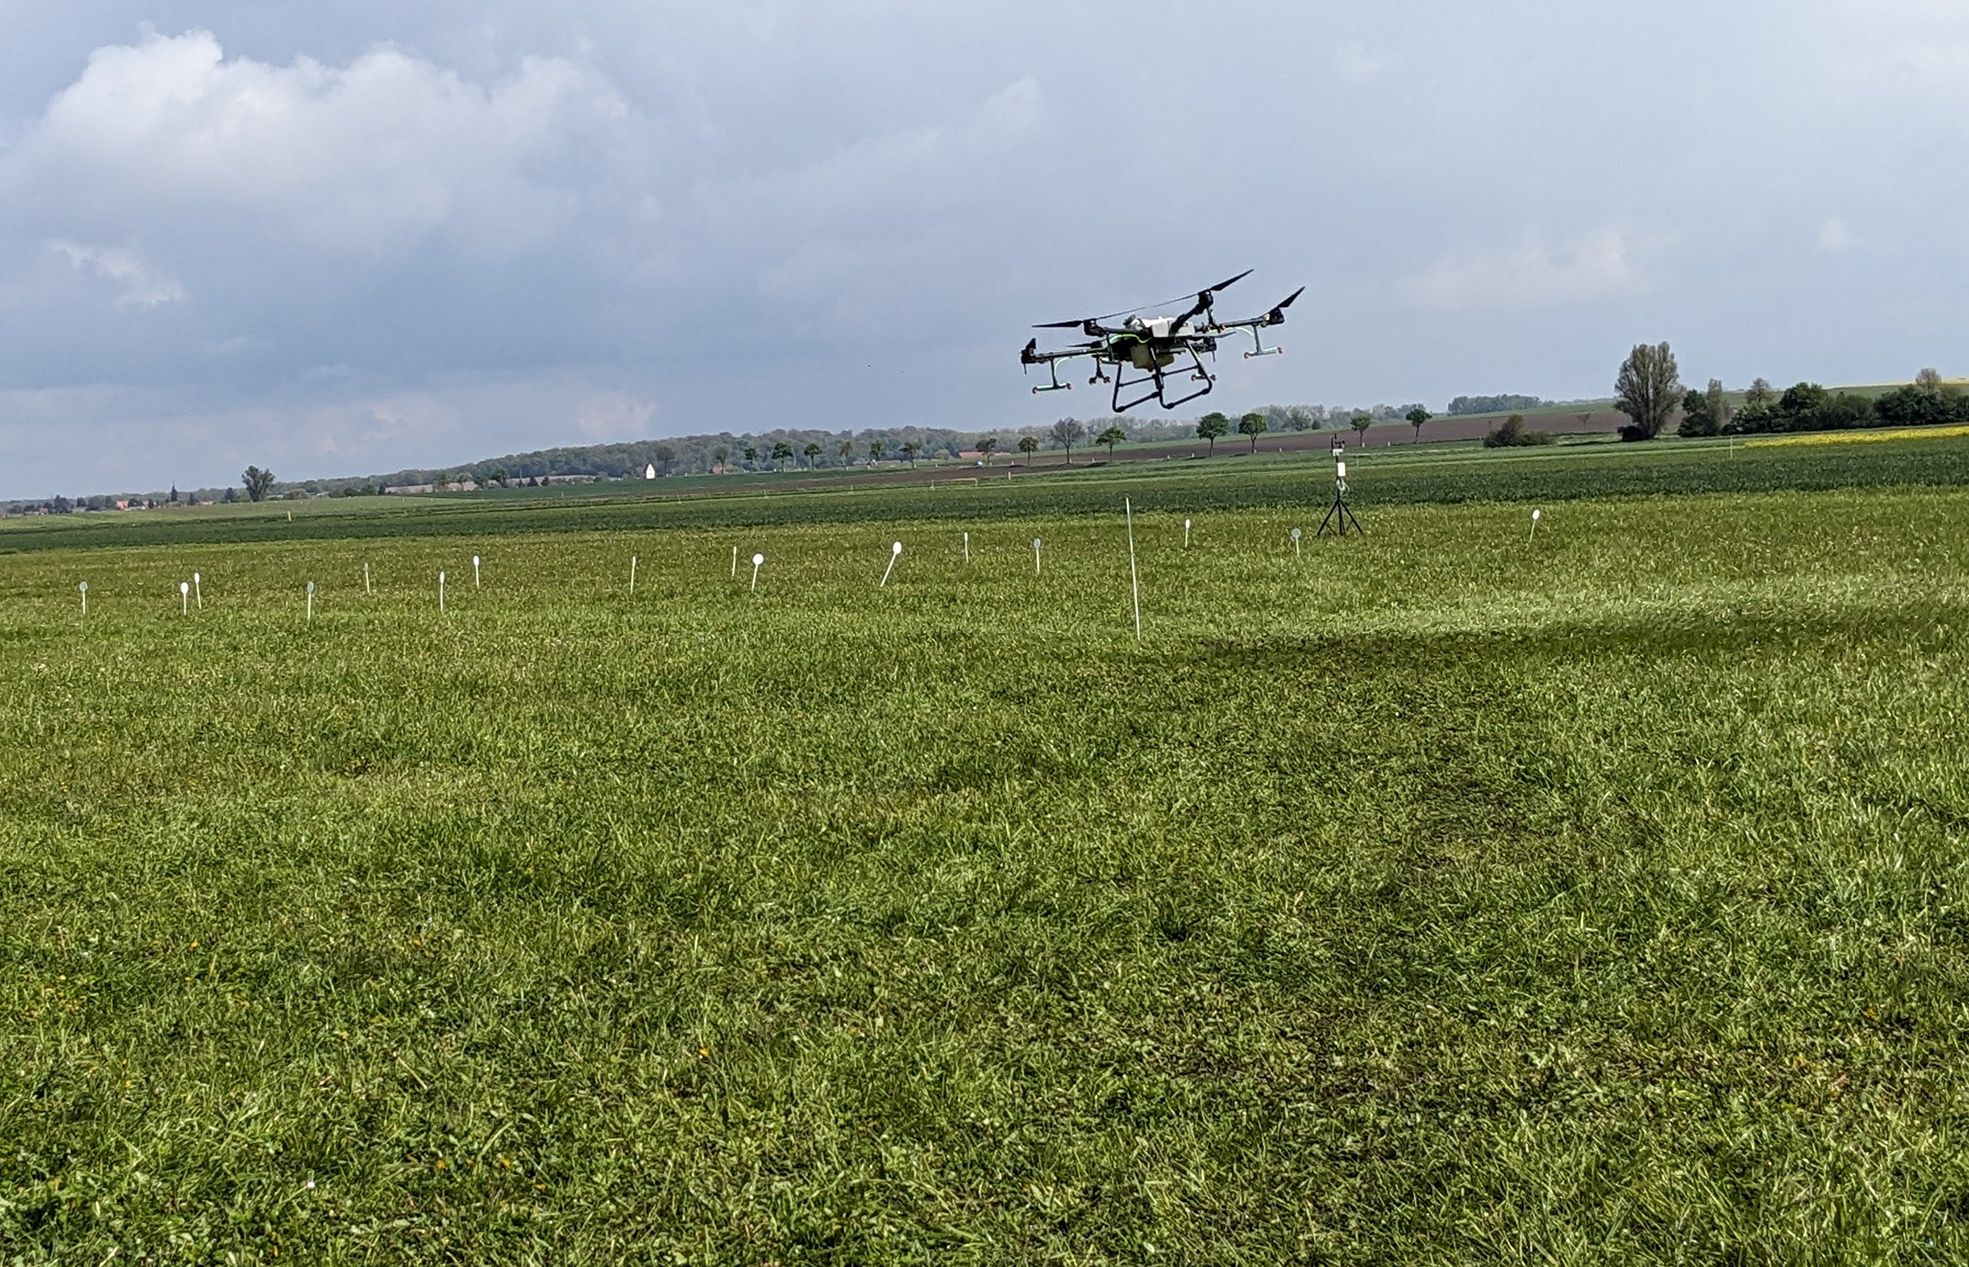
Figure 3. Field test site with DJI Agras T30 (AIN) in operation; short grass field in foreground, weather station and sampling collectors in background. Alt text: Photo of the DJI Agras T30 spraying over a short grass field, with the weather station and sampling collectors visible in the background. The markings for the different distances can be seen.
Spray pressure and flight speed were adjusted to obtain an application rate of approximately 75 L ha-1 assuming a working width of 4 m for both UASSs. The application rate of 75 L ha-1 was chosen in order to make the tests comparable with previous drone tests (Herbst et al., 2023). In addition, an application rate of 75 L ha-¹ represents the minimum application rate permitted by the German plant protection authorization authority (BVL) for PPP use in steep-slope vineyards. During the application, the time needed to fly along the lines was manually measured to check the speed. The complete UASSs were weighed before and after the tests to determine the volume of spray liquid applied and to calculate the actual application rate for each test considering the set working width and flight speed (Table 1). The set flight height varied from 1.5 m to 3 m above ground level. Compliance with the set height was checked occasionally using a measuring stick. Whereas the nozzle arrangement of the DJI Agras T30 drone with AIN allowed to fly forward and backwards without turning around when the flight direction was reversed, the DJI Agras T25 equipped with two rear mounted RAT had to rotate by 180° when turning.
The drones were operated in automatic mode during the tests along pre-defined flight lines at pre-set height and speed, using GPS navigation with a manual correction from a reference point at the test site. The positioning error was in the range of 10 cm.
Rows of ground collectors each consisting of 10 Petri dishes (greiner bio-one, ref. 6391102, 145 mm in diameter) were spaced 1 m apart at downwind distances of 3 m, 5 m, 10 m, 15 m, and 20 m from the edge of the field. The collectors were arranged on metal planks in the longitudinal center of the treated area to capture drift sediment. The drift sampling distances were referenced to a virtual field edge located half a swath width downwind from the first flight line. (Figure 4).
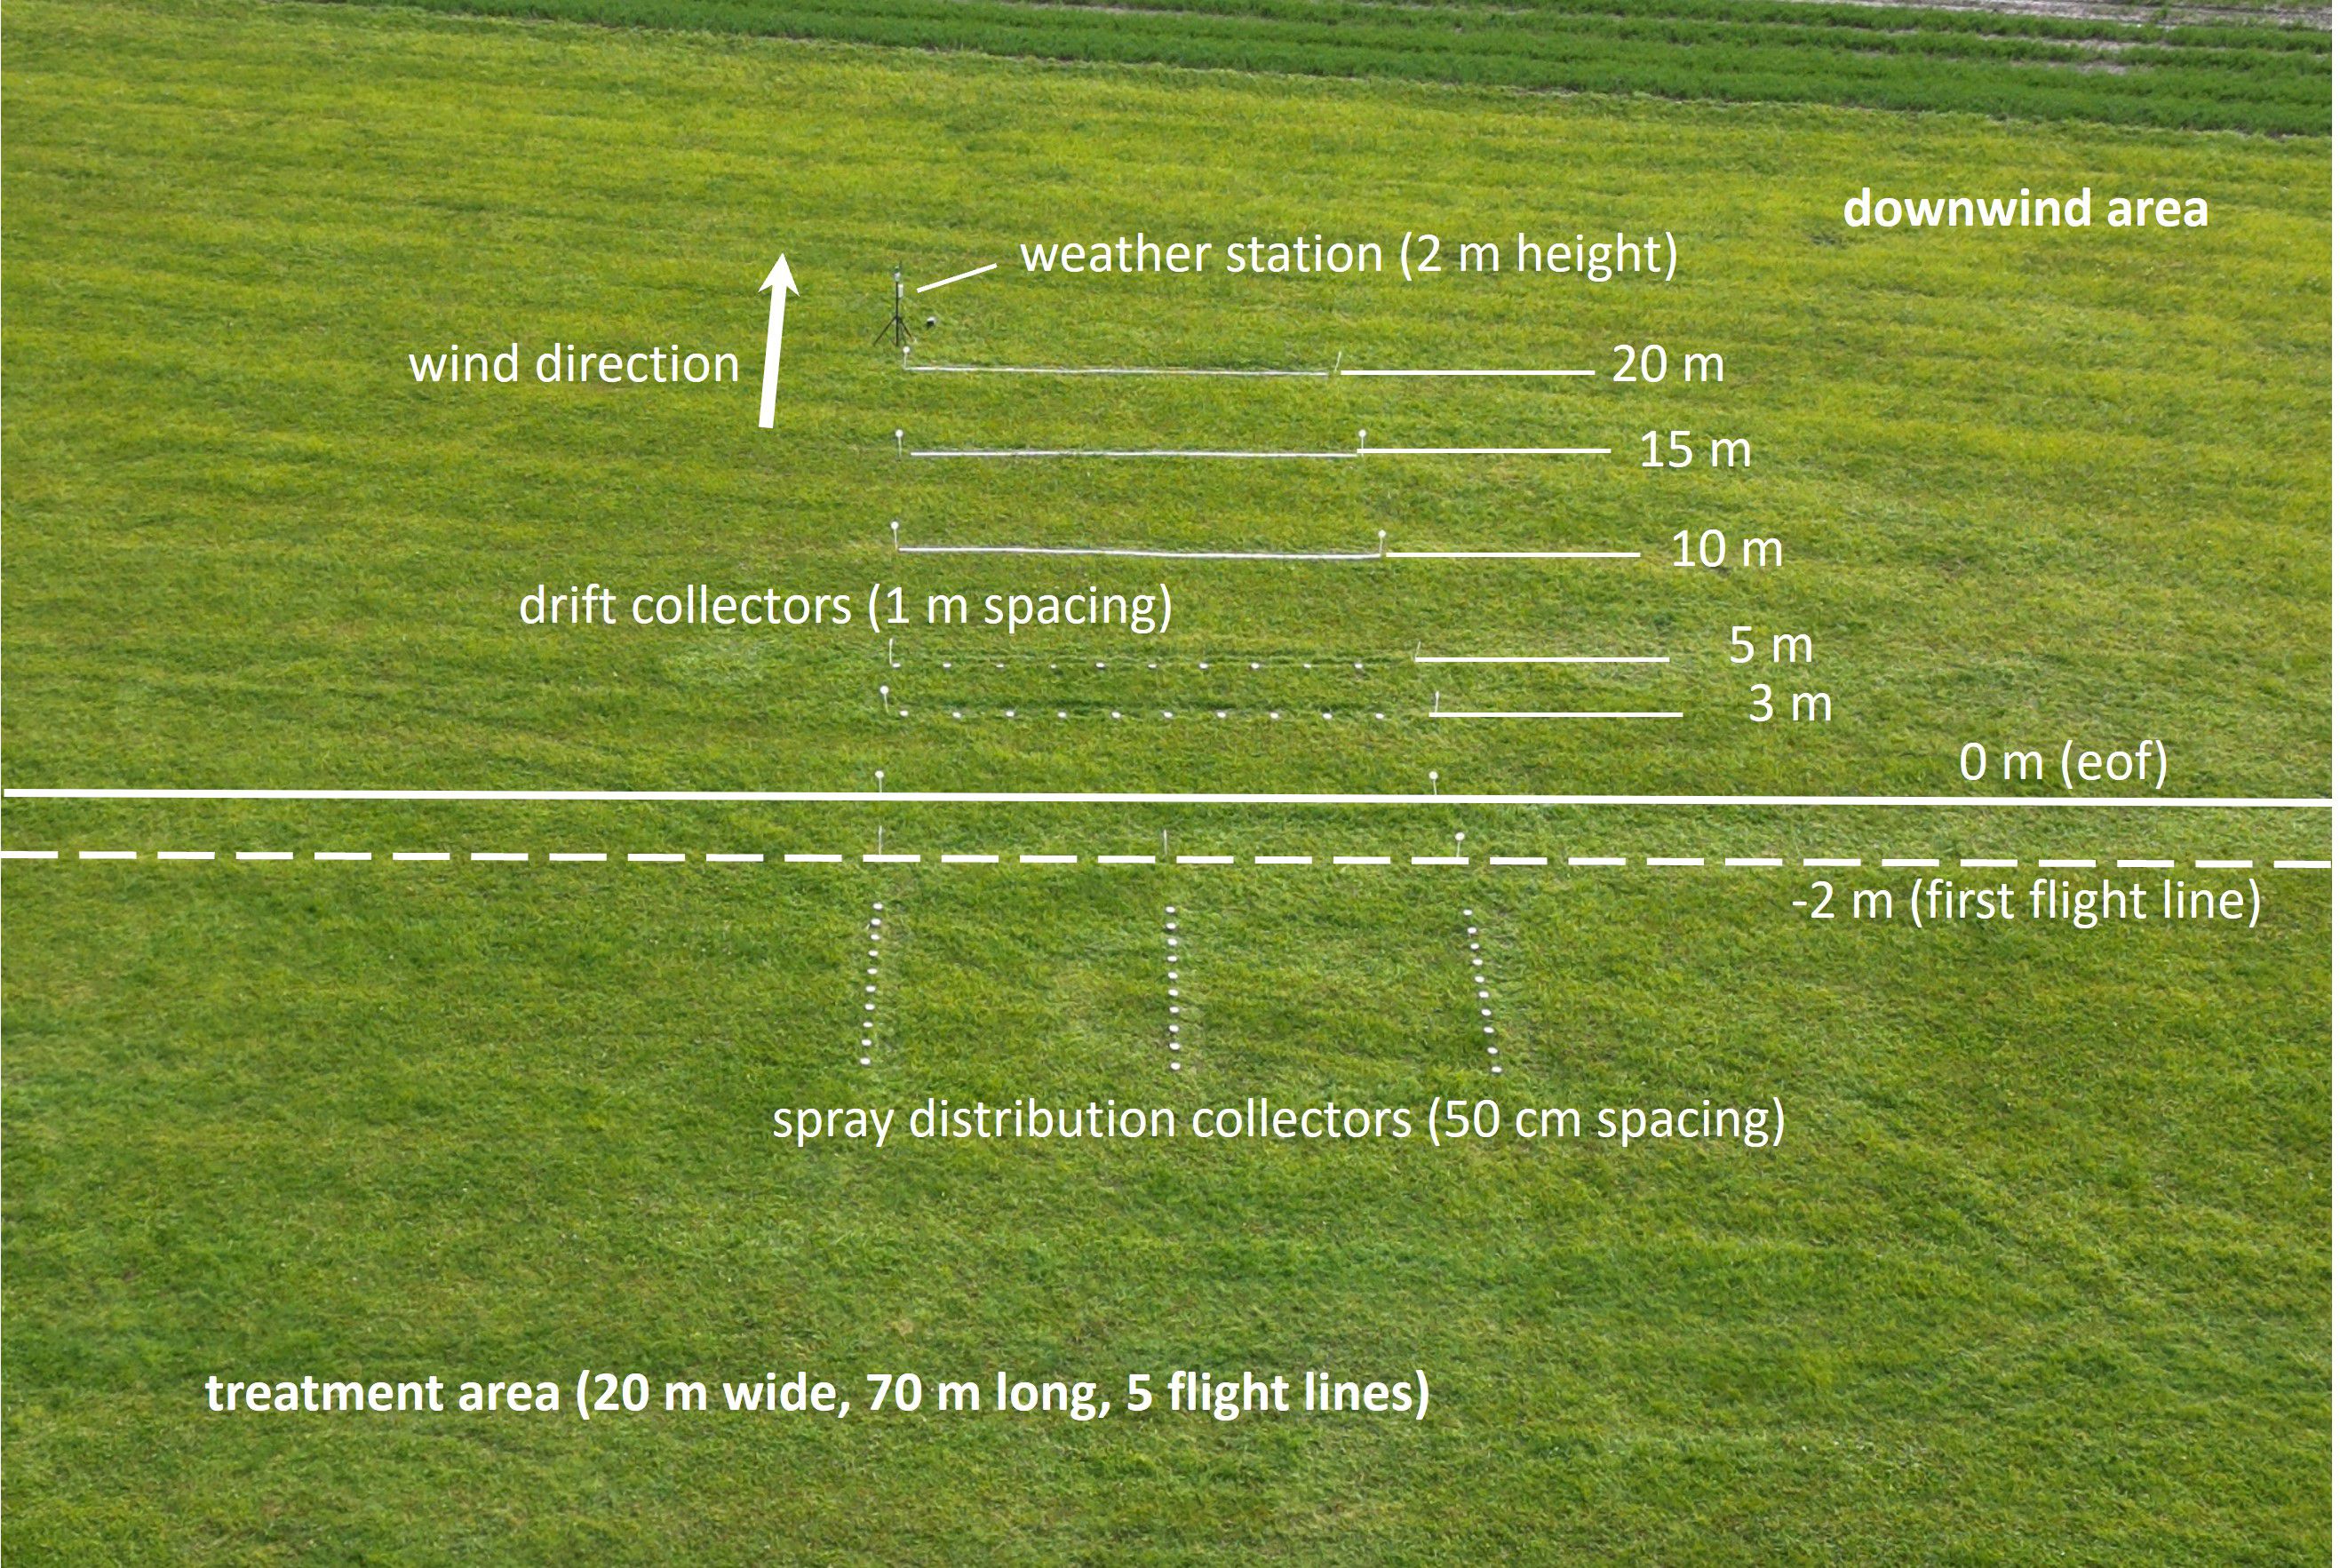
Figure 4. Experimental arrangement for drift and spray distribution measurements according to ISO 22866, with treatment area, spray distribution collectors, and drift collectors placed 3–20 m downwind.Alt text: Schematic diagram of the drift experiment layout, including the treatment area, parallel lines of spray distribution collectors, and drift collectors positioned at increasing downwind distances.
Other sets of the same collectors were placed on the target area of the treatments to determine the lateral spray distribution, also shown in Figure 4. The Petri dishes on the target area and at the 3 m and 5 m spray drift sampling lines were equipped with a steel foil at the underside and fixed to magnetic stands to prevent displacement by rotor downwash. All other Petri dishes were placed directly on planks.
All tests were conducted at least four times. The 4.5 m s-¹ flight-speed variant could not be realized with the AIN because the DJI Agras T30 could not maintain the required flow rate to reach 75 L ha-¹ at this speed (pump and pressure limitations); therefore, this variant was excluded.
Weather data—including wind speed, wind direction, air temperature, and relative humidity—were recorded using a WENTO-Ind weather station (Lambrecht Meteo GmbH) equipped with a cup anemometer, a wind vane, and a shielded temperature–humidity sensor. The station was installed in the longitudinal center approximately 20 m downwind from the treatment area at 2 m above ground level and sampled at 1 Hz.
According to ISO 22866, the wind speed should be greater than 1 m s-1, with a maximum of 10% of the values below this value. The wind direction should deviate by a maximum of 30°from the perpendicular of the spray track on average, and no more than 30% of the values should have a deviation greater than 45°. The temperature should be between 5 and 35°C. Replicates exceeding any ISO 22866 acceptance criterion were excluded from statistical analysis. Thus, all statistical analyses are based exclusively on ISO-compliant replicates.
The spray liquid was water with Pyranin 120% (Lanxess) as tracer dye with a concentration of 3 g L-1. All samplers were collected within less than 10 min after each test and stored in a box protected from light exposure to minimize the influence of ambient UV light on the stability of the tracer dye. Considering a time for each treatment of 7 min at most, the total exposure time of the Petri dishes to sunlight could have caused a maximum decay of fluorescence for pyranine of about 5% (Herbst and Wygoda, 2006; Ehmke et al., 2023).
In total 2,400 Petri dishes were stored in a dark, cool room and analyzed within two months after the tests. Tests conducted by Ehmke et al. (2024) with the fluorescent dye pyranine showed, that it can be stored without decay for a longer period. For analysis, the tracer was extracted from the Petri dishes using 40 mL of de-ionized water and shaking the Petri dishes for 10 min on a rotating table at 65 rpm. These samples were analyzed with a fluorometer (RF-6000, Shimadzu, Duisburg) to determine the mass of pyranine recovered on each Petri dish. For measurement, a calibration curve was prepared from defined dilutions of a pyranine stock solution in de-ionized water, following the JKI Guideline 7-1.5 (JKI, 2021). Fluorescence readings from the Petri-dish samples and from spray-tank samples taken several times per day from a nozzle or atomizer of the UASS were first converted into tracer mass using this calibration curve. The tank samples were then used as a reference to adjust the calculated tracer mass on all Petri dishes to the actual tracer concentration in the spray tank. The sediment (Equation 1) on each drift collector was calculated as:
where.
m is the tracer mass sedimented on the sampler (µg).
is the application rate expressed as tracer mass per unit area (µg cm−2), and.
is the collector area (cm²).
The result is expressed as a percentage of the application rate.
A statistical evaluation was conducted to compute the 50th and 90th percentiles of the sediment values for each downwind distance and test variant. These percentiles were used to summarize and visualize downwind drift curves for the two atomizer types. For context, basic drift values from the German authorization scheme (Rautmann et al., 2001) were added to the figures as reference lines (50th and 90th percentiles); they were not used for statistical inference.
Downwind drift sediment was further analyzed using quantile regression at τ = 0.5 (median) and τ = 0.9 (90th percentile). The response was log-transformed drift sediment. Model comparison and selection were based on Akaike’s Information Criterion (AIC) and a permutation-based analysis of deviance (1,000 permutations). Standard errors were obtained by bootstrapping (10,000 x–y pair resamples clustered by experimental replicate). Unlike mean regression, quantile regression estimates conditional quantiles (e.g., the median and the 90th percentile), which is robust to skewness and outliers and better captures the upper tail of drift (e.g., Supplementary Data Sheet 2).
Because drift sediment data were right-skewed and heteroscedastic, median sediment values between atomizer types were additionally tested at each downwind distance using a non-parametric median test.
All data analyses were performed in R (R Core Team, 2024) using the following packages: ggplot2 (Wickham, 2016) and ggh4x (van den Brand, 2024) for visualization, dplyr (Wickham et al., 2023) and tidyr (Wickham et al., 2024) for data manipulation, readxl (Wickham and Bryan, 2023) and openxlsx (Schauberger and Walker, 2024) for Excel import/export, plyr (Wickham, 2020) for data summarization, quantreg (Koenker, 2024) for quantile regression, broom (Robinson et al., 2024) for tidying model outputs, and agricolae for median test (de Mendiburu, 2023). All R scripts used for data processing, statistical analysis, and figure generation are provided in the Supplementary Material.
3 Results
The droplet-size measurements for the atomizer settings used in the drift tests are summarized in Table 2. Although the study was designed to use comparable droplet-size spectra for both atomizer types, perfect matching could not be achieved. The selected AIN were the smallest reasonable size to reach the intended application rate at the chosen operating parameters; they still produced coarser droplets than the RAT operated at its maximum droplet-size setting. Thus, identical droplet-size classes could not be attained.
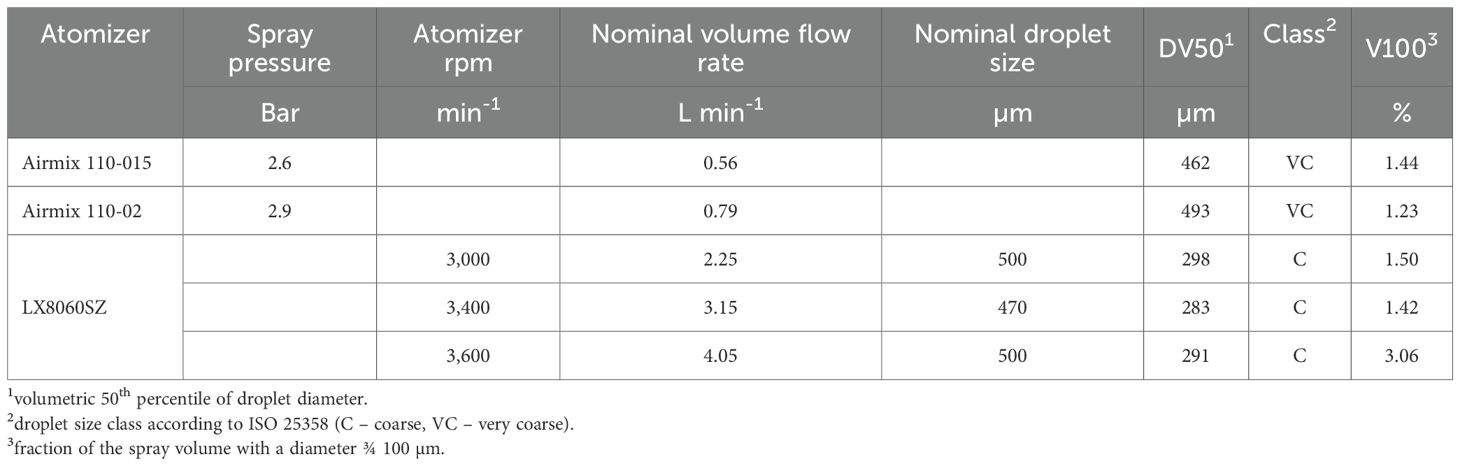
Table 2. Droplet-size measurement results for the atomizers and settings used in field tests, including DV50, droplet-size class, and fraction of spray volume <100 µm (V100).
Meteorological conditions for all field tests are provided in Table 3. Acceptance criteria for valid drift measurements were defined according to ISO 22866. Two tests exhibited minor deviations in mean wind direction (replicate 4 of variant 3: −33.2°; replicate 4 of variant 4: +33.4°); these replicates are marked with an asterisk (*) and were excluded from statistical analysis. Four replicates marked with a double asterisk (**) exceeded ISO acceptance limits and were excluded. After filtering, each test variant retained at least three valid replicates (see Table 1). Air temperature ranged from 5–10 °C and relative humidity from 52–82%. All statistical analyses were performed exclusively on ISO-compliant replicates.
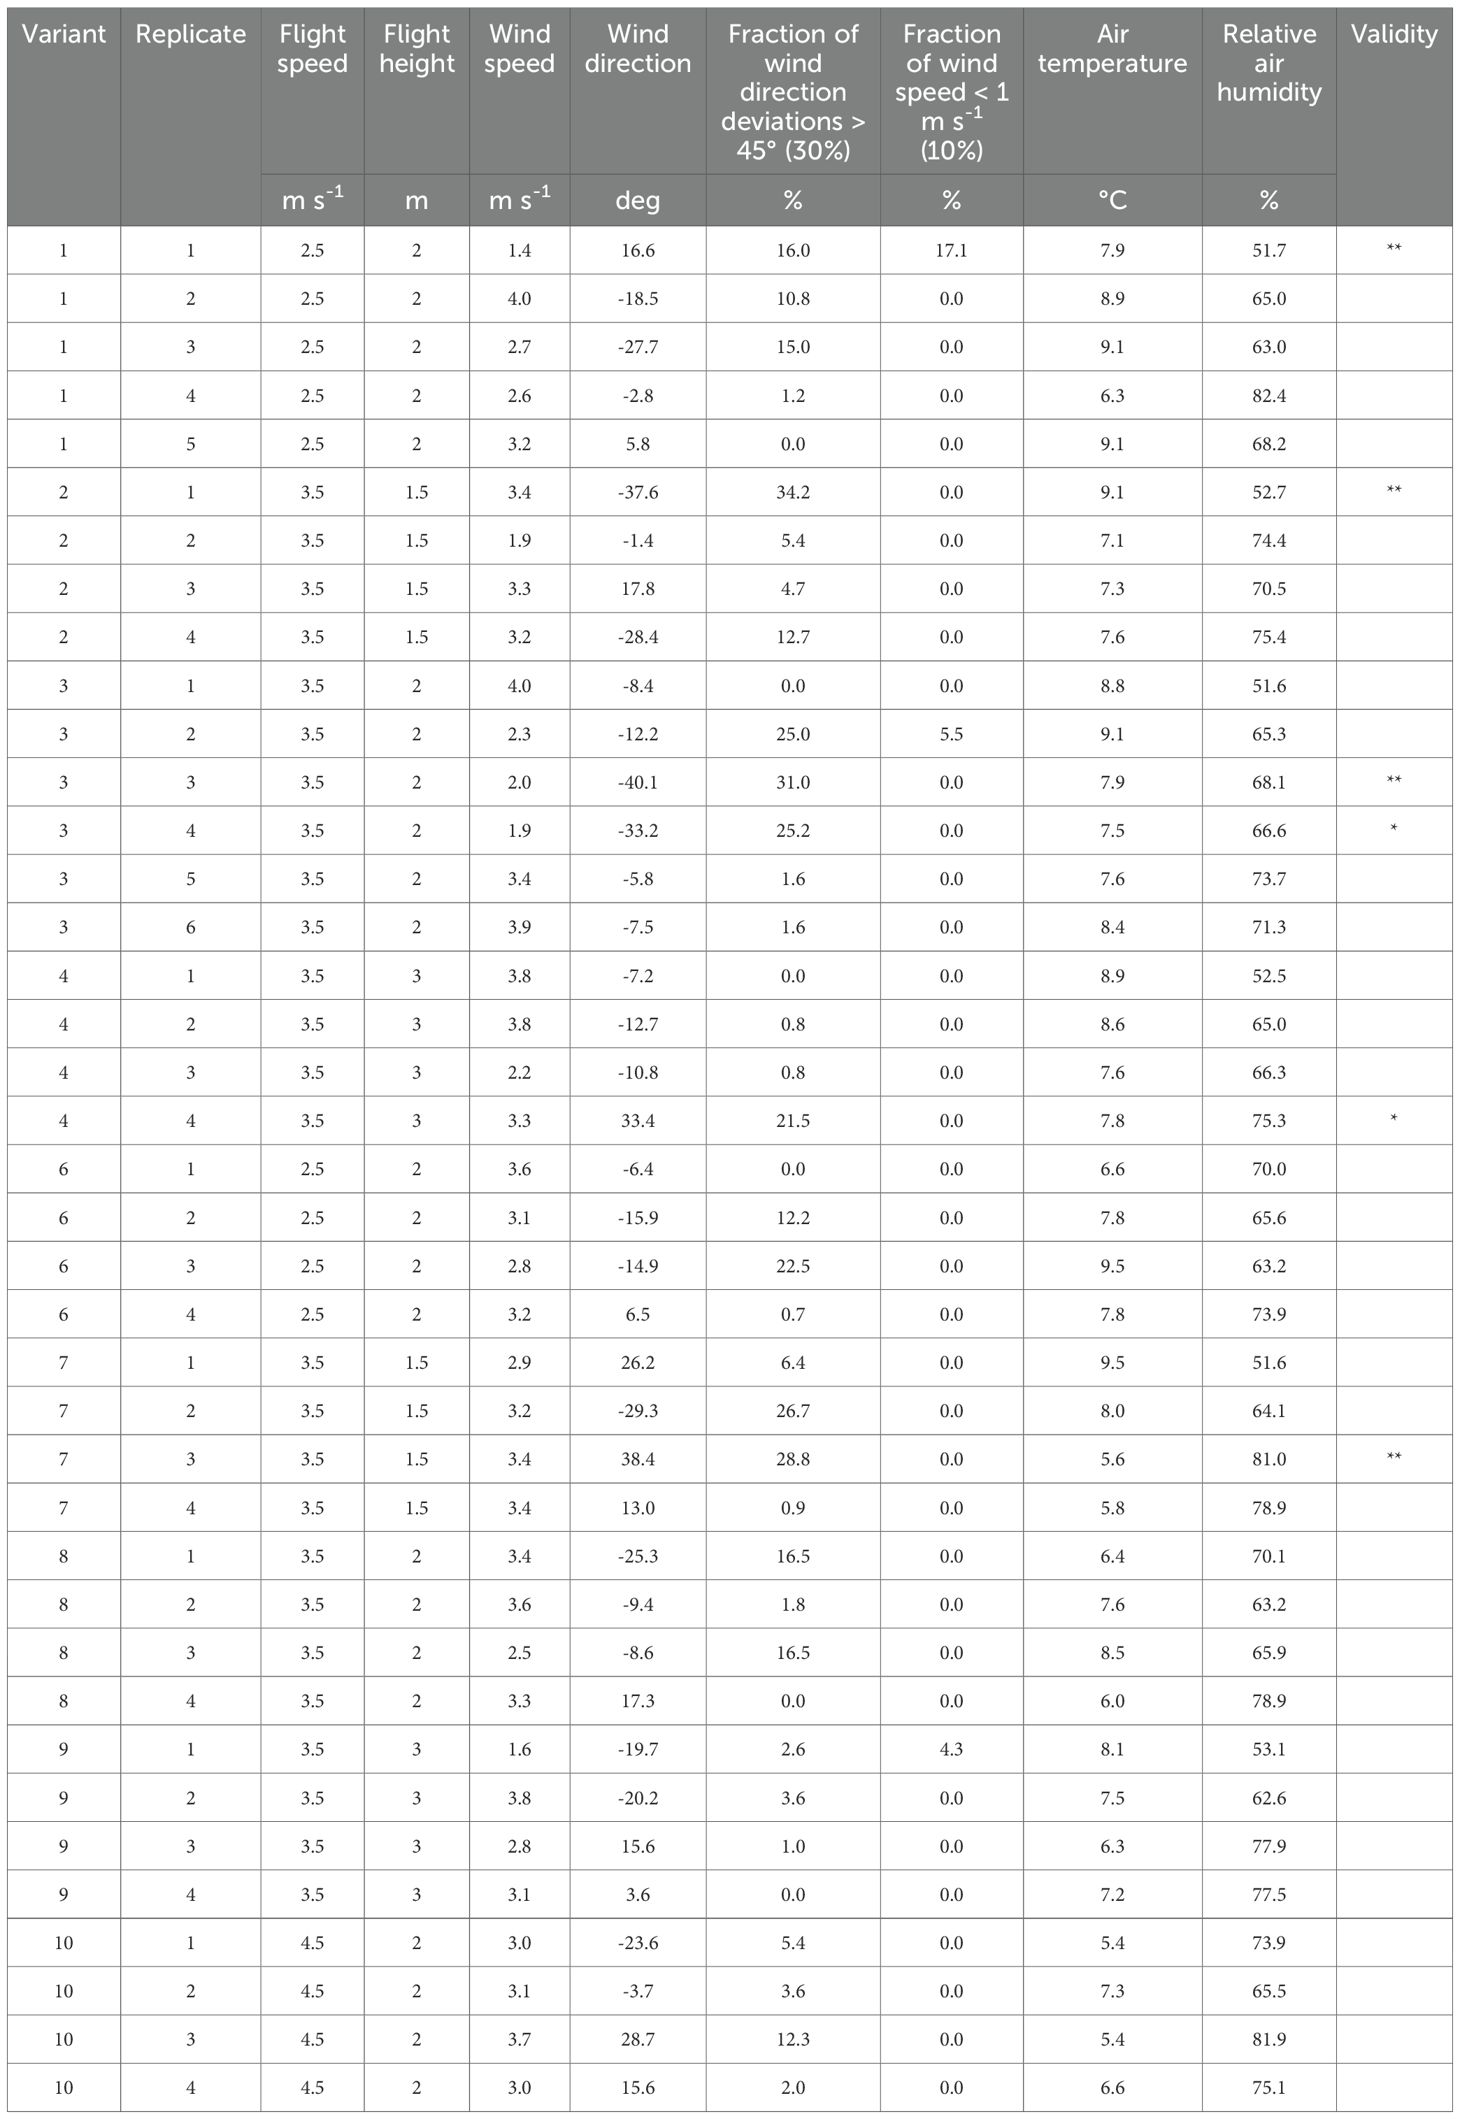
Table 3. Meteorological conditions for each test (in brackets: acceptance criteria according to ISO 22866 or German code of practice).
Figure 5 shows the median (50th percentile) drift sediment for AIN and RAT at the measured downwind distances and operating conditions. RAT produced higher drift sediment only under the more extreme combinations of flight height and flight speed. Under practically relevant conditions (2 m flight height, 2.5 m s-¹), drift sediment from RAT was consistently lower than from AIN at all downwind distances. Figure 6 presents the 90th percentile drift sediment and shows the same overall pattern. All 50th and 90th percentiles across variants are listed in Supplementary Table S1.
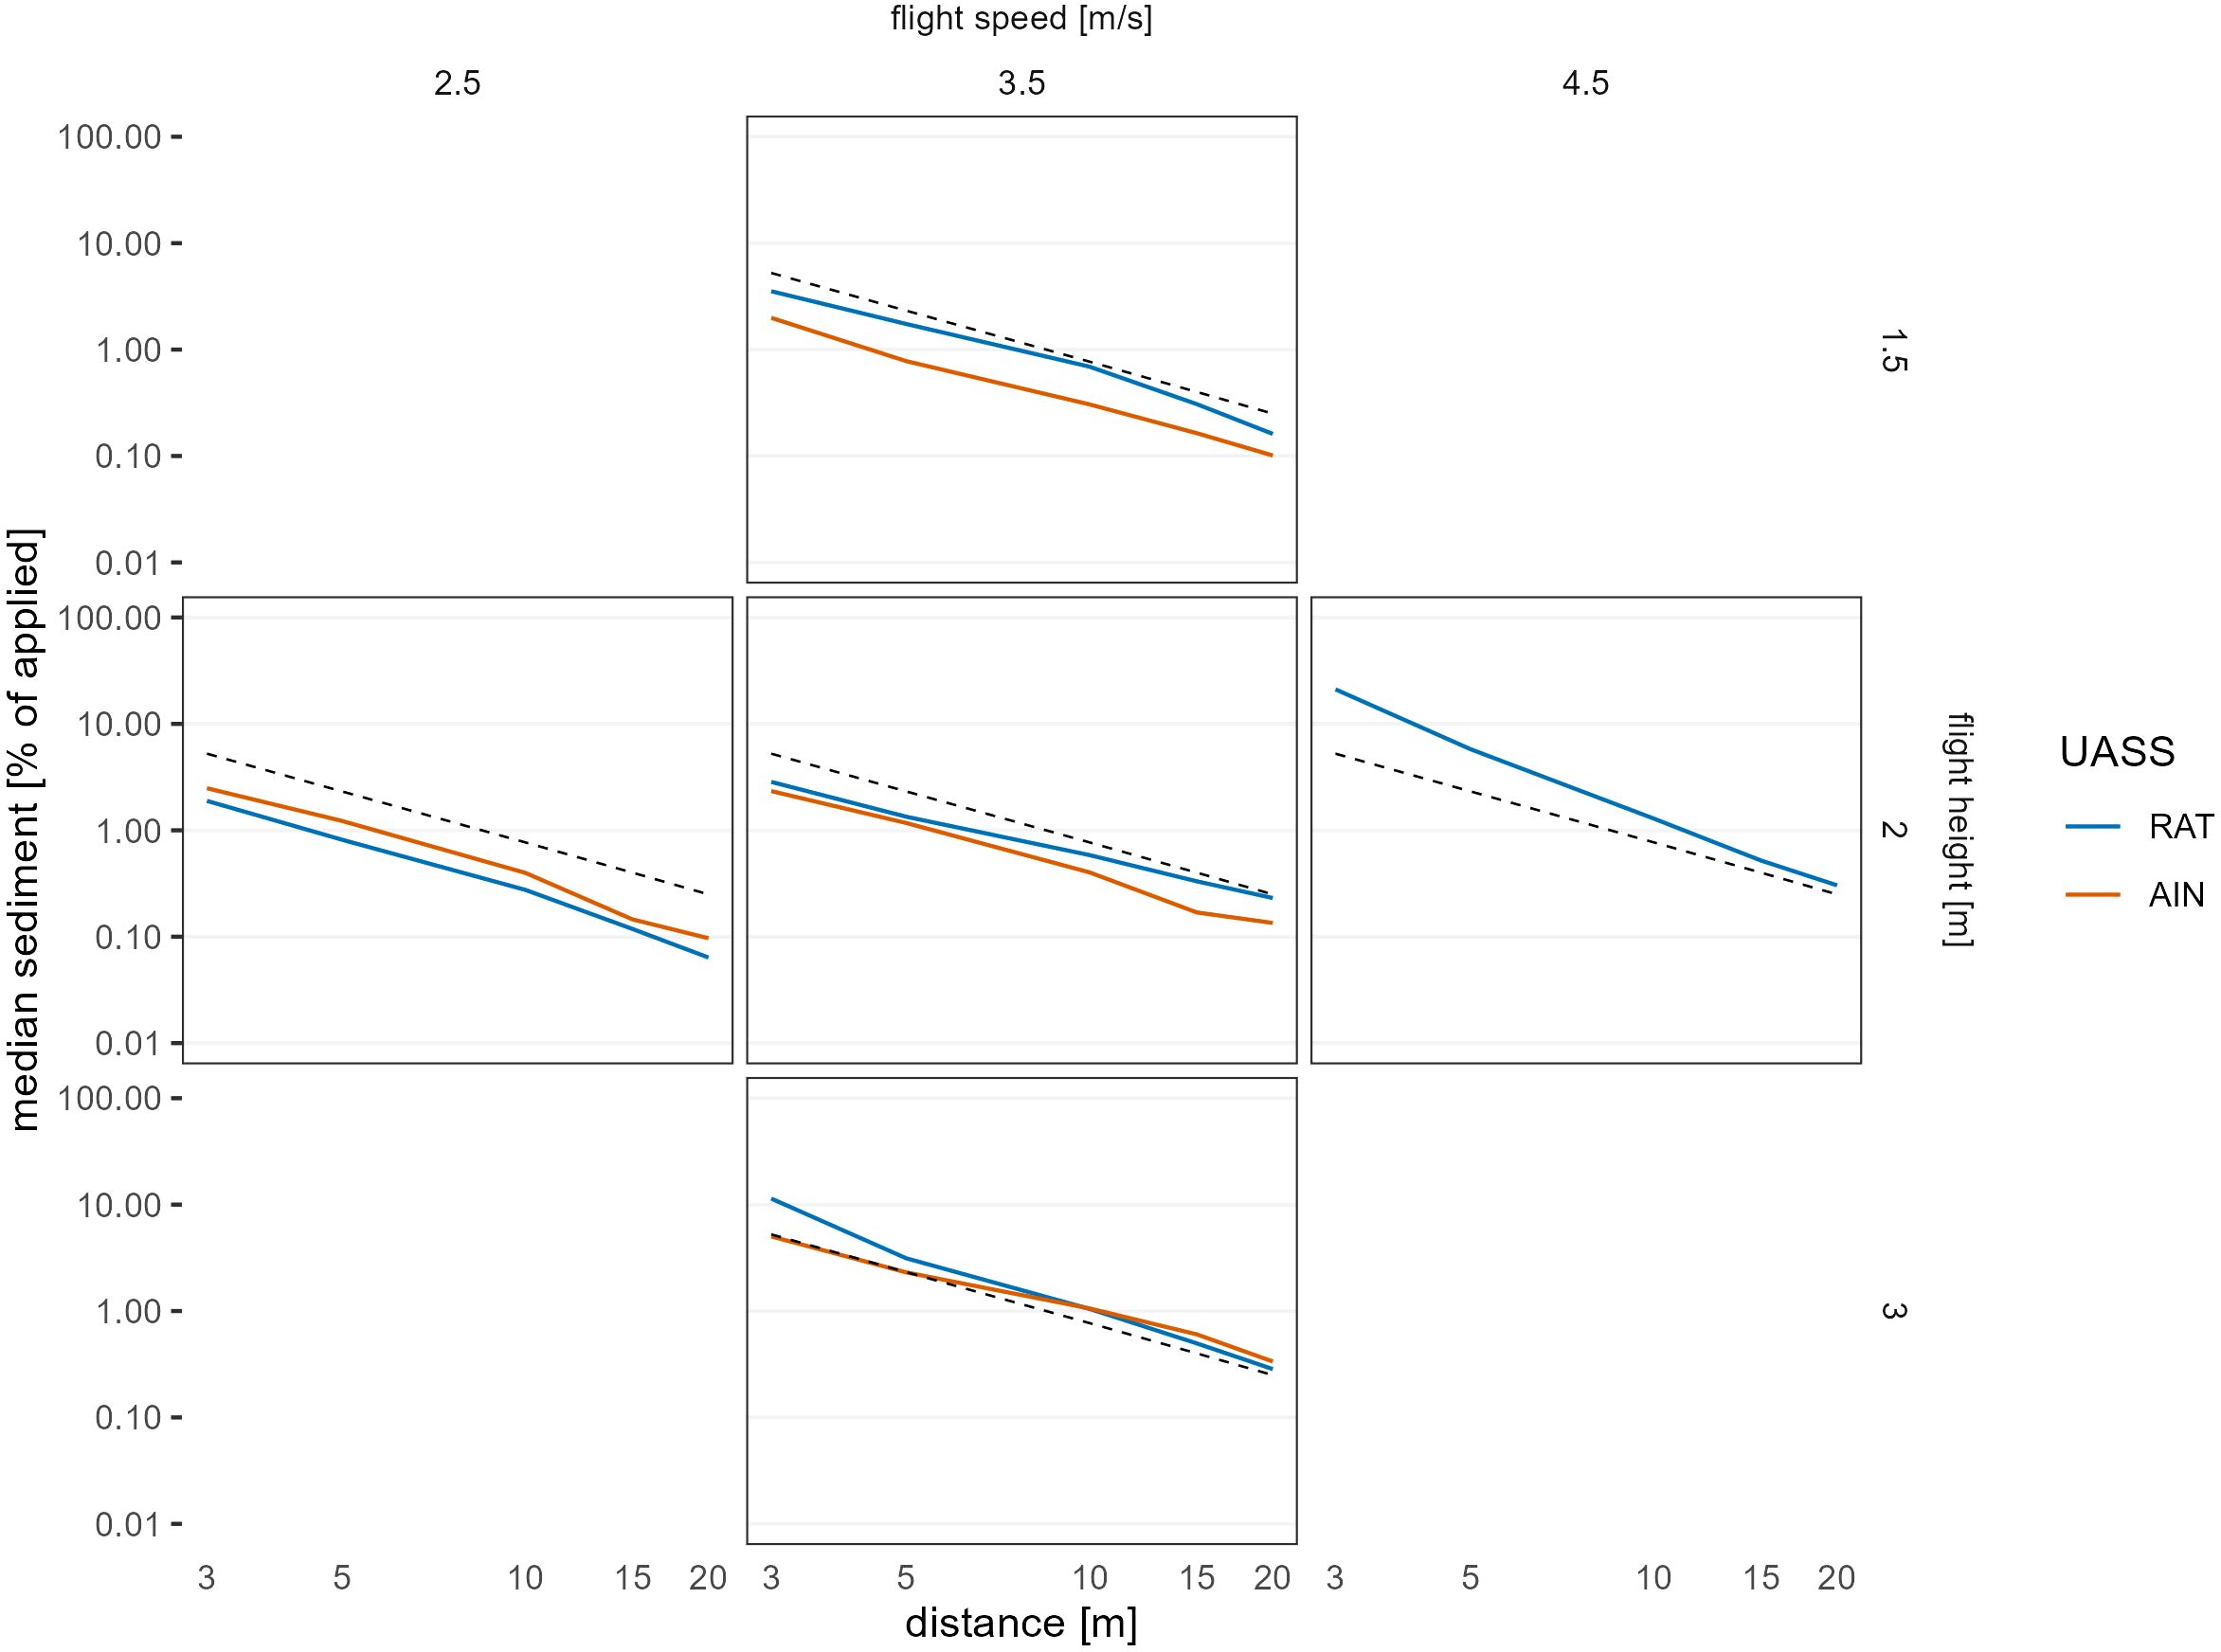
Figure 5. Median drift sediment curves (% of applied) for AIN (orange) and RAT (blue). Dashed black line shows vineyard basic drift values (Rautmann et al., 2001). Alt text: Log-log-scale line plot of median drift sediment versus distance, showing orange (AIN) and blue (RAT) curves compared to a dashed black reference line for vineyard values.
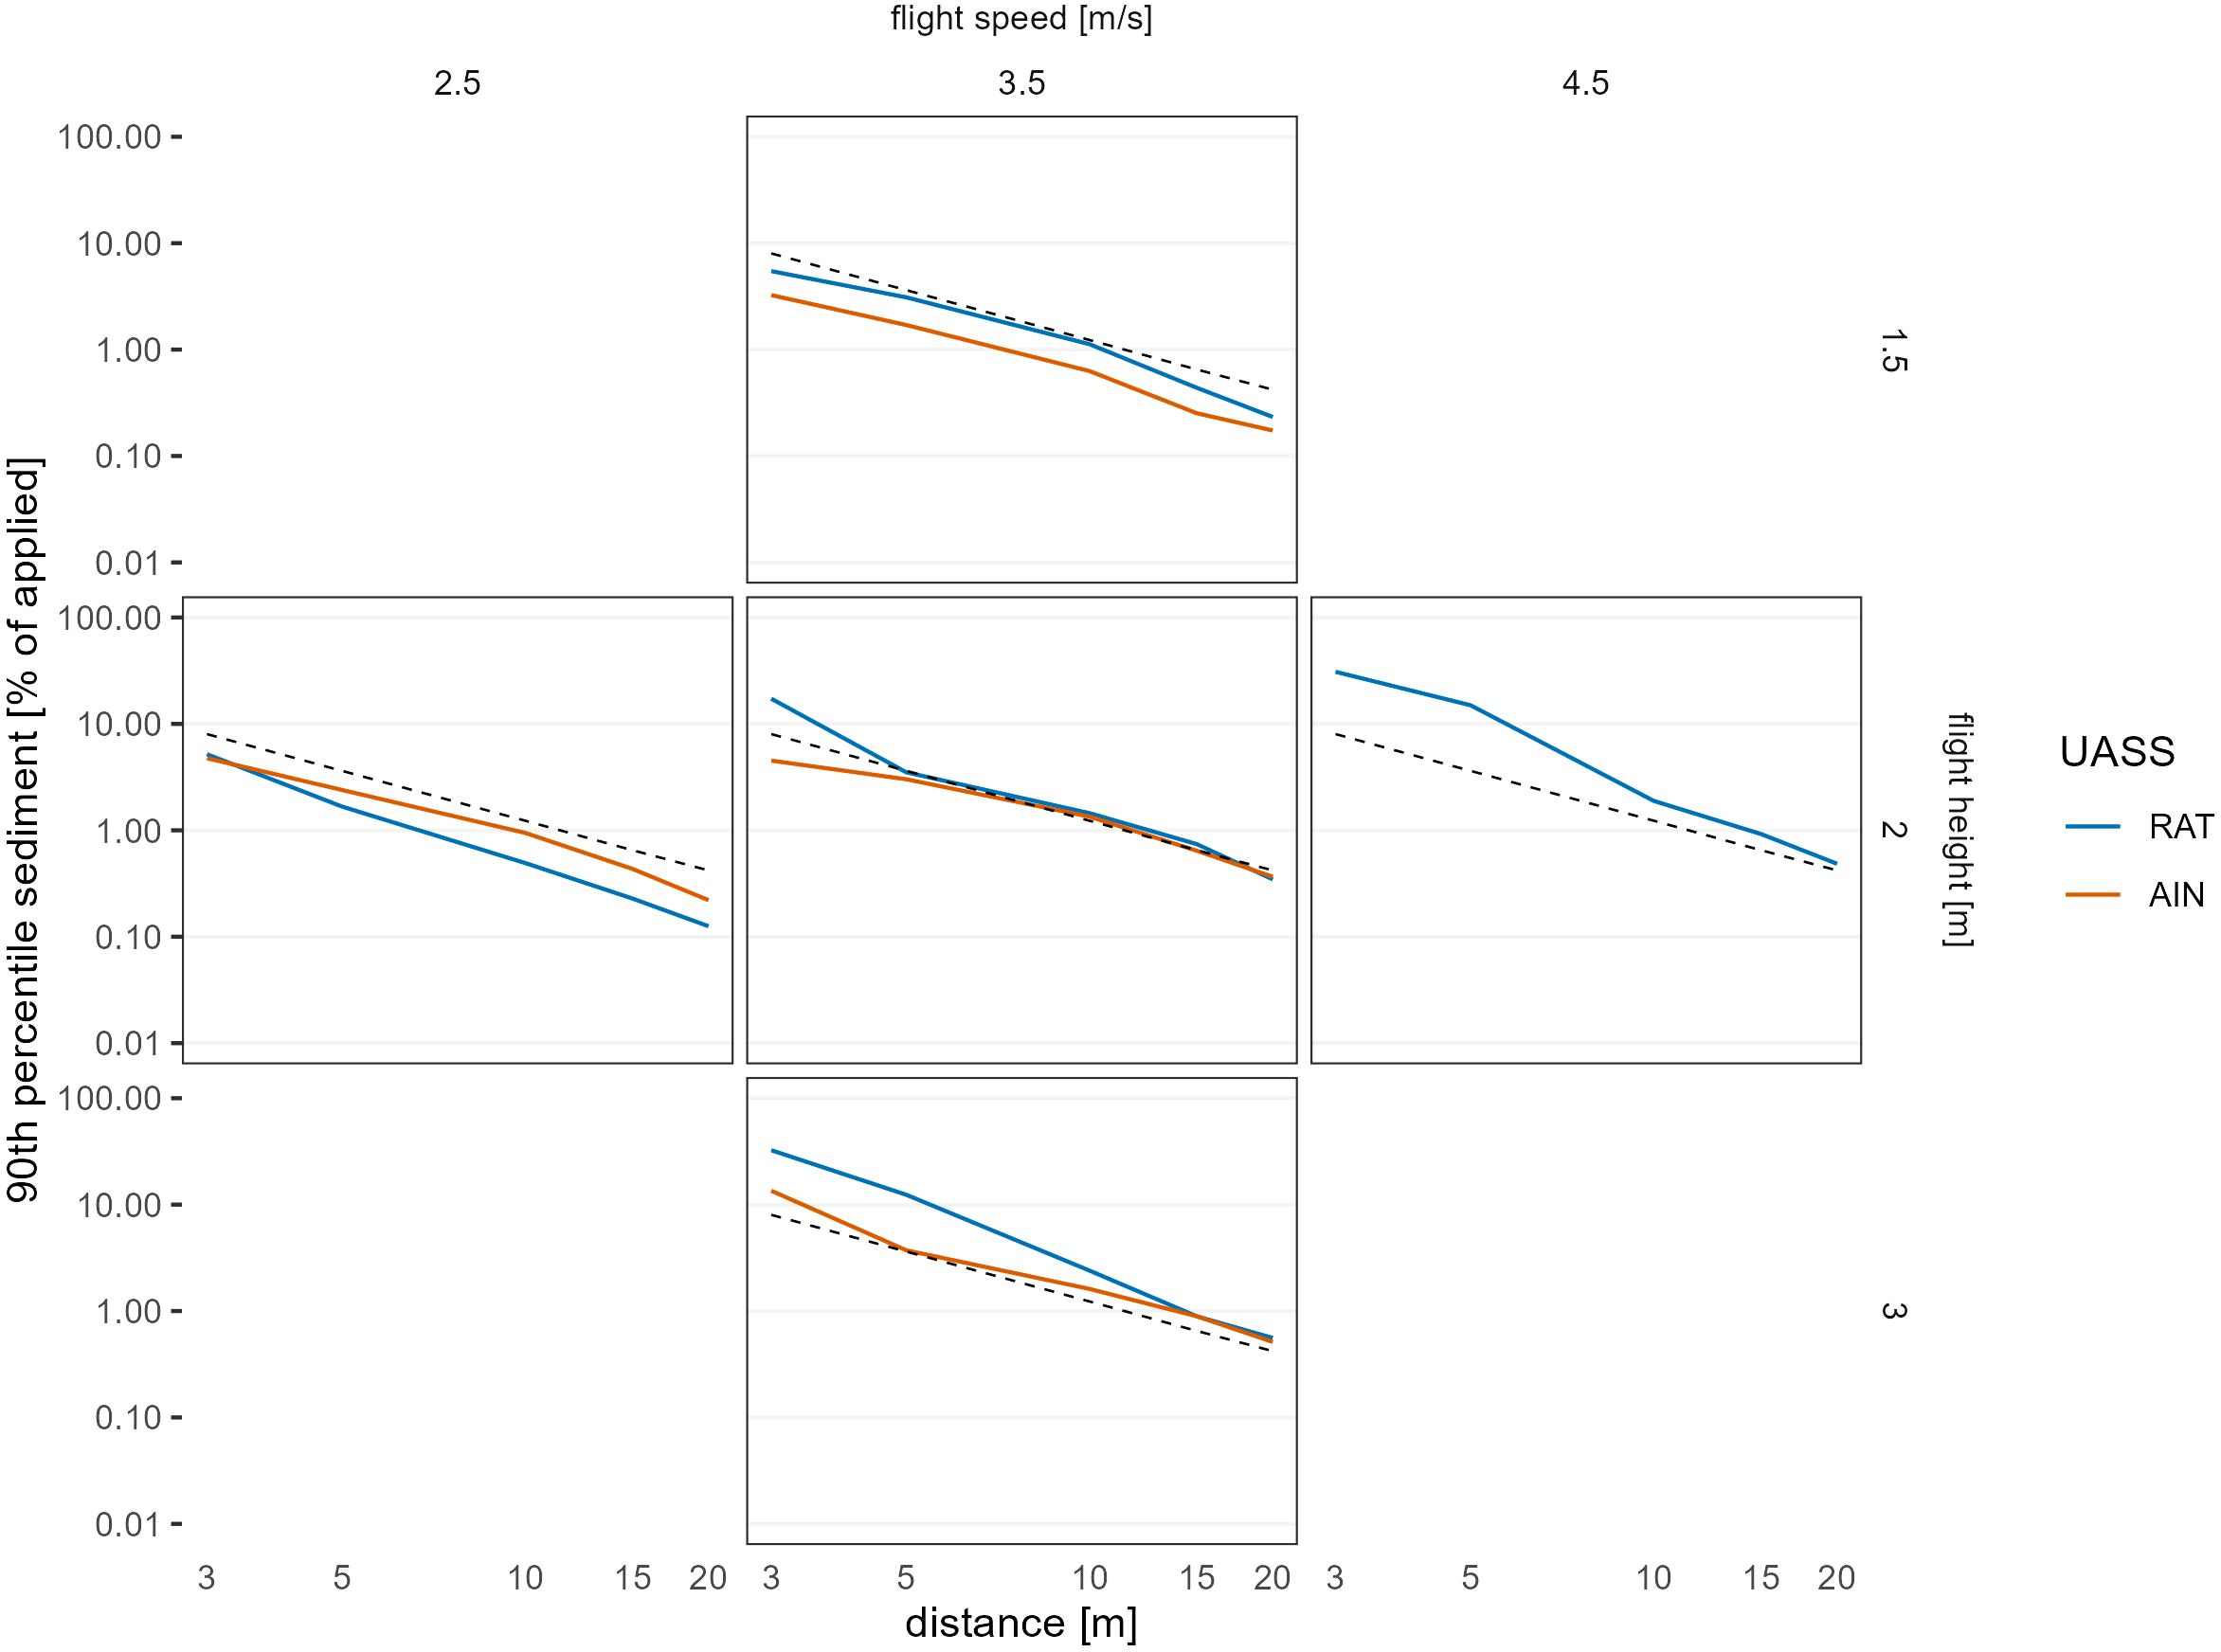
Figure 6. 90th percentile drift sediment curves (% of applied) for AIN (orange) and RAT (blue). Dashed black line shows vineyard basic drift values (Rautmann et al., 2001). Alt text: Log-log-scale line plot of 90th percentile drift sediment versus distance, comparing AIN (orange) and RAT (blue) against a dashed black vineyard reference line.
To quantify the effects of distance and operating parameters on drift, quantile regression models were fitted for the median (τ = 0.5) and the 90th percentile (τ = 0.9). The response variable was log-transformed drift sediment (percentage of application rate). Fixed effects included log(distance), flight height, flight speed, atomizer type (RAT vs. AIN), and their interactions. Two models were pre-specified a priori:
1. model 1: a main-effect model with a height × atomizer interaction;
2. model 2: an interaction model including both height × atomizer and speed × atomizer interaction, but excluding the main effect flight speed.
A model including a height × speed interaction was initially tested but it produced a singular design matrix due to strong collinearity between flight height and flight speed.
Model comparison using AIC and permutation-based analysis of deviance (1,000 permutations) showed that the model including the speed × atomizer interaction provided a substantially better fit (ΔAIC > 10 is considered strong evidence; p-value is the proportion of permuted test statistics ≥ observed statistic):
− τ = 0.5: ΔAIC = 97.4, p < 2×10-¹6;
− τ = 0.9: ΔAIC = 130.9, p < 2×10-¹6.
Importantly, only this model reproduced the empirically observed pattern that RAT drift is equal to or lower than AIN drift under practical operating conditions. Therefore, the interaction model was selected as the final specification Therefore, the interaction model (Equation 2) was selected as the final specification:
The median quantile regression (τ = 0.5) showed a pronounced decrease of drift with distance and a clear increase with flight height (Table 4). For interpretation, positive coefficients indicate higher drift relative to the reference level, while negative coefficients indicate lower drift. Under baseline operating conditions (2 m, 2.5 m s-¹), RAT exhibited lower drift than AIN, reflected by the negative atomizer coefficient. The significant height × atomizer interaction indicates that the increase in drift with height was more pronounced for AIN than for RAT. Flight speed had no detectable effect for AIN, whereas RAT drift increased substantially with speed, as shown by the large positive speed × atomizer coefficient.
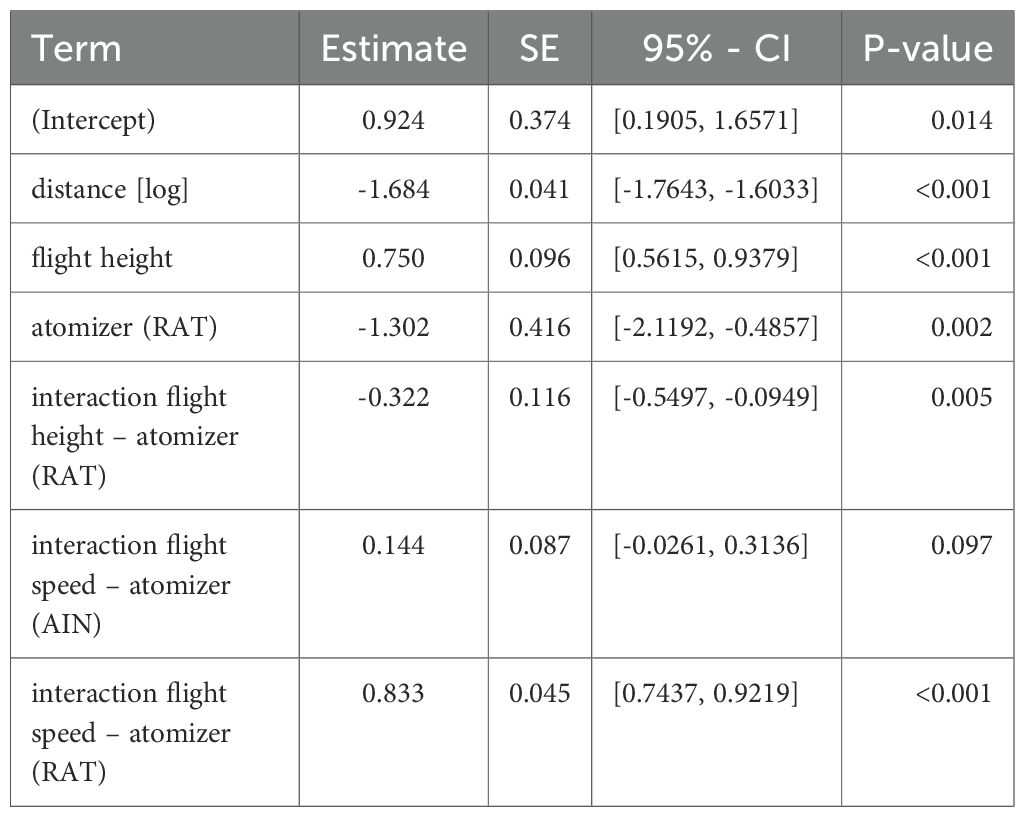
Table 4. Quantile regression results at τ = 0.5 (median drift values), showing coefficients, standard errors, confidence intervals, and p-values for distance, flight height, atomizer type, and interactions.
For the 90th percentile (τ = 0.9), the main effects of distance and height showed the same general pattern (Table 5). RAT again produced lower drift than AIN under baseline conditions. In contrast to the median model, however, the height × atomizer interaction was not significant, suggesting that both atomizer types responded similarly to changes in flight height under high-drift conditions. As in the median model, flight speed had no measurable effect for AIN, while RAT drift increased strongly with speed, confirming the greater aerodynamic sensitivity of RAT in the upper tail of the drift distribution.
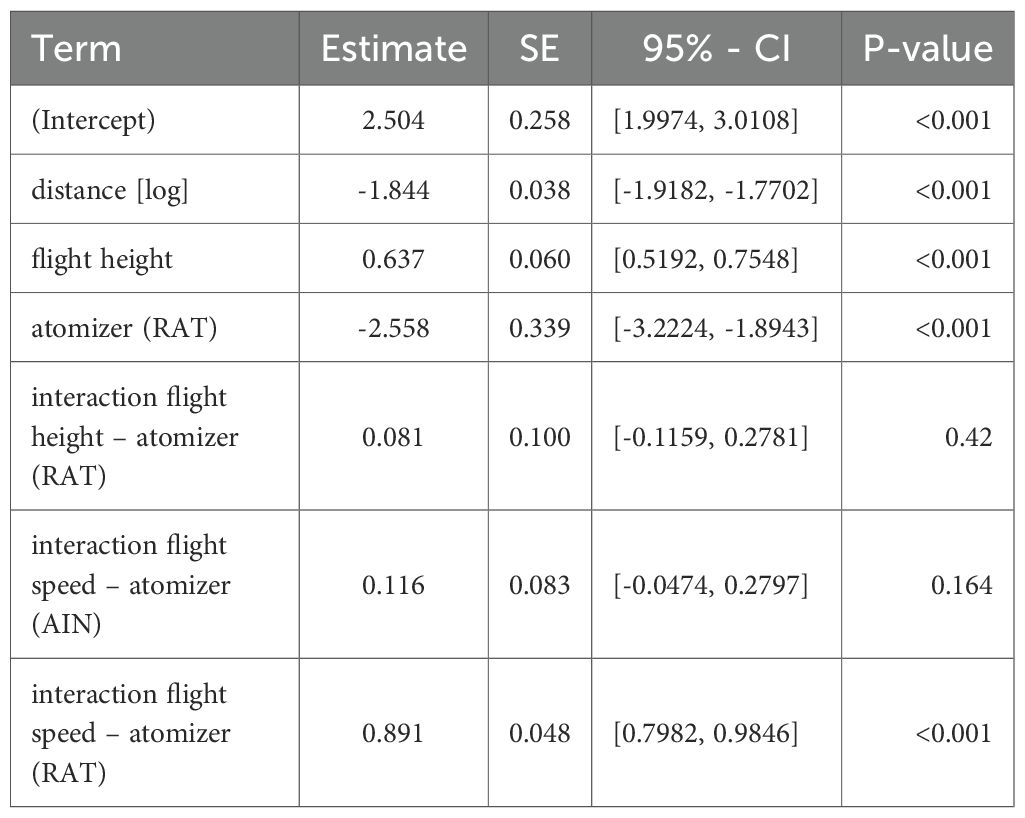
Table 5. Quantile regression results at τ = 0.9 (90th percentile drift values), showing coefficients, standard errors, confidence intervals, and p-values for distance, flight height, atomizer type, and interactions.
Under practical conditions (2 m height, 2.5 m s-¹ speed), model-based estimates at 5 m downwind were:
− RAT: 0.89% (95% CI: 0.74–0.98%)
− AIN: 1.08% (95% CI: 0.91–1.29%)
with no significant differences at τ = 0.5.
At 3 m height and 3.5 m s-¹, RAT produced higher drift at all distances (e.g. δsediment = 0.06% at 15 m; 95% CI: -0.06–0.17). The τ = 0.9 model showed the same pattern with larger magnitudes.
A non-parametric median test was performed for all four operating settings where both atomizer types were tested, comparing RAT and AIN at each downwind distance.
− 2 m height/2.5 m s-¹ speed:
RAT showed lower drift sediment than AIN, with significant differences at 5 m and 20 m.
− 1.5 m height/3.5 m s-¹ speed:
RAT showed higher drift sediment than AIN, with significant differences at all distances (3–20 m).
− 2 m height/3.5 m s-¹ speed:
RAT showed higher drift sediment than AIN, with significant differences at distances > 5 m.
− 3 m height/3.5 m s-¹ speed:
No significant differences were observed at all distance (3–20 m).
These comparisons are shown in detail in Figure 7 for 2 m height/2.5 m s-¹ speed and 3 m height/3.5 m s-¹ speed. Overall, both atomizers show similar drift behavior, and RAT did not produce significantly greater drift sediment than AIN in these two settings. For application in German steep-slope vineyards, the drift sediment at a flight height of 2 m and a flight speed of 2.5 m s-¹ was below the basic drift values for vineyard sprayers (Rautmann et al., 2001). At 3 m and 3.5 m s-¹, the results for both atomizers exceeded these basic drift values, and use at these parameters would therefore not be permissible.
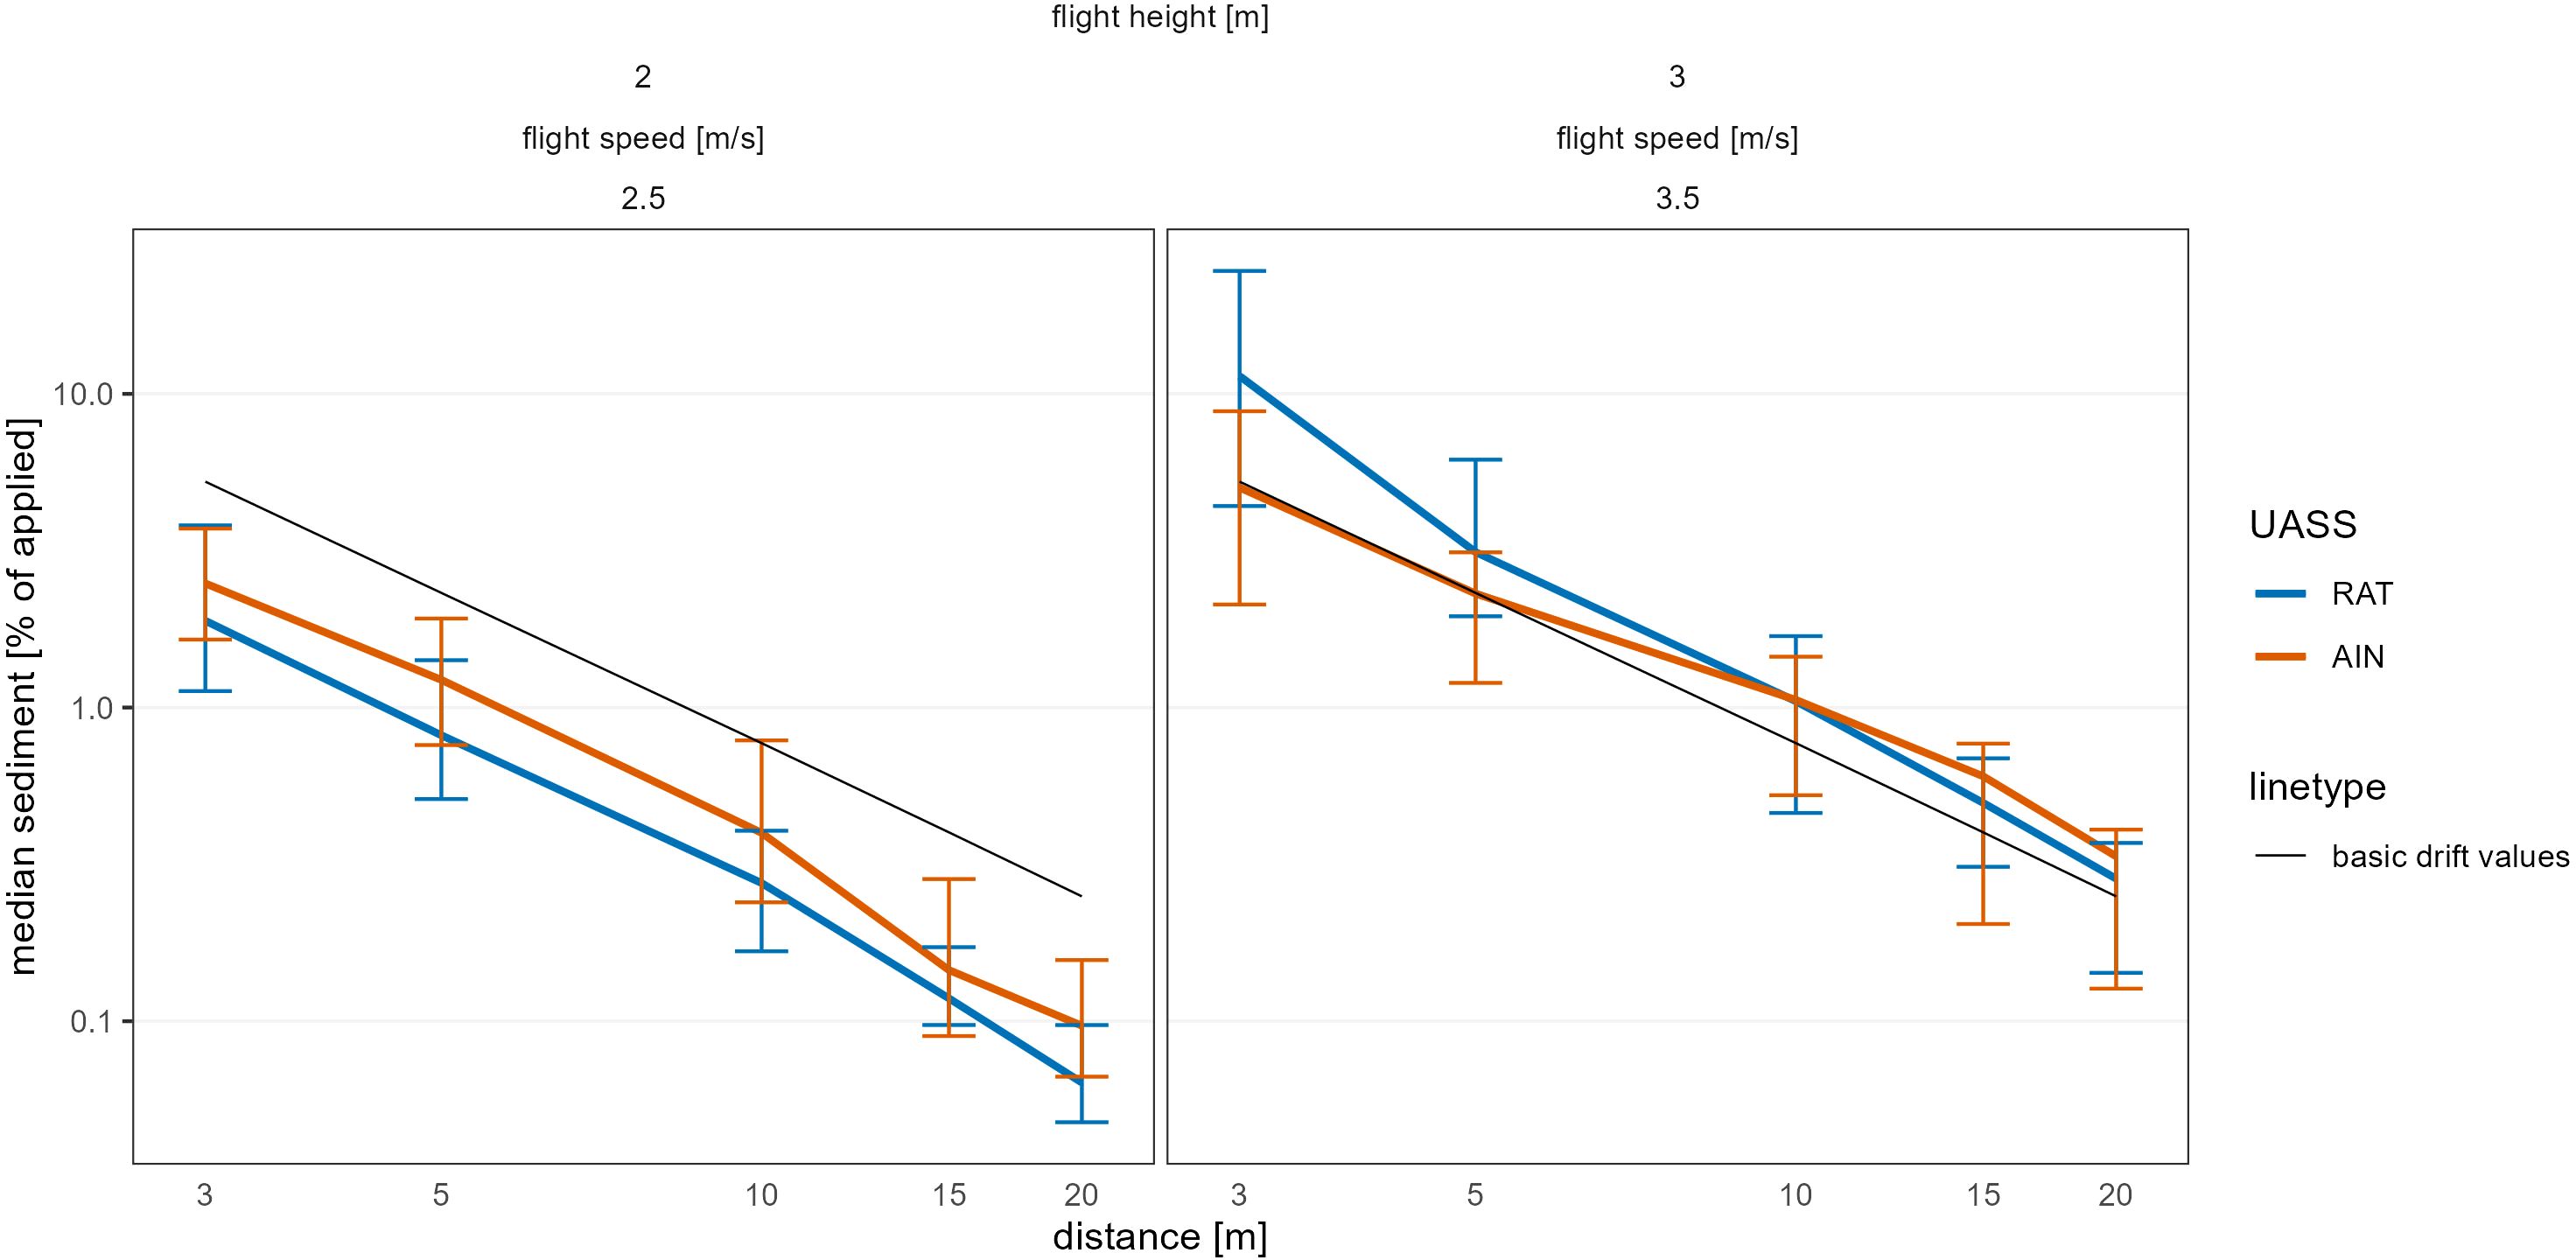
Figure 7. Median drift sediment curves (% of applied) for AIN (orange) and RAT (blue) at 2 m/2.5 m s-¹ and 3 m/3.5 m s-¹ operating parameters. Vertical bars at each distance indicate the interquartile range (IQR) of drift sediment, showing the variability and spread of drift values across replicates. Alt text: Log-log-scale line plot of median drift sediment versus distance under two operating scenarios: 2 m flight height at 2.5 m s-¹ and 3 m flight height at 3.5 m s-¹, comparing orange (AIN) and blue (RAT) curves. At each downwind distance, vertical error bars show the interquartile range (IQR) of sediment values, illustrating how much the drift measurements varied between replicates.
A data set with all test details, drift sediment and deposition data as well as the detailed weather conditions is available from Ahrens et al. (2025).
4 Discussion
4.1 Limitations and measurement context
Droplet-size measurements for both atomizer types were conducted without rotor downwash. This choice was necessary for practical and safety reasons, but it introduces an important limitation: air shear and plume entrainment under downwash can modify breakup and shift the measured size spectrum. We expected these effects to influence both atomizer types in a comparable magnitude. Because RAT sizing required an adapted scanning procedure, the resulting DV50 and V100 values should be regarded as indicative rather than fully standardized under ISO 25358 conditions. However, rotary atomizers discharge horizontally whereas air-induction nozzles emit hydraulically formed droplets downward, this assumption may not fully hold. Absolute DV50 or V100 values should therefore be interpreted with caution.
For rotary atomizers, measured DV50 values deviated from the nominal setpoints in the DJI control menu. Importantly, our drift interpretation does not rely on matching these nominal droplet-size setpoints. The analysis is based entirely on field sediment measurements, and sensitivity checks confirmed that the main drift patterns remained unchanged.
ISO 22866 specifies that spray drift measurements must be performed outdoors under typical field conditions or over a defined surface including grass turf. Therefore, the trials were conducted over short, homogeneous grass to eliminate crop-specific structural effects and to ensure compliance with the standard. The homogeneous grass surface ensured that no crop canopy, row structure, or plant interception influenced the drift measurements, so that all downwind sediment originated solely from the UASS application. Some field runs fell outside ISO 22866 meteorological limits, but these replicates were excluded; all drift values reported here are therefore based solely on ISO-compliant measurements.
4.2 Link to our findings and robustness
The core findings of this study stem from quantile regression of the field drift sediment data. At the practically relevant operating conditions (2 m flight height, 2.5 m s-¹), rotary atomizers produced drift sediment equal to or lower than air-induction nozzles at all downwind distances. At 3 m and 3.5 m s-¹, both atomizer types showed increased drift, with RAT exceeding AIN at lower distances, but the absolute differences remained modest.
The quantile regression revealed a strong interaction between flight speed and atomizer type: while AIN showed no detectable effect of speed across the tested range (2.5–3.5 m s-¹), RAT exhibited a clear speed response. This difference is consistent with the aerodynamic behavior of the two droplet-generation principles: AIN produce relatively coarse droplets with lower sensitivity to horizontal airflow, whereas RAT produce finer droplets that are more affected by wake turbulence and forward motion. This moderating effect likely reflects the strong downward momentum generated by the multirotor downwash, which is absent in wind-tunnel tests such as Wang et al. (2023). In addition, Wang et al. operated RAT mostly at substantially higher rotational speeds (> 4000 rpm), producing much finer sprays and inherently higher drift potential. For the tests with 4000 rpm, the cumulative drift rate of the rotary atomizer did not differ significantly from that of some hydraulic nozzles. Based on the regression functions, it is likely that this effect would further increase at higher speeds such as 4.5 m s-¹, which could not be tested for AIN due to flow-rate limitations of the DJI Agras T30.
4.3 Implications for standards and future work
There is currently no harmonized procedure for sizing sprays from rotary atomizers. A revision of ISO 25358 would be warranted to.
i. define sampling under controlled, downwash-representative conditions,
ii. require fan-resolved scanning and reporting of within-fan variability,
iii. include drift-relevant metrics such as V100 alongside DV50, and
iv. specify uncertainty reporting (repeatability, spatial coverage, and calibration)
Future work should compare sizing with vs. without downwash on the same hardware and validate bench measurements against field sediment distributions. While the adapted RAT measurement approach provided consistent internal results, its representativeness under downwash conditions remains to be validated experimentally.
5 Concluding remarks
Operationally, our findings show that atomizer type alone is not sufficient to predict drift risk. Flight height and speed govern drift far more strongly than whether AIN or RAT are used. Under recommended low-to-moderate operating conditions (2 m, 2.5 m s-¹), both atomizer types generated drift values that remained below the basic drift values for vineyard sprayers. At higher settings (3 m, 3.5 m s-¹), drift exceeded these reference values for both AIN and RAT, indicating that operational limits are essential for risk management.
The basic drift values for vineyard reference sprayers (Rautmann et al., 2001) were included solely as regulatory reference thresholds. We did not conduct an experimental comparison between UASS and ground-based application technologies. The reference lines serve only to indicate whether the drift levels measured for the two drones lie under the basic drift values for vineyards in Germany. This approach reflects the existing regulatory practice, where drift from different application systems is interpreted against established reference values rather than compared experimentally to reference sprayers.
This study demonstrates that rotary atomizers do not universally produce higher drift than air-induction nozzles. Under realistic operating conditions, both atomizer types performed similarly, and drift behavior was primarily governed by height and speed. While the trials followed ISO 22866 closely and were conducted under standardized conditions, limitations in droplet-size characterization and the technical constraints of UASS operation underline the need for further refinement of standards and future fully ISO-conforming trials. Standardized droplet sizing for rotary atomizers (ISO 25358 update) remains a priority to better connect bench metrics with field drift.
Data availability statement
The datasets presented in this study can be found in online repositories. The names of the repository/repositories and accession number(s) can be found below: https://www.openagrar.de/receive/openagrar_mods_00109060; OpenAgrar; DOI: 10.5073/20250728-165753-0.
Author contributions
KA: Data curation, Formal analysis, Methodology, Project administration, Software, Validation, Visualization, Writing – original draft, Writing – review & editing. AH: Conceptualization, Data curation, Investigation, Methodology, Writing – original draft. JW: Methodology, Project administration, Resources, Writing – original draft, Writing – review & editing.
Ethics statement
All field trials were conducted in accordance with ISO 22866 field protocols for measuring spray drift and complied with national regulations governing unmanned aerial spraying operations. Flights were performed by qualified personnel under the applicable operating permissions; no plant protection products were applied—only a fluorescent tracer was used.
Funding
The author(s) declared that financial support was received for this work and/or its publication. This research received no specific grant from any funding agency, commercial or not-forprofit sectors. All costs were covered by the authors and their institutions.
Acknowledgments
The authors thank Globe Flight GmbH for piloting support and colleagues at the Julius Kuehn Institute for field and laboratory assistance. We acknowledge the use of Generative AI (ChatGPT, GPT-5-mini, OpenAI, 2025) to assist with translating and formulating parts of the manuscript. All text generated by the AI was critically reviewed, edited, and verified for factual accuracy by the authors prior to inclusion.
Conflict of interest
The authors declare that the research was conducted in the absence of any commercial or financial relationships that could be construed as a potential conflict of interest.
Generative AI statement
The author(s) declare that Generative AI was used in the creation of this manuscript. We acknowledge the use of Generative AI (ChatGPT, GPT-5-mini, OpenAI, 2025) to assist with translating and formulating parts of the manuscript. All text generated by the AI was critically reviewed, edited, and verified for factual accuracy by the authors prior to inclusion.
Any alternative text (alt text) provided alongside figures in this article has been generated by Frontiers with the support of artificial intelligence and reasonable efforts have been made to ensure accuracy, including review by the authors wherever possible. If you identify any issues, please contact us.
Publisher’s note
All claims expressed in this article are solely those of the authors and do not necessarily represent those of their affiliated organizations, or those of the publisher, the editors and the reviewers. Any product that may be evaluated in this article, or claim that may be made by its manufacturer, is not guaranteed or endorsed by the publisher.
Supplementary material
The Supplementary Material for this article can be found online at: https://www.frontiersin.org/articles/10.3389/fagro.2025.1716113/full#supplementary-material
Supplementary Table 1 | All medians and 90th percentiles from the experiments for both atomizer types, all variants, and all distances
Supplementary Data Sheet 2 | All R code used to generate the figures and tables is provided in an R Markdown-style document.
References
Ahrens K., Herbst A., and Wegener J. K. (2025). Spray drift ground sediment resulting from application with UASS equipped with rotary atomizers and air injection nozzles (Braunschweig, Germany: Julius Kühn Institute). doi: 10.5073/20250728-165753-0
BBA (2000). kanntmachung über die Abtrifteckwerte, die bei der Prüfung und Zulassung von Pflanzenschutzmitteln herangezogen werden vom 8 . BAnz AT 2000, 100.
Butler-Ellis M. C., Lane A. G., O’Sullivan C. M., Wheeler H. C., and Harwood J. J. (2025). Field measurement of spray drift from a spray application by UAV. Crop Protection 178, 106347. doi: 10.1002/ps.8645
Chen P., Douzals J. P., Lan Y., Cotteux E., Delpuech X., Pouxviel G., et al. (2022). Characteristics of unmanned aerial spraying systems and related spray drift: A review. Front. Plant Sci. 13. doi: 10.3389/fpls.2022.870956
DE (2012). Gesetz zum Schutz der Kulturpflanzen (Pflanzenschutzgesetz - PflSchG) . Bundesgesetzblatt I, 148, 1632–1648.
de Mendiburu F. (2023). “agricolae: statistical procedures for agricultural research,” in R package version 1 (Lima, Peru: International Potato Center (CIP)) 3–7. Available online at: https://CRAN.R-project.org/package=agricolae (Accessed March 12, 2025).
Ehmke A., Melfsen A., Wegener J. K., and Hartung E. (2023). Influence of the urease inhibitor suspension (Atmowell®) on the fluorescent dye pyranine and its spray and drift behavior in wind tunnel measurements. J. Environ. Sci. Health Part. B Pesticides Food contaminants Agric. wastes 58, 210–216. doi: 10.1080/03601234.2023.2177463
Ehmke A., Wegener J. K., Melfsen A., and Hartung E. (2024). Optimizing exposure data collection for plant protection products: identifying ideal collectors with the fluorescent dye pyranine. J. Consumer Prot. Food Saf. 19, 245–253. doi: 10.1007/s00003-024-01498-5
EU (2009). DIRECTIVE 2009/128/EC OF THE EUROPEAN PARLIAMENT AND OF THE COUNCIL of 21 October 2009 establishing a framework for Community action to achieve the sustainable use of pesticides (Luxembourg: Office for Official Publications of the European Union).
Herbst A., Glaser M., and Bartsch K.-U. (2023). Spray drift from application of plant protection products with drones in vineyards. J. für Kulturpflanzen 75, 151–157. doi: 10.5073/JfK.2023.05-06.04
Herbst A. and Wygoda H.-J. (2006). Pyranin - ein fluoreszierender Farbstoff für applikationstechnische Versuche. Pyranine - a fluorescent tracer dye for experiments on application techniques. Nachrichtenbl. Deut. Pflanzenschutzd. 58, 79–85.
ISO (2005). ISO 22866:2005 - Equipment for crop protection - Methods for field measurement of spray drift (Geneva, Switzerland: International Organization for Standardization).
ISO (2018). ISO 25358:2018 - Crop protection equipment - Droplet-size spectra from atomizers - Measurement and classification (Geneva, Switzerland: International Organization for Standardization).
JKI (2021). Available online at: https://wissen.julius-kuehn.de/mediaPublic/AT-Dokumente/01-Antraege-Richtlinien/guidelines/7-1.5-Measuring-direct-drift-when-applying-Plant-Protection-Products-outdoors.pdf (Accessed September 25, 2025).
Koenker R. (2024). “quantreg: quantile regression,” in R package version 5.99.1 (Vienna, Austria: R Foundation). Available online at: https://CRAN.R-project.org/package=quantreg (Accessed March 12, 2025).
Martin D. E., Perine J. W., Grant S., Abi-Akar F., Henry J. L., and Latheef M. A. (2025). Spray deposition and drift as influenced by wind speed and spray nozzles from a remotely piloted aerial application system. Drones 9, no. doi: 10.3390/drones9010066
OECD (2021). Report on the state of the knowledge – literature review on unmanned aerial spray systems in agriculture, OECD series on pesticides (Paris: OECD).
Ranabhat S. and Price R. (2025). Effects of flight heights and nozzle types on spray characteristics of unmanned aerial vehicle (UAV) sprayer in common field crops. AgriEngineering 7, 22. doi: 10.3390/agriengineering7020022
Rautmann D., Streloke M., and Winkler R. (2001). New basic drift values in the authorisation procedure for plant protection products. Nachrichtenblatt des Deutschen Pflanzenschutzdienstes 53, 137–143.
R Core Team (2024). “R: A language and environment for statistical computing,” in R foundation for statistical computing (Vienna, Austria). Available online at: https://www.R-project.org (Accessed March 12, 2025).
Robinson D., Hayes A., and Couch S. (2024). “broom: Convert Statistical Objects into Tidy Tibbles,” in R package version 1.0.7 (New York, NY, USA: Springer). Available online at: https://CRAN.R-project.org/package=broom (Accessed March 12, 2025).
Schauberger P. and Walker A. (2024). “openxlsx: Read, Write and Edit xlsx Files,” in R package version 4.2.7.1 (Vienna, Austria: R Foundation). Available online at: https://CRAN.R-project.org/package=openxlsx (Accessed March 12, 2025).
van den Brand T. (2024). “ggh4x: hacks for ‘ggplot2’,” in R package version 0.3.0 (Wageningen, Netherlands: Wageningen University). Available online at: https://CRAN.R-project.org/package=ggh4x (Accessed March 12, 2025).
Wang G., Han Y., Li X., Andaloro J., Chen P., Hoffmann W. C., et al. (2020). Field evaluation of spray drift and environmental impact using an agricultural unmanned aerial vehicle (UAV) sprayer. Sci. total Environ. 737, 139793. doi: 10.1016/j.scitotenv.2020.139793
Wang G., Zhang T., Song C., Yu X., Shan C., Gu H., et al. (2023). Evaluation of spray drift of plant protection drone nozzles based on wind tunnel test. Agriculture 13, 628. doi: 10.3390/agriculture13030628
Wickham H. (2020). “plyr: tools for splitting, applying and combining data,” in R package version 1.8.7 (Vienna, Austria: R Foundation). Available online at: https://CRAN.R-project.org/package=plyr (Accessed March 12, 2025).
Wickham H. and Bryan J. (2023). “_readxl: read excel files_,” in R package version 1.4.3 (Vienna, Austria: R Foundation). Available online at: https://CRAN.R-project.org/package=readxl (Accessed March 12, 2025).
Wickham H., François R., Henry L., Müller K., and Vaughan D. (2023). “dplyr: A grammar of data manipulation,” in R package version 1.1.4 (Vienna, Austria: R Foundation). Available online at: https://CRAN.R-project.org/package=dplyr (Accessed March 12, 2025).
Wickham H., Vaughan D., and Girlich M. (2024). “tidyr: tidy messy data,” in R package version 1.3.1 (Vienna, Austria: R Foundation). Available online at: https://CRAN.R-project.org/package=tidyr (Accessed March 12, 2025).
Keywords: unmanned aerial spray systems, rotary atomizer, air-induction nozzle, ISO 22866, spray drift, quantile regression, droplet size distribution, Dv50
Citation: Ahrens K, Herbst A and Wegener JK (2025) Field comparison of spray drift from unmanned aerial spraying systems using air-induction nozzles versus rotary atomizers. Front. Agron. 7:1716113. doi: 10.3389/fagro.2025.1716113
Received: 30 September 2025; Accepted: 26 November 2025; Revised: 25 November 2025;
Published: 10 December 2025.
Edited by:
Nicola Bodino, University of Turin, ItalyCopyright © 2025 Ahrens, Herbst and Wegener. This is an open-access article distributed under the terms of the Creative Commons Attribution License (CC BY). The use, distribution or reproduction in other forums is permitted, provided the original author(s) and the copyright owner(s) are credited and that the original publication in this journal is cited, in accordance with accepted academic practice. No use, distribution or reproduction is permitted which does not comply with these terms.
*Correspondence: Katrin Ahrens, S2F0cmluLkFocmVuc0BqdWxpdXMta3VlaG4uZGU=