 Claudia Pierini1†
 Vincenzo Landi1*†
 Elena Ciani2†
 Aristide Maggiolino1†
 Domenico Campanile3
 Mayra Gomez Carpio4†
 Pasquale De Palo1†
- 1Department of Veterinary Medicine, University of Bari Aldo Moro, Valenzano, Italy
- 2Department of Biosciences, Biotechnology and Environment, University of Bari Aldo Moro, Bari, Italy
- 3Sustainable Management and Protection of Forestry and Natural Resources Section, Bari, Italy
- 4Italian National Association of Buffalo Breeders, Caserta, Italy
Introduction: The Martina Franca donkey is an endangered Italian breed with historical significance in agriculture and therapy. Conservation efforts are crucial due to increasing risks of genetic erosion and inbreeding.
Methods: Pedigree data from 2,261 individuals, spanning from 1940 to 2023, were analyzed. Key parameters such as inbreeding coefficients (FPED), effective population size (Ne), and founder contributions were computed using R packages including optiSel, purgeR, and pedigree. Population structure was assessed using demographic and genealogical indicators.
Results: The study showed a rise in inbreeding (FPED increased from 0.07 in 2009 to 0.10 in 2020), with low Ne values (as low as 3.06 using complete generations), well below the FAO threshold (Ne > 50). Only 16.6 founders in the total population and 15.1 in the reference population accounted for most of the genetic diversity, indicating a genetic bottleneck. Despite recent demographic growth, mainly due to milk and therapy uses, genetic variability remains critically low.
Discussion: These findings highlight the need for immediate conservation strategies, including broadening the breeding base, limiting overuse of sires, and improving pedigree recording. Without intervention, the long-term viability of the breed is at risk.
Introduction
Donkeys have been historically employed as animals of burden for centuries in several countries, particularly in the Mediterranean area of Europe (Jordana et al., 2016; Camillo et al., 2018). Italy has traditionally been considered one of the cradles of European donkey breeding (Colli et al., 2013) and currently retains nine autochthonous donkey populations (Criscione et al., 2024). Among these, Apulia in southern Italy is home to the Martina Franca (MF) donkey breed, which originates from ancient native populations (Rizzi et al., 2011).
The MF donkey is a mesomorphic equine breed, classified as a large-framed breed, characterized by tall stature, exceptional sturdiness, and a generally good temperament (Rizzi et al., 2011; Berardinis et al., 2024). The MF donkey has a dark bay coat with a dorsal stripe, grey muzzle, inner thighs, and abdomen, and a reddish halo around the muzzle and eye sockets. The head is proportionate, with a broad, flat forehead and long, straight, haired ears (Bramante and Pieragostini, 2005).
MF donkeys originate, according to the main hypothesis, from native donkeys crossed with Catalan donkeys during the Spanish colonial period (Folch and Jordana, 1998). Traditionally, MF donkeys were used for transporting goods, raising livestock, and occasionally for meat (De Palo et al., 2017; Maggiolino et al., 2020). Due to its height, the breed is particularly valued for mule production, especially when crossed with mares from the Murgese horse (Equus caballus) breed (Kugler et al., 2007; Rizzi et al., 2011). Mules were extensively used as working animals in agriculture, particularly in mountainous areas (Berardinis et al., 2024), and during the First World War for transporting troops, supplies, and artillery (Carluccio et al., 2020). However, the advent of agricultural mechanization post-World War II led to a significant decline in the use of draft animals, resulting in a demographic decline of the MF donkey breed, which was seriously threatened with extinction by the 1980s (Rizzi et al., 2011; De Palo et al., 2016). This decline led to population fragmentation, increased consanguinity, and a loss of genetic variability (Camillo et al., 2018).
The studbook for the MF donkey was initiated in 1924 with three founding jackasses: Marco, Bello, and Colosseo (A.N.A.M.F. – Associazione Nazionale Allevatori del Cavallo delle Murge e dell'Asino di Martina Franca). Today, the studbook is maintained by the MF Donkey and the Murgese Horse Breeders’ Association (A.N.A.M.F., 2024), founded in 1948. In 1981, the Apulia Regional Government established a Center for the Conservation and Safeguard of the MF donkey (Rizzi et al., 2011; Berardinis et al., 2024). This breed has played a significant historical role and continues to be a valuable resource in local agro-silvo-pastoral systems (Biscarini et al., 2015).
Recently, the utility of mules as working animals has been reappraised, especially in marginal mountainous areas for agricultural work and wood transportation, leading to a renewed demand for MF donkeys. Additionally, this breed has garnered interest for equine-assisted therapy and the use of its milk in cosmetics, infant nutrition, and meat production (Berardinis et al., 2024; Natrella et al., 2024).
MF donkeys have been exported to several countries since the early 20th century due to their morphological characteristics, high adaptability to harsh environments, and genetic resistance to enzootic tick-borne pathogens (Gandini et al., 2004). These countries include France, Germany, Poland, Slovakia, Hungary, Greece, Brazil, and Argentina (A.N.A.M.F., 2024). The current population of the MF donkey breed in Italy is 1417 individuals distributed among 390 herds (A.N.A.M.F. – Associazione Nazionale Allevatori del Cavallo delle Murge e dell'Asino di Martina Franca).
The aim of this study is to evaluate the current genetic diversity and inbreeding levels of the Martina Franca donkey population. By applying demographic and genetic parameters and analysing inbreeding trends, this investigation seeks to provide a comprehensive assessment of the genetic status of the Martina Franca donkey population, comparing the current population conditions to those previously reported for the year 2005 by Rizzi et al. (2011). Although not all parameters are directly comparable, as the present study includes additional metrics such as FPED variants and spatial analysis, the comparison provides valuable insight into the breed’s recent demographic and genetic evolution. The findings enable an evaluation of the suitability of the conservation and breeding strategies adopted to maintain and enhance genetic diversity.
Materials and methods
Pedigree data
The National Breeders Association (A.I.A.) provided pedigree data for 2261 animals, consisting of 1442 females and 819 males (170 stallions, 742 mares, 1996 progeny). The records spanned from 1940 to 2023. The analysis was carried out on two population groups: the Total Population (TP), which includes all individuals recorded in the pedigree file regardless of birth year or reproductive status (including those analyzed by Rizzi et al., 2011), and the Reference Population (RP), defined as animals born from 2005 to 2022. The RP represents the current breeding population and was used for detailed evaluations of recent genetic trends and conservation status.
The R package OptiSel was used to verify the pedigree file before proceeding with further analyses. This package offers tools for accurate and efficient pedigree verification, ensuring reliable data for subsequent research (Wellmann, 2019). Inconsistencies in birth and removal dates were checked through the National Animal Database of the Ministry of Health (BDN, vetinfo.it, accessed 2024). Other packages were used for data modification and manipulation, such as dplyr (Wickham et al., 2021) and tidyverse (Wickham, 2019) for data handling, and data.table (Dowle and Srinivasan, 2021) for efficient data processing. For date manipulation, the lubridate package was applied (Grolemund and Wickham, 2011). Additionally, officer (Gohel, 2020) and flextable (Gohel, 2021) were employed for producing tables, while ggplot2 (Wickham, 2016) was applied to create visualizations and plots.
Pedigree analysis and R scripts for data analysis
Pedigree data were used to calculate demographic and genetic diversity parameters. The donkeys born from 2005 to 2023 were considered as the reference population (RP). The ‘ancestor population’ (ANC) refers to the total population whereas the term ‘reference population’ is used to denote the actual living population. In some plots, data have been subdivided using 2005 as break point, that is the date of last pedigree records analyzed in the paper by Rizzi et al. (2011) considering the same population.
The analysis was carried out using custom R scripts. The package pedigree (Coster, 2022) was used for handling pedigree data and computing inbreeding coefficients. For creating relatedness matrices and estimating non-additive genetic variances the package nadiv (Wolak, 2012) was used. For the estimation of several parameters like kinships, genetic contributions from ancestors, inbreeding coefficients, the native effective size, the native genome equivalent, pedigree completeness the package optiSel (Wellmann, 2019) was used. Then the package purgeR (López-Cortegano, 2021) was used for inbreeding-purging analysis of pedigreed populations. Including the computation of the inbreeding coefficient, partial, ancestral and purged inbreeding coefficients, and measures of the opportunity of purging related to the individual reduction of inbreeding load. In addition, functions to calculate the effective population size and other parameters relevant to population genetics are included. The package segmented (Muggeo, 2003) was used for fitting segmented regression models, identifying breakpoints, and estimating slope changes in linear models. Segmented regression provides insights into historical genetic events and breeding management strategies that may have impacted genetic diversity (Frankham, 2005).
• The analysis of the inbreeding coefficients was performed using two algorithms, FPED1 and FPED3, to capture the trends over time and provide insights into the dynamics of inbreeding. This computation was conducted utilizing the INBUPGF90 software version 1.47 (Aguilar and Misztal, 2008). The two methods both calculate inbreeding coefficients from pedigree data but differ in computational efficiency and sensitivity. The FPED1 algorithm uses a recursive algorithm, suitable for smaller datasets, providing a steady and gradual calculation of inbreeding. The FPED3 algorithm is optimized for larger datasets, offering faster calculations and capturing more fluctuations in earlier generations, making it more sensitive to changes in population structure over time, reducing redundant calculations and providing faster results.For the comparison of inbreeding coefficients (FPED3) among province groups and time periods, one-way ANOVA followed by Tukey’s HSD post-hoc test was performed.
The assumptions of normality of residuals (Shapiro-Wilk test) and homogeneity of variances (Levene’s test) were checked prior to analysis.
While residuals deviated from normality in both time periods, ANOVA was retained due to the large sample sizes. Variance homogeneity was satisfied for the Until 2005 group (p = 0.10), but not for the After 2005 group (p < 0.001). Results for the latter should therefore be interpreted with caution.
• optiSel (Wellmann, 2019): for selection optimization and analysis of genetic diversity. Several parameters like kinships, genetic contributions from ancestors, inbreeding coefficients, the native effective size, the native genome equivalent, pedigree completeness were estimated.
All the scripts used to generate figures and tables included in the manuscript are listed and detailed on Supplementary Material S4, codes are available on GitHub repository. (https://github.com/vincenzolandi/Martina_Franca_Donkey_Genetic_Analysis).
Results
Population structure
In the Martina Franca donkey breed, the population structure was analyzed through two distinct subpopulations: the total population (TP), and the reference population (RP), which comprises individuals born from 2005 to 2023. The population is characterized by 333 farms out of which around 74% have 1 or 2 animals.
Reproduction is primarily through natural mating. Artificial insemination is used only occasionally and exclusively with fresh semen. The use of frozen semen is not practiced due to poor cryopreservation outcomes in donkey semen.
The analysis, detailed in Table 1, revealed that 1487 full-sibling families were identified in the TP. As the RP is a subset of the TP, these differences are expected and have not been subjected to statistical testing. All values are reported for descriptive purposes only.
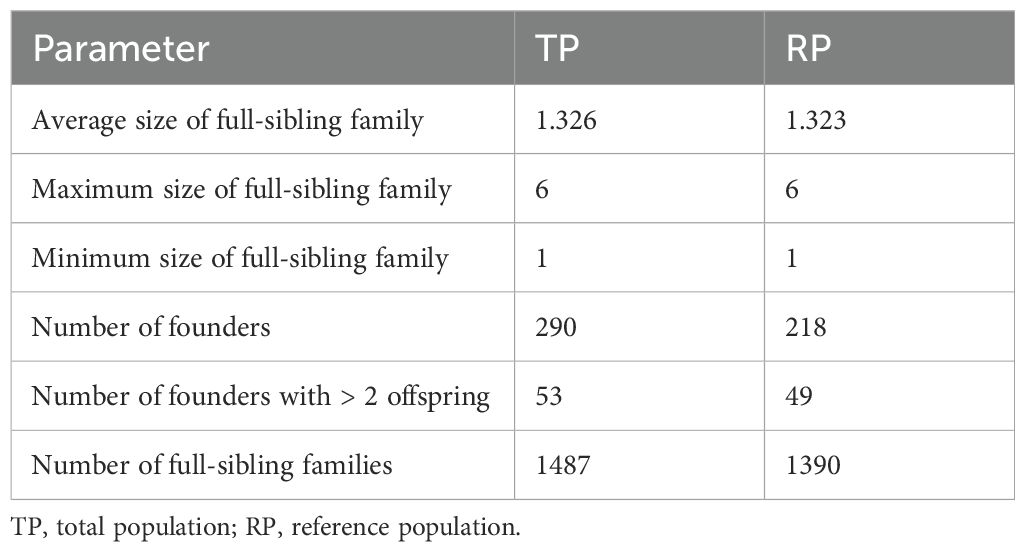
Table 1. Summary of family statistics for donkeys in total population and reference population.
Figure 1 illustrates the number of animals by province based on their last registered herd. The data show that the Martina Franca donkey population is overwhelmingly concentrated in the Apulia region, especially in Taranto, Foggia, and Brindisi. Outside Apulia, most herds are amateur-based and typically do not contribute actively to reproduction.”
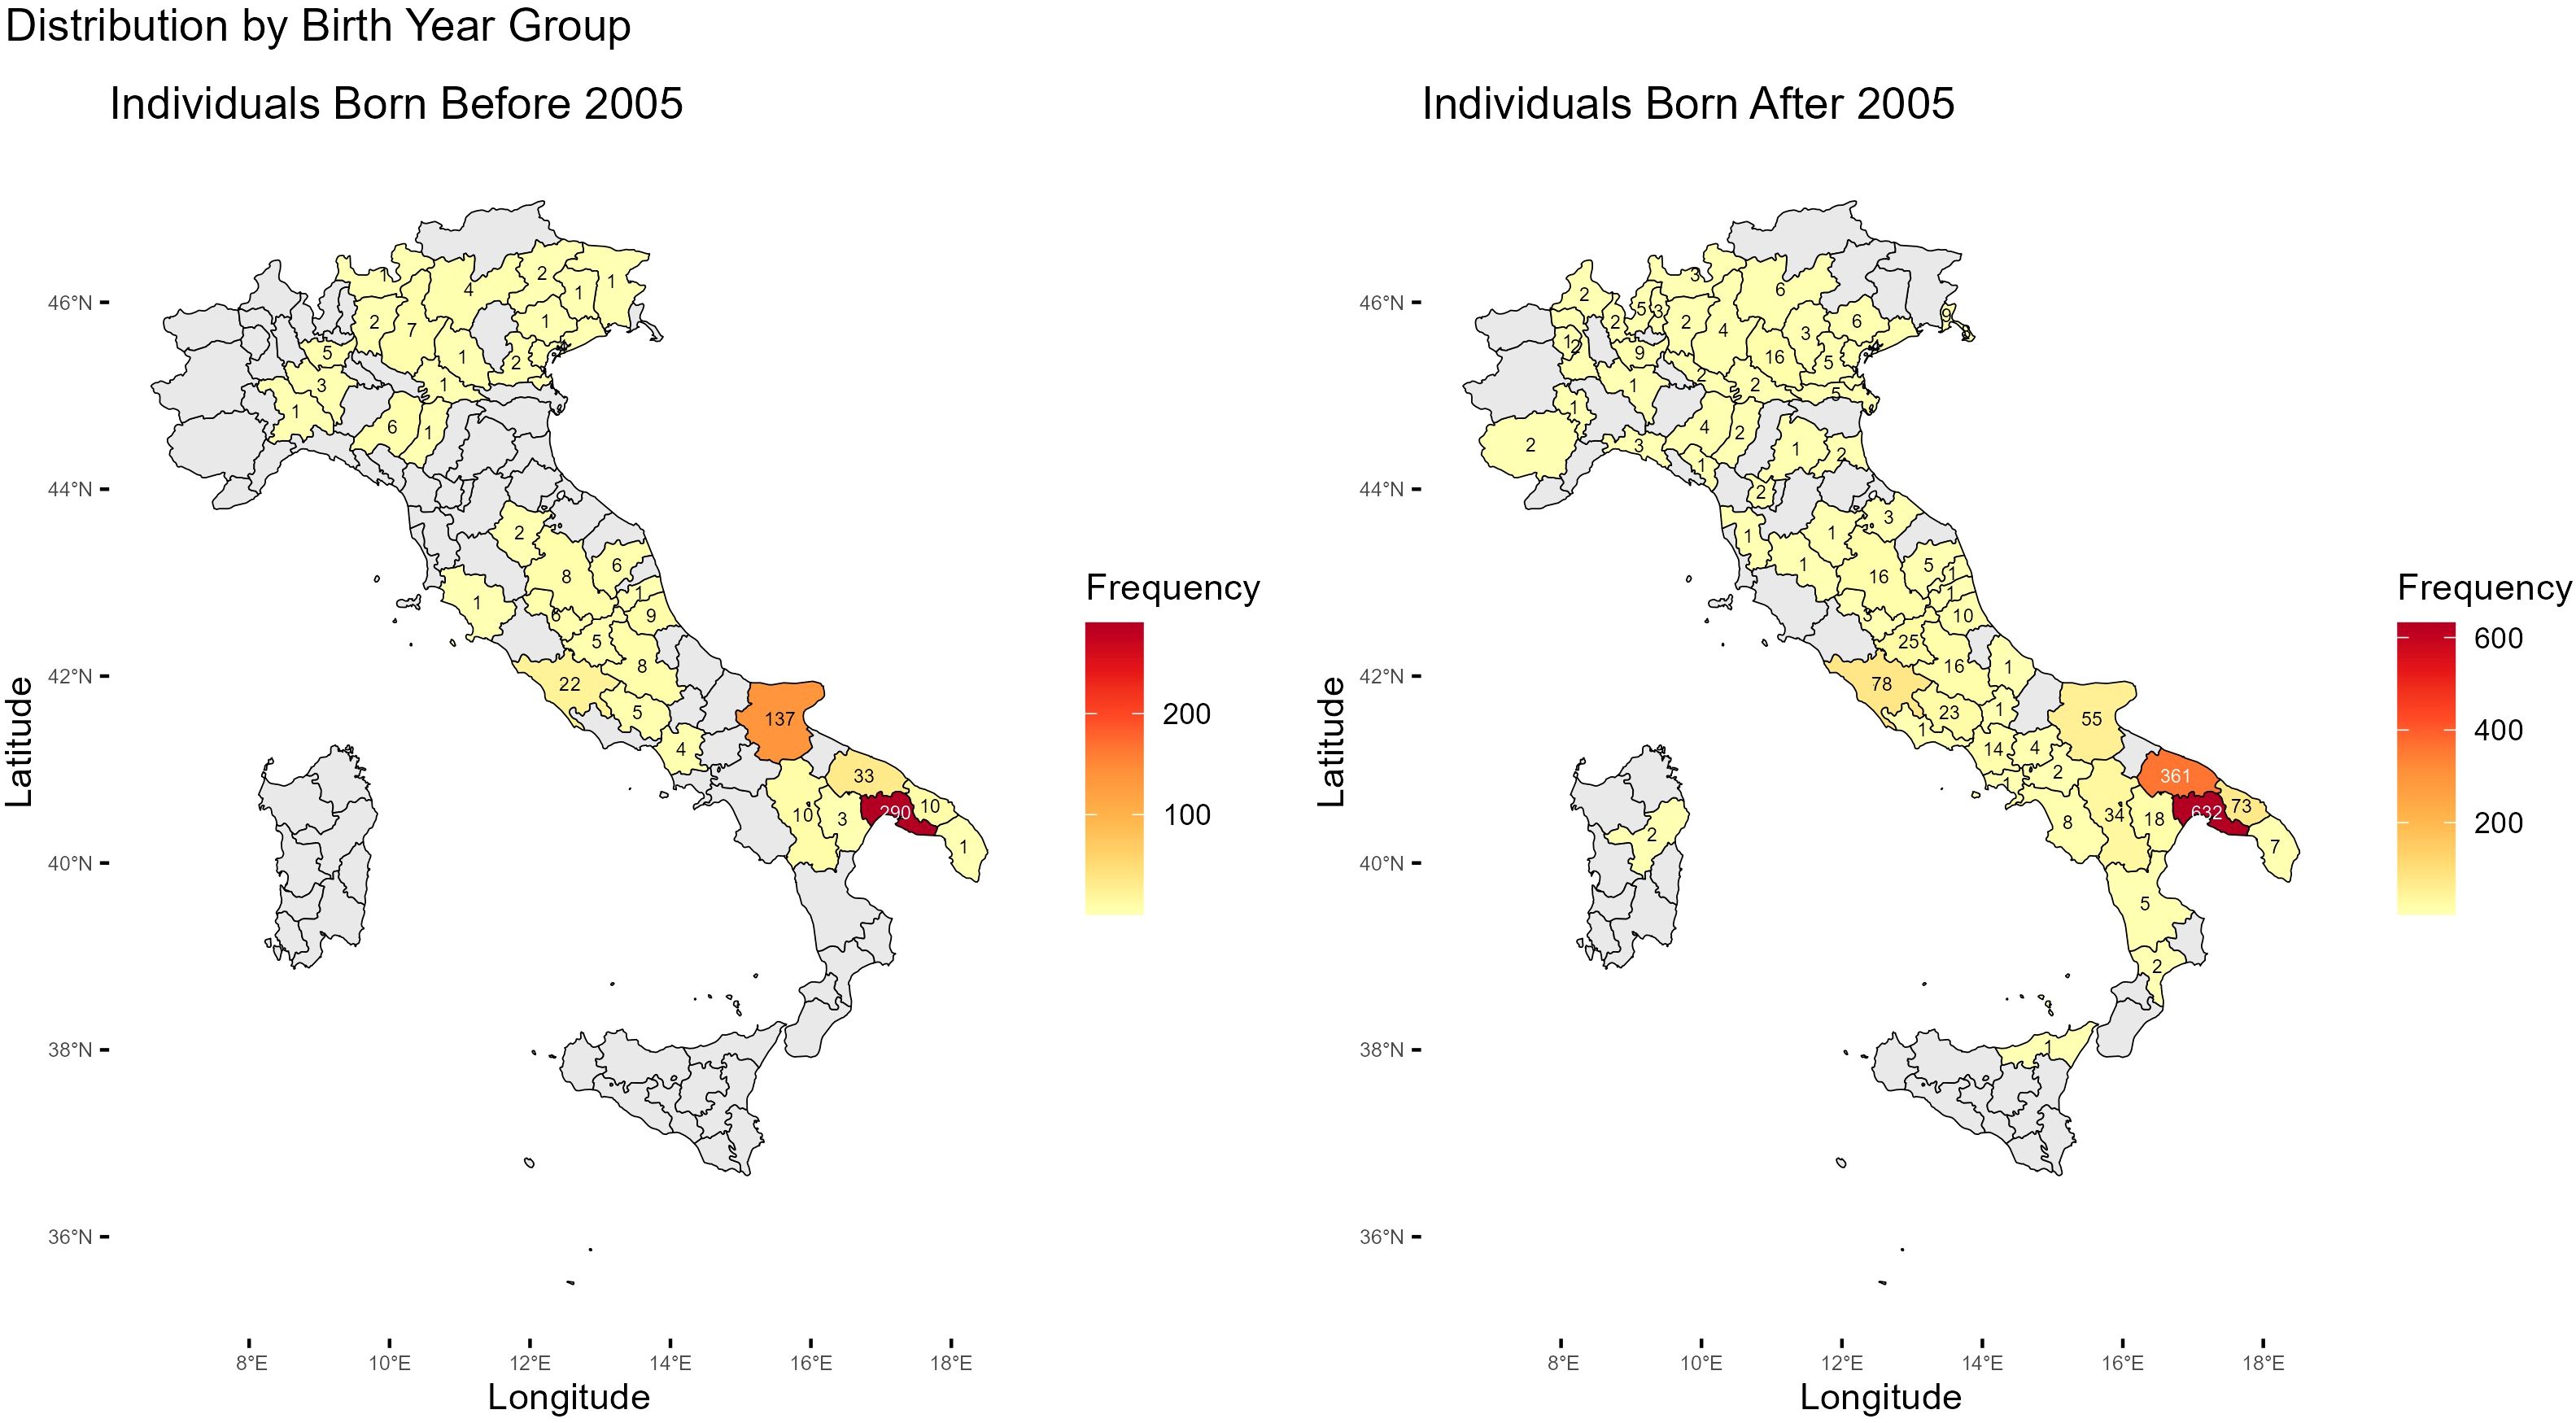
Figure 1. Geographic distribution of Martina Franca donkey births across Italian provinces before and after 2005. The color gradient indicates the frequency of individuals born in each province. Labels within each province denote the exact number of births.
The average size of these full-sibling families was 1.33, with a maximum of 6 and a minimum of 1. Within the RP, 1066 full-sibling families were observed, with an average size of 1.38, and similar minimum and maximum sizes.
The maximum size of a full-sibling family was consistent across all populations (6), and the minimum size remained 1.
Further analysis of the founders revealed a clear numerical difference between the subpopulations. The TP included 290 founders, while the RP had a reduced number of only 218 founders. Of the founders, those producing more than two offspring were slightly fewer in the RP (49), compared to the TP (53).
The analysis of the donkey pedigree data, as illustrated in Figure 2, revealed several trends related to population structure, sex distribution, and the female-to-male ratio over time.
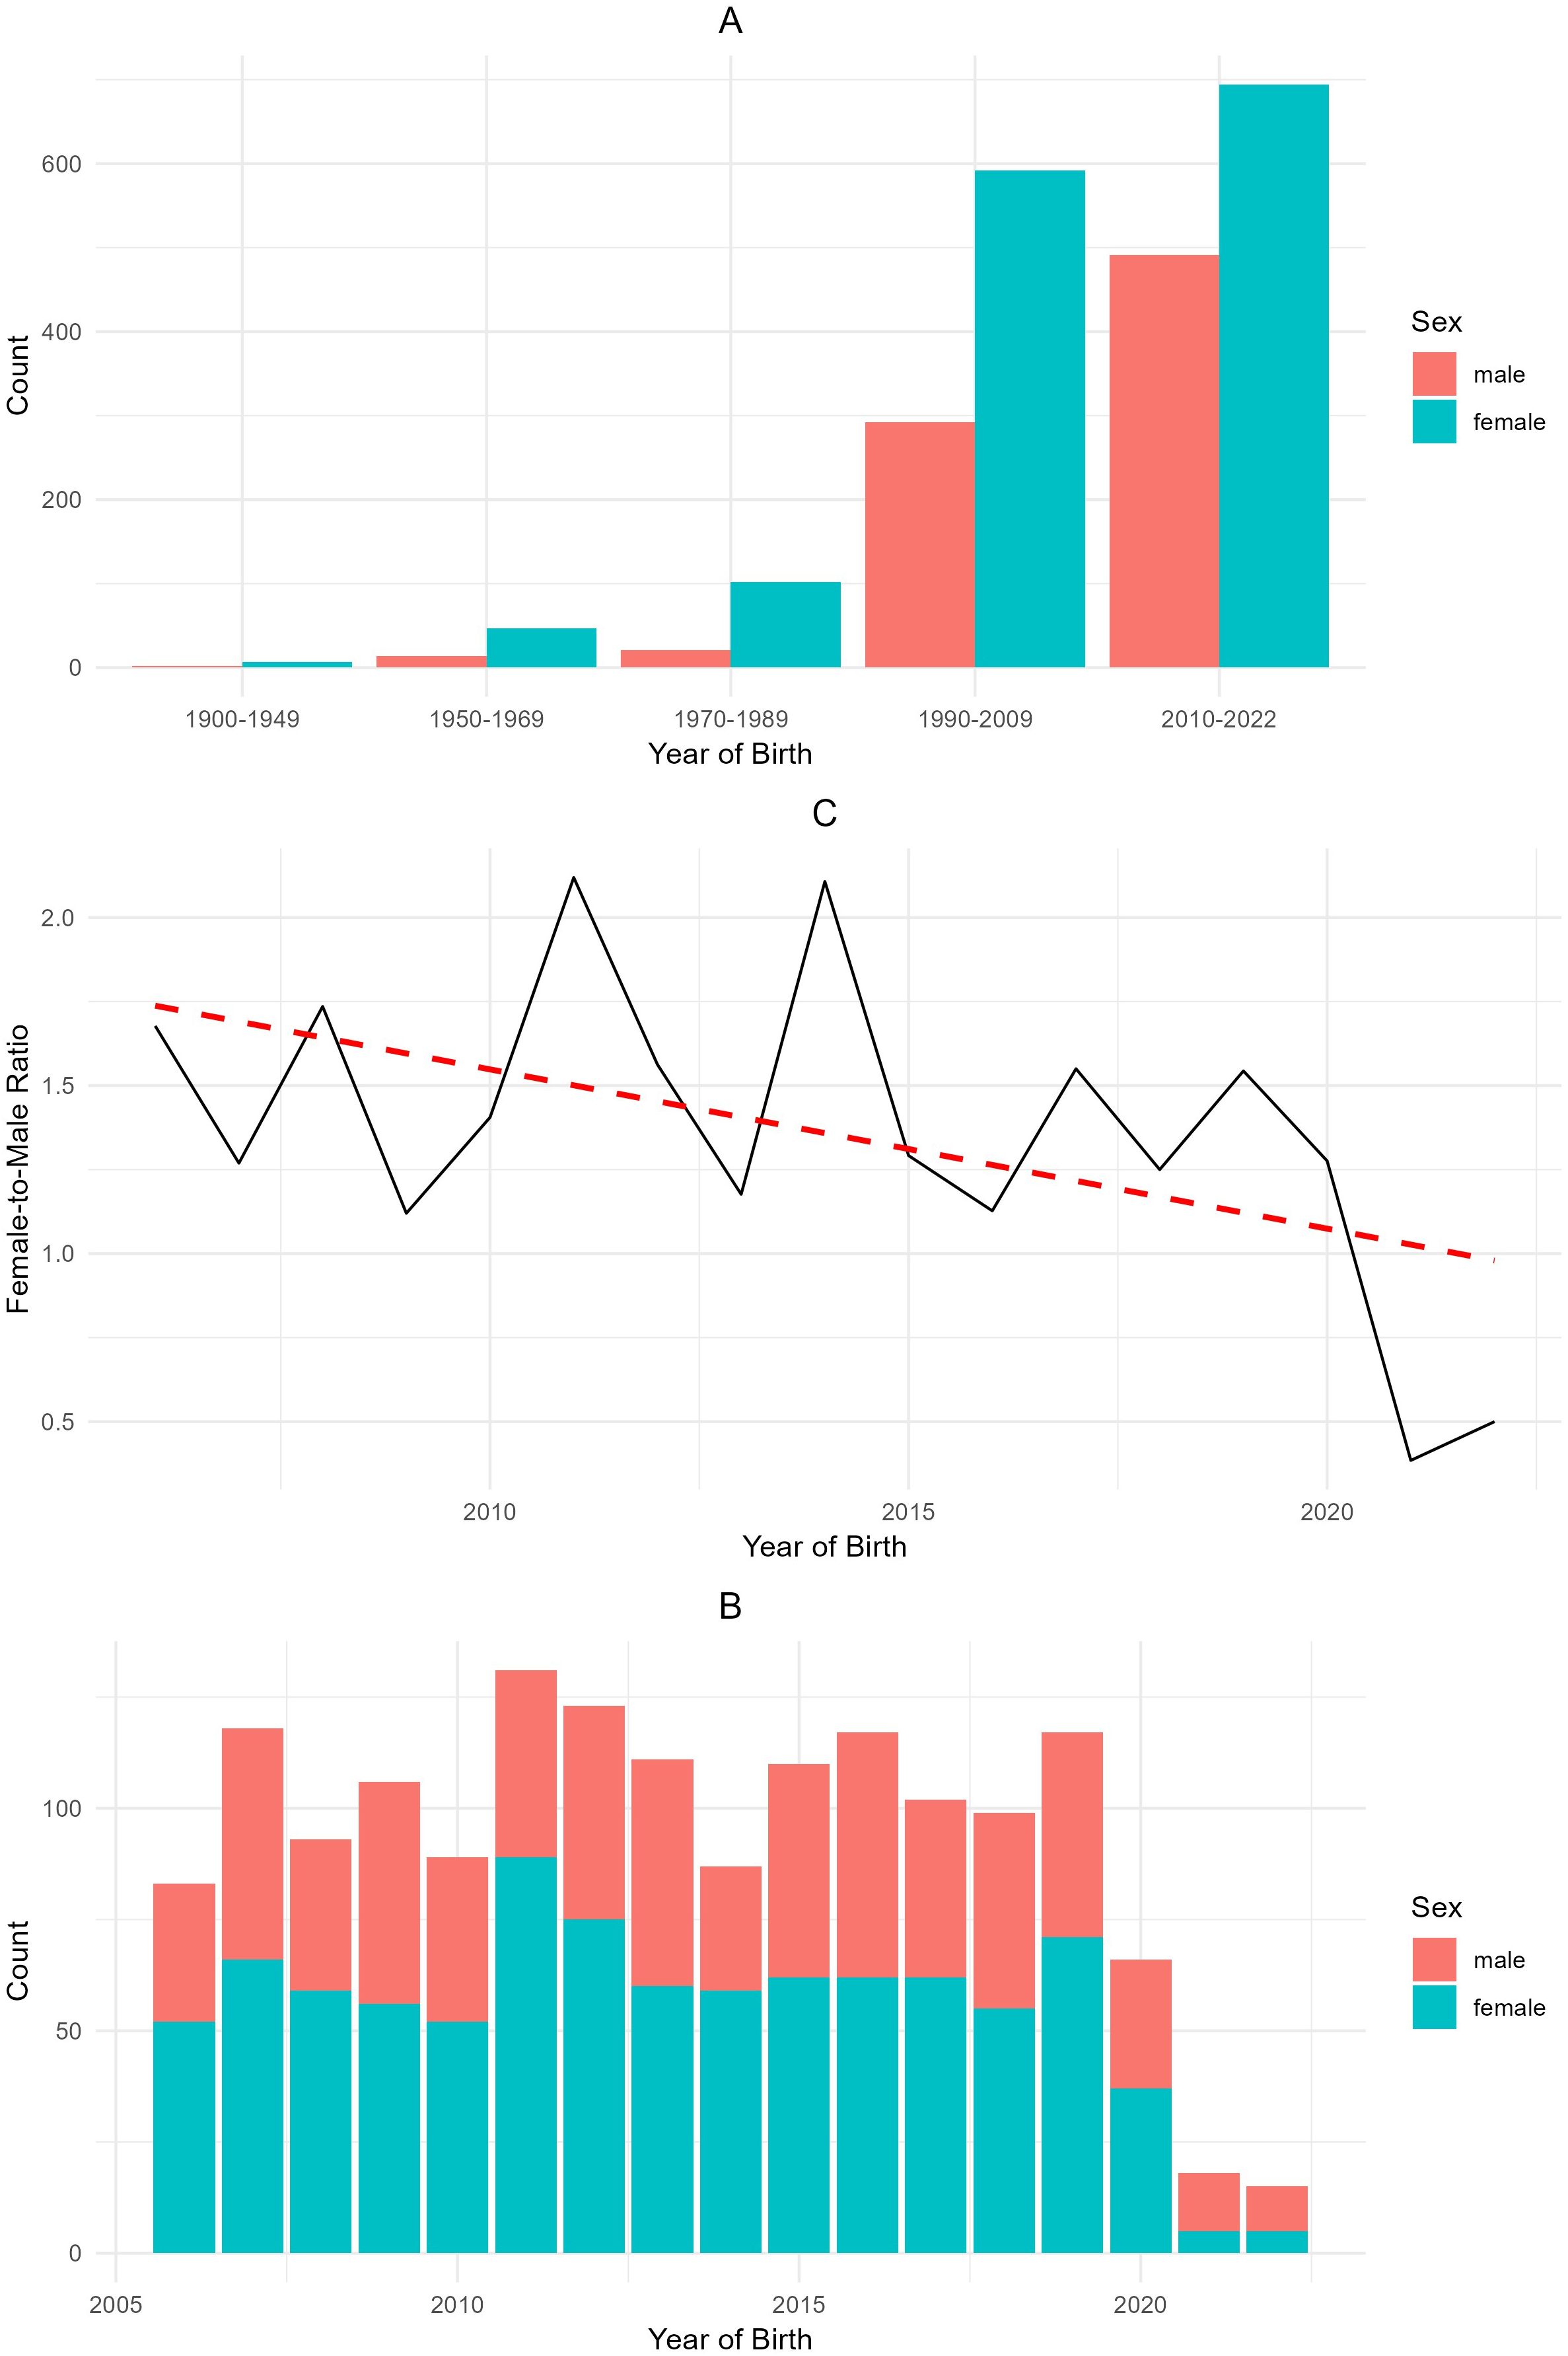
Figure 2. (A) Number of donkeys in the Total Population (TP) born over time, (B) number of foals born over time since 2005, and (C) female-male ratio of newborn foals (or total donkey population) from 2005 to 2022.
The distribution of the total population of donkeys by year of birth and sex (Figure 2A) shows a marked increase in the number of foalings is evident starting from 1970 (30 males and 100 females), with a significant rise observed between 1990 and 2022 (300–500 males and 600–700 females, respectively). The data showed that the number of females remained consistently higher than males throughout the observation periods.
The annual birth counts of male and female donkeys from 2005 to 2022 are shown in Figure 2B. While the sex ratio fluctuates yearly, data showed a peak in the number of births in 2010 (>125) followed by a decline until 2015 (about 85). An increase in the number of births was also observed in 2019 (>115). The low values observed for the years 2021 and 2022 can be attributed to the limited availability of data resulting from a change in the studbook administration from A.I.A. (Associazione Italiana Allevatori) to A.N.A.M.F.
The female-to-male ratio by year of birth is represented in Figure 2C. The ratio started above 1.5 in earlier years but declined steadily, approaching a 1:1 ratio by 2020. Although fluctuations are present, the overall trend, indicated by the red trend line, shows a decline in the female-to-male ratio over time, suggesting a trend toward a more balanced sex ratio in recent years.
Pedigree quality
Figure 3 depicts the number of maximum generations traced (MG), the average complete generations (CG), and the equivalent of complete generations (EG) in the RP. Figure 3A shows the number of Maximum Generations traced (MG) within the Reference Population (RP). The majority of individuals have either 1 or 2 maximum generations traced, with females consistently outnumbering males in both categories. The count of individuals with 3 generations traced is significantly lower for both sexes, but the same trend continues, with females exceeding males. Only a small number of individuals have 4 or more traced generations, and the difference between the sexes persists, as previously observed, due to the prevalence of females in the population.
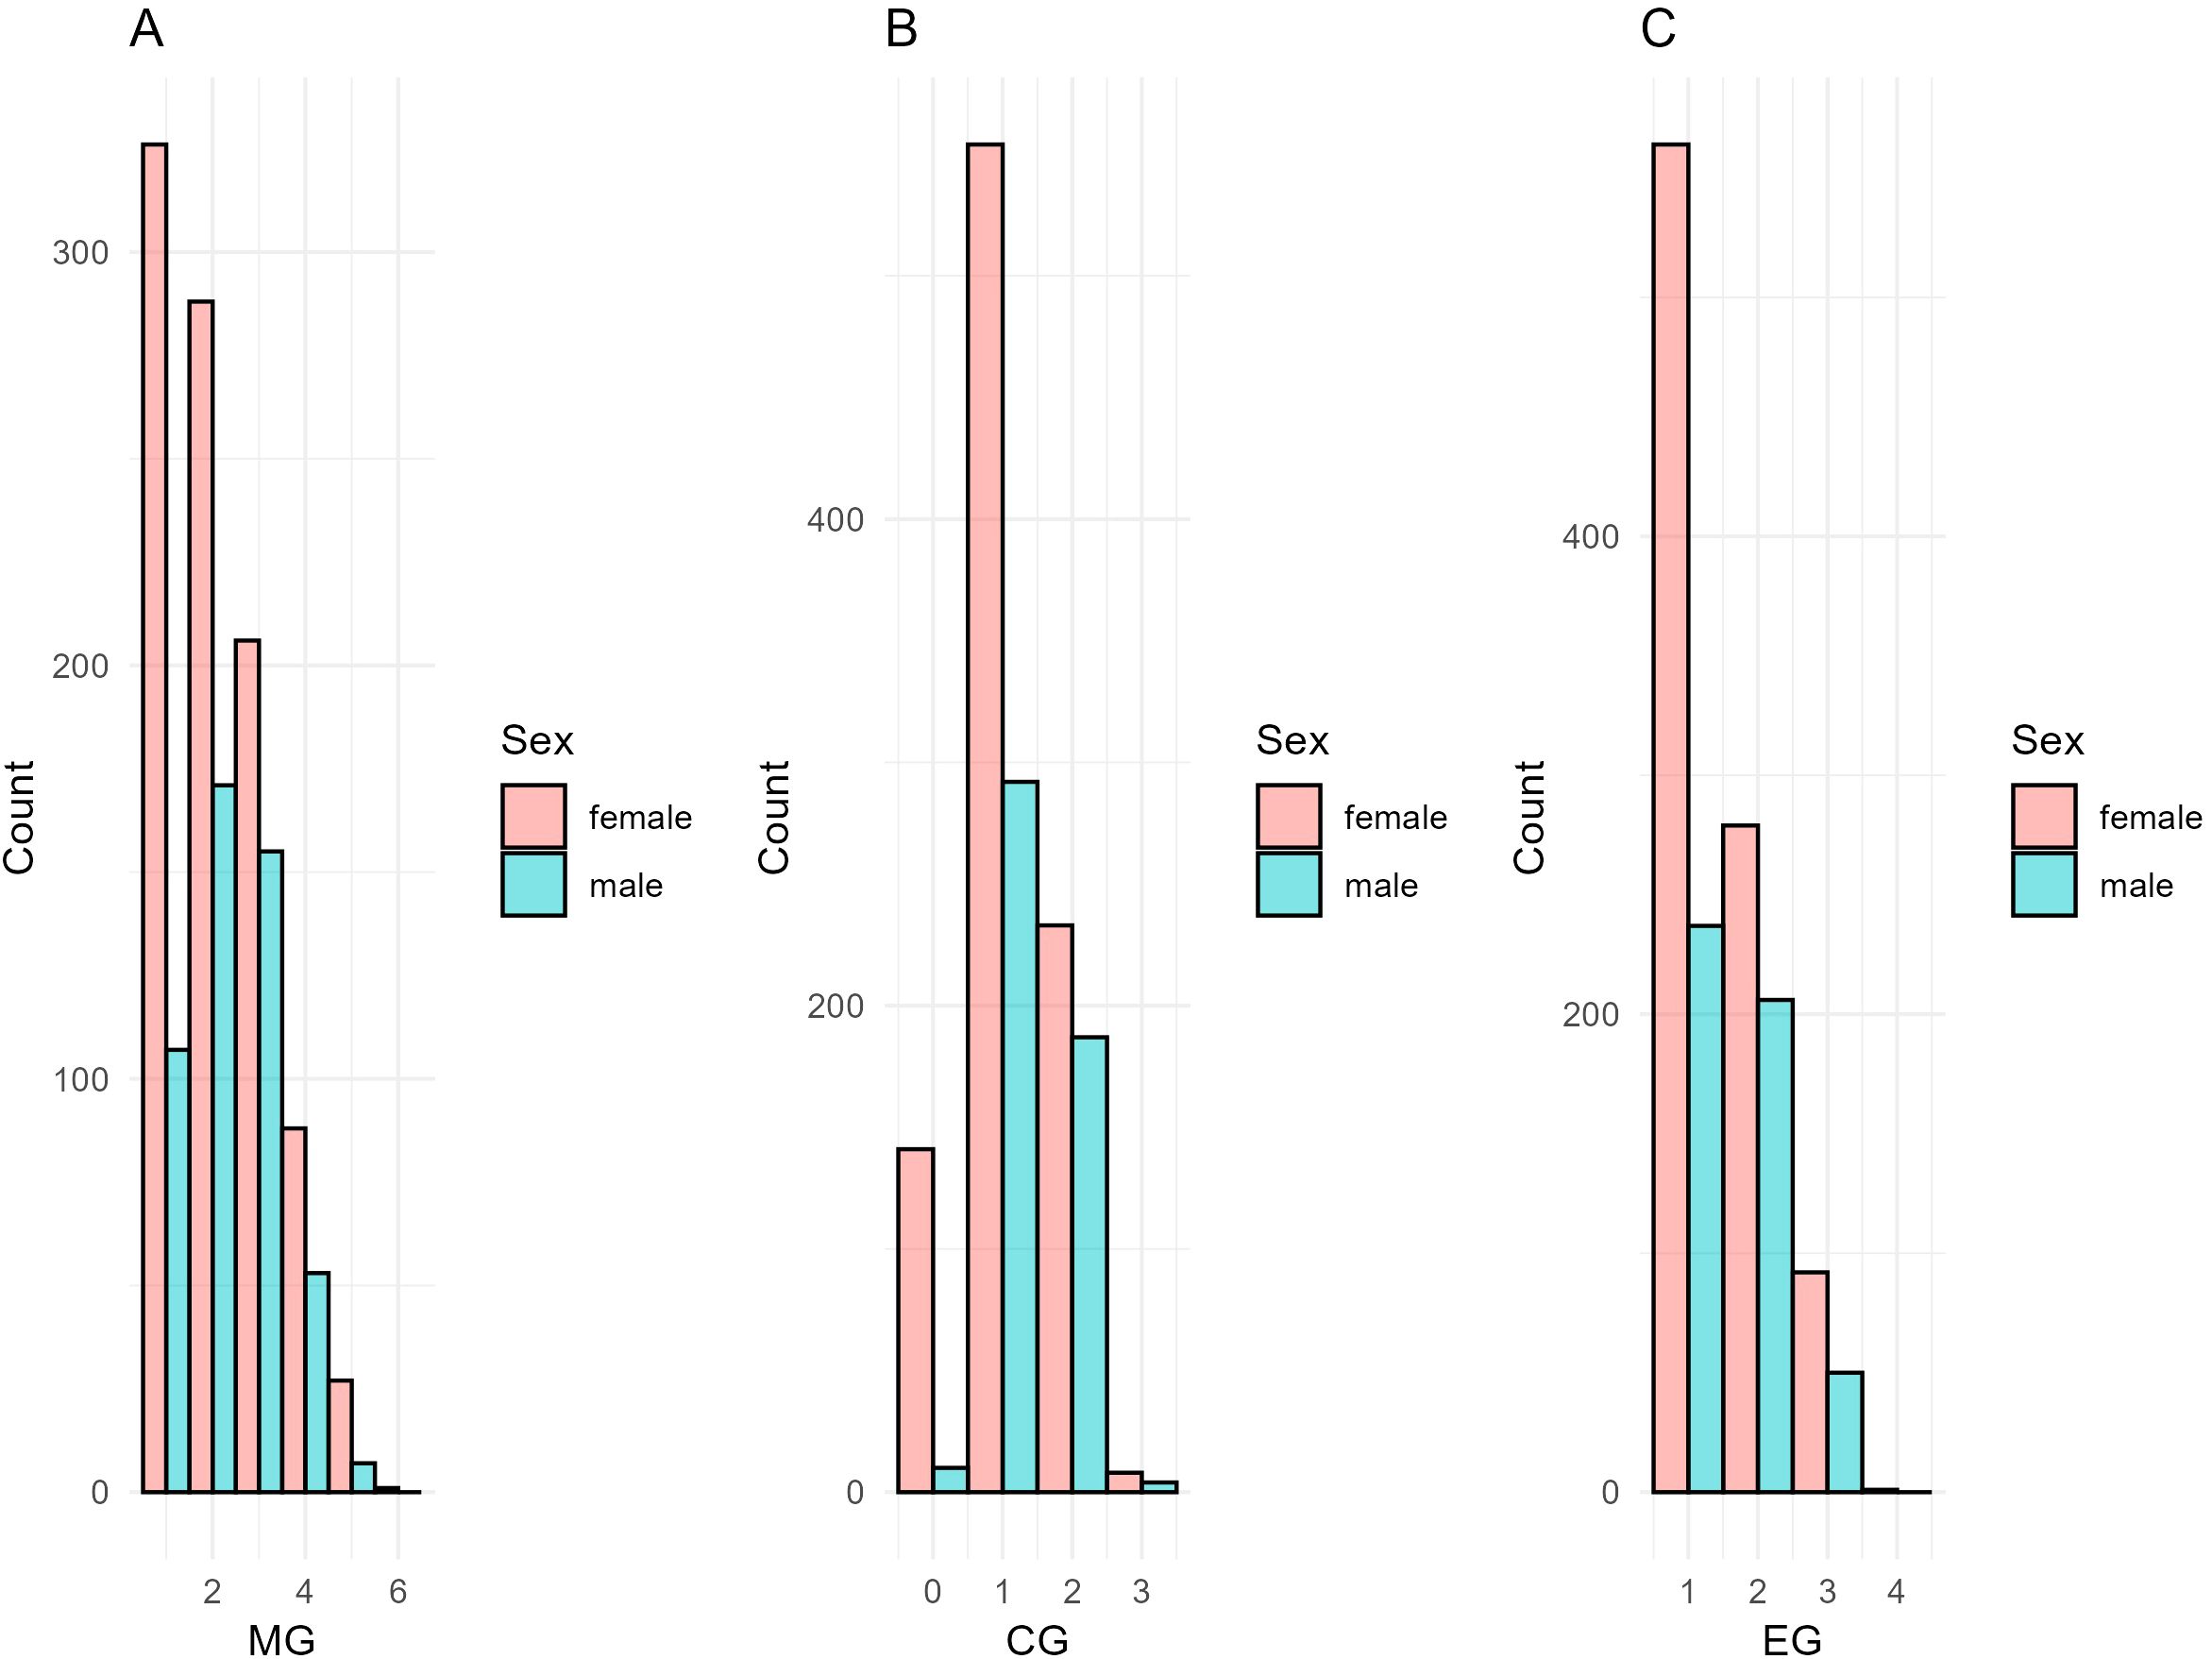
Figure 3. (A) Number of Maximum Generations Traced (MG), (B) Average Complete Generations (CG), and (C) Equivalent of Complete Generations (EG) for donkeys in the Reference Population (RP).
The Average Complete Generations (CG) for the RP is illustrated in Figure 3B. The highest count occurs in the 1–2 complete generations category, where females again outnumber males (>500 and above 300, respectively). Beyond 2 complete generations, the count decreases sharply (above 250 for females and < 200 for males), and no individuals are observed with more than 3 complete generations. This result indicates a relatively shallow depth in the genealogical data for most individuals in the RP.
The majority of individuals for the Equivalent of Complete Generations (EG) within the RP (Figure 3C), fall within the 1–2 equivalent generations range, with females slightly outnumbering males (above 550 and 250, respectively). The number of individuals with 3 equivalent generations drops significantly (above 300 for females and 200 for males), but the trend of females exceeding males remains. No individual has more than 4 equivalent generations, further emphasizing the limited depth of the pedigree information.
Figure 4 displays the changes in pedigree completeness levels across generations for both the RP (living population) and ANC (ancestor population). In the RP, the pedigree completeness level starts at 100% in the first generation and decreases gradually, with a more noticeable drop after the 4th generation. By the 6th generation, the completeness drops to around 25%. In the ANC population, the trend is similar, with pedigree completeness starting at 100% and declining steadily. However, the decline in the ANC population is more gradual across generations, reaching approximately 10% by the 7th generation. Both populations exhibit a steep drop-off after the 6th generation, but the ANC population maintains a slightly higher completeness in the earlier generations compared to the RP.
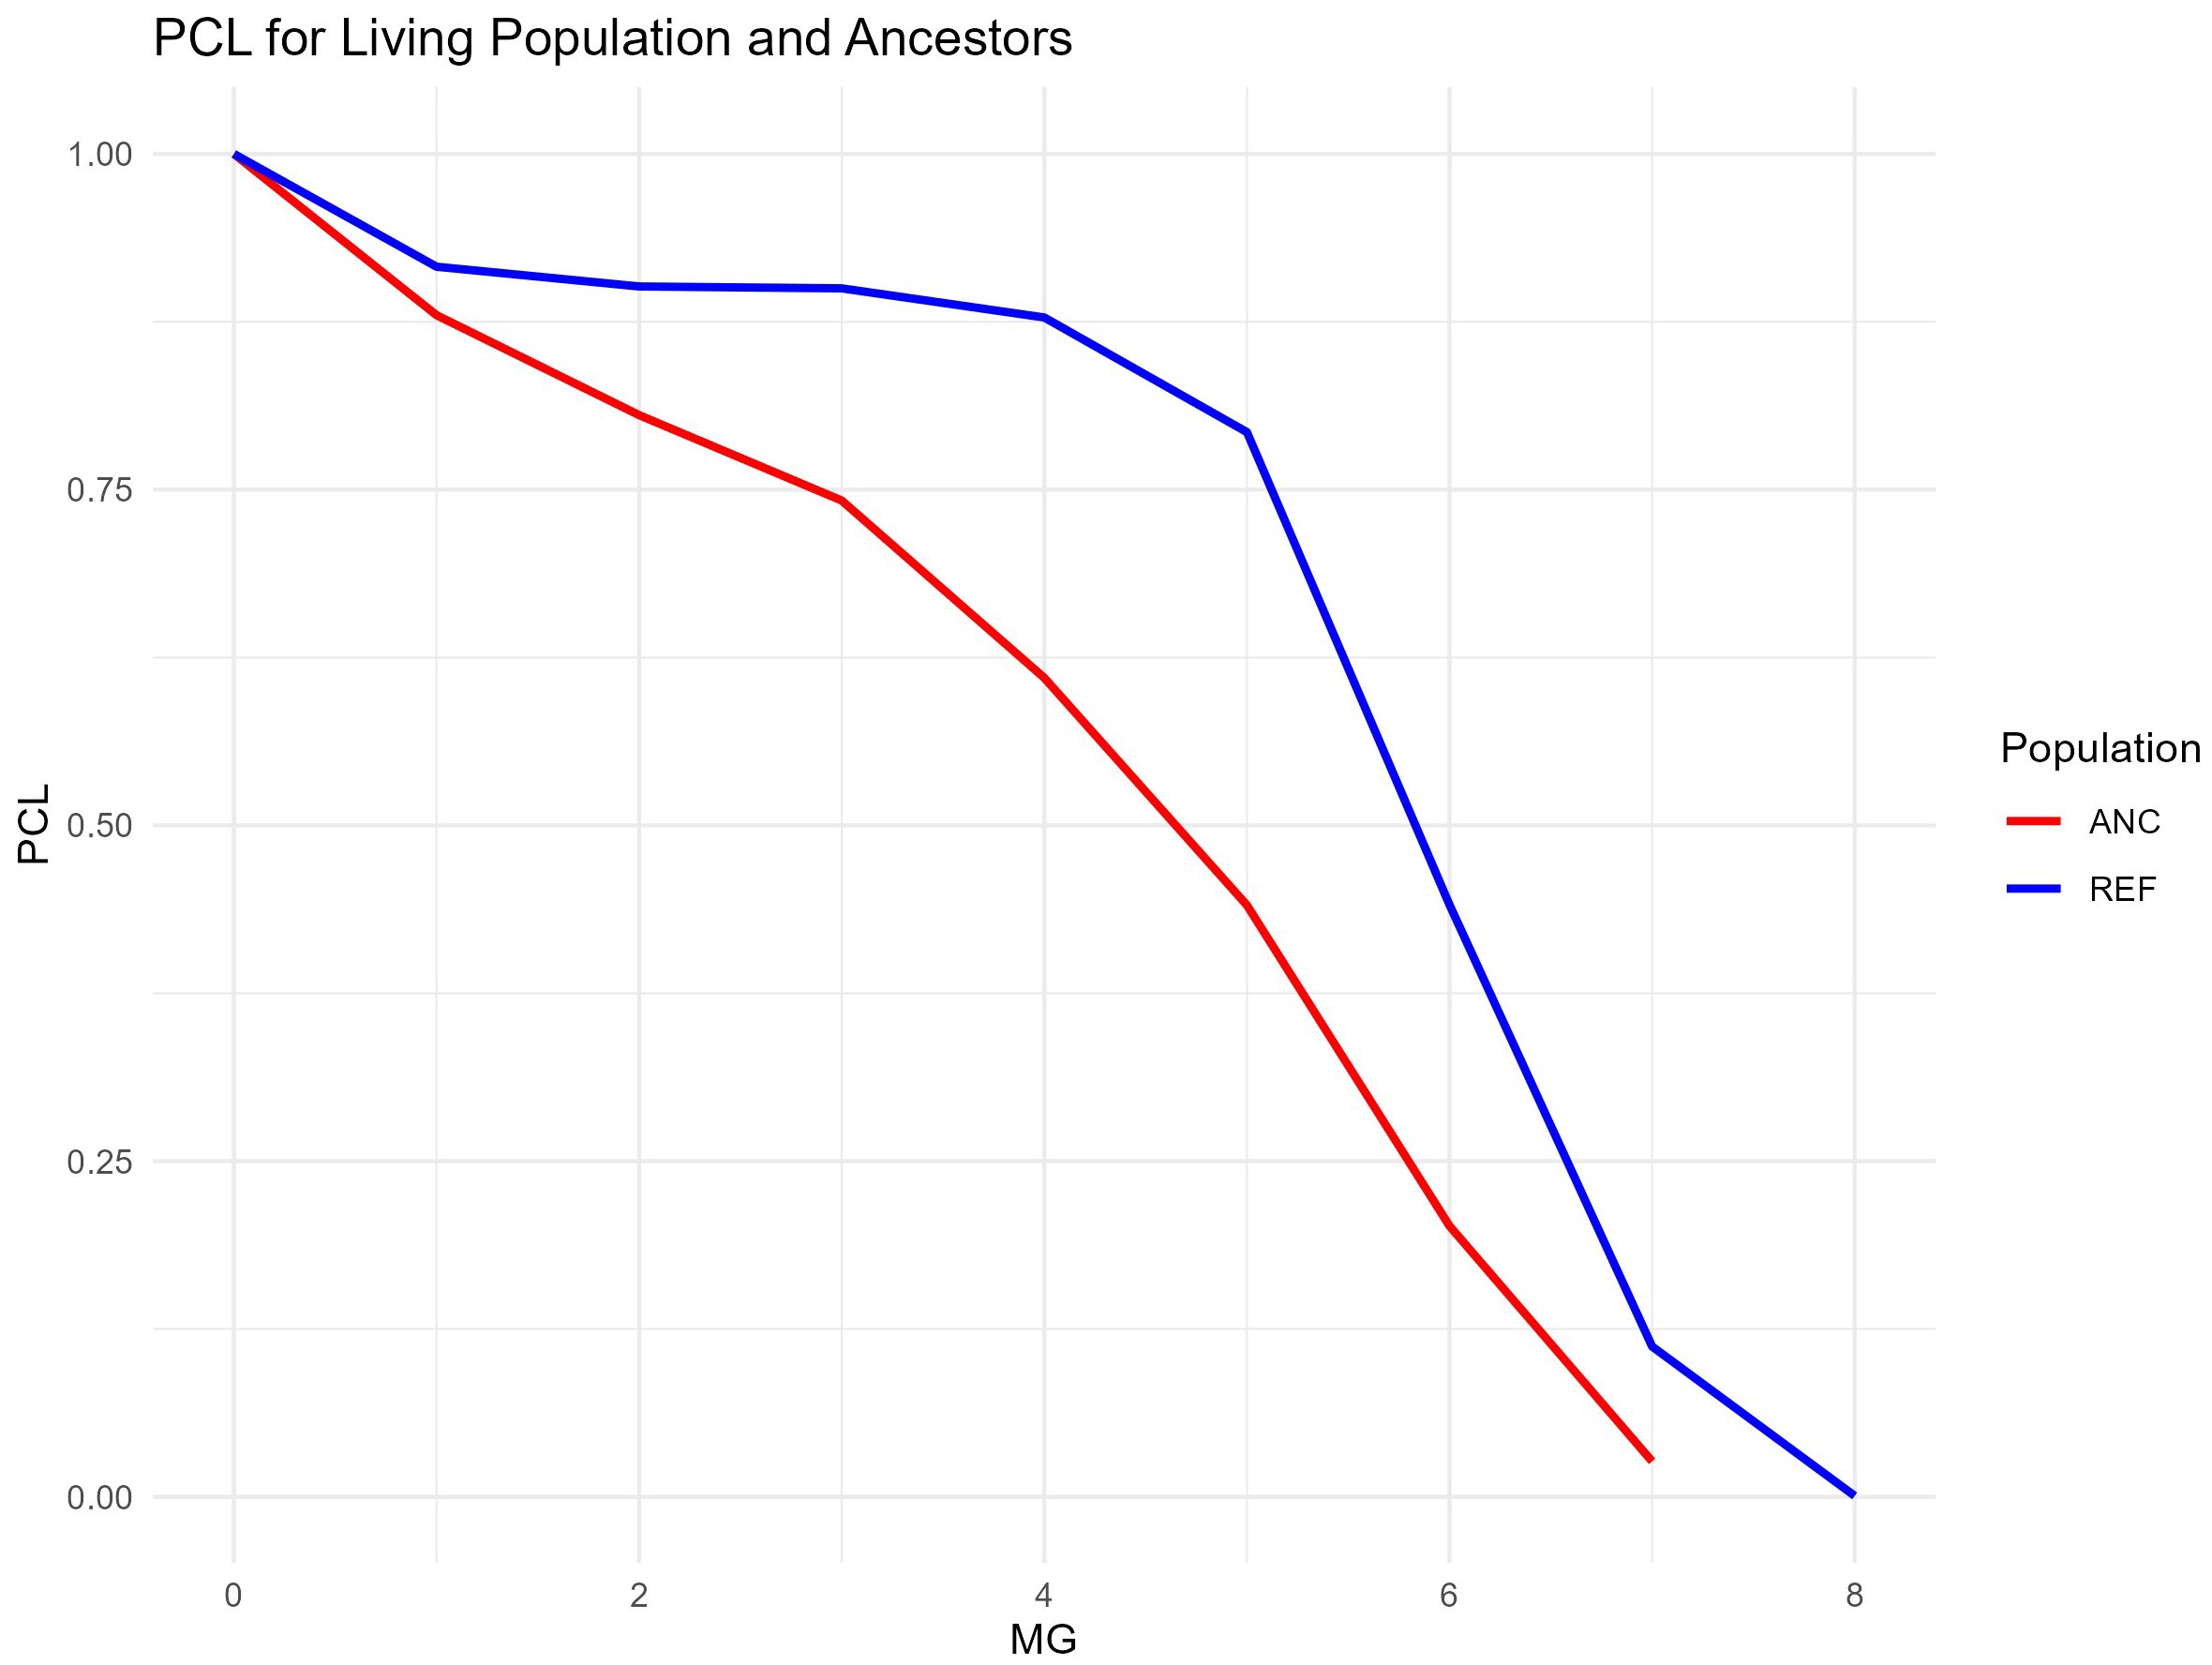
Figure 4. Pedigree Completeness Levels (PCLs) over Maximum Generations Traced (MG) for Ancestors (ANC) and donkeys in the Reference Population (RP).
Generation interval
The values of the generation intervals for the various paths are presented in Table 2. Since the Reference Population (RP) is a subset of the Total Population (TP), no statistical tests were performed to compare TP and RP values, which are presented for descriptive purposes only.
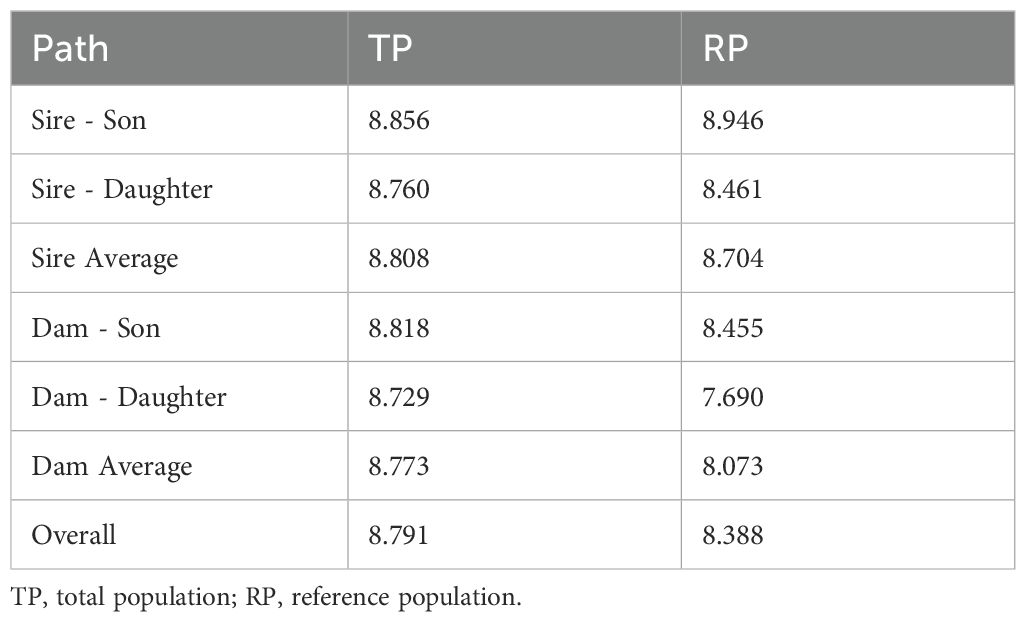
Table 2. Values of generation intervals for each path, calculated for donkeys in total population and reference population.
The longest generation interval was observed for the Sire-Son path, with values of 8.86 years for the Total Population (TP) and 8.95 years for the Reference Population (RP). This indicates that sires were generally older when producing male offspring, suggesting a preference for using more proven, older males for reproduction, which extends the interval between generations. Similarly, the Sire-Daughter path shows slightly shorter intervals than the Sire-Son path, with 8.76 years for TP and 8.46 years for RP. This indicates that sires were somewhat younger when producing female offspring compared to sons, though this slight difference may reflect random variation or recent selection trends. The consistency in generation intervals between TP and RP for sires suggests stable breeding practices over time, favoring sires at a relatively older reproductive age.
On the other hand, Dam-Son and Dam-Daughter paths show shorter generation intervals compared to those for sires. The Dam-Son path has intervals of 8.82 years for TP and 8.45 years for RP, indicating that dams generally reproduce earlier than sires, especially when producing male offspring. This trend is even more pronounced in the Dam-Daughter path, where the shortest generation intervals were observed, with values of 8.73 years for TP and 7.69 years for RP. These shorter intervals for dams may reflect a reproductive pattern in which females tend to breed earlier, particularly when producing female offspring, further shortening the generational time frame.
When comparing the average generation intervals, sires consistently show longer intervals than dams, with an average of 8.81 years for TP and 8.70 years for RP. In contrast, dams exhibit shorter intervals, averaging 8.77 years for TP and 8.07 years for RP. This reflects a general tendency toward earlier reproduction among females compared to males, with dams contributing to shorter generational cycles, likely due to earlier breeding ages. The values of 8.79 years of TP and 8.39 years for RP are shown in the overall average generation interval. Overall, the generational timing appears relatively stable across these populations.
Genetic diversity
Inbreeding
The analysis of the inbreeding coefficient performed using the two algorithm (FPED1 and FPED3) revealssimilar overall trends, despite some variations in the early years.
In Figure 5, the red line represents the inbreeding coefficients calculated using FPED1, while the green line shows FPED3. The FPED1 method produces a more gradual and steady increase in inbreeding over time, while FPED3 exhibits more fluctuation, particularly in earlier generations. This suggests that the different algorithms capture inbreeding differently in the early population stages, with FPED3 possibly being more sensitive to changes in breeding practices or population size. However, both methods converge toward similar values in recent years, indicating a general trend of increasing inbreeding across the population.
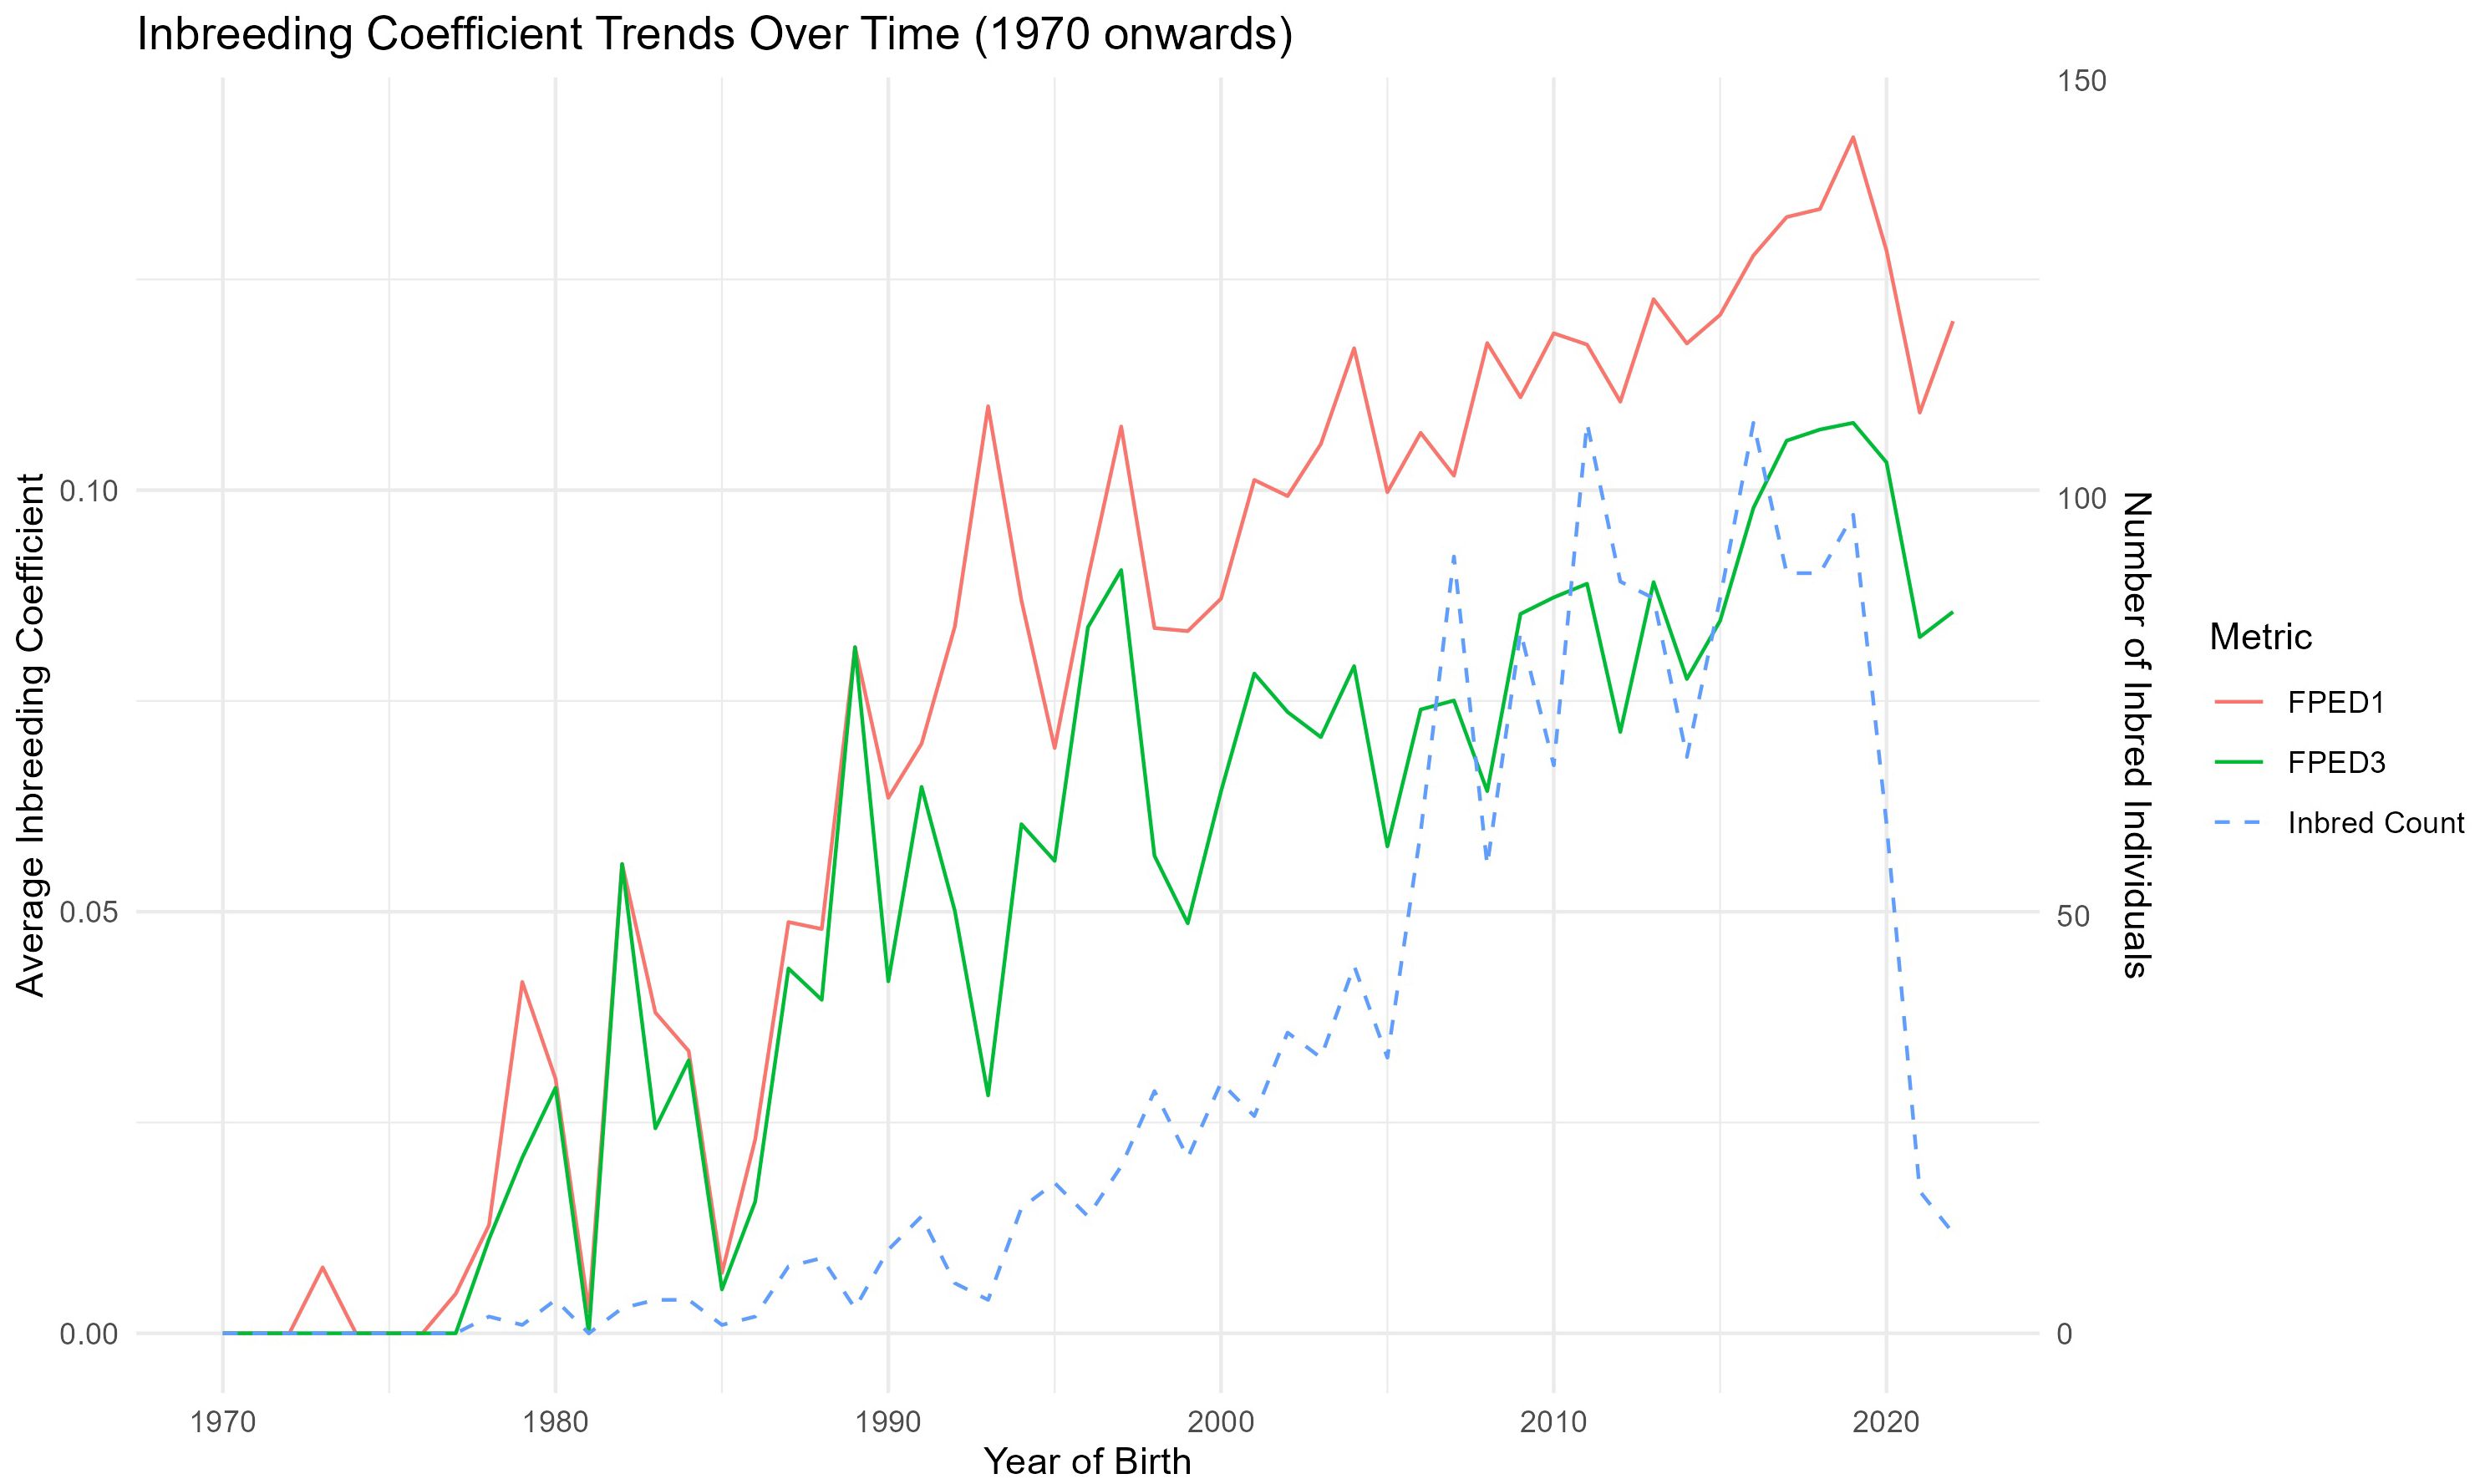
Figure 5. Pedigree-based inbreeding coefficient trend according to FPED1 (Aguilar algorithm) and FPED3 (Meuwissen and Luo algorithm) methodology, and count of inbred individuals per year, from 1970 to 2022, for donkey population.
To further understand the inbreeding dynamics, segmented regression analysis was conducted to identify key breakpoints where shifts in inbreeding trends occurred. These breakpoints, shown in Figure 6, reveal significant periods of change. For instance, the period between 1982 and 1985 saw a slight decline in inbreeding (y = -0.006), suggesting possible efforts to control inbreeding during this time. Conversely, between 1985 and 1989, the inbreeding coefficient increased sharply, with a slope of 0.015. This period reflects a lack of central management. The available males often came from the same breeding farms and no artificial insemination was planned. Breeders were not able to optimise the choice of stallions, with a consequent increase in inbreeding.
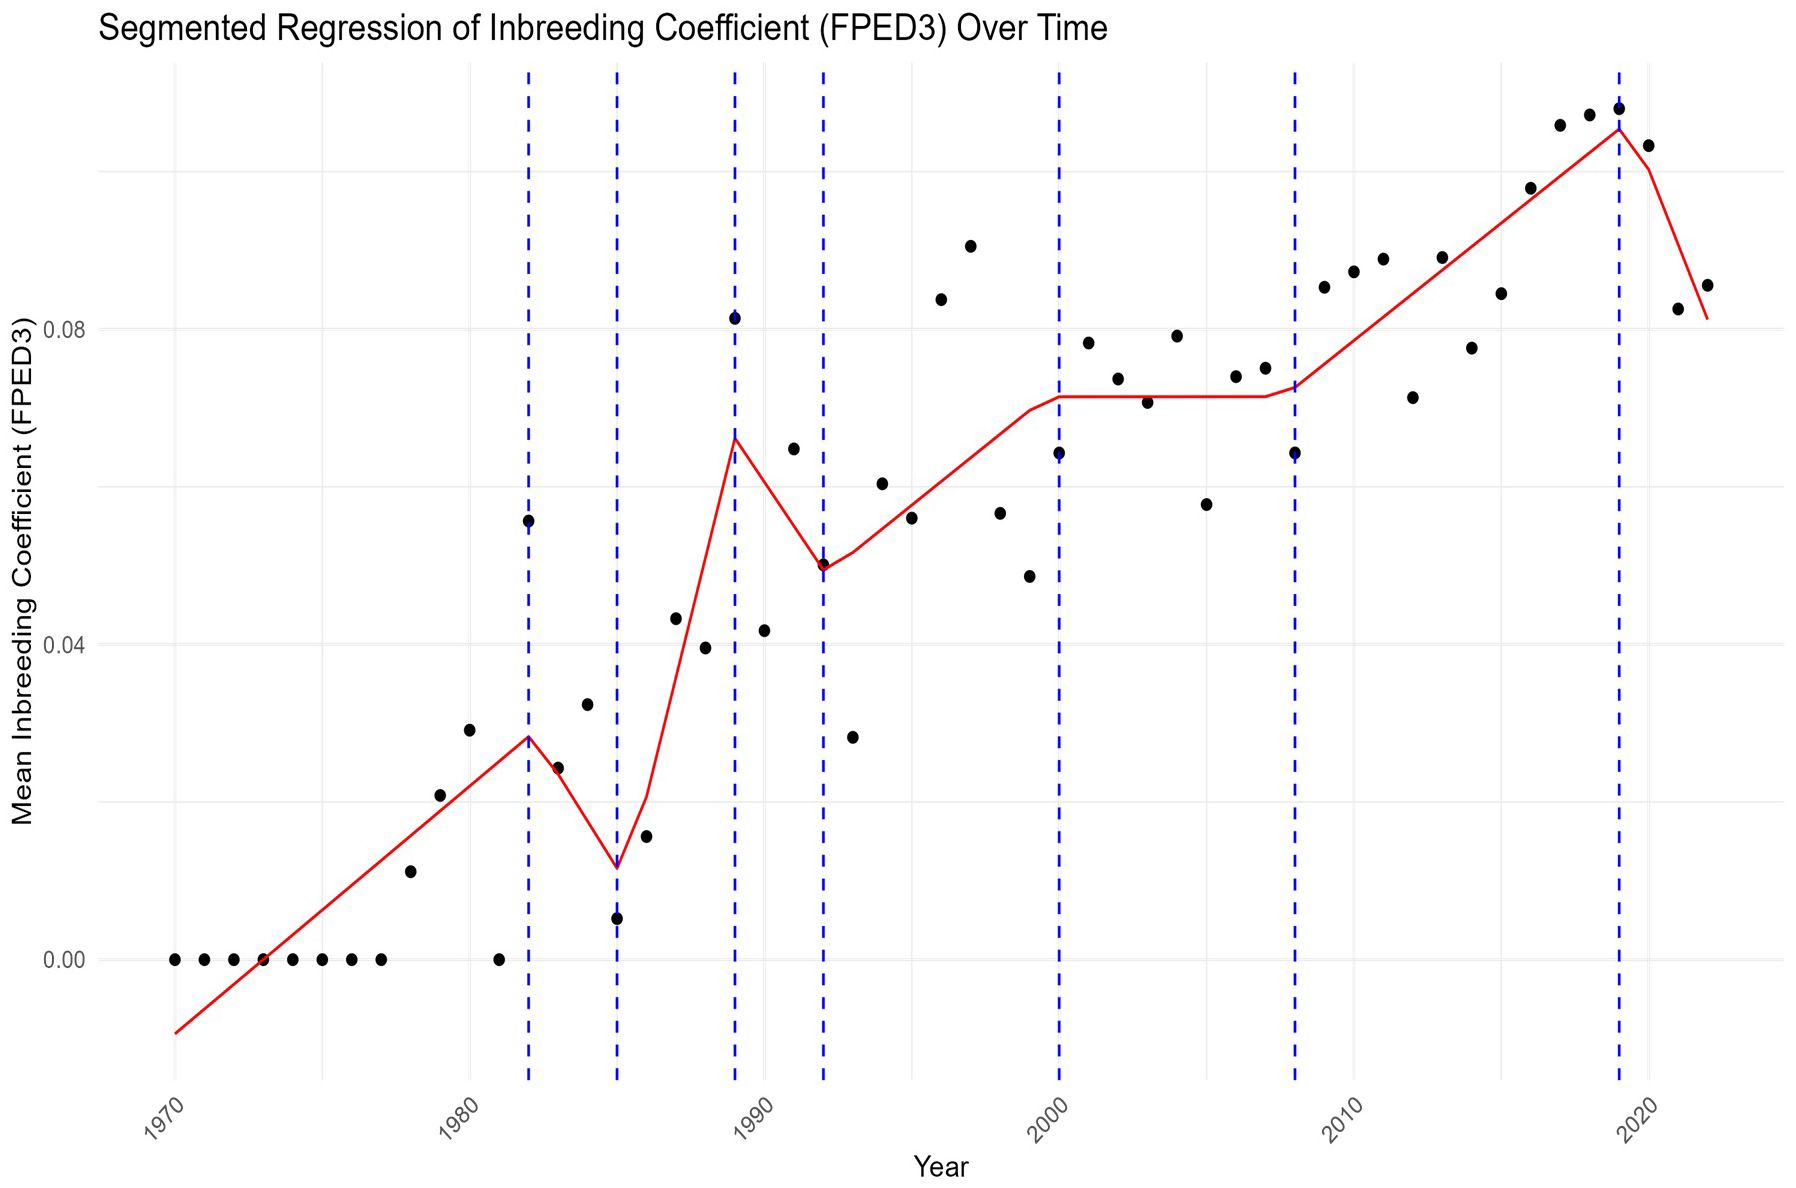
Figure 6. Segmented Regression of Inbreeding Coefficient according to FPED3 (Meuwissen and Luo algorithm) for donkeys over time.
After the year 2008, the inbreeding coefficient stabilized, showing minimal increases (y = 0.003), likely due to breeding management aimed at maintaining genetic diversity. Interestingly, after 2019, a small decline in the inbreeding coefficient is observed (y = -0.01), potentially indicating recent efforts to introduce new genetic lines or reduce inbreeding through more diverse breeding strategies.
The distribution of inbreeding coefficients over time, as shown in Figure 7, reveals a bimodal pattern. This bimodal distribution suggests that while most individuals maintain relatively low levels of inbreeding, there is a portion of the population at risk of high inbreeding. A significant number of individuals show zero or low levels of inbreeding, ranging from zero to 0.05. Between 0.05 and 0.2 the distribution suggests that most of the animals are in the medium inbreeding range. It also can be observed that a very small number of animals exhibit a value above 0.2 and below the density value of 0.5. Despite this, the graph indicates a significant level of inbreeding, exceeding 30%, particularly after attempts to improve breed management post-2005. The presence of individuals with high inbreeding coefficients highlights the need for ongoing management interventions to prevent further increases in inbreeding, which could lead to inbreeding depression and reduced genetic health in the population. Overall, the analysis demonstrates a clear trend of increasing inbreeding over time, particularly during some periods as shown by the sharp rise between 1985 and 1989. Despite the differences between FPED1 and FPED3 in the early years, both algorithms reveal a general increase in inbreeding, with stabilization occurring after 2008 and a slight decline after 2019.
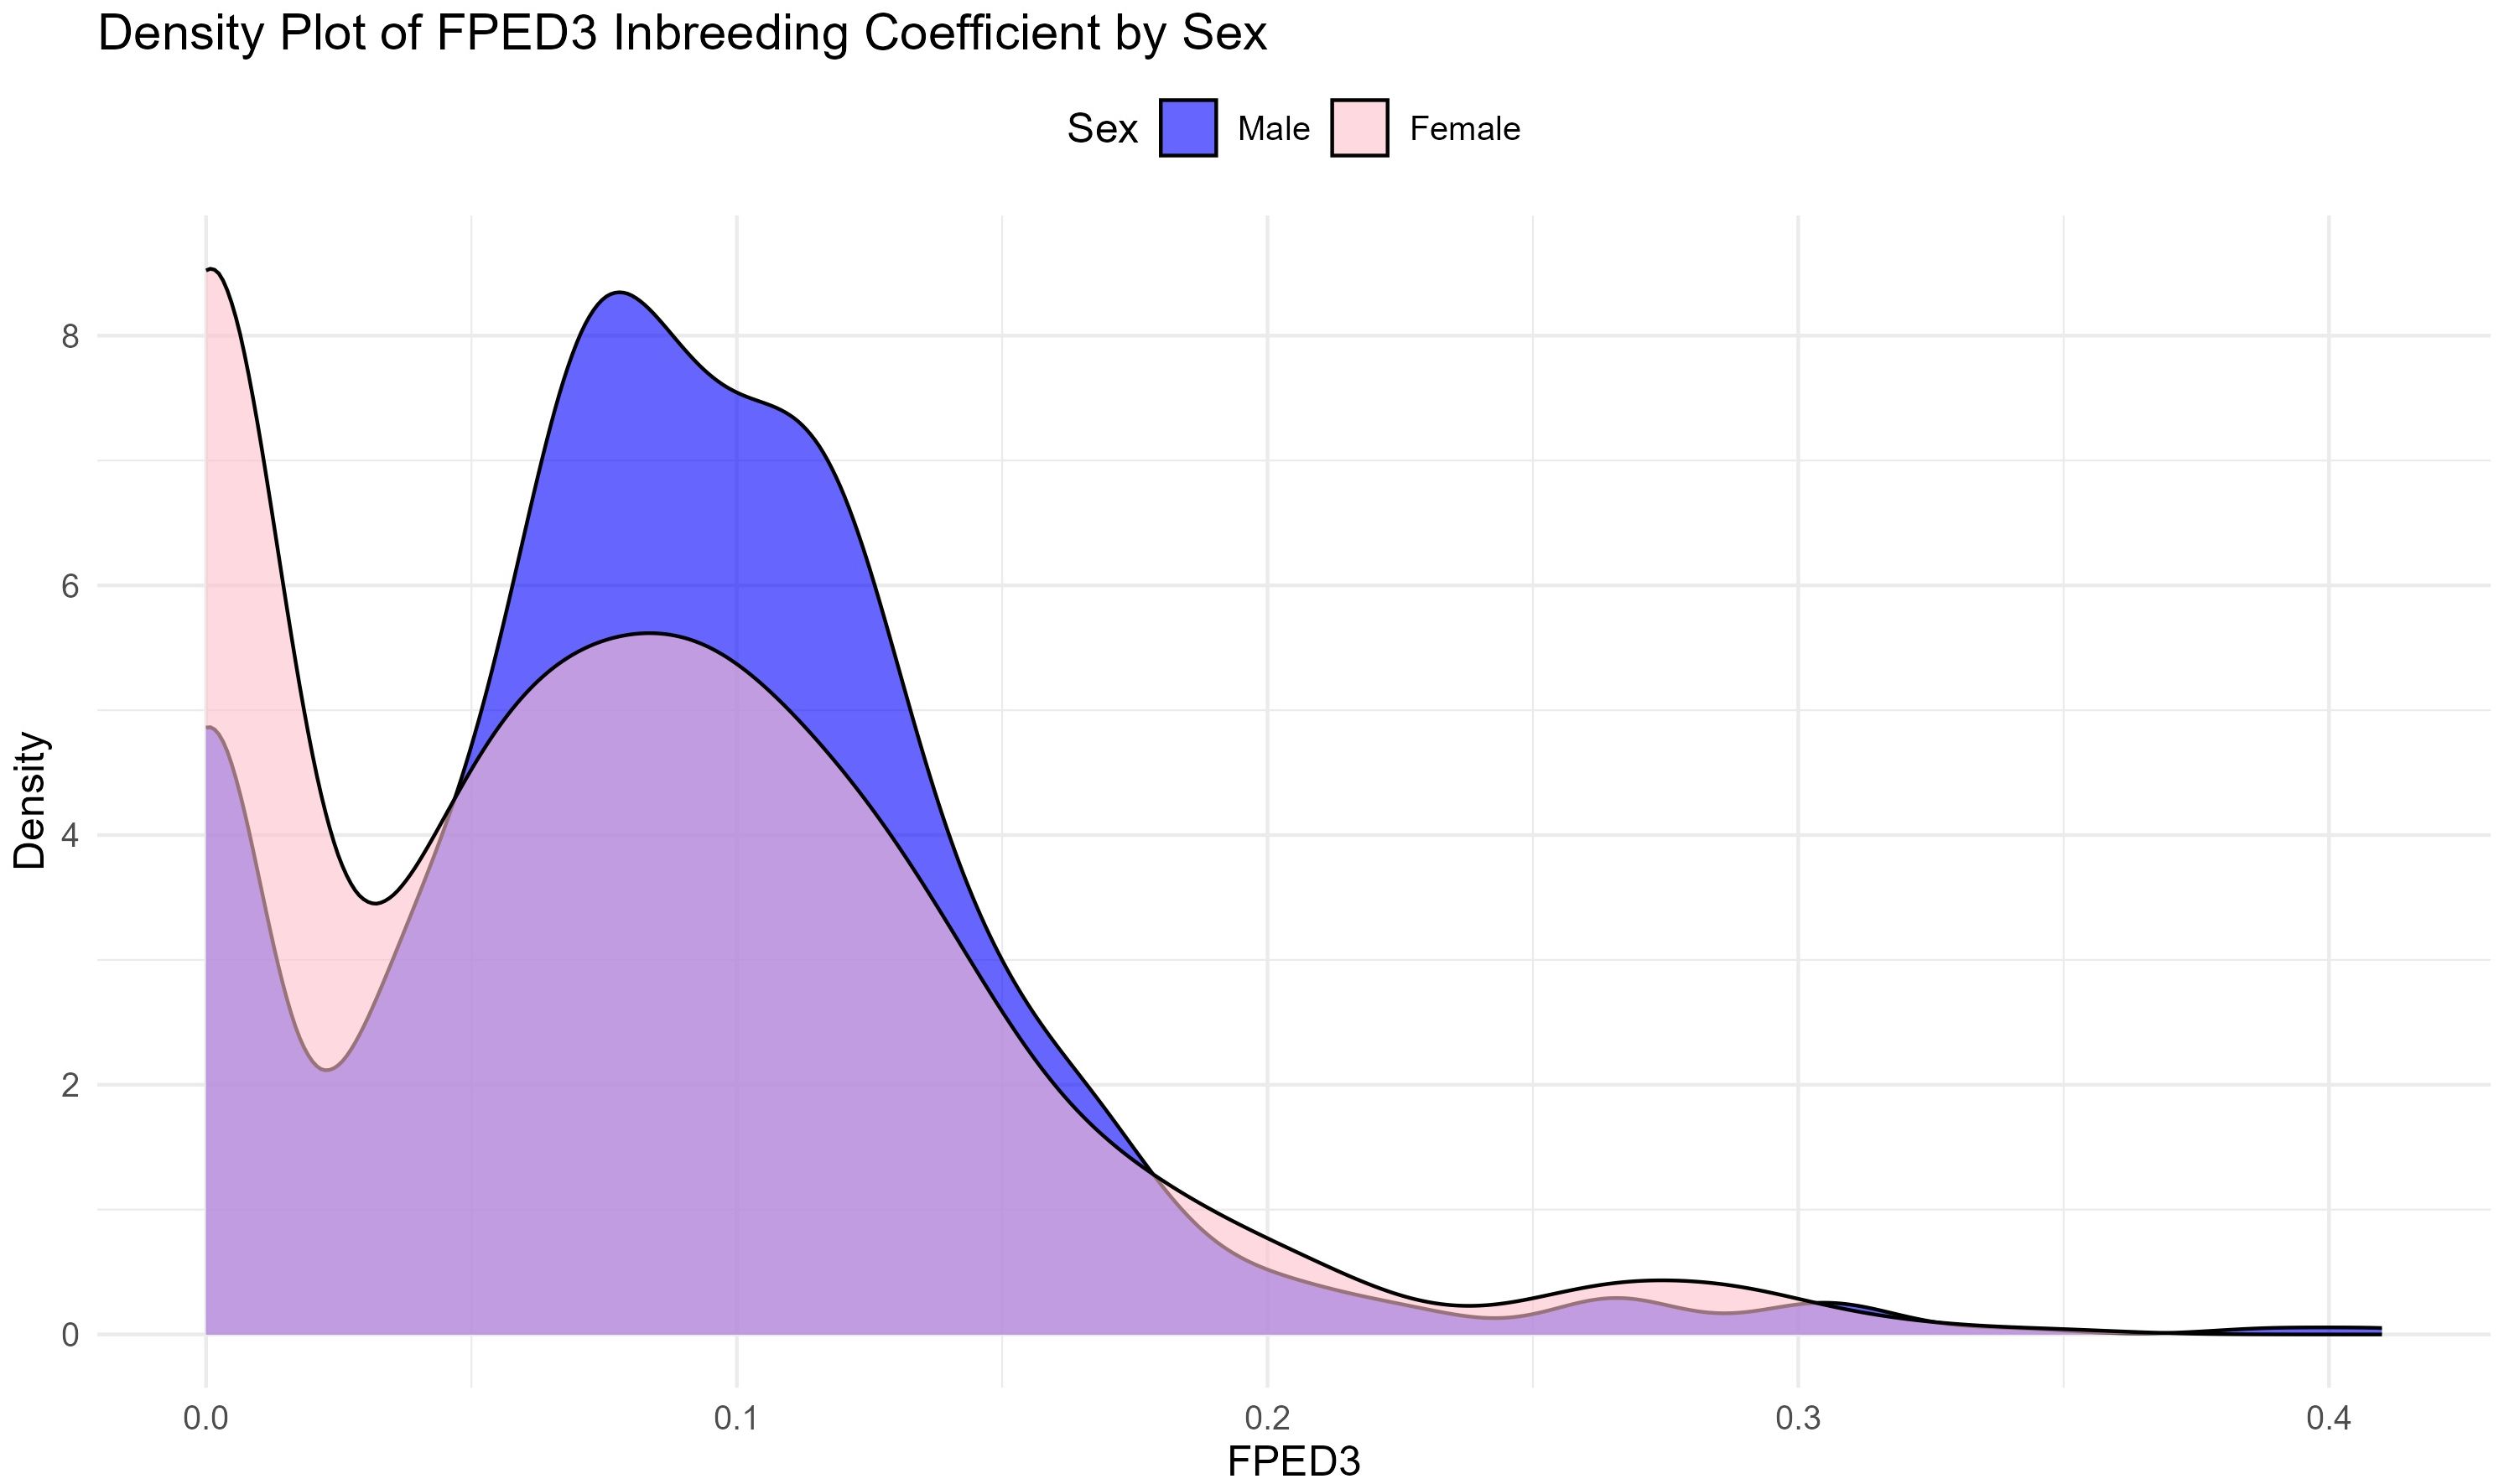
Figure 7. The distribution of the inbreeding coefficient according to FPED3 (Meuwissen and Luo algorithm) for male and female donkeys in reference population (RP).
Figure 8 and its accompanying tabular data show the breakdown of inbreeding coefficients by province and time period, highlighting how inbreeding has evolved in different areas before and after 2005. Provinces such as BA (Bari) and TA (Taranto) exhibited significant increases in inbreeding after 2005. For example, in BA, the mean inbreeding coefficient rose from 0.074 before 2005 to 0.102 afterward. Similarly, in TA, the coefficient increased from 0.063 to 0.096. In contrast, FG (Foggia) showed consistently lower inbreeding levels compared to other provinces, with a mean value of 0.062 after 2005, suggesting more diverse or controlled breeding practices in that area.
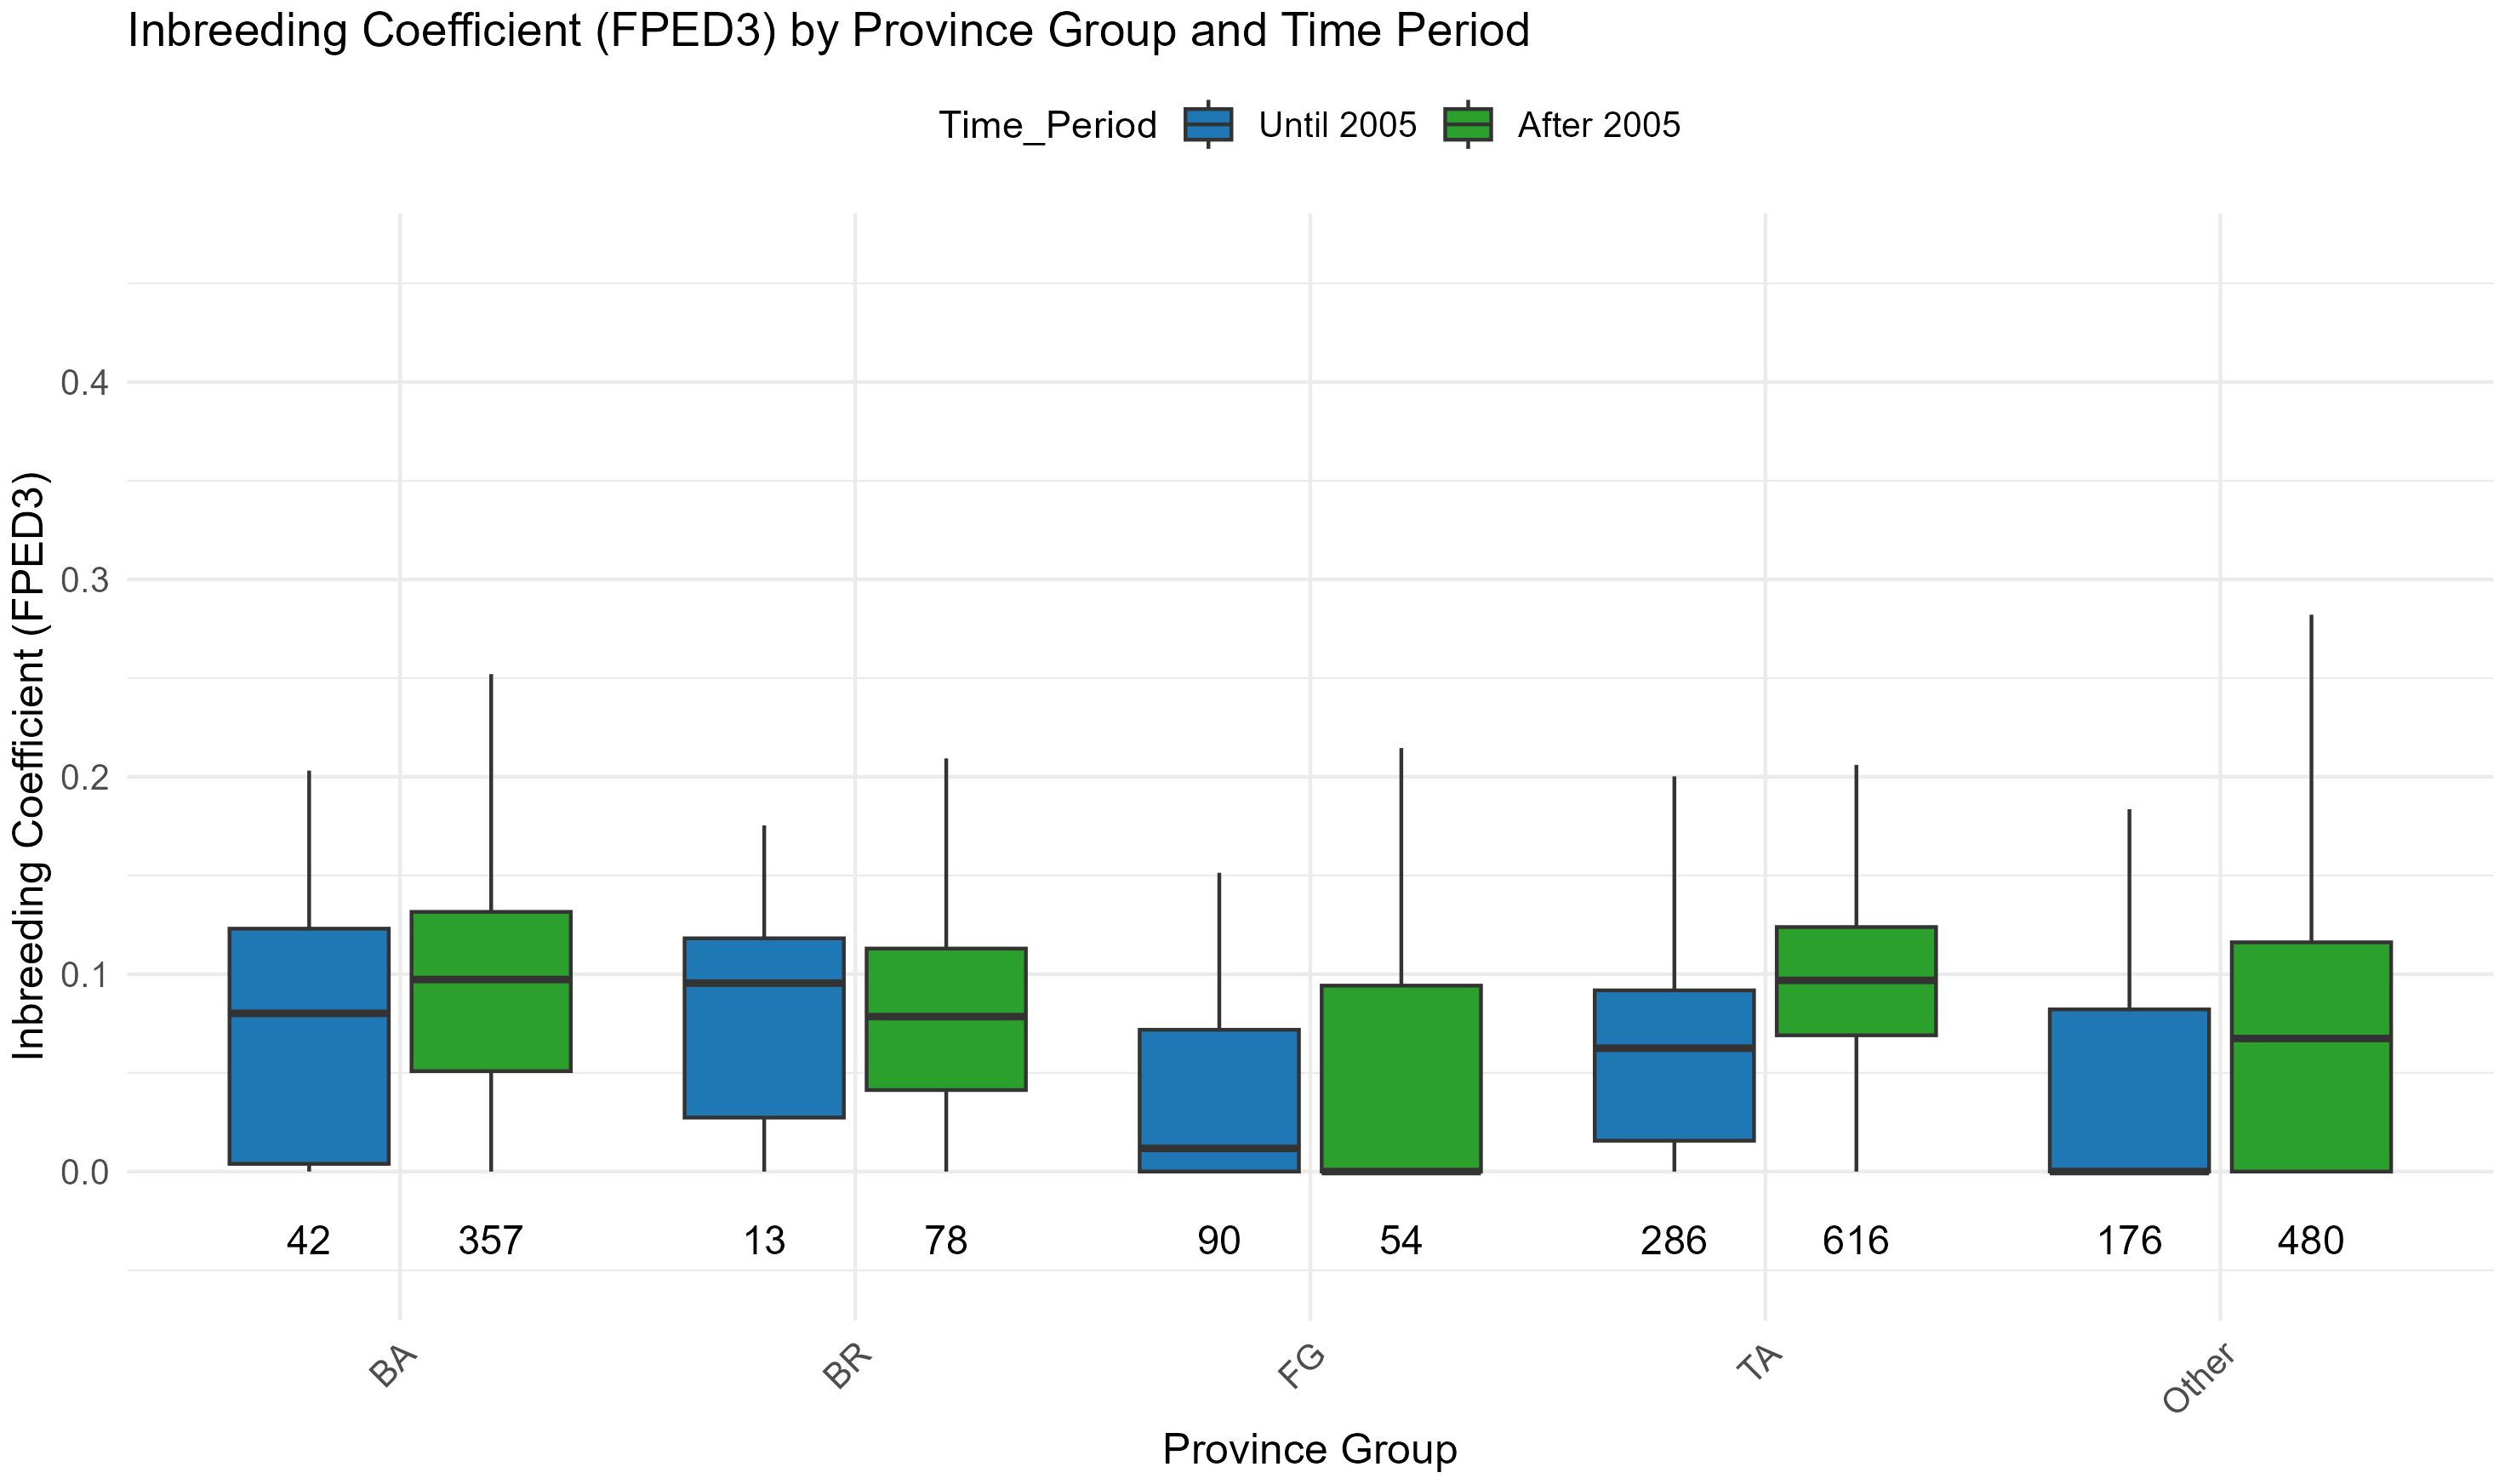
Figure 8. Inbreeding coefficient according to FPED3 (Meuwissen and Luo algorithm) by province of origin spitted before and after 2005.
Statistical analyses, including one-way ANOVA and Tukey’s HSD test, confirmed that these differences across provinces are significant. ANOVA results indicated a strong influence of province on inbreeding levels, both before (p < 0.001) and after 2005 (p < 0.001). Tukey’s HSD identified significant pairwise differences, particularly between provinces such as FG and BA, and between TA and BR. These findings emphasize that local breeding strategies have played a substantial role in shaping the genetic structure of the population, with some provinces adopting practices that led to higher inbreeding levels, while others maintained more controlled mating systems.
Population founders and genetic diversity
The pedigrees of individuals from the Total Population (TP) and Reference Population (RP) trace back to a total of 290 and 218 distinct founders, respectively. As the RP is a subset of the TP, values are not statistically compared but presented for descriptive purposes only. However, as shown in Table 3, only a limited number of these founders contribute meaningfully to the current genetic diversity. The effective number of founders is reduced to 16.63 in TP and 15.15 in RP, indicating that despite the broader founder base, only a few individuals play a crucial role in the genetic makeup of both populations. Similarly, the analysis of the total number of ancestors—1013 in TP and 920 in RP—demonstrates that only 14.77 individuals in TP and 13.05 in RP account for the total genetic diversity. This indicates a marked reduction in the genetic contribution of the ancestral pool, further emphasizing the narrowing genetic base over generations. The effective number of founder genome equivalents—8.14 for TP and 6.99 for RP—also indicates a loss of genetic diversity through the generations, driven largely by the bottleneck effect, which is estimated at 1.12 for TP and 1.16 for RP. This bottleneck effect has led to a genetic drift of 8.15 in RP and 8.48 in TP, resulting in a reduction in genetic diversity for both populations. The genetic diversity lost due to the bottleneck effect is high in both groups, with 96.17% in RP and 96.61% in TP. Furthermore, 93% in RP and 94% in TP, of founder alleles have been lost among generations, reflecting the cumulative effects of genetic drift and the bottleneck. This loss is closely linked to the population’s effective population size, which varies across different methods of calculation. The Ne values calculated for the Reference Population (RP) are consistently higher than those for the Total Population (TP), regardless of the calculation method. For instance, Ne based on the increase in inbreeding shows values of 45.71 for RP and 26.59 for TP when considering the maximum generation. However, these values drop drastically when calculated using complete generation data, reaching 3.06 for RP and 3.07 for TP. This decrease reflects both the cumulative impact of inbreeding over time and the limitations of pedigree completeness for more recent generations, which influence estimates based on complete data. Finally, the Ne values calculated using equivalent generations are 23.27 for RP and 17.04 for TP, confirming a general trend: the RP tends to show higher values than the TP, likely due to greater pedigree depth and genetic data management in the reference population. These differences between RP and TP can be attributed to the higher quality of pedigree information in the RP, which includes more recent and better-documented animals. These descriptive differences between RP and TP reflect the structural relationship between the two populations and the pedigree information available, rather than statistically independent variation.
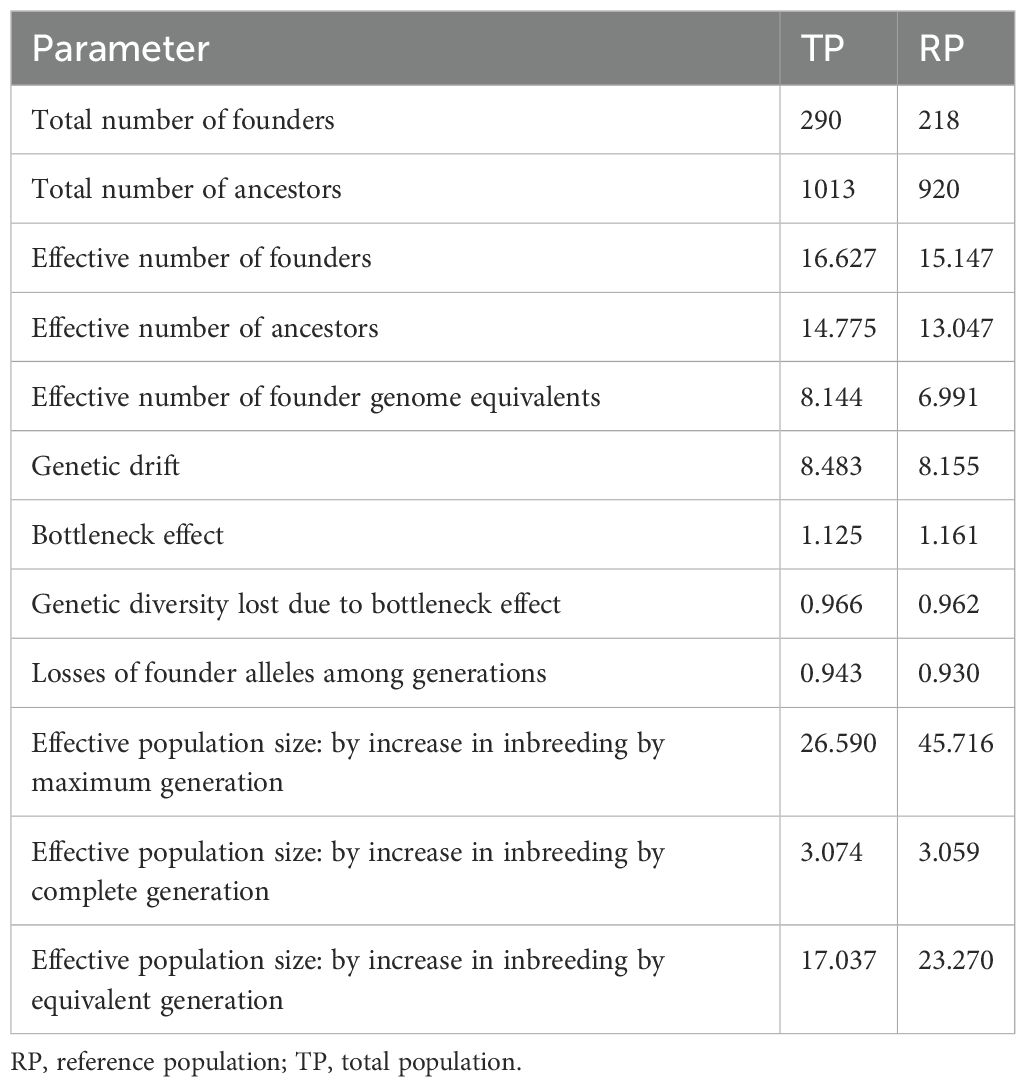
Table 3. Genetic diversity summary calculated for donkeys in total population and reference population.
Overall, these findings underscore the importance of pedigree completeness in determining reliable Ne estimates and in highlighting the cumulative effects of inbreeding over time. When calculated based on equivalent generations, the effective population size shows the values of 23.27 for RP and 17.04 for TP. In summary, these results underscore the substantial loss of genetic diversity due to both historical bottlenecks and ongoing inbreeding, leading to a significant reduction in the effective number of founders and ancestors. The population is therefore at risk of further losses in genetic diversity unless steps are taken to mitigate the effects of inbreeding and to manage the genetic contribution of the remaining founders and ancestors effectively.
Discussion
Population structure
The Martina Franca donkey population has experienced significant fluctuations over the past century, particularly because of mechanization following World War II, which led to a steep decline in numbers. However, recent efforts in conservation and breeding have contributed to a slow but steady census recovery of the breed. Recent increases in popularity for therapy, tourism, and milk production have contributed to population growth. This interest is largely due to the breed’s current use in equine-assisted therapy, equestrian tourism, and particularly in the production of milk for infant nutrition and cosmetics. However, this growing demand, coupled with an almost complete lack of reproductive and genetic management since 2012, has likely induced the excessive use of certain genetic lines at the expense of others. This situation could exacerbate the risks associated with inbreeding and loss of genetic diversity, which are critical concerns for the long-term viability of the breed (Gandini et al., 2004; Rizzi et al., 2011).
The observed decline in founders within the donkey population (from 290 in the TP to 218 in the RP) and those producing more than two offspring (from 53 in the TP compared to 49 in the RP) This decline in founders may reflect bottlenecks or selective breeding, or simply improved pedigree recording in recent years.
These findings highlight the pivotal role of preserving genetic diversity within the RP. A narrowing founder base, coupled with the lower number of prolific founders, suggests that the breed’s genetic pool might be at risk of further reduction.
The dam-to-sire ratio in the current Reference Population (RP) was observed to be approximately 1.5 (Figure 2), which is slightly lower than the ratios reported for equine breeds, such as the Polish Arabian horses, where the ratio has been observed at 2.04 in recent studies (Duru, 2017). This ratio indicates a more balanced approach to breeding within the Martina Franca population, possibly reflecting efforts to avoid the overuse of a small number of sires, which can lead to increased inbreeding. Additionally, this trend may be influenced by the growing demand for female donkeys (jennies) in milk production and the increasing interest in selling live animals to other breeders, both of which could contribute to a higher than 1 to 1 dam-to-sire ratio as breeders prioritize the production of female offspring for these purposes (Camillo et al., 2018).
Despite these efforts, the average family size in the Martina Franca donkey, calculated at 1.33 in the Total Population (TP) and 1.38 in the RP (Table 1), remains lower than that reported for other horse breeds, such as the Turkish Arabian horses, where an average family size of 2.8 has been documented (Baena et al., 2020). This smaller family size suggests a more conservative breeding strategy, possibly influenced by the desire to maintain genetic diversity and manage inbreeding within this endangered population. Variations among full-sibling families for TP (1487) and RP (1066) and its corresponding average size (TP=1.33; RP=1.38), also highlight differences in the reproductive dynamics and potential selective pressures within each subpopulation.
Nevertheless, the relatively low dam-to-sire ratio and small family sizes have not fully mitigated the loss of genetic diversity, as evidenced by the reduced effective number of founders, genetic drift, and other indicators summarized in Table 3.
The challenges faced by this breed in maintaining genetic health despite these breeding strategies highlight the complexity of conservation efforts in small populations. The findings underscore the need for continued and possibly more intensive management practices to preserve the genetic diversity of the Martina Franca donkey.
Pedigree quality
Pedigree completeness remains a fundamental aspect of genetic management strategies in livestock populations, providing the foundation for accurately assessing inbreeding levels and genetic diversity (Rizzi et al., 2011). The absence of complete parental information often results in assigning a zero-inbreeding coefficient to individuals, despite possible shared ancestry. This practice can significantly underestimate true inbreeding levels within a population, delaying necessary interventions to mitigate inbreeding (Lutaaya et al., 1999; Cassell et al., 2003). The consequences of such delays are particularly severe in endangered breeds, where maintaining genetic diversity is crucial for long-term viability.
In the studied Reference Population (RP), most individuals have a limited number of maximum generations traced (MG), with a steep decline after the fourth generation. Very few individuals trace beyond six generations (Figure 3). This limited depth of pedigree data is similar to the findings of Rizzi et al. (2011) for the Martina Franca donkey, although their study reported an average of 6.64 generations traced, which exceeds the current study’s results. The average number of Complete Generations (CG) and Equivalent Generations (EG) also serve as critical indicators of pedigree quality. In the current Reference Population (RP), most individuals fall within the 1–2 complete generations range, with averages of 1.21 for CG and 1.71 for EG (Supplementary Table S1). These values are lower than those reported by Rizzi et al. (2011), where CG and EG were 2.6 and 4.17, respectively. This discrepancy points to potential gaps in pedigree documentation or loss of records over time (Faria et al., 2021). The limited EG values, which do not exceed five generations in both studies, and the reduced depth of pedigree documentation highlights a broader challenge in maintaining comprehensive genealogical records for rare breeds.
Similar challenges have been reported in other endangered breeds. For example, the Catalonian donkey, another endangered equine breed, has a mean CG of approximately three generations (Folch and Jordana, 1998), which mirrors the situation observed in this study. These comparisons highlight that the challenges faced by the Martina Franca donkey are not unique and emphasize the need for targeted improvements in pedigree recording practices across endangered breeds. The implications of incomplete pedigree data are profound. Incomplete pedigrees not only obscure true inbreeding coefficients but also hinder the identification of genetic bottlenecks and founder effects. In breeds like the Andalusian horse, incomplete pedigrees have led to underestimating inbreeding depression, which can result in reduced reproductive fitness and overall population health (Valera et al., 2005). Furthermore, the low pedigree completeness observed in this study could lead to inaccurate estimations of the effective population size (Ne) (Maignel et al., 1996). A lower Ne than the actual value could mask the population’s true vulnerability to genetic drift and inbreeding depression, potentially resulting in long-term negative consequences for genetic diversity (Gandini et al., 2004). The use of molecular markers for genetic management has long been a pending goal in this species. However, recent studies now enable the routine application of low-density SNP panels for reconstructing incomplete pedigree families and verifying declared parentage (Criscione et al., 2024). Improved pedigree completeness would allow for more accurate inbreeding estimates and more effective conservation strategies, ultimately contributing to the long-term sustainability of the Martina Franca donkey and other endangered populations.
Generation interval
The generation length of a population is determined by the age at first mating and the length of reproductive life (Folch and Jordana, 1998). The current Reference Population (RP) had an estimated generation interval of about 8.4 years (Table 2), slightly lower than the value of 9.09 years reported in a previous study by Rizzi et al. (2011). The average generation interval between parents and offspring in the Catalonian donkey was found to be 6.74 years (Folch and Jordana, 1998), highlighting that shorter average generation intervals are possible for equid breeds with optimized management practices. In this context, the slightly shorter interval observed in the RP compared to the TP suggests that recent efforts in breeding management may have contributed to a younger age at first reproduction.
Studies on other endangered donkey populations, such as the Mirandese donkey, report generation intervals of around 7.5 years (Aranguren-Méndez et al., 2001), slightly longer than the Catalonian donkey but similar to the RP values for the Martina Franca breed. The Andalusian donkey, another endangered breed, faces similar challenges of slow reproductive rates and long generation intervals, exacerbated by the overuse of popular sires and dams, which can lead to a narrowing of the genetic base (Valera et al., 2005).
A comparison of the total population with the current reference population reveals no significant differences, though a slight reduction is observed across all paths. The most substantial reduction in the generation interval was observed in the dam-daughter path, where the generation interval decreased from 8.73 years in the TP to 7.69 years in the RP (-1.04 years). This value also shows a reduction compared to the 8.82 years reported in the earlier study by Rizzi et al. (2011). This change suggests that the age at first mating has decreased, resulting in a younger age at foaling. A younger breeding age could enhance the reproductive efficiency of the population, potentially leading to a more dynamic population structure with quicker turnover between generations (Camillo et al., 2018). The relatively small differences between TP and RP, coupled with the stable overall averages, indicate that the breeding practices and reproductive strategies have not significantly shifted over time. However, the observed variation between sire and dam intervals points to potential differences in reproductive roles, with females generally contributing to faster generational turnover, while males, particularly older sires, extend the generational time frames slightly.
The long generation intervals for the Martina Franca donkey, like those seen in the Andalusian and Catalonian donkeys (Valera et al., 2005; Camillo et al., 2018), can be attributed to the slow turnover rate of sires and dams. The most favored and popular animals often continue to contribute progeny to subsequent generations for many years. While prolonging the generation interval may allow for more thorough genetic evaluation of potential breeding stock, this approach also carries risks of narrowing the genetic base if certain animals are overutilized (Cortes et al., 2016; Van den Berg et al., 2019). The reduction in the generation interval seen in the RP may help alleviate this concern by promoting the use of younger animals for reproduction, thus diversifying the gene pool.
Prolonging the generation interval may be a useful strategy for increasing the number of sires and dams selected for breeding, as seen in other breeds like the Mirandese and Andalusian donkeys (Aranguren-Méndez et al., 2001; Valera et al., 2005). This approach could incrementally increase the effective population size, which is inversely proportional to the rate of inbreeding (Meuwissen and Luo, 1992; Caballero and Toro, 2002; Toro and Caballero, 2005). However, maintaining a balance between prolonging and reducing the generation interval is crucial for managing inbreeding while preserving genetic diversity (Meuwissen and Luo, 1992). The reduction in the generation interval observed in the dam-daughter path suggests an encouraging trend toward faster generational turnover, which may enhance reproductive efficiency and help mitigate inbreeding risks in the Martina Franca population.
Inbreeding
Inbreeding trend over year of birth and sexes
The average inbreeding coefficient shows a general upward trend in both FPED1 and FPED3 methods (Figure 5). The segmented regression analysis of inbreeding coefficients (Figure 6) provides more granular insights into periods of intensified inbreeding and subsequent stabilization. Notably, the first significant increase in inbreeding occurs around 1980, coinciding with the establishment of the Center for the Conservation and Safeguard of the Martina Franca donkey (Crispiano, province of Taranto) (Rizzi et al., 2011). This center with around 90–100 females is the largest farm for this breed and distributes the foals to breeders and private citizens, therefore it has a huge impact on the dynamics of the breed, normally composed of small groups. Between 1985 and 1989, the inbreeding coefficient increased rapidly, with a slope of 0.015, reflecting a period of intensified selective breeding. This period aligns with targeted breeding programs to bolster the population size following its near-extinction in the early 1980s. A similar pattern has been observed in other endangered species as they recover from critical population bottlenecks (Lacy, 1989).
After 1989, a slight decline in the inbreeding coefficient was observed, suggesting efforts to control inbreeding. This is followed by a period of stability from 2000 to 2010, likely due to more strategic breeding management aimed at maintaining genetic diversity (Supplementary Tables S2, S3). Despite this stabilization, the overall trend indicates that inbreeding continued to rise steadily until 2019. After 2019, a small decline is noted, which could be attributed to recent efforts to mitigate the inbreeding (Supplementary Table S2).
In comparison, similar patterns of rising inbreeding coefficients have been observed in endangered equid breeds. For instance, the Catalonian donkey (Folch and Jordana, 1998) and the Andalusian horse (Valera et al., 2005) also experienced periods of rapid inbreeding due to selective breeding practices that favored a small number of prolific individuals. As seen in the Martina Franca population, these periods were followed by stabilization, emphasizing the role of conservation programs in managing genetic diversity.
The bimodal distribution of inbreeding coefficients (Figure 7) reveals that while most individuals maintain relatively low levels of inbreeding, a subset of the population is at risk of high inbreeding. This pattern is often seen in endangered populations, where intensive breeding of a small number of individuals leads to an uneven distribution of inbreeding across the population (Valera et al., 2005). Managing this disparity will be crucial to preventing inbreeding depression and maintaining the genetic health of the population over time (Frankham, 2005).
Geographical differences in inbreeding
The geographical analysis of inbreeding coefficients provides additional insights into the local breeding practices that have shaped the genetic structure of the Martina Franca donkey population. Although most of the population is located in Apulia, and only a small fraction is dispersed across the rest of the country, Apulia itself encompasses diverse geo-pedological zones and, consequently, heterogeneous farming systems. For example, the Gargano area in the north is characterized by large farms, typically focused on cattle, goats, and sheep, with abundant pasture availability but subject to marked seasonal variation. In contrast, the central and southern provinces are dominated by smaller farms, often dedicated to equid breeding (donkeys and horses) or, more commonly, dairy cattle farming (Colli et al., 2013; Biscarini et al., 2015). These differences in production systems likely contribute to the regional variation observed in inbreeding coefficients across the Martina Franca donkey population (Rizzi et al., 2011). It is also important to note that while a few animals are registered in provinces outside Apulia, these are mostly kept in small-scale, amateur settings, and often used for non-reproductive purposes such as tourism or therapy. As a result, the vast majority of births still occur in Apulia, mainly within active breeding herds. The province reported in the registry corresponds to the most recent herd affiliation and does not necessarily reflect the place of birth or the original herd. This strong geographic concentration of active breeding highlights the regional character of the population’s genetic management and the need for focused conservation strategies within Apulia.Provinces such as Bari (BA) and Taranto (TA) exhibit significant increases in inbreeding after 2005. For instance, in BA, the mean inbreeding coefficient rose from 0.074 before 2005 to 0.102 afterward, and in TA, it increased from 0.063 to 0.096 (Figure 8, Supplementary Table S3). This suggests that breeders in these regions may have favored the use of a small number of animals for reproduction, leading to a higher concentration of certain genetic lines. In contrast, provinces such as Foggia (FG) maintained consistently lower inbreeding levels, with a mean inbreeding coefficient of 0.06194 after 2005, indicating more diverse or controlled breeding practices (Supplementary Table S3). These regional differences suggest that different breeding strategies or management practices have had a profound impact on the genetic structure of the population and highlight the importance of centralized breeding strategies to ensure that inbreeding levels remain under control to preserve the long-term viability of the population.
The findings are consistent with other studies, such as those on the Mirandese donkey population in Portugal, where differences in regional breeding approaches have also been observed (Aranguren-Méndez et al., 2001).
The challenges faced by the Martina Franca donkey are not unique. Similar trends of rising inbreeding and loss of genetic diversity have been documented in other donkey populations, such as the Andalusian donkey (Valera et al., 2005) and the Catalonian donkey (Folch and Jordana, 1998). These findings highlight the need for continued and potentially more intensive management practices to preserve genetic diversity and prevent further inbreeding.
Effective population size
The effective population size (Ne) estimated in this study (Table 3) reveals the vulnerability and limited genetic diversity of the Martina Franca population. The values of Ne are 45.71 for maximum generation, 3.06 for complete generation, and 23.27 for equivalent generation in the Reference Population (RP). These values fall significantly below the threshold suggested by the FAO, which recommends an Ne greater than 50 to minimize the risk of inbreeding depression (FAO, 1998). Such low Ne values indicate that the Martina Franca donkey population is at risk of further genetic erosion unless comprehensive management strategies are adopted.
In comparison, lower Ne values have been reported for the Pêga donkey breed in Brazil, with an estimated Ne of 35 (Santana et al., 2015). However, several other donkey breeds show considerably higher Ne values. For example, the Amiata donkey breed reports an Ne of 172.41 (Cecchi et al., 2006), while the Littoral-Dinaric donkey and the Istrian donkey populations have Ne values of 74.59 and 81.27, respectively (Ivanković et al., 2022). Furthermore, the Asinina de Miranda breed has an estimated Ne of 122.18 for maximum generations, 122.27 for complete generations, and 116.54 for equivalent generations (Quaresma et al., 2014).
These comparisons highlight the particularly low Ne values for the Martina Franca breed, placing it at a greater risk than other endangered donkey breeds. However, variations in Ne across studies may stem from factors such as total population size, the quality of pedigree data, and the accuracy of gene origin probabilities (Faria et al., 2021). In particular, the pedigree data for the Martina Franca donkey might have affected the Ne estimates in this study, especially considering the relatively shallow genealogical data available for some individuals.
Given these findings, it is crucial to implement conservation strategies aimed at increasing the Ne. Suggested strategies include expanding the breeding population, avoiding the overuse of popular sires, and enhancing pedigree recording practices. These measures can help mitigate the risk of inbreeding depression and maintain the genetic diversity essential for the breed’s long-term sustainability.
Population founders and genetic diversity
Genetic diversity preservation is often assessed through the effective number of equally contributing founders (Lacy, 1989), which indicates the number of founders contributing to the current genetic diversity. Ideally, a high effective founder number suggests balanced genetic contributions, although this may not always be the case (Boichard et al., 1997). In this study, we identified 218 founders for the Reference Population (RP) and 290 for the Total Population (TP). However, only a small fraction of these founders substantially contributes to the current genetic diversity. The effective number of founders (Fe) decreased to about 17 in TP and 15 in RP. These values indicate a modest increase compared to the findings by Rizzi et al. (2011), who reported 191 founders, of which 133 contributed to the total population, and 120 contributed to the reference population. In their analysis, the effective number of founders (Fe) declined from 22 in the total population to 19 in the reference population due to incomplete pedigree records (Rizzi et al., 2011). This pattern is echoed by other studies. For example, Santana et al. (2015) documented a similar reduction in the Pêga donkey population in Brazil, where the total number of founders was 1266, but the effective number of founders in the reference population was only 56.4. Similarly, in Croatian donkey breeds like the Littoral-Dinaric and Istrian donkeys, the total number of founders was 914.13 and 121.77, but the effective number of founders dropped to 325 and 70, respectively (Ivanković et al., 2022). In contrast, Folch and Jordana (1998) observed higher values for the endangered Catalonian donkey, with an effective number of founders (Fe) of 51.31 out of a total of 85 founders. This discrepancy may be due to the lower quality of pedigree information, inflating the apparent number of founders. Similarly concerning is the genetic contribution of ancestors: out of 1013 ancestors in the TP and 920 in the RP, only about 15 and 13 individuals, respectively, account for the total genetic diversity of the Martina Franca donkey. These numbers highlight the sharp decline in ancestral contributions. The results align with those of Rizzi et al. (2011), who also reported a steep drop, with only 18 ancestors in the TP and 13 in the RP being the effective number of ancestors. The effective number of founder genome equivalents—8.14 for TP and 6.99 for RP—further confirms the ongoing loss of genetic diversity across generations, comparing to Rizzi et al. (2011), where a notable reduction is evident (from 14 and 7 in TP and RP, respectively). The bottleneck effect, which results from the difference between the effective number of founders and ancestors, is estimated at 1.12 for TP and 1.16 for RP. Rizzi et al. (2011) reported a lower bottleneck effect value of 0.82. This indicates a substantial loss of genetic diversity, with about of 96% being lost across both populations. Other endangered donkey breeds, such as the Miranda breed (Quaresma, 2015), reported similar values (0.89), while the Pêga donkey recorded a value of 0.94 (Santana and Bignardi, 2015). By contrast, the Catalonian and Amiata donkey breeds showed lower bottleneck values (0.38 and 0.37, respectively), possibly reflecting narrower bottlenecks due to the poorer pedigree completeness (Gutiérrez et al., 2005; Cecchi et al., 2006). In conclusion, these findings emphasize the significant genetic diversity loss caused by historical bottlenecks and ongoing inbreeding, leading to a sharp reduction in the effective number of founders and ancestors. The disappearance of founder genotypes from the local population poses a critical risk to the overall genetic health of the Martina Franca donkey breed. Genetic bottlenecks do not necessarily lead to population extinction; however, they create a situation where deleterious mutations may either be purged or fixed, potentially driving the population toward eventual extinction (Frankham et al., 2010).
Conclusions
The Martina Franca donkey breed has seen renewed interest due to its roles in equine-assisted therapy, tourism, and milk production. While this has supported population growth, inbreeding levels have risen from 0.07 in 2009 to 0.10 in 2020, and genetic diversity remains critically low, with an effective population size (Ne) well below the FAO-recommended threshold of 50. Limited pedigree completeness further complicates accurate inbreeding estimates and genetic management.
Efforts to reduce generation intervals have been observed, but historical bottlenecks and ongoing inbreeding have led to significant losses in genetic diversity, with only a small fraction of the identified founders contributing to the current population. To address these challenges, more intensive conservation strategies are urgently needed, including better pedigree documentation, expanding the breeding population, and adopting improved genetic management practices to safeguard the breed’s future. Considering these findings, there is an urgent need to adopt more intensive conservation strategies, including enhancing pedigree recording, expanding the breeding population, and employing more effective management techniques to maintain genetic diversity and prevent further inbreeding.
Data availability statement
The raw data supporting the conclusions of this article will be made available by the authors, without undue reservation.
Ethics statement
Ethical approval was not required for the study involving animals, in accordance with local legislation and institutional requirements, because the research was carried out using pedigree data deposited in the national registry and generated through routine stud book management.
Author contributions
CP: Data curation, Formal Analysis, Validation, Writing – original draft, Writing – review & editing. VL: Writing – original draft, Writing – review & editing, Data curation, Formal Analysis, Validation, Conceptualization, Investigation, Methodology, Project administration, Software, Supervision. EC: Conceptualization, Supervision, Validation, Writing – original draft, Writing – review & editing. AM: Methodology, Writing – review & editing. DC: Funding acquisition, Project administration, Writing – review & editing. MG: Data curation, Software, Writing – original draft, Writing – review & editing. PD: Conceptualization, Funding acquisition, Methodology, Project administration, Supervision, Validation, Writing – original draft, Writing – review & editing.
Funding
The author(s) declare that financial support was received for the research and/or publication of this article. This research have been supported by the action “Azioni di monitoraggio della diversità genetica per l’ottimizzazione della gestione della popolazione di asini di Martina Franca Regione Puglia— repertorio 023356 del 17 September 2020” thanks to Apulian Region Department of Agriculture.
Acknowledgments
The authors are grateful to all the breeders and to “Sezione Gestione Sostenibile e Tutela delle Risorse Forestali e Naturali” of Agriculture Department of Apulian Region and Regional Breeder Association (ARA Puglia) for support
Conflict of interest
The authors declare that the research was conducted in the absence of any commercial or financial relationships that could be construed as a potential conflict of interest.
The author(s) declared that they were an editorial board member of Frontiers, at the time of submission. This had no impact on the peer review process and the final decision.
Generative AI statement
The author(s) declare that no Generative AI was used in the creation of this manuscript.
Publisher’s note
All claims expressed in this article are solely those of the authors and do not necessarily represent those of their affiliated organizations, or those of the publisher, the editors and the reviewers. Any product that may be evaluated in this article, or claim that may be made by its manufacturer, is not guaranteed or endorsed by the publisher.
Supplementary material
The Supplementary Material for this article can be found online at: https://www.frontiersin.org/articles/10.3389/fanim.2025.1588467/full#supplementary-material
References
Aguilar I. and Misztal I. (2008). Technical note: recursive algorithm for inbreeding coefficients assuming nonzero inbreeding of unknown parents. J. Dairy Sci. 91, 1669–1672. doi: 10.3168/jds.2007-0575
A.N.A.M.F. – Associazione Nazionale Allevatori del Cavallo delle Murge e dell'Asino di Martina Franca. Available online at: https://www.anamf.it/ (Accessed July 27, 2024).
Aranguren-Méndez J., Jordana J., and Gomez M. (2001). Genetic diversity in Spanish donkey breeds using microsatellite DNA markers. Genet. Selection Evol. 34, 503–517. Available at: https://www.gse-journal.org/articles/gse/abs/2001/04/g330405/g330405.html.
Baena M. M., Carneiro P. L. S., and Resende F. M. S. (2020). Population structure and genetic diversity in Mangalarga MarChador horses. J. Equine Veterinary Sci. 89, 102982. doi: 10.1016/j.livsci.2020.104109
Berardinis D. A., Bucci R., D. Amicis I., D. Signore F., Parrillo S., Massirio I., et al. (2024). Phenotypic characterization of the martina franca donkey: an endangered italian donkey breed. Animals 14. doi: 10.3389/fgene.2015.00033
Biscarini F., Nicolazzi E. L., Stella A., Boettcher P. J., and Gandini G. (2015). Challenges and opportunities in genetic improvement of local livestock breeds. Front. Genet. 6, 33. doi: 10.3389/fgene.2015.00033
Boichard D., Maignel L., and Verrier E. (1997). The value of using probabilities of gene origin to measure genetic variability in a population. Genet. Sel. Evol. 29, 5–23. doi: 10.1186/1297-9686-29-1-5
Bramante G. and Pieragostini E. (2005). Apulian native breeds: present and future (Bari: XIII Congress of Mediterranean Federation for Health and Production of Ruminants).
Caballero A. and Toro M. A. (2002). Analysis of genetic diversity for the management of conserved subdivided populations. Conserv. Genet. 3, 289–299.
Camillo F., Rota A., Biagini L., Tesi M., Fanelli D., and Panzani D. (2018). The current situation and trend of donkey industry in Europe. J. Equine Veterinary Sci. 65, 44–49. doi: 10.1016/j.jevs.2017.11.008
Carluccio A., Bucci R., Fusi J., Robbe D., and Veronesi M. C. (2020). Effect of age and reproductive status on reproductive indices in horse mares carrying mule pregnancies. Heliyon 6, e05175. doi: 10.1016/j.heliyon.2020.e05175
Cassell B. G., Adamec V., and Pearson R. E. (2003). Maternal grandsire and granddam effects on yield and fertility in dairy cattle. J. Dairy Sci. 86, 1061–1067.
Cecchi F., Ciampolini R., Ciani E., Matteoli B., Mazzanti E., Tancredi M., et al. (2006). Demographic genetics of the endangered Amiata donkey breed. Ital. J. Anim. Sci. 5, 387–391. doi: 10.4081/ijas.2006.387
Colli L., Perrotta G., Negrini R., Bomba L., Bigi D., Zambonelli P., et al. (2013). Detecting population structure and recent demographic history in endangered livestock breeds: the case of the Italian autochthonous donkeys. Anim Genet. 44, 69–78. doi: 10.1111/j.1365-2052.2012.02356.x
Cortes O., Martinez A. M., Canon J., Sevane N., Gama L. T., Ginja C., et al. (2016). Conservation priorities of Iberoamerican pig breeds and their ancestors based on microsatellite information. Heredity (Edinb) 117, 14–24. doi: 10.1038/hdy.2016.21
Coster A. (2022). pedigree: Pedigree Functions (R package version 1.4.2). Available online at: https://CRAN.R-project.org/package=pedigree. (Accessed July 10, 2024).
Criscione A., Chessari G., Cesarani A., Ablondi M., Asti V., Bigi D., et al. (2024). Analysis of ddRAD-seq data provides new insights into the genomic structure and patterns of diversity in Italian donkey populations. J. Anim Sci. 102, skae165. doi: 10.1093/jas/skae165
De Palo P., Maggiolino A., Milella P., Centoducati N., Papaleo A., and Tateo A. (2016). Artificial suckling in Martina Franca donkey foals: effect on in vivo performances and carcass composition. Trop. Anim Health Prod 48, 167–173. doi: 10.1007/s11250-015-0940-2
De Palo P., Tateo A., Maggiolino A., Marino R., Ceci E., Nisi A., et al. (2017). Martina Franca donkey meat quality: Influence of slaughter age and suckling technique. Meat Sci. 134, 128–134. doi: 10.1016/j.meatsci.2017.07.025
Dowle M. and Srinivasan A. (2021). data.table: Extension of Data.frame version1.16.4. Available online at: https://CRAN.R-project.org/package=data.table. (Accessed July 15, 2024).
Duru S. (2017). Pedigree analysis of the Turkish Arab horse population: structure, inbreeding and genetic variability. Animal 11, 1449–1456. doi: 10.1017/S175173111700009X
FAO (1998). Secondary guidelines for development of national farm animal genetic resources management plans: Management of small populations at risk (Rome: Food and Agriculture Organization of the United Nations).
Faria R. A. S., Vicente A. P. A., Ospina A. M. T., and Silva J.A.I.I.V. (2021). Pedigree analysis of the racing line Quarter Horse: Genetic diversity and most influential ancestors. Livestock Sci. 247, 104484. doi: 10.1016/j.livsci.2021.104484
Folch P. and Jordana J. (1998). Demographic characterization, inbreeding, and maintenance of genetic diversity in the endangered Catalonian donkey breed. Genet. Selection Evol. 30, 195–199. doi: 10.1186/1297-9686-30-2-195
Frankham R. (2005). Genetics and extinction. Biol. Conserv. (Cambridge: Cambridge University Press). 126, 131–140. doi: 10.1016/j.biocon.2005.05.002
Frankham R., Ballou J. D., and Briscoe D. A. (2010). Introduction to Conservation Genetics (Cambridge University Press).
Gandini G. C., Ollivier L., Danell B., Distl O., Georgoudis A., Groeneveld E., et al. (2004). Criteria to assess the degree of endangerment of livestock breeds in Europe. Livestock Production Sci. 91, 173–182. doi: 10.1016/j.livprodsci.2004.08.001
Gohel D. (2020). officer: Manipulation of Microsoft Word and PowerPoint Documents. Available online at: https://CRAN.R-project.org/package=officer. (Accessed July 15, 2024)
Gohel D. (2021). flextable: Functions for Tabular Reporting version 0.9.7. Available online at: https://CRAN.R-project.org/package=flextable. (Accessed July 15, 2024)
Grolemund G. and Wickham H. (2011). lubridate: Make Dealing with Dates a Little Easier version 1.9.4. Available online at: https://CRAN.R-project.org/package=lubridate. (Accessed July 15, 2024).
Gutiérrez J. P., Marmi J., Goyache F., and Jordana J. (2005). Pedigree information reveals moderate to high levels of inbreeding and a weak population structure in the endangered Catalonian donkey breed. J. Anim Breed Genet. 122, 378–386. doi: 10.1111/j.1439-0388.2005.00546.x
Ivanković A., Bittante G., Šubara G., Šuran E., Ivkić Z., Pećina M., et al. (2022). Genetic and population structure of Croatian local donkey breeds. Diversity 14, 322. doi: 10.3390/d14050322
Jordana J., Ferrando A., Miro J., Goyache F., Loarca A., Martinez Lopez O. R., et al. (2016). Genetic relationships among American donkey populations: insights into the process of colonization. J. Anim Breed Genet. 133, 155–164. doi: 10.1111/jbg.12180
Kugler W., Grunenfelder H.-P., and Broxham E. (2007). Donkey Breeds in Europe St. Gallen: Monitoring Institute for Rare Breeds and Seeds in Europe (Gallen Switzerland).
Lacy R. C. (1989). Analysis of founder representation in pedigrees: Founder equivalents and founder genome equivalents. Zoo Biology. 8, 111–123. doi: 10.1002/zoo.1430080203
López-Cortegano E. (2021). purgeR: inbreeding and purging in pedigreed populations. Bioinformatics 38, 564–565. doi: 10.1093/bioinformatics/btab599%JBioinformatics
Lutaaya B. E., Misztal I., Bertrand J. K., and Mabry J. W. (1999). Inbreeding in populations with incomplete pedigrees. Jounal Anim. Breed. Genet. 116, 475–480. doi: 10.1046/j.1439-0388.1999.00210.x
Maggiolino A., Lorenzo J. M., Centoducati G., Domínguez R., Dinardo F. R., Marino R., et al. (2020). How volatile compounds, oxidative profile and sensory evaluation can change with vacuum aging in donkey meat. Anim. (Basel) 10, 2126. doi: 10.3390/ani10112126
Maignel L., Boichard D., and Verrier E. (1996). “Genetic variability of French dairy breeds estimated from pedigree information,” in Proceedings of the Open Session of the Interbull Annual Meeting, No. Sweden: Interbull Centre, Uppsala. vol. 14. , 49–54. doi: 10.1186/1297-9686-24-4-305
Meuwissen T. H.E. and Luo Z. (1992). Computing inbreeding coefficients in large populations. Genetics Selection Evolution 24, 305–313. doi: 10.1186/1297-9686-24-4-305
Muggeo V. M. R. (2003). Estimating regression models with unknown break-points. Stat. Med. 22, 3055–3071. doi: 10.1002/sim.1545
Natrella G., Maggiolino A., De Palo P., Mefleh M., and Faccia M. (2024). Effect of ultrafiltration on the cheesemaking properties of donkey milk. Int. Dairy J. 149, 105830. doi: 10.1016/j.idairyj.2023.105830
Quaresma M. N. P. (2015). The asinina de Miranda donkey breed (Equus asinus): demographic analysis and characterization of the reproductive cycles (Vila Real: Universidade de Trás-os-Montes e Alto Douro).
Quaresma M., Martins A. M. F., Rodrigues J. B., Colaço J., and Payan-Carreira R. (2014). Pedigree and herd characterization of a donkey breed vulnerable to extinction. Animal 8, 354–359. doi: 10.1017/S1751731113002218
Rizzi R., Tullo E., Cito A. M., Caroli A., and Pieragostini E. (2011). Monitoring of genetic diversity in the endangered Martina Franca donkey population. J. Anim. Scince 89, 1304–1311. doi: 10.2527/jas.2010-3379
Santana M. L. Jr. and Bignardi A. B. (2015). Status of the genetic diversity and population structure of the Pêga donkey. Trop. Anim Health Prod 47, 1573–1580. doi: 10.1007/s11250-015-0900-x
Santana M. L., Oliveira J. A., and Lima A. L. F. (2015). Inbreeding and effective population size in a donkey breed. Animal 9, 629–636.
Toro M. A. and Caballero A. (2005). Characterization and conservation of genetic diversity in subdivided populations. Philos. Trans. R Soc. Lond B Biol. Sci. 360, 1367–1378. doi: 10.1098/rstb.2005.1680
Valera M., Molina A., Gutiérrez J. P., Gómez J., and Goyache F. (2005). Pedigree analysis in the Andalusian horse: population structure, genetic variability and influence of the Carthusian strain. Livestock Production Sci. 95, 57–66. doi: 10.1016/j.livprodsci.2004.12.004
Van den Berg K., Ducrocq V., Fritz S., Baur A., Colleau J.-J., Croiseau P., et al. (2019). The impact of genomic selection on genetic diversity and genetic gain in three French dairy cattle breeds. Genet. Selection Evol. 51, 52. doi: 10.1186/s12711-019-0495-1
Wellmann R. (2019). Optimum contribution selection for animal breeding and conservation: the R package optiSel. BMC Bioinf. 20, 25. doi: 10.1186/s12859-018-2450-5
Wickham H. (2016). ggplot2: Elegant Graphics for Data Analysis (New York, NY: Springer-Verlag New York).
Wickham H. (2019). tidyverse: Easily Install and Load the Tidyverse version 2.0.0. Available online at: https://CRAN.R-project.org/package=tidyverse. (Accessed July 20, 2024).
Wickham H., François R., Henry L., and Müller K. (2021). dplyr: A Grammar of Data Manipulation version 1.1.4. Available online at: https://CRAN.R-project.org/package=dplyr. (Accessed July 20, 2024).
Keywords: Martina Franca donkey, Apulia, inbreeding, population genetics, effective population size, generation interval
Citation: Pierini C, Landi V, Ciani E, Maggiolino A, Campanile D, Gomez Carpio M and De Palo P (2025) Conservation and genetic analysis of the endangered Martina Franca donkey using pedigree data. Front. Anim. Sci. 6:1588467. doi: 10.3389/fanim.2025.1588467
Received: 05 March 2025; Accepted: 19 May 2025;
Published: 09 June 2025.
Edited by:
Juliana Petrini, Clinica do Leite Ltda, BrazilReviewed by:
Simon Frederick Lashmar, Agricultural Research Council of South Africa (ARC-SA), South AfricaRiccardo Moretti, University of Turin, Italy
Ante Ivanković, University of Zagreb, Croatia
Copyright © 2025 Pierini, Landi, Ciani, Maggiolino, Campanile, Gomez Carpio and De Palo. This is an open-access article distributed under the terms of the Creative Commons Attribution License (CC BY). The use, distribution or reproduction in other forums is permitted, provided the original author(s) and the copyright owner(s) are credited and that the original publication in this journal is cited, in accordance with accepted academic practice. No use, distribution or reproduction is permitted which does not comply with these terms.
*Correspondence: Vincenzo Landi, dmluY2Vuem8ubGFuZGlAdW5pYmEuaXQ=
†ORCID: Claudia Pierini, orcid.org/0009-0002-9435-897X
Vincenzo Landi, orcid.org/0000-0003-1385-8439
Elena Ciani, orcid.org/0000-0001-5673-0975
Aristide Maggiolino, orcid.org/0000-0001-7128-8556
Mayra Gomez Carpio, orcid.org/0000-0002-3426-2231
Pasquale De Palo, orcid.org/0000-0002-5612-1691