 An-phi Nguyen1,2†
 Paola Nicoletti3†‡
 Damien Arnol1‡Andrea Califano3,4,5,6,7,8,9*
 María Rodríguez Martínez3*‡§
- 1IBM Research–Zurich, Zurich, Switzerland
- 2ETH-Zürich, Zurich, Switzerland
- 3Herbert Irving Cancer Research Center, Columbia University Medical Center, New York, NY, United States
- 4Department of Systems Biology, Columbia University, New York, NY, United States
- 5Herbert Irving Comprehensive Cancer Center, Columbia University, New York, NY, United States
- 6Department of Biomedical Informatics, Columbia University, New York, NY, United States
- 7Department of Biochemistry and Molecular Biophysics, Columbia University, New York, NY, United States
- 8Department of Medicine, Vagelos College of Physicians and Surgeons, Columbia University, New York, NY, United States
- 9J.P. Sulzberger Columbia Genome Center, Columbia University, New York, NY, United States
In the last decade, a large number of genome-wide association studies have uncovered many single-nucleotide polymorphisms (SNPs) that are associated with complex traits and confer susceptibility to diseases, such as cancer. However, so far only a few heritable traits with medium-to-high penetrance have been identified. The vast majority of the discovered variants only leads to disease in combination with other still unknown factors. Furthermore, while many studies aimed to link the effect of SNPs to changes in molecular phenotypes, the analysis has been often focused on testing associations between a single SNP and a transcript, hence disregarding the dysregulation of gene regulatory networks that has been shown to play an essential role in disease onset, notably in cancer. Here we take a systems biology approach and develop GVITamIN (Genetic VarIaTIoN functional analysis tool), a new statistical and computational approach to characterize the effect of a SNP on both genes and transcriptional regulatory programs. GVITamIN exploits a novel statistical approach to combine the usually small effect of disease-susceptibility SNPs, and reveals important potential oncogenic mechanisms, hence taking one step further in the direction of understanding the SNP mechanism of action. We apply GVITamIN on a breast cancer cohort and identify well-known cancer-related transcription factors, such as CTCF, LEF1, and FOXA1, as TFs dysregulated by breast cancer-associated SNPs. Furthermore, our results reveal that SNPs located on the RAD51B gene are significantly associated with an abnormal regulatory activity, suggesting a pivotal role for homologous recombination repair mechanisms in breast cancer.
1. Introduction
Complex diseases, such as cancer, are caused by the interaction of numerous genetic and environmental factors, most of them having a relatively small effect. Single nucleotide polymorphisms (SNPs) have been found to increase susceptibility to certain diseases including cancer. Genome wide association studies (GWAS) have sought to identify some of these associations between categorical phenotypes, e.g., cancer vs. non-cancer, and a limited number of common variants (Manolio, 2010). However despite intense efforts, only a few medium-to-high penetrance heritable traits have been identified, and the majority of heritable genetic risk factors for most common complex diseases remain elusive (Manolio et al., 2009). While SNPs might not be able to explain single-handedly cancer susceptibility, it has been suggested that GWAS data can yield additional insight when combined with other data modalities (Califano et al., 2012).
In parallel, statistical reconstruction of gene regulatory networks in healthy and diseased tissues has led to the identification of key transcription factors (TFs), named master regulators (Lefebvre et al., 2010), that are essential to the establishment and maintenance of a phenotype. Master regulators have been shown to be dysregulated in several human malignancies, such as prostate cancer (Aytes et al., 2014) and brain tumors (Carro et al., 2010). Similarly, prioritization of genes that are upstream of functional disease drivers has enabled the discovery of genetic alterations that are causal determinants of disease (Chen et al., 2014). Following a similar philosophy, we hypothesize here that a combined statistical analysis of the association between cancer susceptibility SNPs and dysregulated TFs might reveal important oncogenic mechanisms. Furthermore, GWAS typically reveal association signals, but rarely the causative events linking variants and phenotypes (Nicolae et al., 2010). Only in a few cases a SNP mechanism of action is known, as it is the case for instance, where a SNP changes a TF binding site (Kumar et al., 2017). However, recent studies suggest that only a minority of causal SNPs alter TF binding motifs (Farh et al., 2015), and indeed, it has been estimated that >90% of disease-associated SNPs lie outside protein coding regions, most likely affecting regulatory regions such enhancers (Hindorff et al., 2009; Ricaño-Ponce and Wijmenga, 2013) or non-coding RNAs (Hrdlickova et al., 2014). Therefore, an alternative promising approach to elucidate the way in which a SNP could contribute to disease is to analyse the dysregulatory molecular events induced by the SNP with the goal of shedding light on the biology of complex traits and etiological pathways.
In this work we seek to elucidate some of the potential mechanisms by which SNPs contribute to gene dysregulation in complex diseases. Specifically, we search whether a cancer-associated SNP alters gene expression levels and/or disrupts TF activity by testing the changes in transcriptional profiles conditioned on the presence of the SNP. Unlike standard expression quantitative trait loci (eQTL) analysis (Nica and Dermitzakis, 2013), which tests for direct associations between SNPs and gene expression changes, we perform a regulatory analysis, where we investigate not only direct changes in gene expression, but also changes in the regulatory activities of TFs. To that end, we introduce a novel statistical pipeline, GVITamIN (genetic VarIaTIoN functional analysis tool). GVITamIN performs two different types of analyses. In a first step, it tests whether a SNP is significantly associated with changes in gene expression. In the second step, it analyzes the correlation of TFs with their targets in order to uncover TFs whose regulatory activity is affected by the presence of a SNP. As a proof of concept, we focus on breast cancer, the most commonly occurring cancer in women and the second most common cancer overall. Previous GWAS have identified numerous SNPs that are associated with an increased risk of breast cancer, however the impact of these SNPs on molecular phenotypes has not been investigated in depth.
2. Materials and Methods
2.1. Overview of the Computational Approach
GVITamIN implements two different search strategies, a first- and a second-order analysis. In the first-order analysis, a differential gene expression analysis conditioned on the presence of the SNP is performed. Unlike eQTL analyses (Nica and Dermitzakis, 2013), which typically look for direct associations between a SNP and gene expression levels in a healthy cohort (Nica and Dermitzakis, 2013), here we ask whether there is an excess of cases who are either homozygotes or complex heterozygotes for a particular SNP in a breast cancer cohort. In doing so, we are distinguishing variants that confer a dominant vs. recessive effect on the risk of a disease, either as homozygotes or compound heterozygotes.
In the second-order analysis, we focus on discoverying SNPs that disrupt the regulatory activity of TFs, where disruption is measured as a change in correlation between the TF and its target genes. To uncover these events, we develop a novel statistical approach that exploits non-parametric statistical tests. To increase statistical power, the results of this analysis are combined into a single p-value for each TF, which quantifies the overall effect of the SNP on the TF and points toward dysregulated oncogenic programs driven by the SNP. Figure 1 summarizes GVITamIN computational approach, and additional details are given in subsections 2.2 and 2.3.
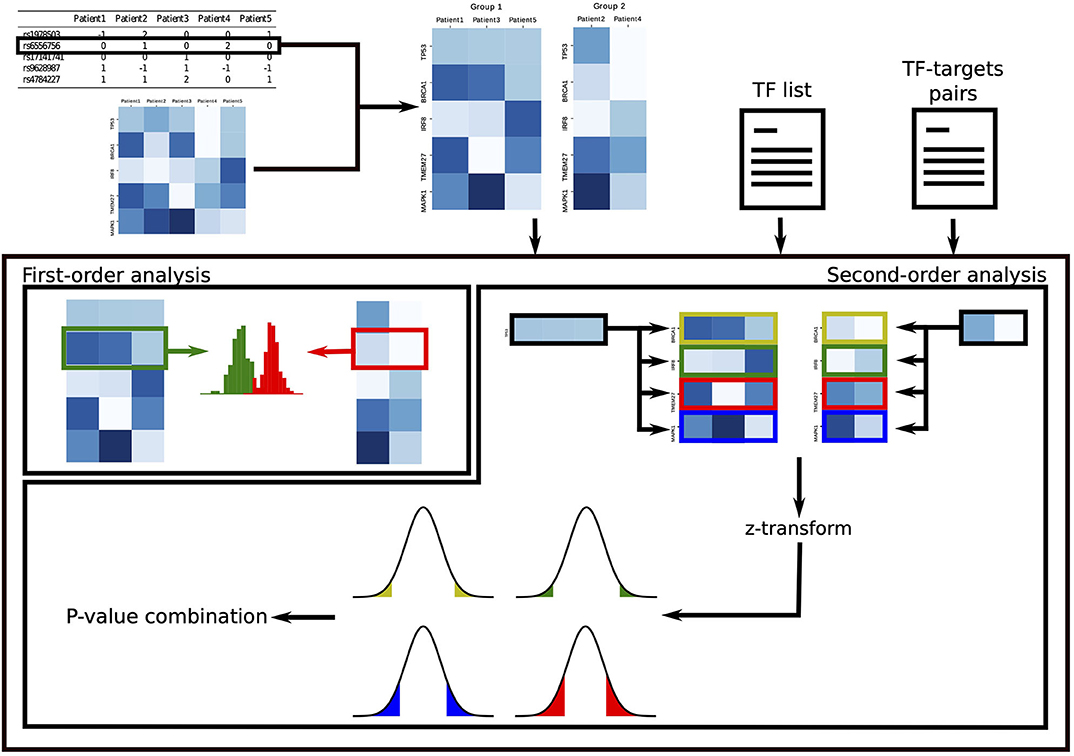
Figure 1. gVITaMIN pipeline. For the analysis on each SNP, we split the patients in two cohorts according to their allele. In the first-order analysis, we compare the distribution of gene expressions of the two cohorts using the non-parametric Mann-Whitney U-test. In the second-order analysis, given a list of Transcription Factors and a (optional) list of TF-TGs pairs, we compute correlations between TFs and their targets. After Fisher's z-transform, we test abnormal regulation activity for each TF-TG pair via a z-test. We finally test the global dysregulation of each TF by combining the p-values over its targets.
To perform both first- and second-order analyses, we separate the cohort in two groups according to the SNP genotyped allele. Namely, for each SNP, we split the cohort in three groups according to the sample's alleles, i.e., as homozygous major, heterozygous and homozygous minor. If the two homozygous groups have a sufficiently large number of samples determined by an user-defined threshold, we compare the homozygous major vs. the homozygous minor and discard the samples that are heterozygous. Here the idea is to preserve the original signal as pure as possible, e.g., not mixing samples which have both the putative risk allele and the wild-type allele. If the number of samples in the homozygous minor group is not sufficiently large to enable a significant study, we merge the heterozygous group with the lower count group. In this paper, we take threshold_samples = 30, although this value can be adapted to study cohorts of varying size. If, after merging, either of the two groups is smaller than threshold_samples, the SNP is discarded for subsequent analysis. We perform this analysis separately for each SNP.
It is easy to notice that the workflow can be easily parallelized on at least two levels. Firstly, it can be run in parallel on different SNPs. Since the analyses on different SNPs are independent, there is no need to aggregate the results in the end and, hence, there is no communication overhead. Moreover, for each SNP, the statistical tests can be performed in parallel for each gene or transcription factor. We implemented GVITamIN in C++, using the MPICH and OpenMP libraries to distribute the workloads. Code and data is available at https://ibm.box.com/s/e0u3gtp807ahikvilssg4717na24jpxt.
2.2. First-Order Analysis
2.2.1. Detecting Differential Gene Expression
In the first-order analysis, we use the Mann-Whitney U-test (Mann and Whitney, 1947) to find SNPs that associate with the differential expression of some genes. The test is performed by computing a statistic U, which depends on the number and ranks of the gene expressions of the samples in each group. Note that the distribution of U under the null hypothesis is known. Further details can be found in the Supplementary Material.
2.2.2. Multiple Hypotheses Correction
Sequencing technologies typically generate measurements of a large number of genes, in the order of tens of thousands. Simultaneously testing all these genes will lead to an inflated type I error (Dickhaus, 2014), i.e., a large number of false positives. This is commonly known as the multiple comparisons problem and is usually solved by correcting the p-values of the tests. Among the many ways to apply this correction, we implement a False Discovery Rate (FDR) controlling procedure designed by Benjamini and Yekutieli (2001) (BHY). Compared to other strategies, such as the ones controlling the Family-Wise Type I Error (FWER) (Dickhaus, 2014), FDR-based techniques have been shown to be less stringent and to have higher statistical power (Genovese, 2004).
2.3. Second-Order Analysis
This analysis is carried out in two levels. First, for each SNP, we test if the correlation between a TF and its targets genes (TGs) is perturbed. Second, to draw global conclusions, we combine the results obtained for the genes targeted by the same TF. Details about both computational analyses follow.
2.3.1. Testing TF-TG Correlations
Using the SNP-associated groups previously defined (section 2.1), our aim is to test if the relationship of a TF-TG pair changes conditioned on the presence of the SNP. This can be done by comparing the correlations between TFs and TGs. Namely, we first compute the correlations between TGs and TFs ρi for each group i ∈ {1, 2}. We then transform the correlations into normally distributed variables using the Fisher's z-transform (Fisher, 1915):
If the samples used to compute the correlations are independent and identically distributed, then z is approximately normally distributed with mean given by Equation (1) and variance:
where Ni is the size of group i. Hence, correlations can be compared using a z-test with null hypothesis:
where is the standard normal distribution. The method described above was derived for Pearson's correlation, but it was empirically shown to work with Spearman's correlation as well. In the latter case, Equation (2) becomes (Fieller et al., 1957). Consequently, the z − score has to be corrected to
GVITamIN can be run using either Pearson or Spearmann correlation. In addition, given the high number of tested TF-TG pairs, we again apply the BHY procedure to correct for multiple comparisons.
2.3.2. Joint Analysis of TF Dysregulation
Once the correlation of individual TF-TGs pairs has been computed, we combine the correlations values obtained in each group by means of the Fisher's method (Fisher, 1992) to combine independent p-values:
where T is the number of TGs of the analyzed TF. Under the null hypothesis, i.e., assuming that the pk come from independent observations, X2 follows a χ2 distribution with 2T degrees of freedom.
The reasons for combining individual pairs predictions are 2-fold. First, from a biological point of view, we are usually interested in investigating the dysregulation of key TFs, which we expect to be associated with important oncogenic pathways. Second, from a statistical point of view, the signal associated with an individual TF-TG can be expected to be small, as SNPs typically only capture a small fraction of the genetic variability (Manolio et al., 2009). Aggregating the predictions associated with different TGs might therefore result in a stronger signal that would have been otherwise undetected after correcting for multiple testing.
2.3.3. Brown Correction for Non-independent Tests
As mentioned before, the Fisher's method can only be applied to independent tests, which is usually not the case when analyzing large sets of correlated genes. The Brown correction (Brown, 1975) handles data dependencies by adjusting the combined test statistics with two rescaling factors, c and f, such that the rescaled distribution cχ2 follows a X2 distribution with f degrees of freedom. The factors c and f are computed from the correlation coefficients between the statistics of each test, i.e., the in Equation (3).
GVITamIN provides two methods to compute these coefficients. The first is based on an asymptotic closed formula that computes the correlations from various moments and cross-moments of the gene expression levels. We refer to the Supplementary Material for details on the derivation. Alternatively, it is possible to generate for each TF bootstrap estimates of the statistics by sampling the patients with replacement. The correlation coefficients to compute c and f are then obtained by applying Pearson's correlation formula on these bootstrap estimates. This second method is recommended for a relatively low number of genes and TFs. In this work, given the computational burden incurred in applying the second method, we applied only the asymptotic approximation.
Finally, after the Brown correction, we obtain a combined p-value for each transcription factor. Since we are simultaneously testing multiple TFs, we apply again the BHY procedure to control the FDR.
2.4. Input Data and Pre-processing
The required inputs to GVITamIN are a genotype matrix, a matrix of gene expression levels per sample and a list of transcription factors of interest. Both the genotype and gene expression levels are provided as matrices, where columns represent a single patient in the cohort and rows correspond, respectively to a SNP or a gene. Optionally, it is possible to provide an additional file containing a list of target genes for each transcription factor. If this file is not provided, the second-order analysis is performed for all possible TF-target gene pairs. Sample data is available for download at https://ibm.box.com/s/e0u3gtp807ahikvilssg4717na24jpxt.
2.4.1. Gene Expression Matrix
We use level 3 RNAseq gene expression data from TCGA, which is already quality-controlled and normalized. Genes are filtered according to two criteria: (i) We limit our analysis to protein-coding genes to facilitate the interpretation of the results. (ii) To limit computational cost and excessive statistical power decrease due to testing too many hypotheses, we exclude uninformative genes, i.e., those genes with almost constant expression levels across our cohort. We note that if the first- and second-order analyses are run using Spearman's correlation, which is invariant under monotonic transformations, further common transformations, such as log or arcsinh, are unnecessary.
2.4.2. SNP Genotype Matrix
The goal of GVITamIN is to unveil possible molecular mechanisms behind SNPs associated with complex diseases, such as breast cancer, and hence, we focus on the analysis of 59 SNPs already known to increase the risk of breast cancer. The list is obtained by overlapping the SNPs mentioned on SNPedia1 with the SNPs for which the data was available from TCGA. This list can be found in the Supplementary Material Section 2.
For the selected SNPs, we obtain a genotype matrix using TCGA low coverage DNA sequencing data and PLINK (Purcell et al., 2007), http://zzz.bwh.harvard.edu/plink/index.shtml. The entries of the matrix are integer numbers indicating for each SNP to which genotype group a patient belongs: 0, 1, and 2 stands, respectively for homozygous major allele, heterozygous and homozygous minor allele. A special value can be set by the user, e.g., “−1,” to indicate missing values or low-confidence calls that should be discarded for further analysis.
2.4.3. Definition of TF-TGs Interactions
To limit the amount of tested hypothesis and increase GVITamIN statistical power, we limit our search to known TF-TG interactions that are supported by experimental evidence, excluding hence purely computational predictions. Specifically, we compile a list of TF-TG interactions using the following databases: ITFP (Zheng et al., 2008), which predicts TF and regulatory interactions from protein sequences and gene expression data using statistical models, and validates them based on experimental evidence from orthologous genes from other mammalian species; the ENCODE project (Consortium, 2012), which identifies TF binding sites (TFBS) using ChIP-seq data and infers the interacting target genes based on the distance of gene transcription starting sites (TSS) from the TFBS; the TRANSFAC project (Wingender, 2008), which follows a similar strategy, while leveraging experimental evidence from different technologies, such as DNase footprinting; TRRUST (Han et al., 2018), a manually curated database of regulatory interactions discovered by text-mining millions of publications. An additional resource provided by Marbach et al. (2016), which uses the cap analysis gene expression (CAGE) (Shiraki et al., 2003), produced a high number of interactions leading us to suspect a high false positive rate. Therefore, we discard this dataset from our lists. The final list of transcription factors and targets interactions is obtained by aggregating the four selected databases and further filtered as explained in the previous section. The list can be downloaded at https://ibm.box.com/s/e0u3gtp807ahikvilssg4717na24jpxt.
2.4.4. Subsampling
To increase the robustness of our results, we re-run GVITamIN on a partition of the original data containing 85% of the samples (without repetition). We managed to run GVITamIN on 272 such partitions in 2 days of running time. To filter out low confidence results, we only keep those results predicted in the main run, i.e. the run using all the samples, as well as in all the 272 subsampling runs. The goal of this procedure is to identify effects which are strong enough to be detected using only subsets of the samples. With this approach, we are reducing the false positive rate at the cost of a slight increased of the false negative rate.
2.4.5. Computing Infrastructure
We run our pipeline using 15 MPI processes and 16 OpenMP threads per MPI process on a cluster equipped with POWER8 processors. In such a setting our code run in about 34 min.
3. Results
We test GVITamIN on a cohort of breast cancer patients collected by the TCGA Research Network2. After the pre-processing described in section 2.4, we obtain expression levels for 15,669 genes and 1,060 patients, which we use to investigate the molecular dysregulation caused by 59 breast cancer-related SNPs. For the second-order analysis, we focus on 766 TF and 114,637 TF-targets interactions as described in 2.4.
3.1. First Order Results
In the first order analysis, we test the association of 59 SNPs with the changes in expression levels of 15669 genes. GVITamIN rejected 17925 out of the 924471 tests at the 0.05 significance level (after FDR correction). After running GVITamIN on various subsamples of the data (section 2.4), we select 3231 rejected tests out of 17925 initial results for further analysis.
3.1.1. Top Results
We report in Table 1 the top 10 results ranked in terms of the FDR-corrected p-value. Most of these top results are related to 2 SNPs, rs4455437 and rs2842347.
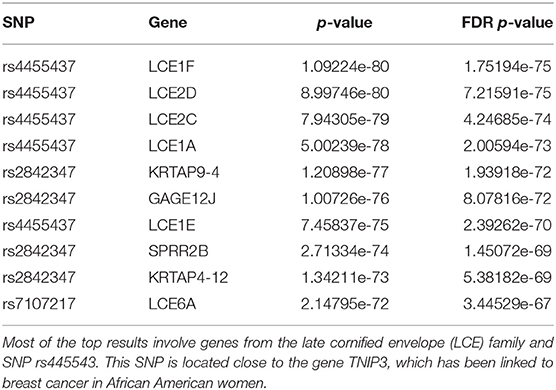
Table 1. First order analysis: top 10 most significant first order results.
rs4455437 is a SNP located ~30 kb downstream of the TNIP3 gene and was recently associated with breast cancer in African American women (Song et al., 2013). From our analysis, rs4455437 seems mostly associated with the genes of the late cornified envelope (LCE) family. Indeed, 11 genes of the 52 genes significantly associated with rs4455437 belong to the LCE gene family—LCE1A, LCE1B, LCE1C, LCE1D, LCE1E, LCE1F, LCE2A, LCE2B, LCE2C, LCE2D, LCE3E, LCE6A. We do not find any evidence of a differential expression of TNIP3 or of other cancer-related genes in the presence of rs4455437. Regarding rs2842347, it has also been recently associated with breast cancer in African American women in the same study cited above (Song et al., 2013). This SNP is located on chromosome 14 on the RAD51B gene, a known cancer gene involved in homologous recombination repair (HRR). Among the genes differentially expressed in the presence of rs2842347, we find genes involved in keratinization, including members of the LCE family.
3.1.2. Gene Set Enrichment Analysis
We further analyze the first order results by performing an enrichment analysis (in the form of a chi-square test) against the following collections of gene sets from the Molecular Signatures Database (MSigDB) (Subramanian et al., 2005; Liberzon et al., 2011): (i) Canonical pathways describing biological processes and manually curated by domain experts. These pathways are derived from the BioCarta (Nishimura, 2001), KEGG (Kanehisa and Goto, 2000; Kanehisa et al., 2016, 2017), and the REACTOME (Fabregat et al., 2018) databases; (ii) Cancer modules (Segal et al., 2004), which includes additional gene sets compiled from other databases, such as KEGG and GO; (iii) Oncogenic signatures, includes additional pathways identified as often disregulated in cancer by analyzing microarray data; (iv) Hallmark, gene sets summarizing all the other databases provided in the MSigDB in 50 specific biological processes with minimal gene overlap.
Most of the SNPs studied in the first order analysis were associated with a relatively low number of differentially expressed genes. We therefore focus our analysis on 3 SNPs associated with more than 100 genes: rs421379, rs3784099, and rs2048672 (associated respectively with 1,329, 1,009, and 117 genes). Results for rs421379 and rs2048672 are reported in Table 2. We do not observe any significant result for rs3784099 after FDR correction.
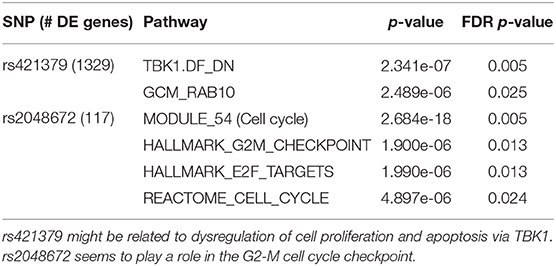
Table 2. Gene enrichment analysis for the 2 of the SNPs associated with the highest number of genes: rs421379 and rs2048672.
For rs421379, we obtain two significantly enriched gene sets. TBK1.DF_DN (Barbie et al., 2009) is a gene set composed of genes down-regulated as a combination of an over-expressed oncogenic form of KRAS and the suppression of TBK1, a kinase that regulates cell proliferation, apoptosis, autophagy, and anti-tumor immunity (Helgason et al., 2013; Durand et al., 2018). GCM_RAB10 includes genes located in the neighborhood of the RAB10 gene, a member of the RAS oncogene family. While KRAS and RAB10 belong to functionally different gene families, they are both part of the Ras protein superfamily, whose members function as monomeric G proteins that act as binary molecular switches that can regulate cell proliferation. Overactivation of Ras signaling can lead to cancer (Wennerberg et al., 2005). Interestingly, rs421379 is located on the Chromosome 5 relatively close (556 kb upstream of) to the ARRDC3 gene, which could play a role in the regulation of G protein-coupled receptors (Nabhan et al., 2010; Han et al., 2013).
In the presence of rs2048672, differentially expressed genes show an enrichment in gene sets related to cell cycle. Namely, pathways HALLMARK _ E2F _ TARGETS and HALLMARK _ G2M _CHECKPOINT suggest an association of rs2048672 with specific phases of cell cycle. During the G2-M checkpoint, cells are checked for defective DNA, and damage are repaired if necessary, before initiating mitosis. E2F transcription factors have been shown to play an important role in the regulation of genes involved in the G1-S phase of the cell cycle (Dyson, 1998; Nevins, 1998). However, more recent studies have shown evidence of some involvement of E2F proteins in the G2-M stage as well (Polager et al., 2002; Ren et al., 2002). In particular, Zhu et al. (2004) suggested that E2F are directly regulating the expression of mitotic genes.
3.2. Results of the Second Order Analysis
In the second order analysis we study the dysregulation of the interactions between 766 transcription factors and their target genes, for a total of 114,637 TF-targets interactions, conditioned on the presence of the 59 SNPs. We obtain 36 significant results at the 0.05 significance level after FDR correction. Given the low number of significant results we do not prioritize them by subsampling and we do not perform an enrichment analysis. We show the top 15 results in Table 3.
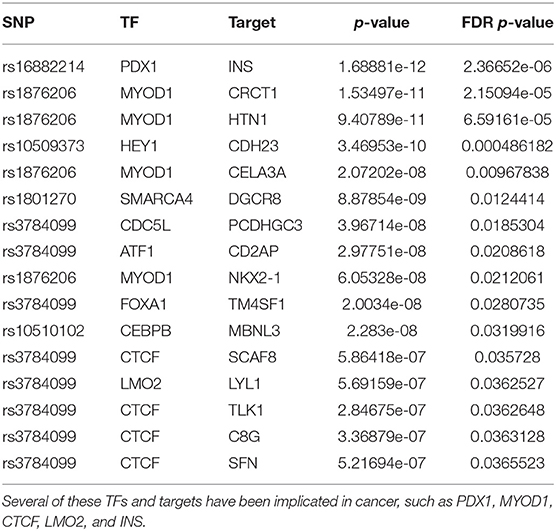
Table 3. Second order analysis: top 15 most significant results.
3.2.1. Top Results
The most significant result involves the association of rs16882214 with the PDX1-INS pair. PDX1 is a TF of homeobox genes family important in differentiation and development of the pancreas, duodenum and antrum, which functions as a putative tumor suppressor in gastric cancer (Ma et al., 2008; Roy et al., 2016). In addition, polymorphisms in the INS have been reported to be associated with increased prostate cancer risk (Ho et al., 2003).
The second most significant result involves rs1876206, a SNP located on the FBN1 gene that is associated with the dysregulation of the TF MYOD1 and 4 of its targets (CRCT1, HTN1, CELA3A, and NKX2-1). Interestingly, recent studies suggest both a role for FBN1 (Wang et al., 2015) and MYOD1 (Cai et al., 2016) in breast cancer. Several of the TGs have been also implicated in cancer (Wu et al., 2016; Matsubara et al., 2017; Li et al., 2019).
Like rs2842347, identified in the first order analysis (Table 1), rs3784099 is located on the RAD51B gene. This SNP is involved in most of the significant second order results (27 out of 36). From Table 4 we note four transcription factors (CTCF, EP300, YY1, LMO2) whose correlation with more than one target is significantly perturbed in the presence of rs3784099. CTCF, EP300 and LMO2 are listed in the Catalog Of Somatic Mutations In Cancer (COSMIC) (Tate et al., 2018) as genes that are causally implicated in cancer if mutated. Also the multifunctional TF YY1 has been reported to have an oncogenic role (Zhang et al., 2011). In particular, in breast cancer, it seems to have a negative regulatory effect on p27, a cell cycle inhibitor protein (Wan et al., 2012). The target genes involved in these results are reported in Table 5. Among these genes, PICALM (targeted by EP300), DDX6 (targeted by YY1) and LYL1 (targeted by LMO2) are reported on the COSMIC cancer gene list.
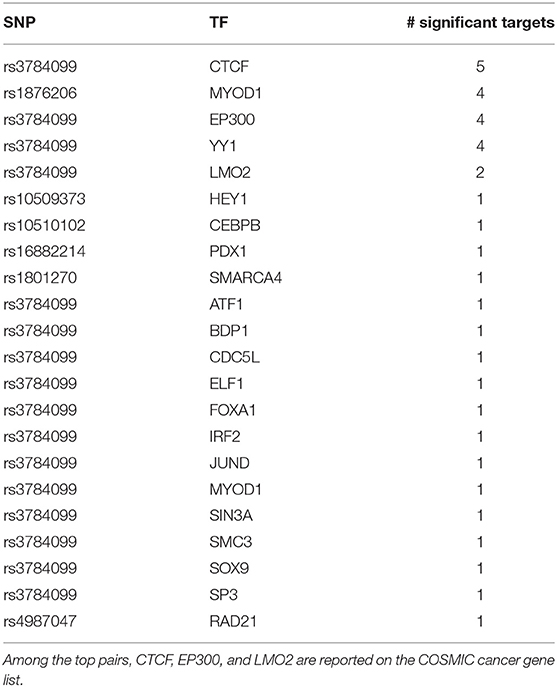
Table 4. List of SNP-TF pairs ranked by number of significant targets.
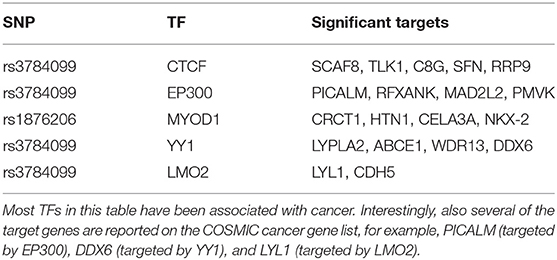
Table 5. Significant targets for the top significant transcription factors with at least one significant target.
3.3. Results of TF-Combined Second Order Analysis
Next, we combine the p-values obtained from the second order analysis, obtaining a single p-value for each TF and for each of the 59 SNPs. We reject 3,860 tests at the 0.05-significance level after FDR correction. It can be noted that this number is much higher compared to the second-order analysis on TF-target-SNPs triplets (section 3.2). This may be due to the fact that by combining p-values, we are effectively combining multiple evidences from different targets. Given the higher number of targets for each TF, the combined p-values may have higher chance to be significant. As for the first order analysis, we filter out minor results by running GVITamIN on subsamples of the data, finally retaining only 356 rejected tests. These tests involve 148 TFs, 48 of which can be found in the COSMIC cancer genes list. In Table 6 we report the top results of the TF-combined analysis, while in Table 7 we report the top 10 SNPs associated with the highest number of significant results.
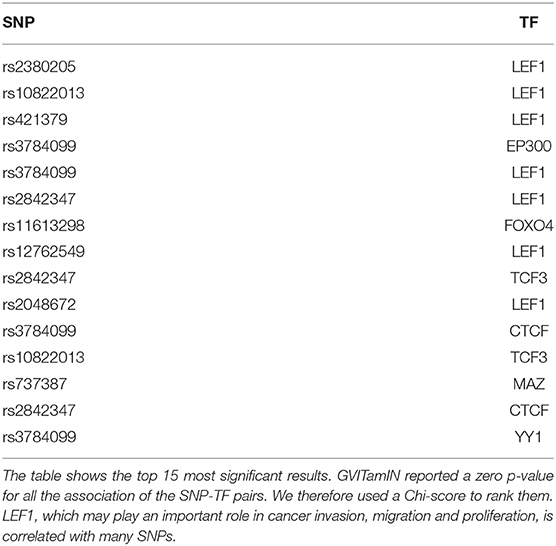
Table 6. Results of the global second order analysis.
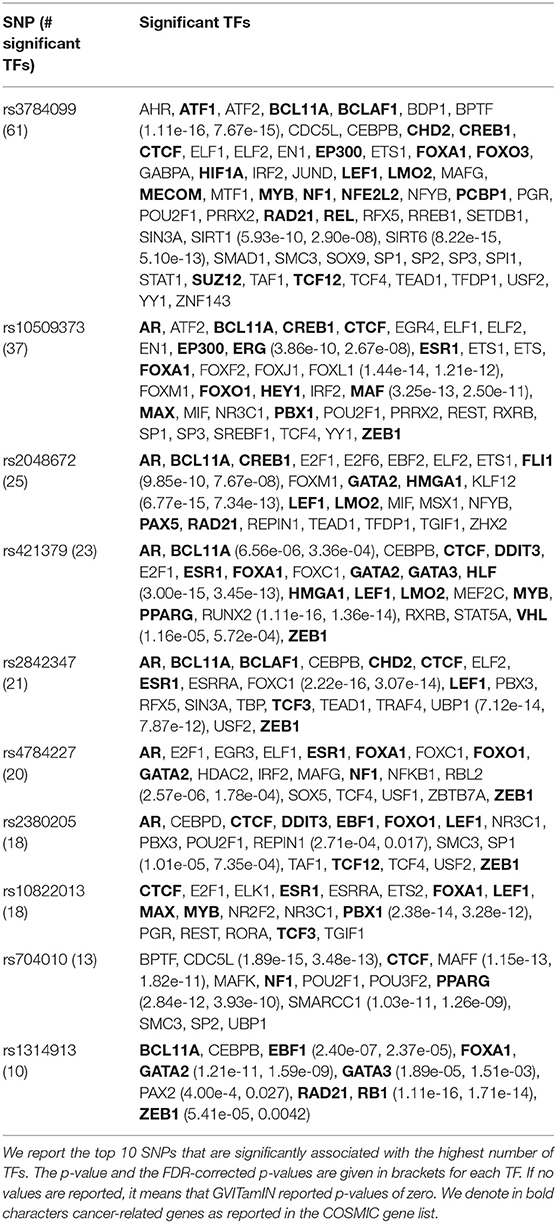
Table 7. Global second order analysis.
3.3.1. Top Results
In Table 6, we observe that 7 out of the 15 top results involve the LEF1 transcription factor. A recent review article (Santiago et al., 2017) has highlighted the central role of LEF1 in cancer invasion, migration and proliferation, suggesting its use as a biomarker and potential target for treatments. While LEF1 is commonly seen as an important transcription factor in the Wnt/β-catenin signaling pathway, it can also function independently from it, with several possible downstream consequences. The fact that LEF1 was significantly associated with a relatively high number of SNPs, which are not in linkage disequilibrium, nor inducing the same cohort splitting (see Figure S1), in our analyses might be additional evidence in support of its pivotal role in breast cancer.
Almost all the results involve known cancer-related transcription factors reported in the COSMIC gene list. The only top results TFs not included in the list are MAZ and YY1. The connection of YY1 with cancer was already discussed in section 3.2. Regarding MAZ, a TF highly upregulated in chronic inflammatory disease and several human cancers, several studies have pointed its connection with breast cancer (Yu et al., 2017) and colon cancer (Triner et al., 2018).
3.3.2. Top Transcription Factors
Motivated by the results involving LEF1, we study which TFs are significantly associated with the highest number of SNPs. Such analysis could reveal TFs frequently dysregulated by cancer-related SNPs and that are suspected hence of having an oncogenic role. We report in Table 8 14 TFs associated with 5 or more SNPs. Similarly to LEF1, these TFs are also associated with SNPs that are not in linkage disequilibrium nor inducing the same cohort splits.
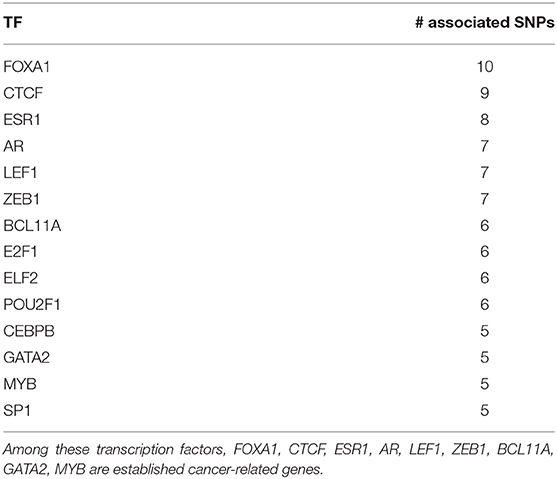
Table 8. TFs significantly associated with the highest number of SNPs.
Among these TFs, 9 (FOXA1, CTCF, ESR1, AR, LEF1, ZEB1, BCL11A, GATA2, MYB) are well-known cancer-related genes. For instance, FOXA1 and ESR1 (also known as ERα) are part of a transcriptional network responsible of the control of gene expression patterns of luminal A breast cancer (Nakshatri and Badve, 2009). This is the most common breast cancer subtype (Fallahpour et al., 2017) and is characterized by responsiveness to hormonal therapies and, consequently, good prognosis (Nakshatri and Badve, 2009). Indeed, FOXA1 has been hypothesized to be a mediator of hormonal response in breast and prostate cancer (Robinson and Carroll, 2012), and a hormonal regulatory complex involving FOXA1, GATA2 and AR has been shown to control gene expression in prostate cancer (Zhao et al., 2016). Other important associations are readily found in the literature: MYB has been connected with anomalies in the regulatory mechanisms involving ERα (Ramsay and Gonda, 2008). BCL11A is over-expressed and its genomic locus frequently amplified in triple-negative breast cancer gene, suggesting a tumorigenic role in these tumors (Khaled et al., 2015). ZEB1 has a pivotal role in tumor progression and metastasis and can underlie chemotherapeutic resistance in breast cancer (Zhang et al., 2015, 2018).
CTCF deserves a special mention. A multifunctional transcription factor, CTCF plays a role in many types of cancer, including breast cancer, via different mechanisms (Oh et al., 2017). For example, the CTCF-cohesin complex is involved in the formation of topologically associated domains (TADs) and chromatin loops (Ghirlando and Felsenfeld, 2016). Dysregulation of CTCF might lead to abnormal 3D DNA structure impacting the normal functioning of the cell (Pinoli et al., 2020).
3.3.3. Top SNPs
Finally, we focus on the SNPs that dysregulate a higher number of TFs. Table 7 reports 10 SNPs that are significantly associated with the dysregulation of at least 10 TFs. The TFs are reported on the right column.
rs3784099 is the SNP associated by a large margin with the highest number of TFs. This SNP, already identified in the first order analysis (section 3.1), is located on the RAD51B gene, an important paralog of RAD51 involved in homologous recombination repair (HRR) after double strand breaks. Most of double strand breaks occurring during the G2 phase of the cell cycle are repaired by HRR, which although less error-prone than the alternative non-homologous end-joining, it is far from error-free (Malkova and Haber, 2012; Cannan and Pederson, 2016). Mutations on HRR genes can rapidly result in further damages that impair many downstream processes.
Interestingly, two other SNPs in Table 7, rs2842347 and rs1314913, are also located on RAD51B, which could mean that they play a role similar to rs3784099. rs10822013 is located on ZNF365 which also plays a role in HRR (Zhang et al., 2013). rs704010 is a mutation of the gene ZMIZ1, which has been shown to regulate the activity of various cancer-related transcription factors, including AR (Sharma et al., 2003) and P53 (Lee et al., 2007).
Unfortunately, the other SNPs in Table 7 are located on non-coding RNA genes or intergenic regions whose functions are still unknown/unclear, rendering difficult their functional interpretation.
4. Discussion
We present here GVITamIN, a novel statistical tool to extract insights about the potential mechanism of action of disease-susceptibility SNPs associated with complex diseases, such as cancer. GVITamIN searches for direct perturbations in genes as well as dysregulation of transcription factor programs conditioned on the presence of cancer-associated SNPs. From a methodological point of view, we provide a theoretically well-grounded approach to summarize multiple weak evidences of SNP-induced molecular perturbations into statistically robust predictions about the oncogenic function of the SNP. Some of our main findings are discussed below.
4.1. The Central Role of RAD51B and the Homologous Recombination Repair Mechanism
Our results show that multiple cancer-susceptibility SNPs, namely rs3784099, rs2842347, and rs1314913, are located on RAD51B, a gene whose protein is essential for DNA repair by homologous recombination. The specific mechanism of action of each SNP differs, varying from inducing the differential expression of several genes of the LCE family, associated with breast cancer in African American women (section 2.2), to inducing the malfunctioning of several transcription factors implicated in cancer, e.g., CTCF, EP300, YY1, LMO2 (section 3.2). This result is not surprising, as disruptions in DNA repair pathways predispose cells to accumulating DNA damage (Kelley et al., 2014). An interesting question is whether these SNPs are functionally similar, i.e., whether they elicit the molecular dysregulation of the same pathways. Table 7 shows that the TFs dysregulated by rs3784099, rs2842347, and rs1314913 are different. In addition, the 3 SNPs induce different cohort splits (see Figure S1), which seems to indicate that each SNP affects RAD51B by means of a different molecular mechanism.
4.2. First Order Analysis Identifies Critical Carcinogenic Pathways
We tested the association of 59 cancer-susceptibility SNPs with changes in expression levels in a breast cancer cohort. While most SNPs were associated with a low number of dysregulated genes, rs421379, rs3784099, and rs2048672 were significantly associated with more than 100 genes. A gene set enrichment analysis performed on the identified genes revealed associated with key oncogenic pathways, such as TBK1.DF_DN (Barbie et al., 2009), a gene set that signals the over-expression of an oncogenic form of KRAS and the suppression of TBK1, a kinase that regulates cell proliferation, apoptosis, autophagy, and anti-tumor immunity (Helgason et al., 2013; Durand et al., 2018). Similarly, members of the GCM_RAB10 pathway, which includes genes located in the neighborhood of the RAB10 gene, a member of the RAS oncogene family (Wennerberg et al., 2005), are targeted by several of the studied SNPs. Also intriguing is the identification of pathways associated with cell cycle and check points, such as HALLMARK_E2F_TARGETS and HALLMARK_G2M _CHECKPOINT, whose dysregulation has a critical and well-known role in carcinogenesis.
4.3. Cancer-Susceptibility SNPs Tend to Dysregulate Cancer-Associated Transcription Factors
Ranking TFs according to the number of significantly associated cancer-susceptibility SNPs reveals many well-known cancer-related transcription factors (see Table 8). Among them, FOXA1 and ESR1 form part of a transcriptional network responsible of the control of gene expression patterns in luminal A breast cancer (Nakshatri and Badve, 2009), the most common breast cancer subtype. Our results suggest that the number of genetic variants affecting the activity of a transcription factor could be used as a proxy of the susceptibility to a related trait (in our case, breast cancer) and its severity. This conclusion aligns with the common variant-common disease hypothesis (Reich and Lander, 2001), which states that common disease-causing variants can be found in all human populations which manifest a given disease. Since highly penetrant mutations are relatively rare (Greaves, 2015), it is expected that a higher number of lower penetrance variants are needed for a deleterious effect to manifest, e.g., developing breast cancer.
4.4. Future Work
Our analyses demonstrate the validity of a combined statistical approach that exploits knowledge about transcriptional regulation within the cell. Further work is however necessary to investigate whether a combination of both types of analyses (first and second order analysis) can provide deeper insights on transcriptional mechanisms. Another possible improvement is the extension of our pipeline to other types of regulatory mechanisms, or to higher-order interactions. For example, the second-order analysis does not consider TF-TG interactions which are mediated by a co-factor. We observe, however, that such higher-order analyses would require more samples to achieve statistical significance.
5. Conclusion
We have presented here GVITamIN, a new statistical and computational approach to characterize the potential effect of a SNP on both genes and transcriptional regulatory programs. As demonstrated in this work, our novel statistical approach is able to combine the usually small effect of disease-susceptibility SNPs to reveal important oncogenic mechanisms, which were corroborated with published previous studies. An inherent problem to many statistical approaches to analyse high-throughput data is the high number of false positive results, even after FDR correction. While the only robust approach to reduce the number of false positives is to limit the number of tests and/or increase the sample size, workarounds can be designed to prioritize the results. In GVITamIN we implement a p-value cutoff based on subsampling/bootstrapping. Other approaches, such as ranking the results according to the FDR p-values and setting a very stringent p-value might unfairly penalize SNPs with very unbalanced sample sizes (as a result of an unbalanced cohort split), i.e., where one group size is close to the acceptance threshold (threshold_samples) resulting in predictions characterized by larger p-values.
We emphasize that GVITamIN is not limited to SNPs only, but could be used to characterize any categorical mutation or structural alteration with the potential of affecting gene expressions levels, such as short tandem repeats mutations, epigenetic changes, mutations altering topologically associated domains (TADs), etc.
As a final remark, we note that gVITaMIN can not infer the causal structure of such mechanisms, which require either longitudinal studies that follow a cohort through time or functional studies. In the absence of those, our rigorous statistical analysis might help identify candidate explanations for further experimental validation from one single time point observational data.
Data Availability Statement
Publicly available transcriptomic data from TCGA breast cancer samples (available at https://portal.gdc.cancer.gov/) was analyzed in this study. Preprocessed data is available at https://ibm.box.com/s/e0u3gtp807ahikvilssg4717na24jpxt.
Ethics Statement
Ethical review and approval was not required for the study on human participants in accordance with the local legislation and institutional requirements. The patients/participants provided their written informed consent to participate in this study.
Author Contributions
AN implemented the code. PN contributed toward the interpretation of the results. DA performed data analysis. AC and MR conceived the study and analysis. AN and MR wrote the manuscript with input from all authors. All authors contributed to the article and approved the submitted version.
Funding
The project leading to this application has received funding from the European Union's Horizon 2020 research and innovation program under grant agreements Nos. 668858 and 826121. This research was further supported by the following NIH grants to Andrea Califano: U54 CA209997 (Cancer Systems Biology Consortium); S10 OD012351 and S10 OD021764 (Shared Instrument Grants).
Conflict of Interest
AC is the founder, equity holder, consultant, and director of DarwinHealth Inc., a company that has licensed some of the algorithms used in this manuscript from Columbia University. Columbia University is also an equity holder in DarwinHealth Inc.
The remaining authors declare that the research was conducted in the absence of any commercial or financial relationships that could be construed as a potential conflict of interest.
Acknowledgments
We thank Pavel Sumazin and Gonzalo López for useful discussions.
Supplementary Material
The Supplementary Material for this article can be found online at: https://www.frontiersin.org/articles/10.3389/fbioe.2020.00798/full#supplementary-material
Footnotes
References
Aytes, A., Mitrofanova, A., Lefebvre, C., Alvarez, M. J., Castillo-Martin, M., Zheng, T., et al. (2014). Cross-species analysis of genome-wide regulatory networks identifies a synergistic interaction between FOXM1 and CENPF that drives prostate cancer malignancy. Cancer Cell 25:638. doi: 10.1016/j.ccr.2014.03.017
Barbie, D. A., Tamayo, P., Boehm, J. S., Kim, S. Y., Moody, S. E., Dunn, I. F., et al. (2009). Systematic RNA interference reveals that oncogenic kRAS-driven cancers require TBK1. Nature 462, 108–112. doi: 10.1038/nature08460
Benjamini, Y., and Yekutieli, D. (2001). The control of the false discovery rate in multiple testing under dependency. Ann. Stat. 29, 1165–1188. doi: 10.1214/aos/1013699998
Brown, M. B. (1975). 400: A method for combining non-independent, one-sided tests of significance. Biometrics 31, 987–992. doi: 10.2307/2529826
Cai, C., Qin, X., Wu, Z., Shen, Q., Yang, W., Zhang, S., et al. (2016). Inhibitory effect of myod on the proliferation of breast cancer cells. Oncol. Lett. 11, 3589–3596. doi: 10.3892/ol.2016.4448
Califano, A., Butte, A. J., Friend, S., Ideker, T., and Schadt, E. (2012). Leveraging models of cell regulation and GWAS data in integrative network-based association studies. Nat. Genet. 44, 841–847. doi: 10.1038/ng.2355
Cannan, W. J., and Pederson, D. S. (2016). Mechanisms and consequences of double-strand DNA break formation in chromatin. J. Cell. Physiol. 231, 3–14. doi: 10.1002/jcp.25048
Carro, M. S., Lim, W. K., Alvarez, M. J., Bollo, R. J., Zhao, X., Snyder, E. Y., et al. (2010). The transcriptional network for mesenchymal transformation of brain tumours. Nature 463, 318–325. doi: 10.1038/nature08712
Chen, J. C., Alvarez, M. J., Talos, F., Dhruv, H., Rieckhof, G. E., Iyer, A., et al. (2014). Identification of causal genetic drivers of human disease through systems-level analysis of regulatory networks. Cell 159, 402–414. doi: 10.1016/j.cell.2014.09.021
Consortium, T. E. P. (2012). An integrated encyclopedia of DNA elements in the human genome. Nature 489, 57–74. doi: 10.1038/nature11247
Durand, J. K., Zhang, Q., and Baldwin, A. S. (2018). Roles for the IKK-related kinases TBK1 and IKKϵ in cancer. Cells 7:139. doi: 10.3390/cells7090139
Dyson, N. (1998). The regulation of E2F by prb-family proteins. Genes Dev. 12, 2245–2262. doi: 10.1101/gad.12.15.2245
Fabregat, A., Jupe, S., Matthews, L., Sidiropoulos, K., Gillespie, M., Garapati, P., et al. (2018). The reactome pathway knowledgebase. Nucleic Acids Res. 46, D649–D655. doi: 10.1093/nar/gkx1132
Fallahpour, S., Navaneelan, T., De, P., and Borgo, A. (2017). Breast cancer survival by molecular subtype: a population-based analysis of cancer registry data. CMAJ Open 5, E734–E739. doi: 10.9778/cmajo.20170030
Farh, K. K.-H., Marson, A., Zhu, J., Kleinewietfeld, M., Housley, W. J., Beik, S., et al. (2015). Genetic and epigenetic fine-mapping of causal autoimmune disease variants. Nature 518, 337–343. doi: 10.1038/nature13835
Fieller, E. C., Hartley, H. O., and Pearson, E. S. (1957). Tests for rank correlation coefficients. I. Biometrika 44, 470–481. doi: 10.1093/biomet/44.3-4.470
Fisher, R. A. (1915). Frequency distribution of the values of the correlation coefficient in samples from an indefinitely large population. Biometrika 10, 507–521. doi: 10.1093/biomet/10.4.507
Genovese, C. R. (2004). A Tutorial on False Discovery Control. Available online at: https://www.stat.cmu.edu/~genovese/talks/hannover1-04.pdf.
Ghirlando, R., and Felsenfeld, G. (2016). CTCF: making the right connections. Genes Dev. 30, 881–891. doi: 10.1101/gad.277863.116
Greaves, M. (2015). Evolutionary determinants of cancer. Cancer Discov. 5, 806–820. doi: 10.1158/2159-8290.CD-15-0439
Han, H., Cho, J.-W., Lee, S., Yun, A., Kim, H., Bae, D., et al. (2018). Trrust v2: an expanded reference database of human and mouse transcriptional regulatory interactions. Nucleic Acids Res. 46, D380–D386. doi: 10.1093/nar/gkx1013
Han, S.-O., Kommaddi, R. P., and Shenoy, S. K. (2013). Distinct roles for b-arrestin2 and arrestin-domain-containing proteins in b2 adrenergic receptor trafficking. EMBO Rep. 14, 164–171. doi: 10.1038/embor.2012.187
Helgason, E., Phung, Q. T., and Dueber, E. C. (2013). Recent insights into the complexity of Tank-binding kinase 1 signaling networks: the emerging role of cellular localization in the activation and substrate specificity of TBK1. FEBS Lett. 587, 1230–1237. doi: 10.1016/j.febslet.2013.01.059
Hindorff, L. A., Sethupathy, P., Junkins, H. A., Ramos, E. M., Mehta, J. P., Collins, F. S., et al. (2009). Potential etiologic and functional implications of genome-wide association loci for human diseases and traits. Proc. Natl. Acad. Sci. U.S.A. 106, 9362–9367. doi: 10.1073/pnas.0903103106
Ho, G. Y. F., Melman, A., Liu, S.-M., Li, M., Yu, H., Negassa, A., et al. (2003). Polymorphism of the insulin gene is associated with increased prostate cancer risk. Br. J. Cancer 88, 263–269. doi: 10.1038/sj.bjc.6600747
Hrdlickova, B., de Almeida, R. C., Borek, Z., and Withoff, S. (2014). Genetic variation in the non-coding genome: involvement of micro-RNAs and long non-coding RNAs in disease. Biochim. Biophys. Acta 1842, 1910–1922. doi: 10.1016/j.bbadis.2014.03.011
Kanehisa, M., Furumichi, M., Tanabe, M., Sato, Y., and Morishima, K. (2017). KEGG: new perspectives on genomes, pathways, diseases and drugs. Nucleic Acids Res. 45, D353–D361. doi: 10.1093/nar/gkw1092
Kanehisa, M., and Goto, S. (2000). KEGG: Kyoto encyclopedia of genes and genomes. Nucleic Acids Res. 28, 27–30. doi: 10.1093/nar/28.1.27
Kanehisa, M., Sato, Y., Kawashima, M., Furumichi, M., and Tanabe, M. (2016). KEGG as a reference resource for gene and protein annotation. Nucleic Acids Res. 44, D457–D462. doi: 10.1093/nar/gkv1070
Kelley, M. R., Logsdon, D., and Fishel, M. L. (2014). Targeting DNA repair pathways for cancer treatment: what's new? Future Oncol. 10, 1215–1237. doi: 10.2217/fon.14.60
Khaled, W. T., Lee, S. C., Stingl, J., Chen, X., Ali, H. R., Rueda, O. M., et al. (2015). BCL11a is a triple-negative breast cancer gene with critical functions in stem and progenitor cells. Nat. Commun. 6, 1–10. doi: 10.1038/ncomms6987
Kumar, S., Ambrosini, G., and Bucher, P. (2017). SNP2tfbs–a database of regulatory SNPs affecting predicted transcription factor binding site affinity. Nucleic Acids Res. 45, D139–D144. doi: 10.1093/nar/gkw1064
Lee, J., Beliakoff, J., and Sun, Z. (2007). The novel PIAS-like protein hZimp10 is a transcriptional co-activator of the p53 tumor suppressor. Nucleic Acids Res. 35, 4523–4534. doi: 10.1093/nar/gkm476
Lefebvre, C., Rajbhandari, P., Alvarez, M. J., Bandaru, P., Lim, W. K., Sato, M., et al. (2010). A human B-cell interactome identifies MYB and FOXM1 as master regulators of proliferation in germinal centers. Mol. Syst. Biol. 6:377. doi: 10.1038/msb.2010.31
Li, N., Zhao, X., and You, S. (2019). Identification of key regulators of pancreatic ductal adenocarcinoma using bioinformatics analysis of microarray data. Medicine 98:e14074. doi: 10.1097/MD.0000000000014074
Liberzon, A., Subramanian, A., Pinchback, R., Thorvaldsdóttir, H., Tamayo, P., and Mesirov, J. P. (2011). Molecular signatures database (MSigDB) 3.0. Bioinformatics 27, 1739–1740. doi: 10.1093/bioinformatics/btr260
Ma, J., Chen, M., Wang, J., Xia, H. H. X., Zhu, S., Liang, Y., et al. (2008). Pancreatic duodenal homeobox-1 (PDX1) functions as a tumor suppressor in gastric cancer. Carcinogenesis 29, 1327–1333. doi: 10.1093/carcin/bgn112
Malkova, A., and Haber, J. E. (2012). Mutations arising during repair of chromosome breaks. Annu. Rev. Genet. 46, 455–473. doi: 10.1146/annurev-genet-110711-155547
Mann, H. B., and Whitney, D. R. (1947). On a test of whether one of two random variables is stochastically larger than the other. Ann. Math. Stat. 18, 50–60. doi: 10.1214/aoms/1177730491
Manolio, T. A. (2010). Genomewide association studies and assessment of the risk of disease. N. Engl. J. Med. 363, 166–176. doi: 10.1056/NEJMra0905980
Manolio, T. A., Collins, F. S., Cox, N. J., Goldstein, D. B., Hindorff, L. A., Hunter, D. J., et al. (2009). Finding the missing heritability of complex diseases. Nature 461, 747–753. doi: 10.1038/nature08494
Marbach, D., Lamparter, D., Quon, G., Kellis, M., Kutalik, Z., and Bergmann, S. (2016). Tissue-specific regulatory circuits reveal variable modular perturbations across complex diseases. Nat. Methods 13:366. doi: 10.1038/nmeth.3799
Matsubara, D., Soda, M., Yoshimoto, T., Amano, Y., Sakuma, Y., Yamato, A., et al. (2017). Inactivating mutations and hypermethylation of the NKX2-1/TTF-1 gene in non-terminal respiratory unit-type lung adenocarcinomas. Cancer Sci. 108, 1888–1896. doi: 10.1111/cas.13313
Nabhan, J. F., Pan, H., and Lu, Q. (2010). Arrestin domain-containing protein 3 recruits the NEDD4 E3 ligase to mediate ubiquitination of the beta2-adrenergic receptor. EMBO Rep. 11, 605–611. doi: 10.1038/embor.2010.80
Nakshatri, H., and Badve, S. (2009). FOXA1 in breast cancer. Expert Rev. Mol. Med. 11:e8. doi: 10.1017/S1462399409001008
Nevins, J. (1998). Toward an understanding of the functional complexity of the E2F and retinoblastoma families. Cell Growth Differ. 9, 585–593.
Nica, A. C., and Dermitzakis, E. T. (2013). Expression quantitative trait loci: present and future. Philos. Trans. R. Soc. B Biol. Sci. 368:1620. doi: 10.1098/rstb.2012.0362
Nicolae, D. L., Gamazon, E., Zhang, W., Duan, S., Dolan, M. E., and Cox, N. J. (2010). Trait-associated snps are more likely to be eQTLs: annotation to enhance discovery from GWAS. PLoS Genet. 6:e1000888. doi: 10.1371/journal.pgen.1000888
Nishimura, D. (2001). Biocarta. Biotech. Softw. Internet Rep. 2, 117–120. doi: 10.1089/152791601750294344
Oh, S., Oh, C., and Yoo, K. H. (2017). Functional roles of CTCF in breast cancer. BMB Rep. 50, 445–453. doi: 10.5483/BMBRep.2017.50.9.108
Pinoli, P., Stamoulakatou, E., Nguyen, A., Rodríguez Martínez, M., and Ceri, S. (2020). Pan-cancer analysis of somatic mutations and epigenetic alterations in insulated neighbourhood boundaries. PLoS ONE. 15:1–20. doi: 10.1371/journal.pone.0227180
Polager, S., Kalma, Y., Berkovich, E., and Ginsberg, D. (2002). E2Fs up-regulate expression of genes involved in DNA replication, DNA repair and mitosis. Oncogene 21:437. doi: 10.1038/sj.onc.1205102
Purcell, S., Neale, B., Todd-Brown, K., Thomas, L., Ferreira, M. A. R., Bender, D., et al. (2007). PLINK: a tool set for whole-genome association and population-based linkage analyses. Am. J. Hum. Genet. 81, 559–575. doi: 10.1086/519795
Ramsay, R. G., and Gonda, T. J. (2008). MYB function in normal and cancer cells. Nat. Rev. Cancer 8, 523–534. doi: 10.1038/nrc2439
Reich, D. E., and Lander, E. S. (2001). On the allelic spectrum of human disease. Trends Genet. 17, 502–510. doi: 10.1016/S0168-9525(01)02410-6
Ren, B., Cam, H., Takahashi, Y., Volkert, T., Terragni, J., Young, R. A., et al. (2002). E2F integrates cell cycle progression with dna repair, replication, and G2/M checkpoints. Genes Dev. 16, 245–256. doi: 10.1101/gad.949802
Ricaño-Ponce, I., and Wijmenga, C. (2013). Mapping of immune-mediated disease genes. Annu. Rev. Genomics Hum. Genet. 14, 325–353. doi: 10.1146/annurev-genom-091212-153450
Robinson, J. L. L., and Carroll, J. S. (2012). FoxA1 is a key mediator of hormonal response in breast and prostate cancer. Front. Endocrinol. 3:68. doi: 10.3389/fendo.2012.00068
Roy, N., Takeuchi, K. K., Ruggeri, J. M., Bailey, P., Chang, D., Li, J., et al. (2016). PDX1 dynamically regulates pancreatic ductal adenocarcinoma initiation and maintenance. Genes Dev. 30, 2669–2683. doi: 10.1101/gad.291021.116
Santiago, L., Daniels, G., Wang, D., Deng, F.-M., and Lee, P. (2017). Wnt signaling pathway protein LEF1 in cancer, as a biomarker for prognosis and a target for treatment. Am. J. Cancer Res. 7, 1389–1406.
Segal, E., Friedman, N., Koller, D., and Regev, A. (2004). A module map showing conditional activity of expression modules in cancer. Nat. Genet. 36:1090. doi: 10.1038/ng1434
Sharma, M., Li, X., Wang, Y., Zarnegar, M., Huang, C.-Y., Palvimo, J. J., et al. (2003). hZimp10 is an androgen receptor co-activator and forms a complex with SUMO-1 at replication foci. EMBO J. 22, 6101–6114. doi: 10.1093/emboj/cdg585
Shiraki, T., Kondo, S., Katayama, S., Waki, K., Kasukawa, T., Kawaji, H., et al. (2003). Cap analysis gene expression for high-throughput analysis of transcriptional starting point and identification of promoter usage. Proc. Natl. Acad. Sci. U.S.A. 100, 15776–15781. doi: 10.1073/pnas.2136655100
Song, C., Chen, G. K., Millikan, R. C., Ambrosone, C. B., John, E. M., Bernstein, L., et al. (2013). A genome-wide scan for breast cancer risk haplotypes among african american women. PLoS ONE 8:e57298. doi: 10.1371/journal.pone.0057298
Subramanian, A., Tamayo, P., Mootha, V. K., Mukherjee, S., Ebert, B. L., Gillette, M. A., et al. (2005). Gene set enrichment analysis: a knowledge-based approach for interpreting genome-wide expression profiles. Proc. Natl. Acad. Sci. U.S.A. 102, 15545–15550. doi: 10.1073/pnas.0506580102
Tate, J. G., Bamford, S., Jubb, H. C., Sondka, Z., Beare, D. M., Bindal, N., et al. (2018). Cosmic: the catalogue of somatic mutations in cancer. Nucleic Acids Res. 47, D941–D947. doi: 10.1093/nar/gky1015
Triner, D., Castillo, C., Hakim, J. B., Xue, X., Greenson, J. K., Nuñez, G., et al. (2018). Myc-associated zinc finger protein regulates the proinflammatory response in colitis and colon cancer via STAT3 signaling. Mol. Cell. Biol. 38:e00386-18. doi: 10.1128/MCB.00386-18
Wan, M., Huang, W., Kute, T. E., Miller, L. D., Zhang, Q., Hatcher, H., et al. (2012). Yin Yang 1 plays an essential role in breast cancer and negatively regulates p27. Am. J. Pathol. 180, 2120–2133. doi: 10.1016/j.ajpath.2012.01.037
Wang, Z., Liu, Y., Lu, L., Yang, L., Yin, S., Wang, Y., et al. (2015). Fibrillin-1, induced by aurora-a but inhibited by BRCA2, promotes ovarian cancer metastasis. Oncotarget 6, 6670–6683. doi: 10.18632/oncotarget.3118
Wennerberg, K., Rossman, K. L., and Der, C. J. (2005). The RAS superfamily at a glance. J. Cell Sci. 118, 843–846. doi: 10.1242/jcs.01660
Wingender, E. (2008). The transfac project as an example of framework technology that supports the analysis of genomic regulation. Brief. Bioinform. 9, 326–332. doi: 10.1093/bib/bbn016
Wu, N., Song, Y., Pang, L., and Chen, Z. (2016). CRCT1 regulated by microRNA-520 g inhibits proliferation and induces apoptosis in esophageal squamous cell cancer. Tumour Biol. J. Int. Soc. Oncodev. Biol. Med. 37, 8271–8279. doi: 10.1007/s13277-015-4730-2
Yu, Z.-H., Lun, S.-M., He, R., Tian, H.-P., Huang, H.-J., Wang, Q.-S., et al. (2017). Dual function of MAZ mediated by FOXF2 in basal-like breast cancer: promotion of proliferation and suppression of progression. Cancer Lett. 402, 142–152. doi: 10.1016/j.canlet.2017.05.020
Zhang, P., Sun, Y., and Ma, L. (2015). ZEB1: at the crossroads of epithelial-mesenchymal transition, metastasis and therapy resistance. Cell Cycle 14, 481–487. doi: 10.1080/15384101.2015.1006048
Zhang, Q., Stovall, D. B., Inoue, K., and Sui, G. (2011). The oncogenic role of Yin Yang 1. Crit. Rev. Oncog. 16, 163–197. doi: 10.1615/CritRevOncog.v16.i3-4.30
Zhang, X., Zhang, Z., Zhang, Q., Zhang, Q., Sun, P., Xiang, R., et al. (2018). ZEB1 confers chemotherapeutic resistance to breast cancer by activating ATM. Cell Death Dis. 9, 1–15. doi: 10.1038/s41419-017-0087-3
Zhang, Y., Park, E., Kim, C. S., and Paik, J.-h. (2013). ZNF365 promotes stalled replication forks recovery to maintain genome stability. Cell Cycle 12, 2817–2828. doi: 10.4161/cc.25882
Zhao, J. C., Fong, K.-W., Jin, H.-J., Yang, Y. A., Kim, J., and Yu, J. (2016). FOXA1 acts upstream of GATA2 and AR in hormonal regulation of gene expression. Oncogene 35, 4335–4344. doi: 10.1038/onc.2015.496
Zheng, G., Tu, K., Yang, Q., Xiong, Y., Wei, C., Xie, L., et al. (2008). ITFP: an integrated platform of mammalian transcription factors. Bioinformatics 24, 2416–2417. doi: 10.1093/bioinformatics/btn439
Keywords: cancer-susceptibility SNP, SNP mechanism of action, transcription factor dysregulation, breast cancer, multi-omics integration, nonparametric hypothesis test, p-value combination
Citation: Nguyen A, Nicoletti P, Arnol D, Califano A and Rodríguez Martínez M (2020) Identifying the Potential Mechanism of Action of SNPs Associated With Breast Cancer Susceptibility With GVITamIN. Front. Bioeng. Biotechnol. 8:798. doi: 10.3389/fbioe.2020.00798
Received: 17 January 2020; Accepted: 22 June 2020;
Published: 04 August 2020.
Edited by:
Mehdi Pirooznia, National Heart, Lung, and Blood Institute (NHLBI), United StatesReviewed by:
Mikhail P. Ponomarenko, Russian Academy of Sciences, RussiaYang Dai, University of Illinois at Chicago, United States
Copyright © 2020 Nguyen, Nicoletti, Arnol, Califano and Rodríguez Martínez. This is an open-access article distributed under the terms of the Creative Commons Attribution License (CC BY). The use, distribution or reproduction in other forums is permitted, provided the original author(s) and the copyright owner(s) are credited and that the original publication in this journal is cited, in accordance with accepted academic practice. No use, distribution or reproduction is permitted which does not comply with these terms.
*Correspondence: Andrea Califano, YWMyMjQ4QGN1bWMuY29sdW1iaWEuZWR1; María Rodríguez Martínez, bXJtQHp1cmljaC5pYm0uY29t
†These authors have contributed equally to this work
‡Present address: Paola Nicoletti, Icahn School of Medicine at Mount Sinai, New York, NY, United States; Sema4, Stamford, CT, United States
Damien Arnol, J2-Reliance Ltd, London, United Kingdom
María Rodríguez Martínez, IBM Research–Zurich, Zurich, Switzerland
§ORCID: María Rodríguez Martínez orcid.org/0000-0003-3766-4233