 Yongxian Fan
 Meijun Chen
 Qingqi Zhu
 Wanru Wang
- School of Computer Science and Information Security, Guilin University of Electronic Technology, Guilin, China
Plenty of microbes in our human body play a vital role in the process of cell physiology. In recent years, there is accumulating evidence indicating that microbes are closely related to many complex human diseases. In-depth investigation of disease-associated microbes can contribute to understanding the pathogenesis of diseases and thus provide novel strategies for the treatment, diagnosis, and prevention of diseases. To date, many computational models have been proposed for predicting microbe–disease associations using available similarity networks. However, these similarity networks are not effectively fused. In this study, we proposed a novel computational model based on multi-data integration and network consistency projection for Human Microbe–Disease Associations Prediction (HMDA-Pred), which fuses multiple similarity networks by a linear network fusion method. HMDA-Pred yielded AUC values of 0.9589 and 0.9361 ± 0.0037 in the experiments of leave-one-out cross validation (LOOCV) and 5-fold cross validation (5-fold CV), respectively. Furthermore, in case studies, 10, 8, and 10 out of the top 10 predicted microbes of asthma, colon cancer, and inflammatory bowel disease were confirmed by the literatures, respectively.
Introduction
As far as we know, microbes are ubiquitous in our living environment, and they occupy nearly all habitats including humans and animals (Kouzuma et al., 2015). According to existing literatures, the microbes are mainly classified into fungi, archaea, bacteria, protozoa, and viruses in the human body (Methé et al., 2012; Sommer and Bäckhed, 2013). More and more studies have shown that most of these microbes are friendly to human beings and play a significant role in the physiology processes of the human body, such as regulating gastrointestinal development, providing protection for pathogens, and enhancing metabolic capability (Ventura et al., 2009). Specifically, the overwhelming majority of microbes inhabit the gastrointestinal tract in an adult gut, where they not only synthesize essential vitamins and amino acids but also promote the digestion of indigestible components in the human diet (Huang et al., 2017). Thus, abnormal changes in the microbe communities may affect human health and diseases. For example, low microbial diversity could result in inflammatory bowel disease and obesity (Turnbaugh et al., 2009; Qin et al., 2010). However, high microbial diversity is associated with bacterial vaginosis in the vagina (Fredricks et al., 2005). Researchers have confirmed the close relationship between microbes and diseases. Some microbes may cause various diseases, such as colon cancer (Sears and Garrett, 2014), kidney stones (Hoppe et al., 2011), asthma (Hilty et al., 2010), colorectal carcinoma (Sobhani et al., 2011; Kostic et al., 2012), and inflammatory bowel disease (Frank et al., 2007). On the one hand, uncovering the disease-associated microbes can contribute to better understanding the pathogenesis of the diseases. On the other hand, understanding the mechanism of microbes behind the diseases provides novel strategies for the prevention, diagnosis, and treatment of the diseases (Zou et al., 2017; Peng et al., 2018). Unfortunately, the traditional biological experiments to uncover the relationship between microbes and diseases are time-consuming and costly. Thus, there is an urgent need to construct computational models to predict the disease-associated microbes.
In recent years, researchers have developed a number of feasible and effective prediction models for microbe–disease associations, which could provide the most promising disease-associated microbes for experimental verification. For example, according to the hypothesis that functionally similar microbes tend to be associated with similar diseases (Chen et al., 2016), Chen et al. (2016) proposed using the KATZ measurement to predict human microbe–disease associations (KATZHMDA) on a large scale. Huang et al. (2017) applied the designed depth-first search algorithm on the heterogeneous networks and proposed a path-based approach (PBHMDA) to reveal the microbes that are likely to be associated with the disease. Wang et al. (2017) developed a machine learning-based computational approach called LRLSHMDA, which calculates the association scores for microbe–disease pairs based on the known microbe–disease association network. Huang et al. (2017) developed a novel computational method (NGRHMDA), which can predict microbe–disease associations by applying collaborative recommendation model on a graph. Bao et al. (2017) proposed the computational model named NCPHMDA, which combines space consistency projection scores for diseases and microbes to predict latent disease-associated microbes. Zou et al. (2017) put forward a new prediction model called BiRWHMDA, which simultaneously performs random walks on the microbe similar network and disease similar network to uncover potential microbe–disease associations. Shi et al. (2018) proposed a predictive method based on Binary Matrix Completion (BMCMDA) for inferring the associations of microbe–disease.
However, the abovementioned methods have their own various shortcomings in uncovering microbe–disease associations. Multiple available similarity networks can be used for predicting disease–microbe associations. However, most of the previous methods are performed on individual networks, ignoring the complementarity between different similarity networks. How to better fuse them is still worth investigating. In this paper, to resolve the abovementioned limitations, we presented a novel computational model of multi-data integration and network consistency projection for prediction of Human Microbe–Disease Associations (HMDA-Pred) to boost the performance of human microbe–disease association prediction, which integrates multiple similarity networks. To begin with, the Gaussian interaction profile kernel similarity network and cosine similarity network for microbes and diseases were constructed based on known microbe–disease associations. Subsequently, we integrated the Gaussian interaction profile kernel similarity network of microbes and cosine similarity network of microbes by a linear network fusion method. In the same way, we integrated the Gaussian interaction profile kernel similarity network of diseases and cosine similarity network of diseases. Finally, we applied the network consistency projection algorithm to uncover the microbe–disease associations. Two evaluation strategies were implemented to evaluate the performance of HMDA-Pred, including leave-one-out cross validation (LOOCV) and 5-fold cross validation (5-fold CV). Related data and source code are available online at: https://github.com/AugustMe/HMDA-Pred.
Materials and Methods
Known Microbe–Disease Associations
We used the same microbe–disease associations as the existing literatures (Chen et al., 2016; Huang et al., 2017; Peng et al., 2018). The dataset was initially derived from the Human Microbe–Disease Association Database named HMDAD (Ma et al., 2016)1, which collected 483 microbe–disease associations from literatures. After removing duplicate associations of the dataset, we obtained 450 unique associations between 292 microbes and 39 diseases. Then, we constructed an adjacency matrix MD(nm × nd) to describe the association relationship between microbes and diseases, where nm and nd represented the number of microbes and diseases, respectively. If microbe m(i) was proved to be associated with disease d(j), the value of MD(i, j) was 1, otherwise 0. If the value of MD(i, j) is 0, that means there is no evidence yet showing microbe m(i) is associated with disease d(j).
In addition, we analyzed the degree distribution characteristics of the microbe–disease association network (Table 1 and Figure 1). The degree of a disease represents the number of microbes related to this disease. The degree of a microbe represents the number of diseases related to this microbe. In the left graph of Figure 1, the abscissa indicates the range of disease degree, which presents how many microbes are related to each disease; the ordinate counts the number of each disease degree. In the right graph of Figure 1, the abscissa indicates the range of microbe degree, which shows how many diseases are related to each microbe; the ordinate counts the number of each microbe degree. On average, each disease is related to 11.54 microbes and each microbe is involved with 1.54 diseases.

Table 1. Characteristics of the microbe–disease association network.
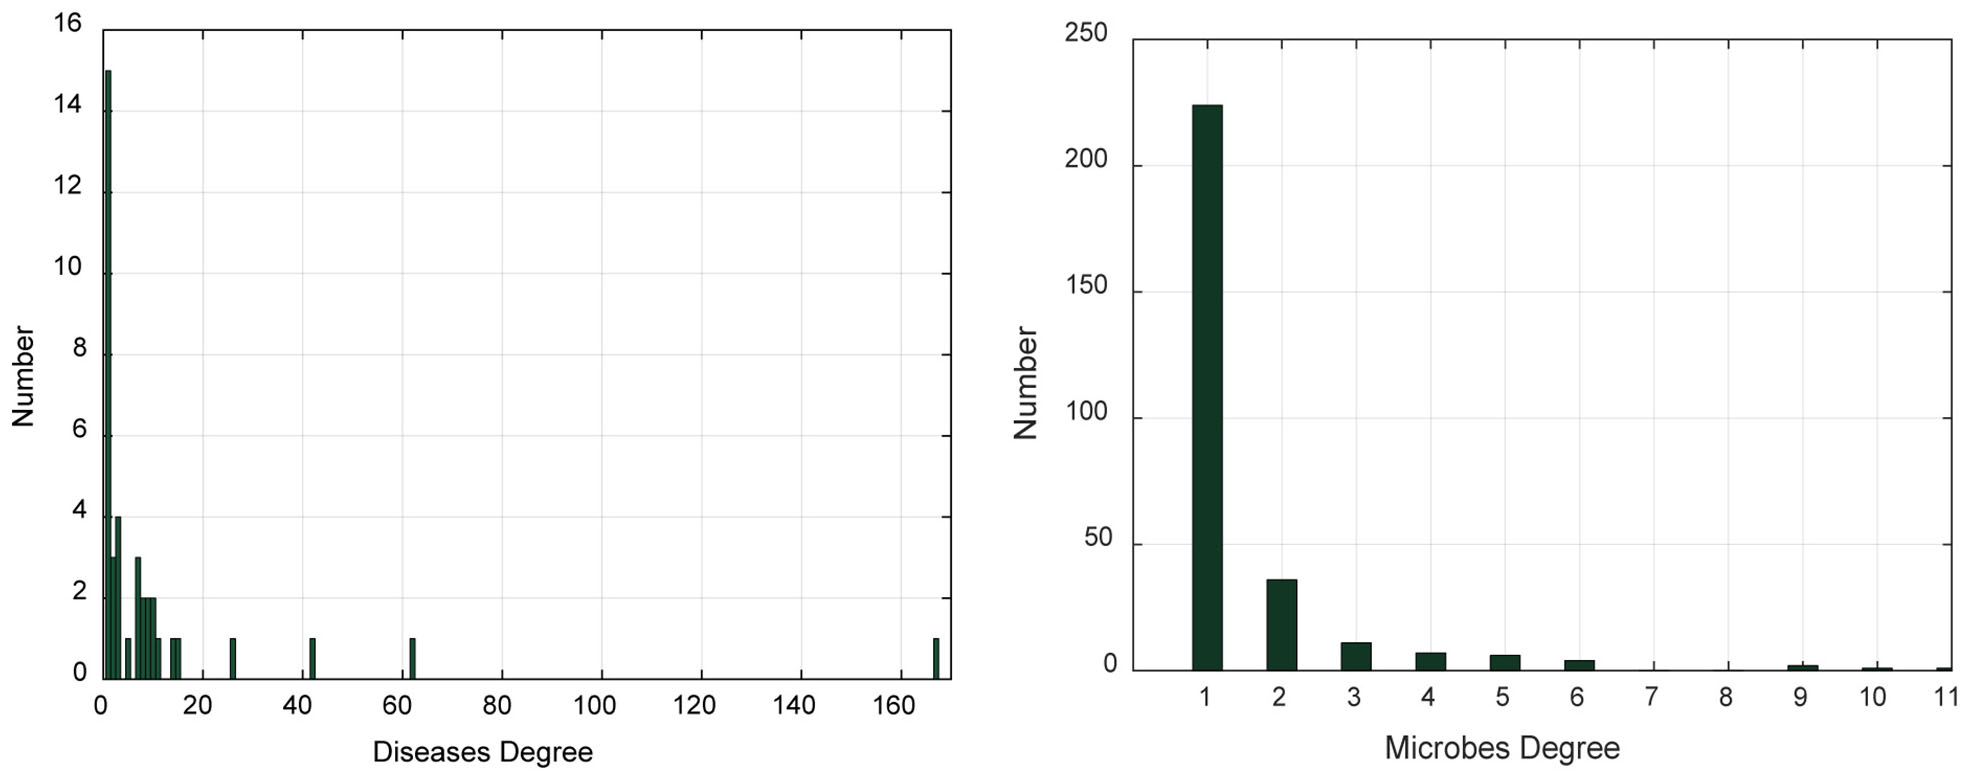
Figure 1. The degree distribution of diseases and microbes.
Gaussian Interaction Profile Kernel Similarity for Diseases and Microbes
According to the hypothesis that diseases have similar patterns with functionally similar microbes (Chen et al., 2016), we constructed a Gaussian interaction profile kernel similarity network for microbes and diseases based on the adjacency matrix MD, respectively. First, a binary vector GIP(m(i)) represents the interaction profiles of microbe m(i) by observing whether microbe m(i) has a known association with each disease or not (i.e., the ith row of adjacency matrix MD). Second, the Gaussian interaction profile kernel similarity between microbe m(i) and microbe m(j) could be defined as follows:
where the parameter λm is a regulation parameter, which could be obtained by normalizing a new parameter to control the kernel bandwidth. For the sake of simplicity, we set to 1 according to previous studies (van Laarhoven et al., 2011; Chen and Yan, 2013).
With the same processing, the Gaussian interaction profile kernel similarity between disease d(i) and disease d(j) was calculated as follows:
where GIP(d(i)) represents the interaction profile of disease d(i) (i.e., the ith column of adjacency matrix MD). Here, the meaning of parameter λd is the same as λm and we also set the value of parameter to 1 (van Laarhoven et al., 2011; Chen and Yan, 2013).
In the end, we could obtain the microbe Gaussian interaction profile kernel similarity matrix KM (nm × nm) and the disease Gaussian interaction profile kernel similarity matrix KD(nd × nd), respectively.
Cosine Similarity for Diseases and Microbes
The calculation of disease cosine similarity is based on the assumption that if disease d(i) and disease d(j) are similar to each other (Xie et al., 2019), then, in the microbe–disease association matrix, pattern MD(:, i) (i.e., the ith column of the adjacency matrix MD) and pattern MD(:, j) (i.e., the jth column of adjacency matrix MD) should be similar to each other. The same assumption should also be true for microbes. Therefore, the cosine similarity between disease d(i) and disease d(j) is defined as follows:
After calculating the disease–disease cosine similarity of each pair, the disease cosine similarity matrix CD(nd × nd) can be constructed.
Similarly, the cosine similarity between microbe m(i) and microbe m(j) is given:
where MD(i,:) represents the ith row of adjacency matrix MD, and after calculating the microbe–microbe cosine similarity of each pair, the microbe cosine similarity matrix CM(nm × nm) can be constructed.
Integrated Similarity for Diseases and Microbes
To make full use of disease Gaussian interaction profile kernel similarity matrix KD and disease cosine similarity matrix CD, a comprehensive disease similarity matrix DS(nd × nd) was constructed by integrating the KD and CD similarity matrices. We proposed a linear network fusion (LNF) method to integrate KD and CD, defined as follows:
where entity DS(d(i), d(j)) represents the integrated similarity between disease d(i) and disease d(j) and α represents the weight of disease similarity matrix (0 < α < 1).
In the same way, microbe Gaussian interaction profile kernel similarity matrix KM and microbe cosine similarity matrix CM are integrated to a comprehensive microbe similarity matrix MS(nm × nm) as follows:
where entity MS(m(i), m(j)) represents the integrated similarity between microbe m(i) and microbe m(j) and β represents the weight of microbe similarity matrix (0 < β < 1).
In the end, we obtained a comprehensive microbe similarity matrix MS and a comprehensive disease similarity matrix DS, respectively.
HMDA-Pred
HMDA-Pred is a network-based computation approach to infer the disease-associated microbes based on the network consistency projection (NCP) algorithm. The flowchart of HMDA-Pred is shown in Figure 2. To begin with, based on known microbe–disease associations, we calculated the Gaussian interaction profile kernel similarity matrix and cosine similarity matrix for microbes and diseases, respectively. Then, we integrated two similarity matrices for microbes and for diseases through LNF, respectively. Finally, we uncovered the microbe–disease associations by scores obtained from the network consistency projection algorithm. The NCP algorithm has been successfully used to measure the similarity between nodes in the link prediction problems in a heterogeneous network (Gu et al., 2016; Bao et al., 2017). The following is how the NCP algorithm works in HMDA-Pred.
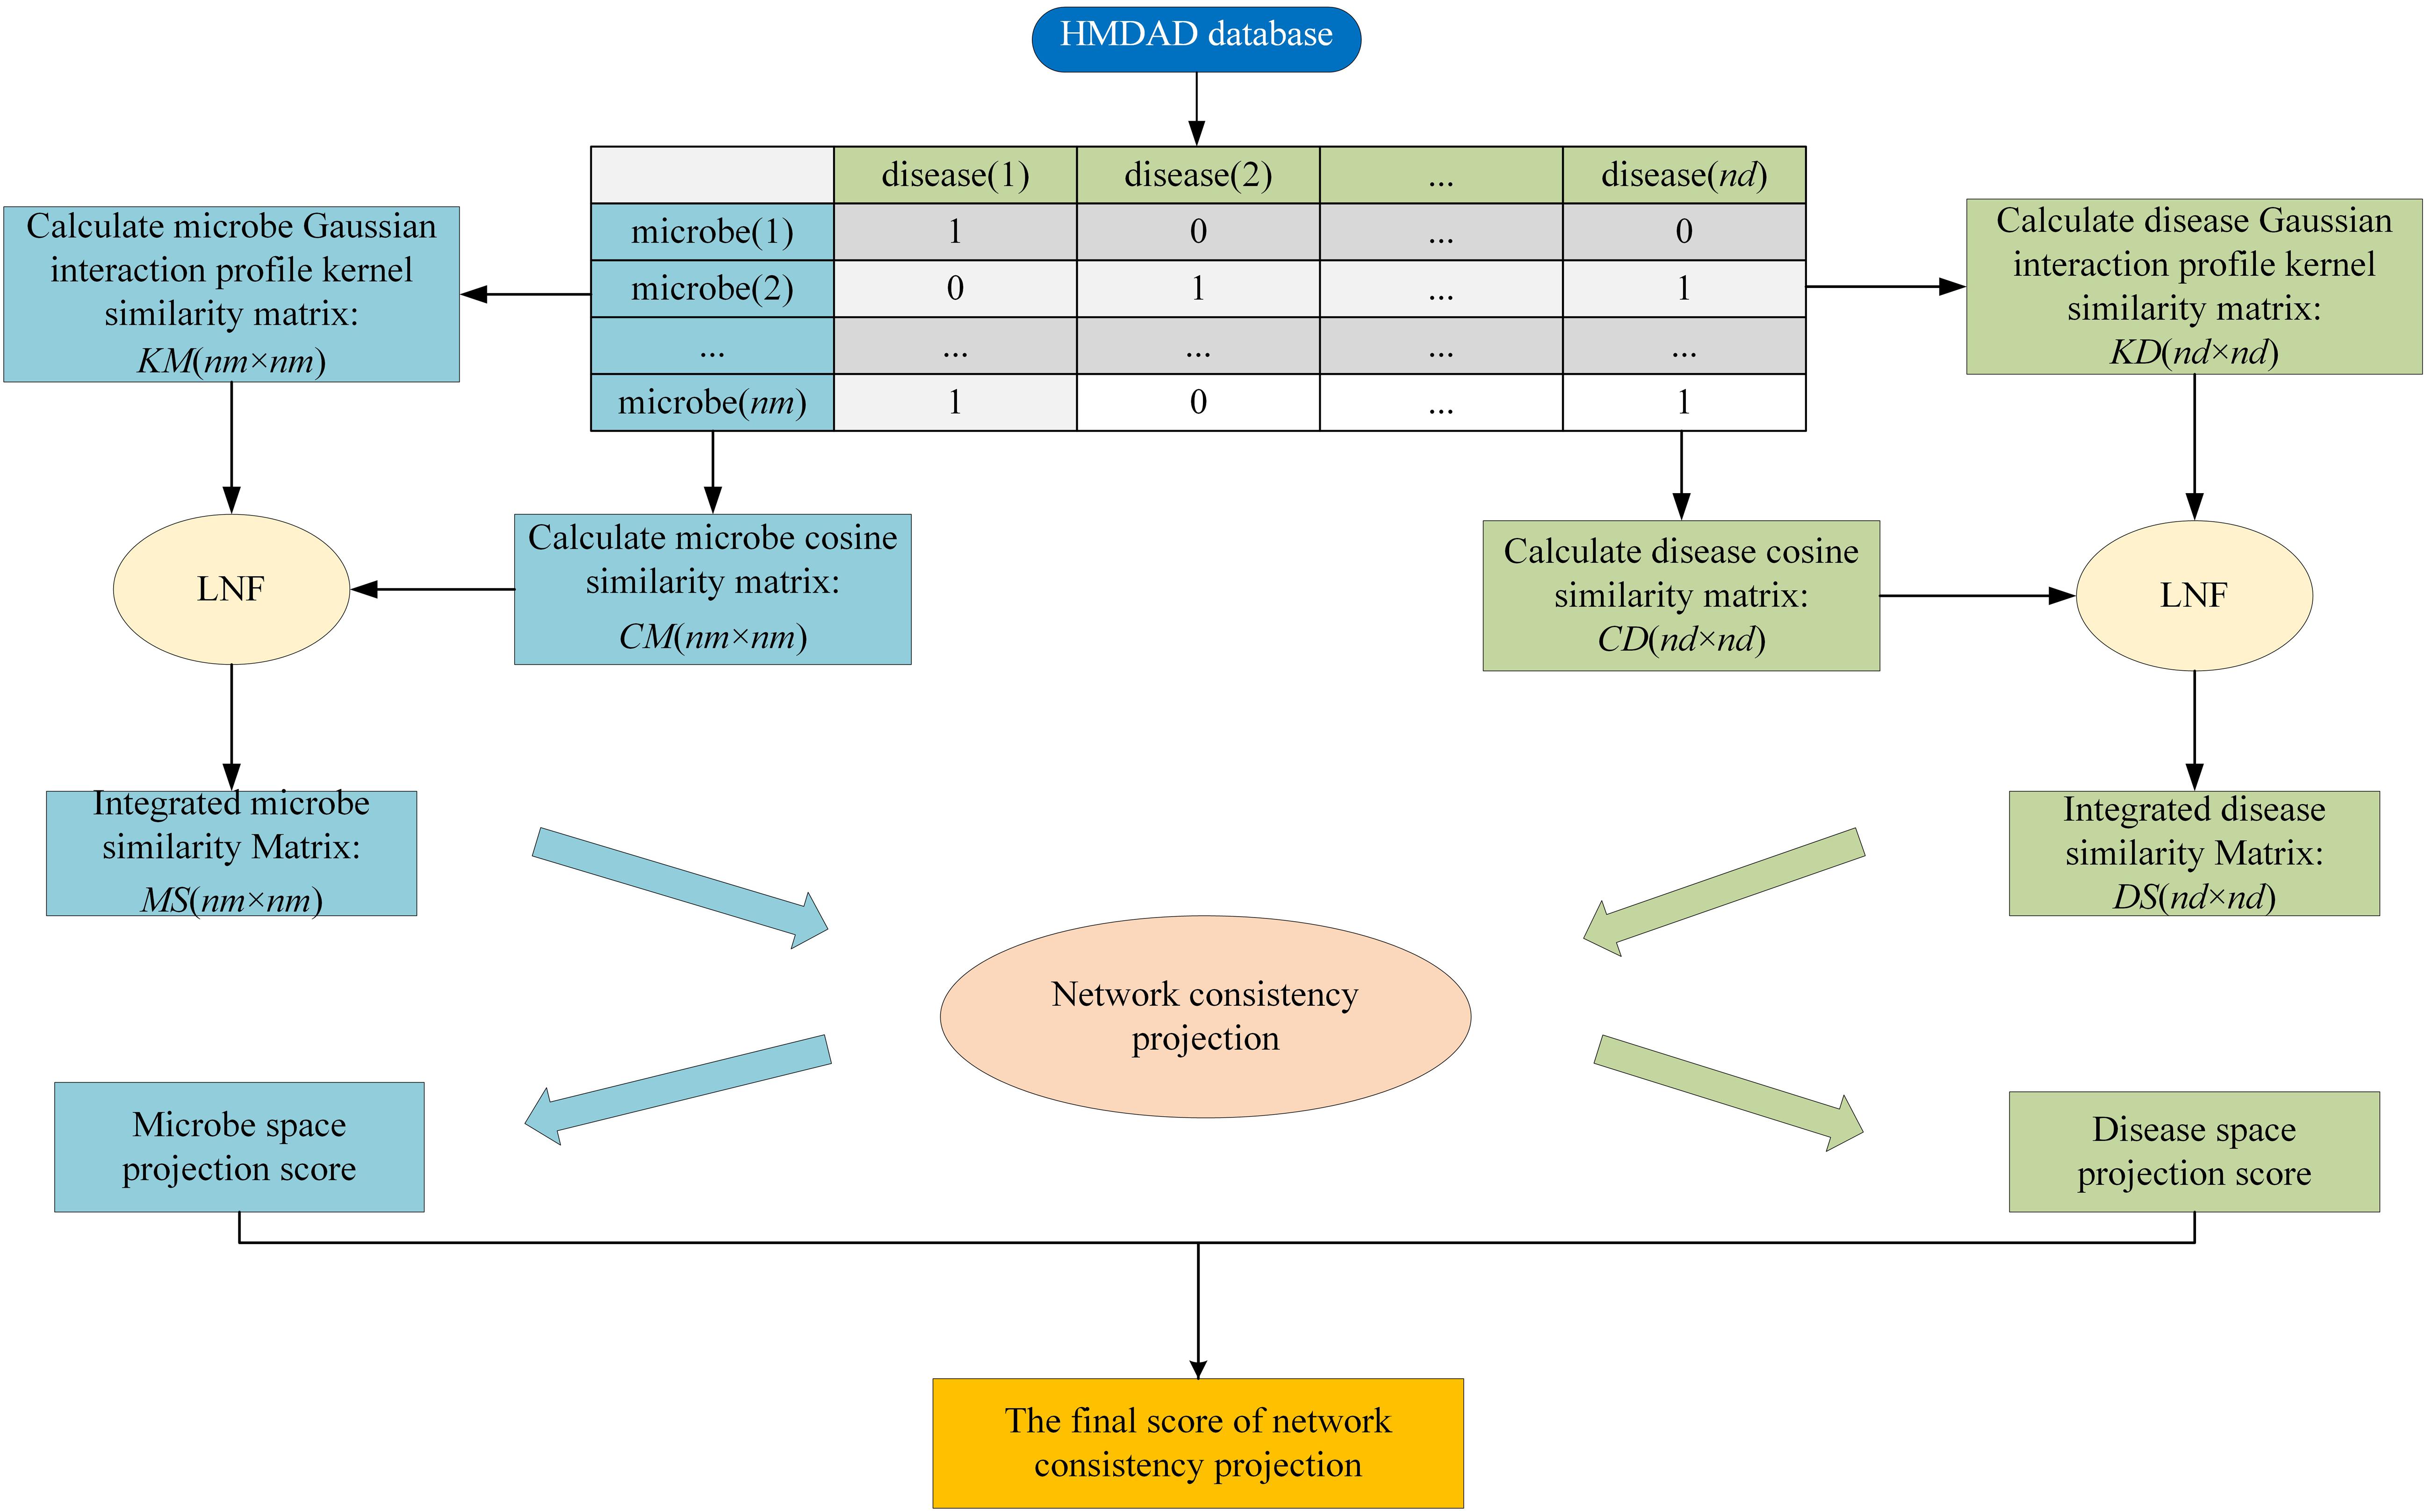
Figure 2. The flowchart of HMDA-Pred.
First, we calculated the disease space projection score as follows:
where MD(i,:) is composed of the associations of microbe m(i) and all diseases (i.e., the ith row of adjacency matrix MD), DS(:, j) is composed of the similarities of disease d(j) and all diseases (i.e., the ith column of adjacency matrix DS), and | MD(i,:)| represents the norm of MD(i,:). NCPD(i, j) represents the projection score of microbe m(i) and disease d(j) from the projection space of disease.
Second, we calculated the microbe space projection score as follows:
where MD(:, j) is composed of the associations of disease d(i) and all microbes (i.e., the ith column of adjacency matrix MD), MS(i,:) is composed of the similarities of microbe m(i) and all microbes (i.e., the ith row of adjacency matrix DS), and | MD(:, j)| represents the norm of MD(:, j). NCPM(i, j) represents the projection score of microbe m(i) and disease d(j) from the projection space of microbe.
Finally, we combined and normalized NCPD and NCPM as follows:
NCP is the final probability matrix of microbe–disease associations, and the element NCP(i, j) represents the final association score of network consistency projection of microbe m(i) and disease d(j).
Results
Performance Evaluation
To make the evaluation criteria consistent with existing methods, we performed LOOCV and 5-fold CV on our benchmark dataset, which are widely used not only in machine learning classification tasks based on sequence feature analysis but also in biological association prediction problems (Chen et al., 2016; Wang et al., 2017; Liu, 2019; Liu et al., 2019). For LOOCV, one of the 450 confirmed microbe–disease associations pairs was used as a test sample while the left 449 associations were used as the training samples. For 5-fold CV, we randomly divided the 450 confirmed microbe–disease association pairs into five subsets, where one subset is used as test samples and the remaining four subsets as training samples. The 5-fold CV was repeated 100 times to decrease the bias brought by the random splitting.
To visualize the performance of HMDA-Pred, the receiver operating characteristic (ROC) curve was used to plot the relationship between false-positive rate (1-specificity, 1-Spe) and true positive rate (sensitivity, Sen). The area under the ROC curve (AUC) was calculated, whose value of 1 represents perfect prediction performance, while 0.5 indicates purely random prediction performance (Chen et al., 2012, 2016; Fan and Shen, 2014; Pan and Shen, 2018). Moreover, we used the area under the precision-recall (PR) curve (AUPR) as an another indicator for model evaluation (Pan and Shen, 2019, 2020). In addition, we adopted accuracy (Acc), precision (Pre), Matthews’s correlation coefficient (MCC), and F1 score (F1) to further evaluate the model. They are defined as follows:
where TP represents the number of known microbe–disease associations that are correctly identified, FP represents the number of unknown microbe–disease associations that are incorrectly identified, TN represents the number of unknown microbe–disease associations that are correctly identified, and FN represents the number of known microbe–disease associations that are incorrectly identified.
Parameter Selection
In this study, the parameters to be adjusted are α and β in LNF. We set the values of α and β from 0.1 to 0.9 with a step size of 0.1. In order to determine the best parameters, we ran LOOCV on the benchmark dataset to select the parameters with the best performance. As shown in Table 2, we observed that HMDA-Pred achieves the best AUC when α is 0.3 and β is 0.6.
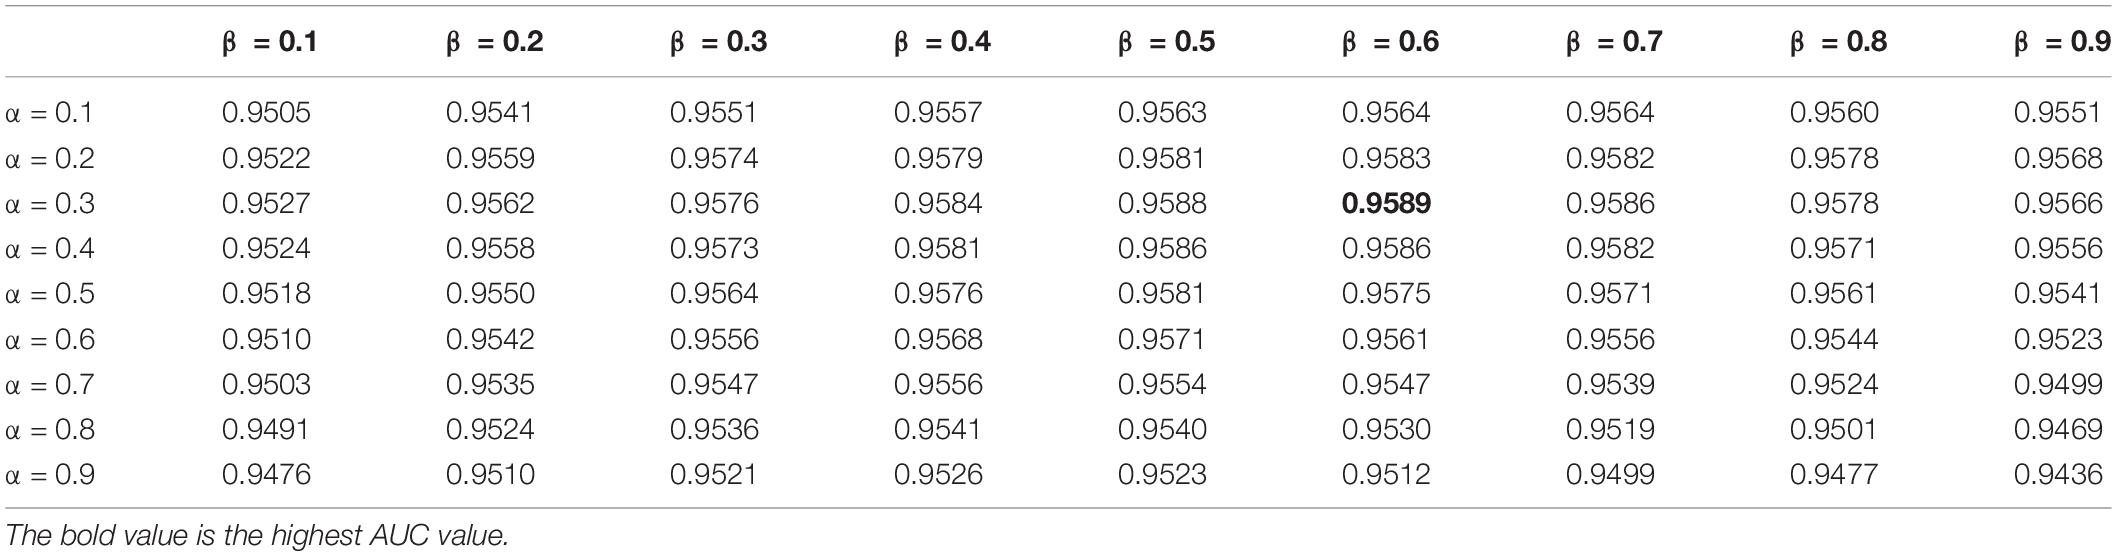
Table 2. The AUC values of LNF integration method with different values of α and β.
Comparison With Other Integration Strategies
The similarity integration strategy proposed in this study is a linear network fusion (LNF) method. In order to verify the superior integration performance of the LNF, we compared LNF with two common similarity fusion strategies: similarity network fusion (SNF) (Zheng et al., 2017) and similarity kernel fusion (SKF) (Jiang et al., 2018; Xie et al., 2019). As shown in Figure 3, based on the LOOCV scheme, we plotted the ROC curve of three different integration methods. The AUC value of LNF achieved 0.9589, while those of SNF and SKF were 0.9437 and 0.8843, respectively. It can be seen that the AUC value of LNF is higher than that of SNF and SKF. Therefore, in the HMDA-Pred method, the performance of LNF is superior to the other two fusion methods in terms of the prediction accuracy of the microbe–disease associations.
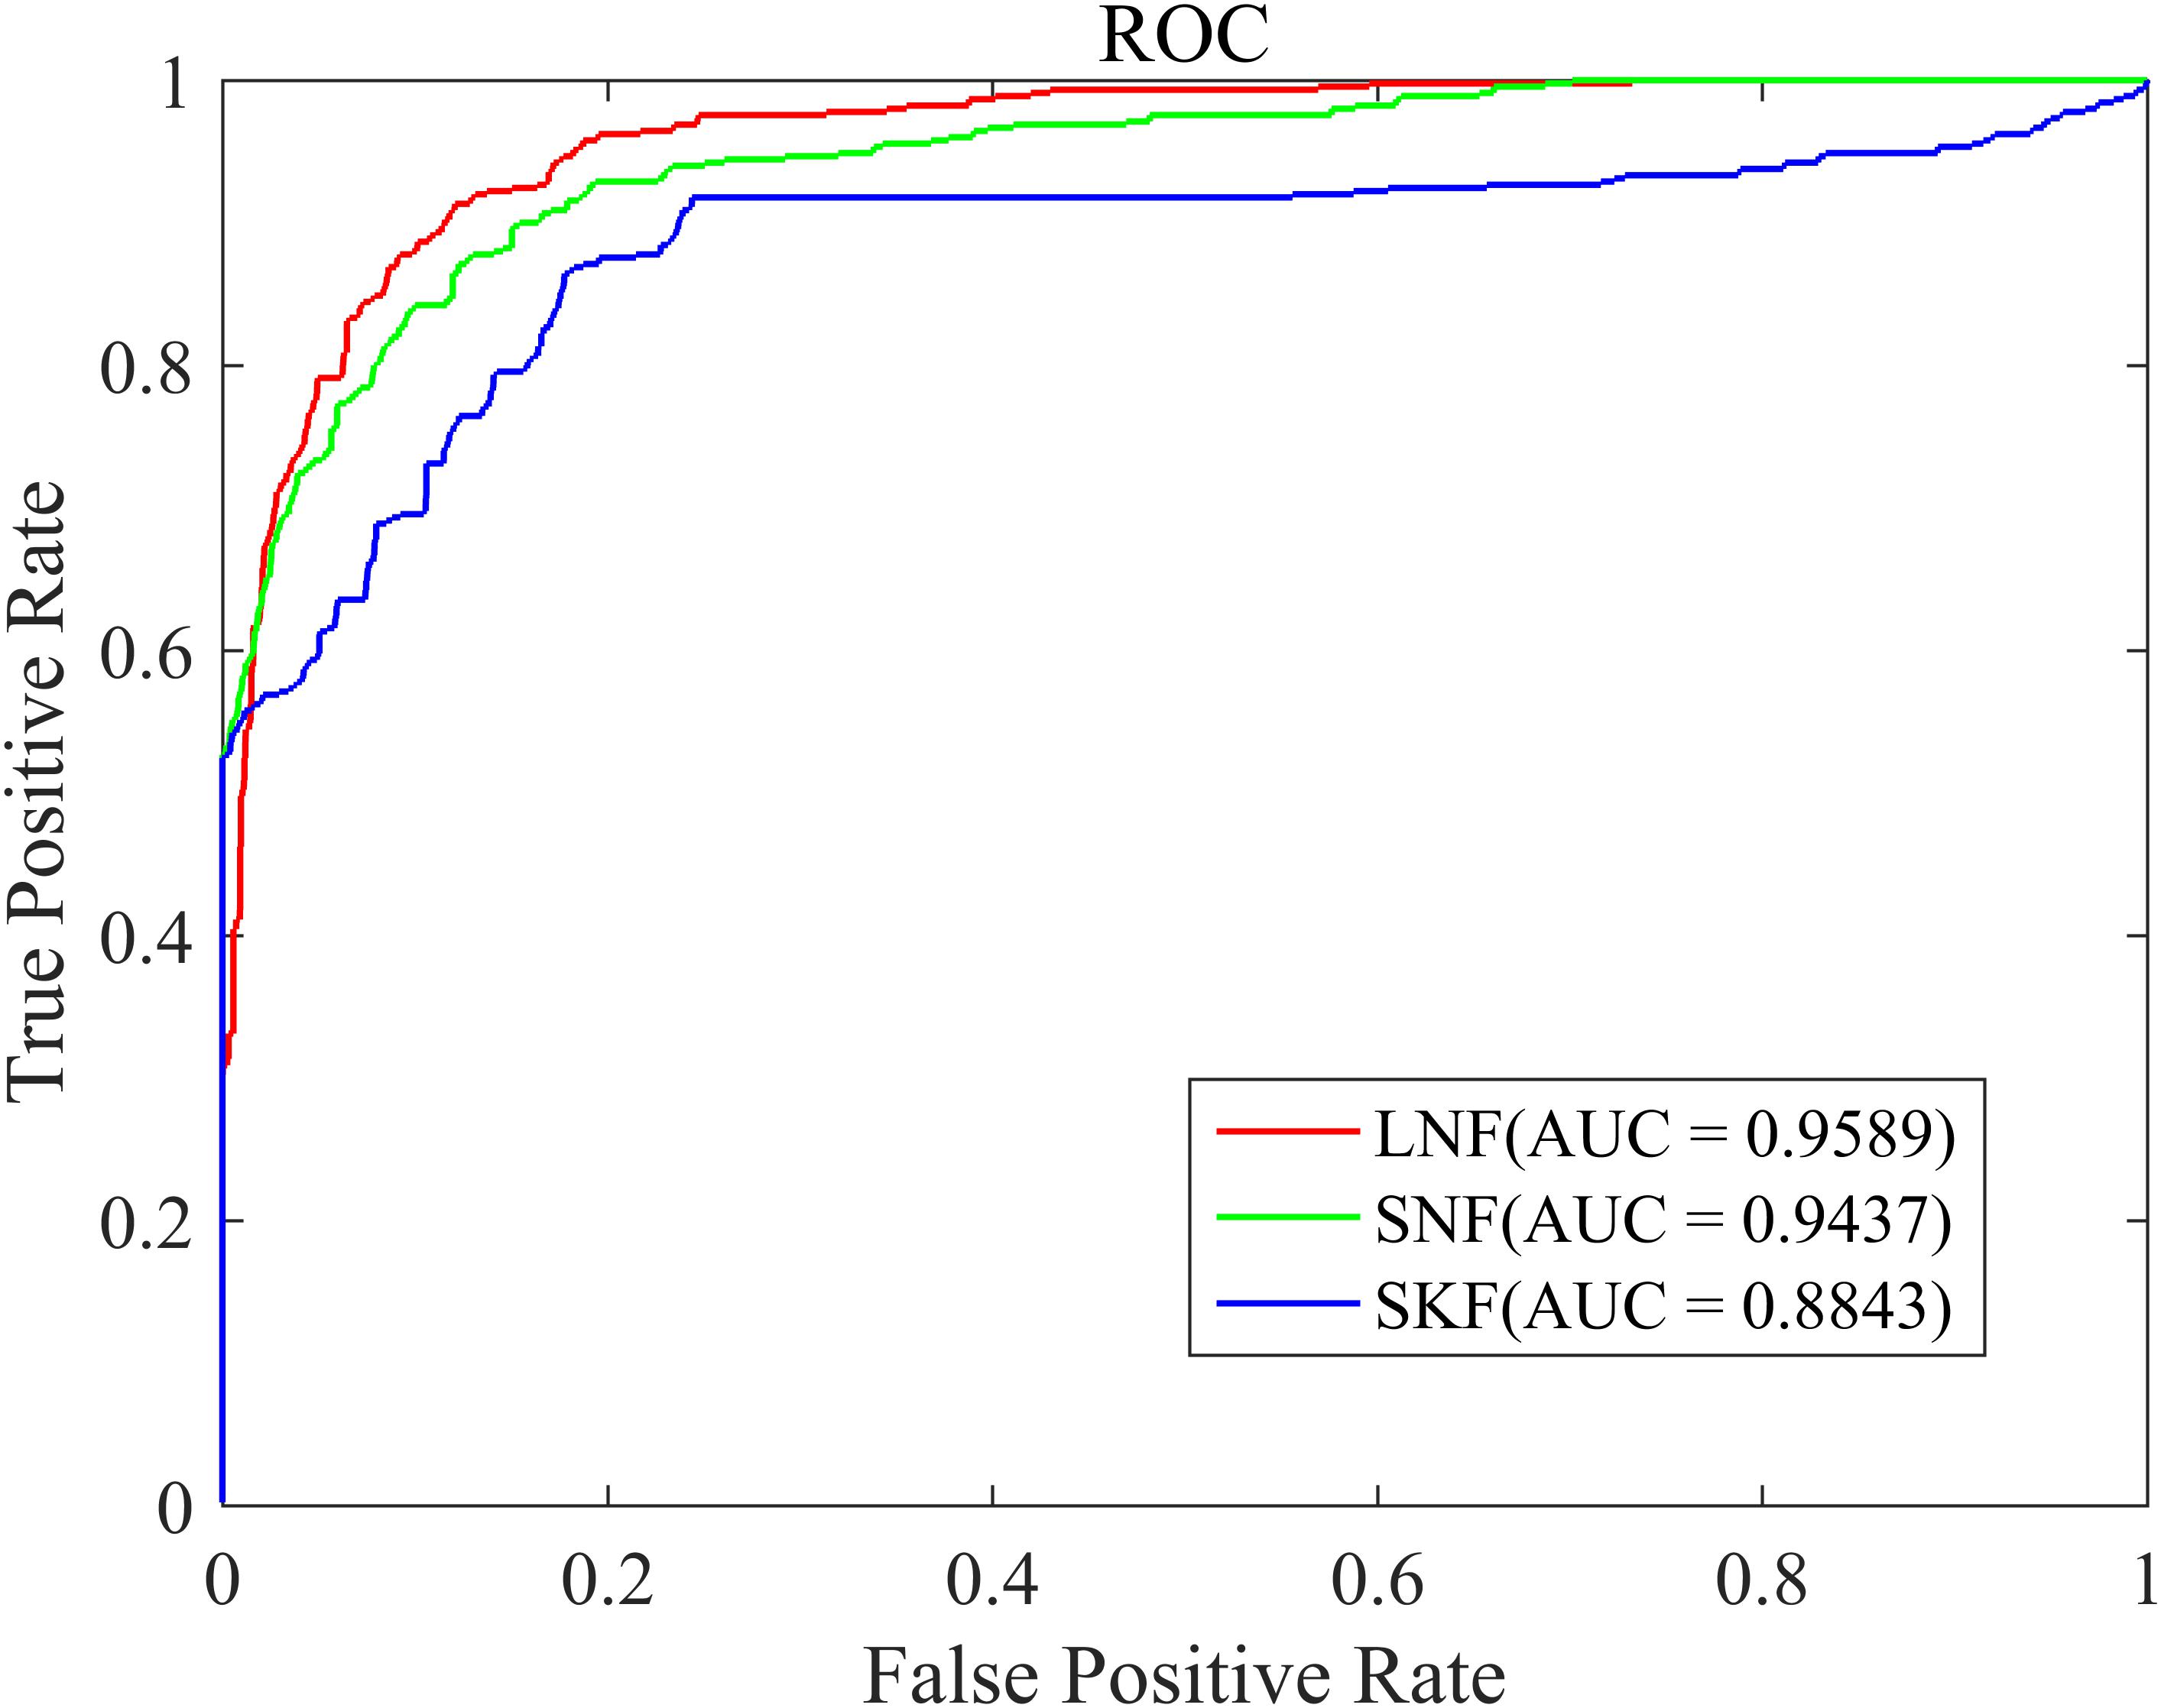
Figure 3. The ROC curve of three integration strategies.
Comparison With Single Similarity
In this study, we proposed to integrate different similarity data of microbes (i.e., Gaussian interaction profile kernel similarity and cosine similarity for microbes) and different similarity data of diseases (i.e., Gaussian interaction profile kernel similarity and cosine similarity for diseases) by LNF, respectively. The integration effect was verified by designing comparative experiments, including all combinations of single similarity data of diseases and microbes. The experimental results are shown in Table 3. The proposed strategy of using LNF to integrate Gaussian interaction profile kernel similarity data and cosine similarity data presented the highest AUC values in LOOCV and 5-fold CV, which were 0.9589 and 0.9361 ± 0.0037, respectively.
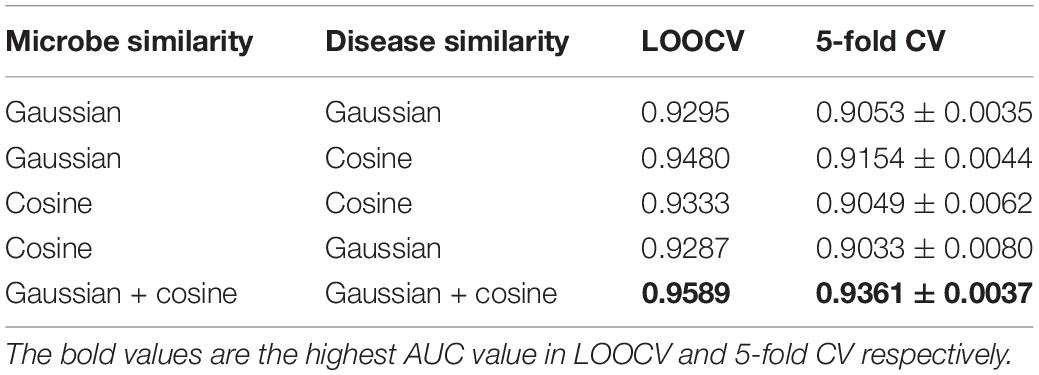
Table 3. The AUC values of HMDA-Pred and other single similarity in LOOCV and 5-fold CV.
Comparison With Other Existing Methods
In order to further verify the superior predictive performance of HMDA-Pred, we compared HMDA-Pred with three state-of-the-art methods used to predict microbe–disease associations, namely, KATZHMDA (Chen et al., 2016), BiRWHMDA (Zou et al., 2017), and LRLSHMDA (Wang et al., 2017). Figure 4 shows the comparisons of the AUC values between different methods based on the benchmark data set. By LOOCV, the AUC values of KATZHMDA, BiRWHMDA, LRLSHMDA, and HMDA-Pred are 0.8873, 0.8284, 0.8816, and 0.9589, respectively. However, after repeating for 100 times the 5-fold CV, the AUC values of KATZHMDA, BiRWHMDA, LRLSHMDA, and HMDA-Pred are 0.8428 ± 0.0035, 0.7984 ± 0.0027, 0.8410 ± 0.0052, and 0.9361 ± 0.0037, respectively.
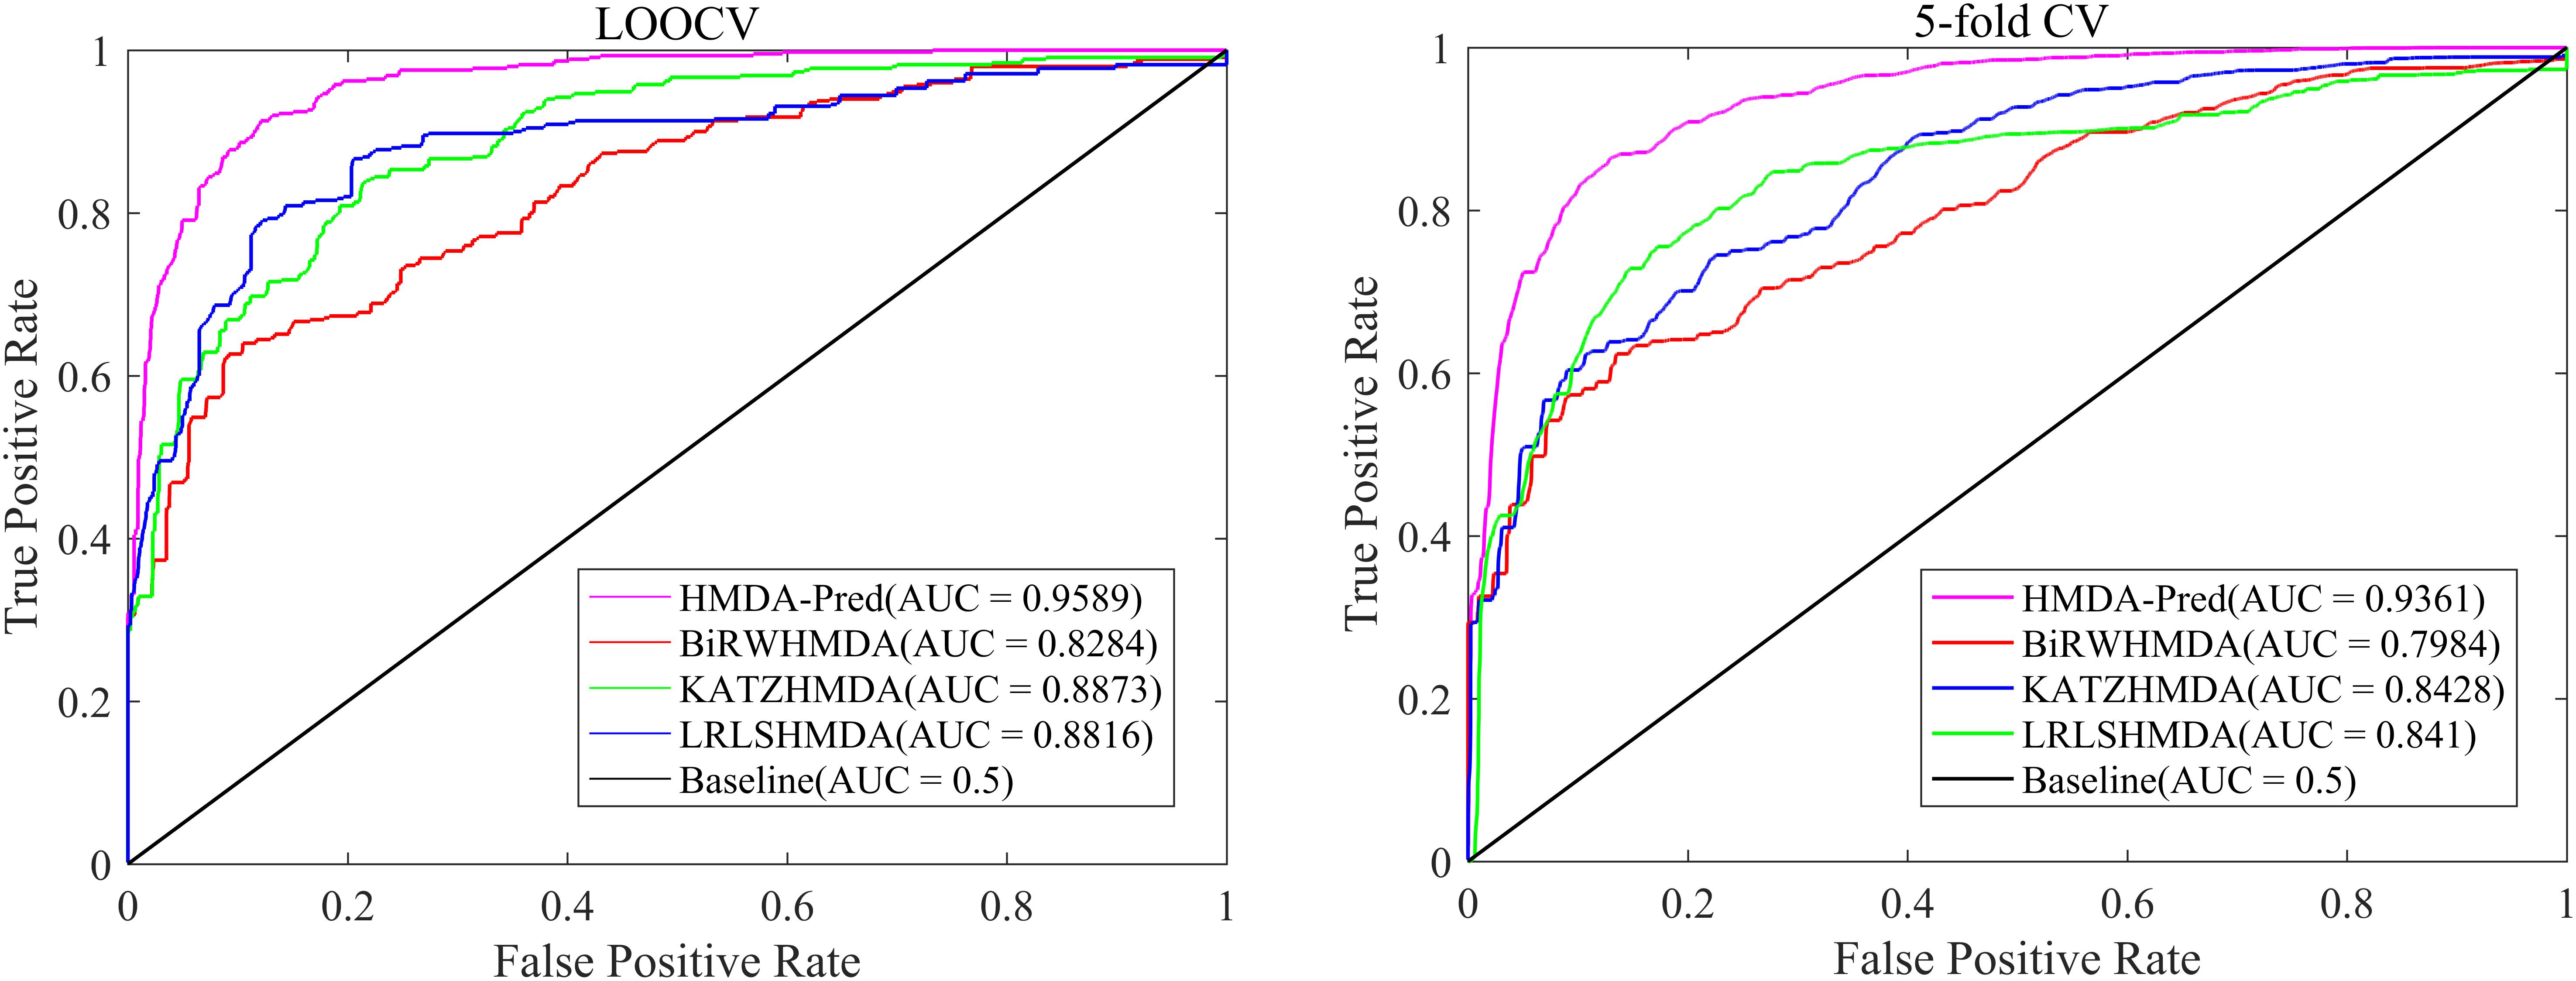
Figure 4. The ROC curve of different methods in LOOCV and 5-fold CV.
In this study, the known microbe–disease associations are far less than unknown microbe–disease associations in the benchmark dataset, which is imbalanced. Therefore, the AUPR value (area under the PR curve) is an indispensable model evaluation indicator to show the balance of recall and precision, which is suitable to investigate the performance of different methods in the imbalanced dataset (Li et al., 2018). Based on the benchmark data set, we plotted the PR curve of each method and calculated the AUPR value of each method by LOOCV. As shown in Figure 5, the AUPR values of HMDA-Pred, BiRWHMDA, KATZHMAD, and LRLSHMDA are 0.6510, 0.4363, 0.4782, and 0.5045, respectively, which reflects that the performance of HMDA-Pred is better than the other three methods in the case of imbalanced data set.
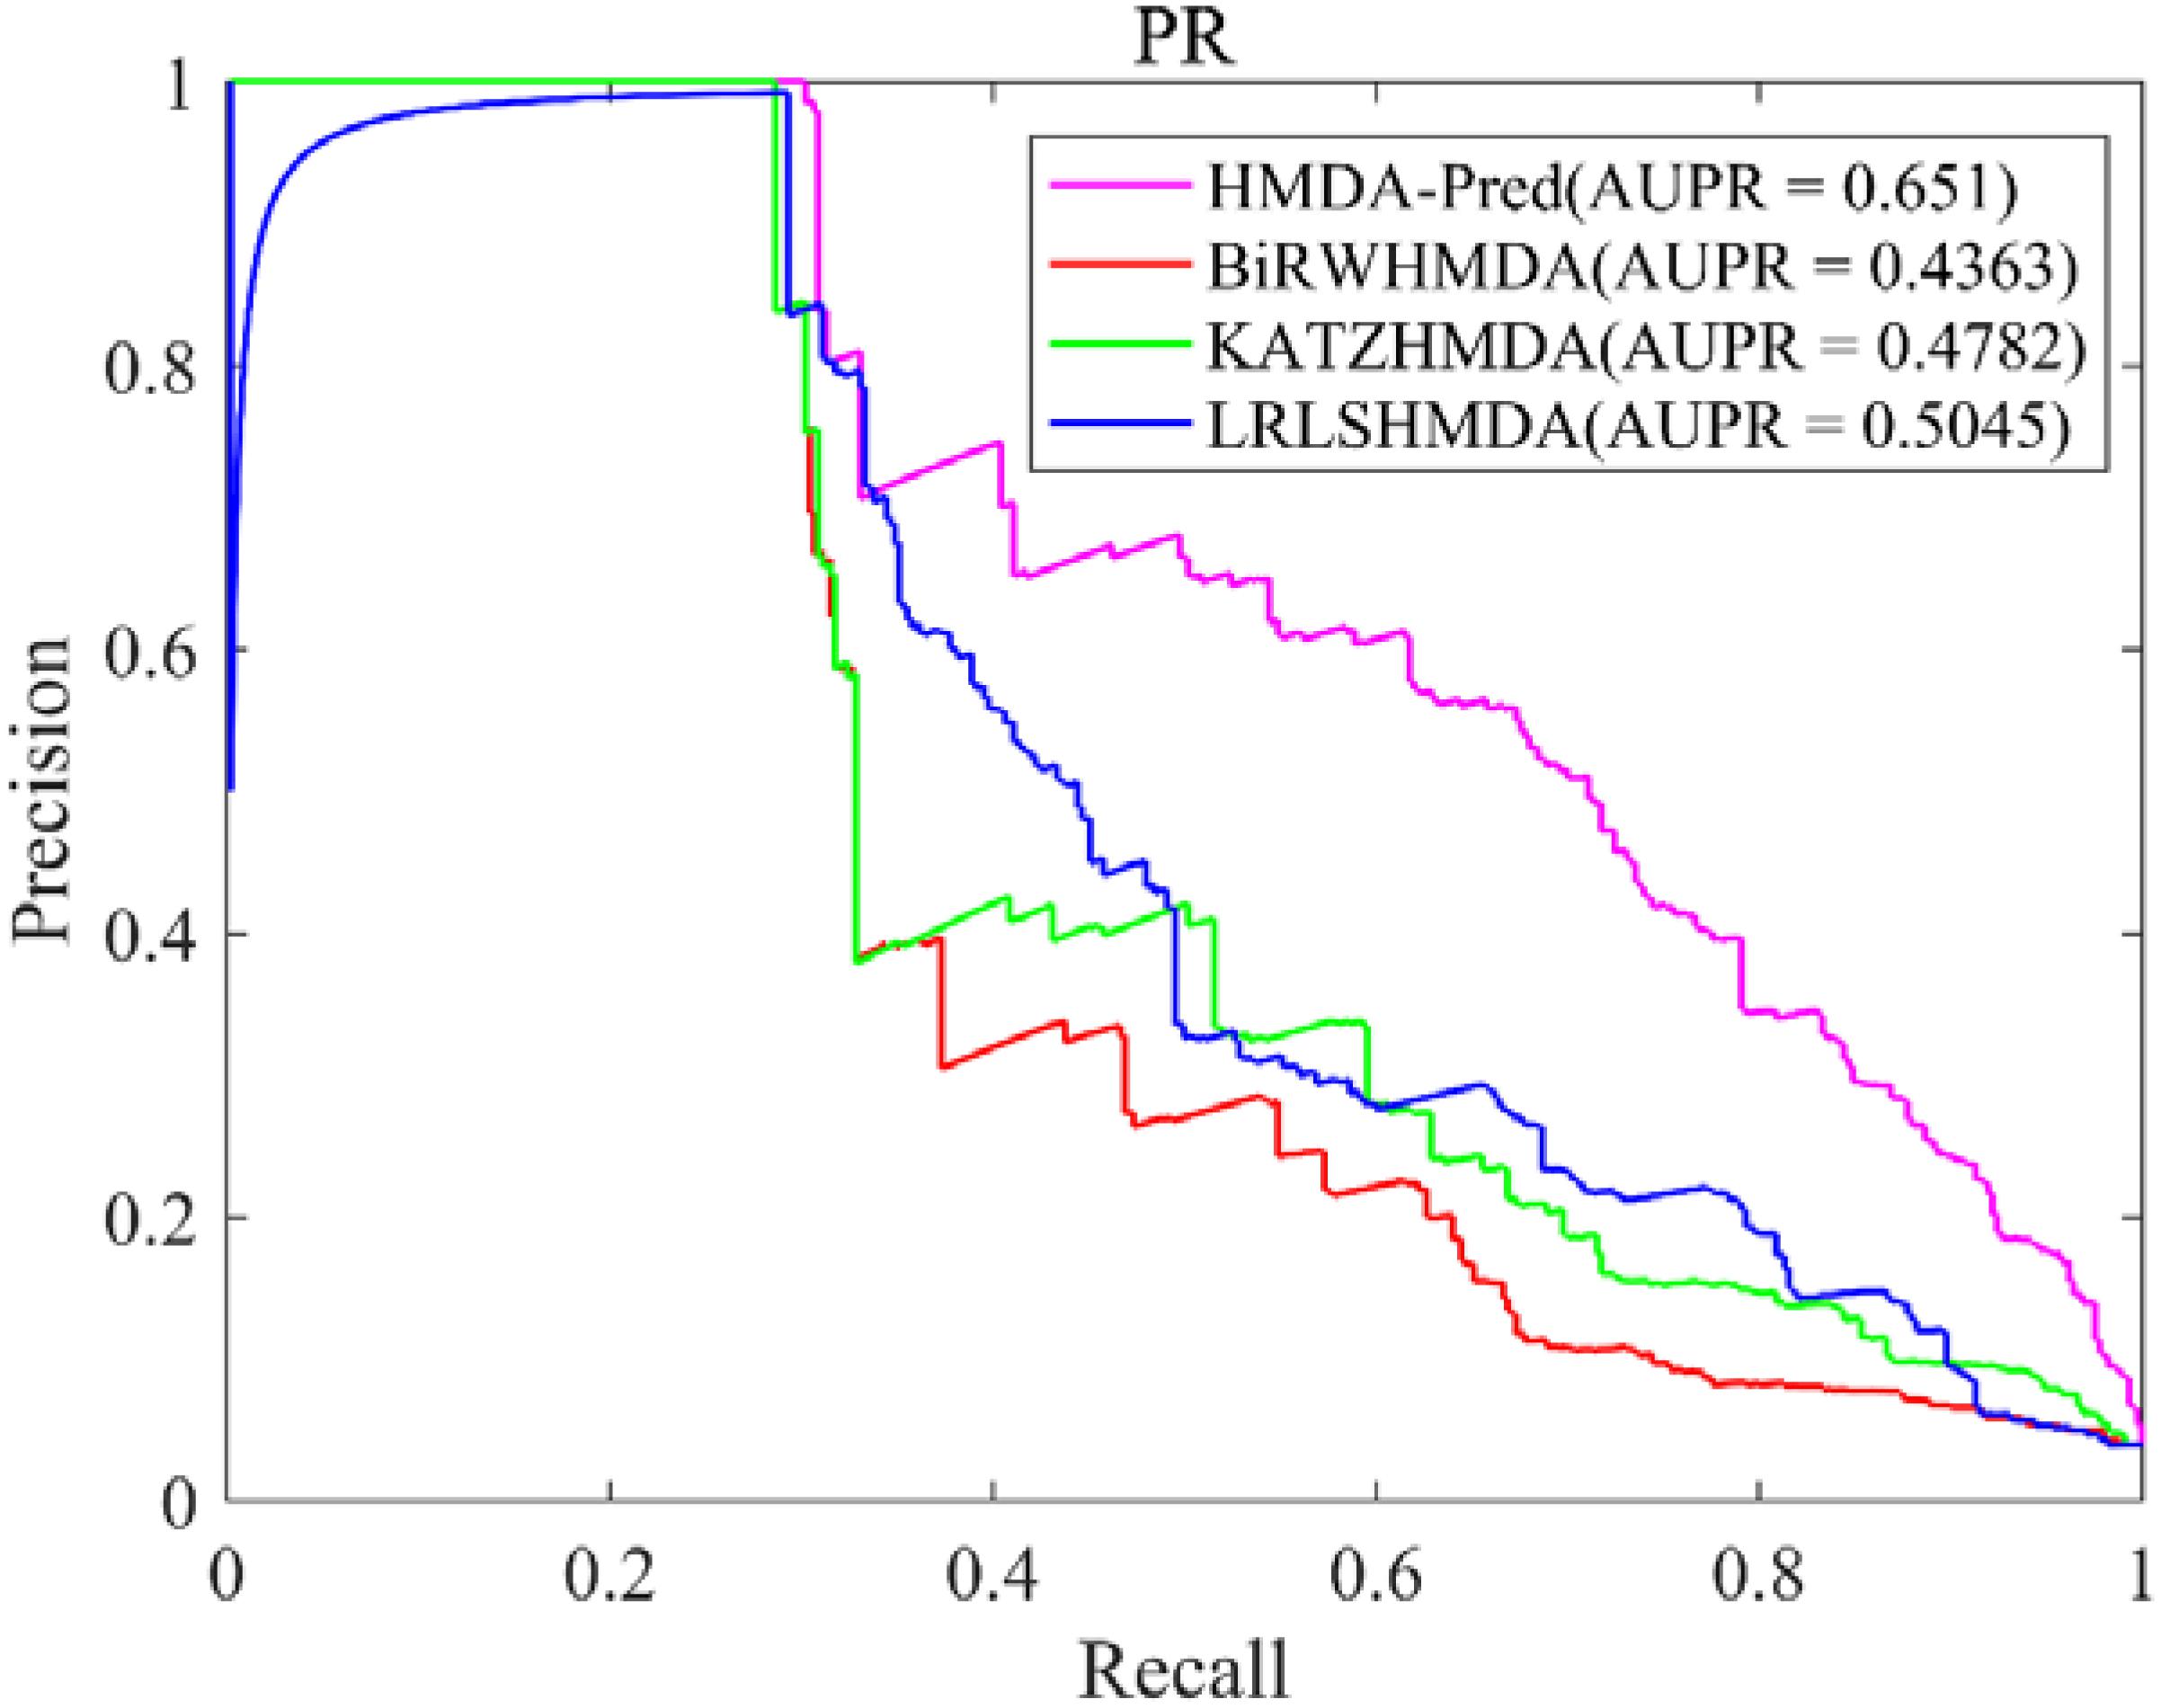
Figure 5. The PR curve of different methods in LOOCV.
Moreover, we used two stringency levels to further measure the predictive performance of the model (Sun et al., 2016). As shown in Table 4, at the medium specificity level (Spe = 95.0%), the Sen, Acc, Pre, F1, and MCC of HMDA-Pred are 79.1, 94.4, 39.4, 52.6, and 53.4%, respectively; of KATZHMDA are 59.7, 93.6, 32.9, 42.4, and 41.2%, respectively; that of LRLSHMDA are 55.1, 93.4, 31.2, 39.8, and 38.3%, respectively; and that of BiRWHMDA are 46.9, 93.1, 27.8, 34.9, and 32.7%, respectively. When Spe = 99.0% (i.e., at the high specificity level), the Sen, Acc, Pre, F1, and MCC of HMDA-Pred are 49.9, 97.1, 67.3, 57.2, and 56.4%, which are higher than those of KATZHMDA, LRLSHMDA, and BiRWHMDA methods.
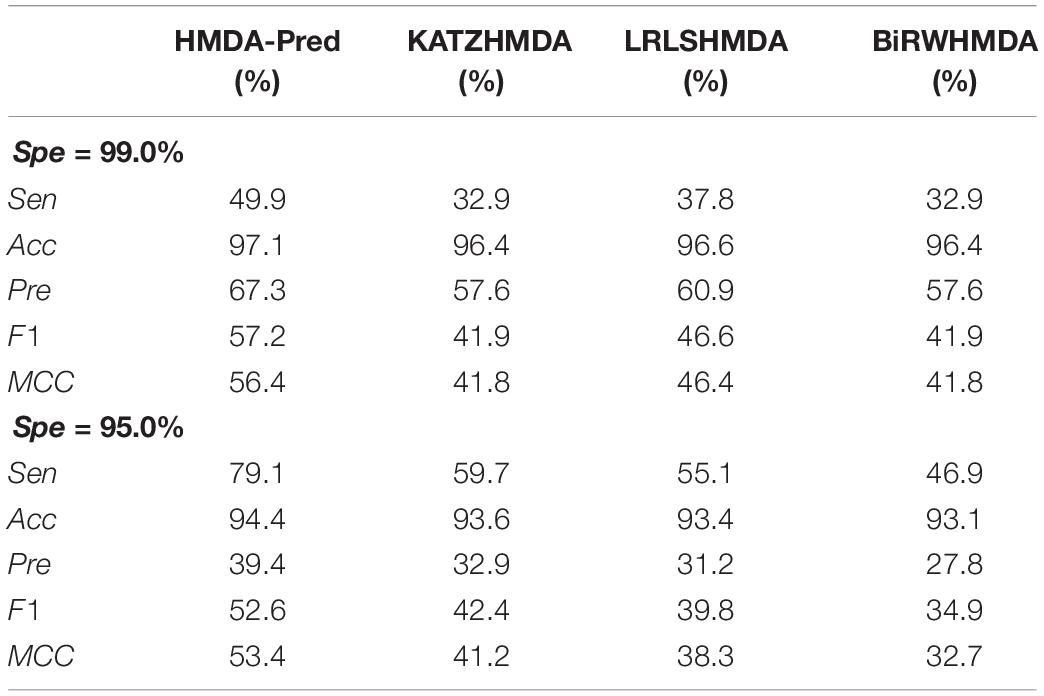
Table 4. The evaluation indicators of different methods at two stringency levels.
In addition, we compared the HMDA-Pred method with the BRWMDA (Yan et al., 2019), PBHMDA (Huang et al., 2017), PRWHMDA (Wu et al., 2018), NGRHMDA (Huang et al., 2017), KATZBNRA (Li et al., 2019), NTSHMDA (Luo and Long, 2018), BMCMDA (Shi et al., 2018), NCPHMDA (Bao et al., 2017), ABHMDA (Peng et al., 2018), NBLPIHMDA (Wang et al., 2019), and GRNMFHMDA (He et al., 2018) methods. As shown in Figure 6, these AUC values extracted from the original papers include 0.9397, 0.9169, 0.9150, 0.9111, 0.9098, 0.9070, 0.9060, 0.9039, 0.8869, 0.8777, and 0.8715. The AUC value of HMDA-Pred is 0.9589, which is higher than those of other 10 methods by 0.0192, 0.0420, 0.0439, 0.0478, 0.0491, 0.0519, 0.0529, 0.0550, 0.0720, 0.0812, and 0.0874, respectively. The above experimental results fully demonstrate that the HMDA-Pred method has better prediction performance than the other state-of-the-art methods.
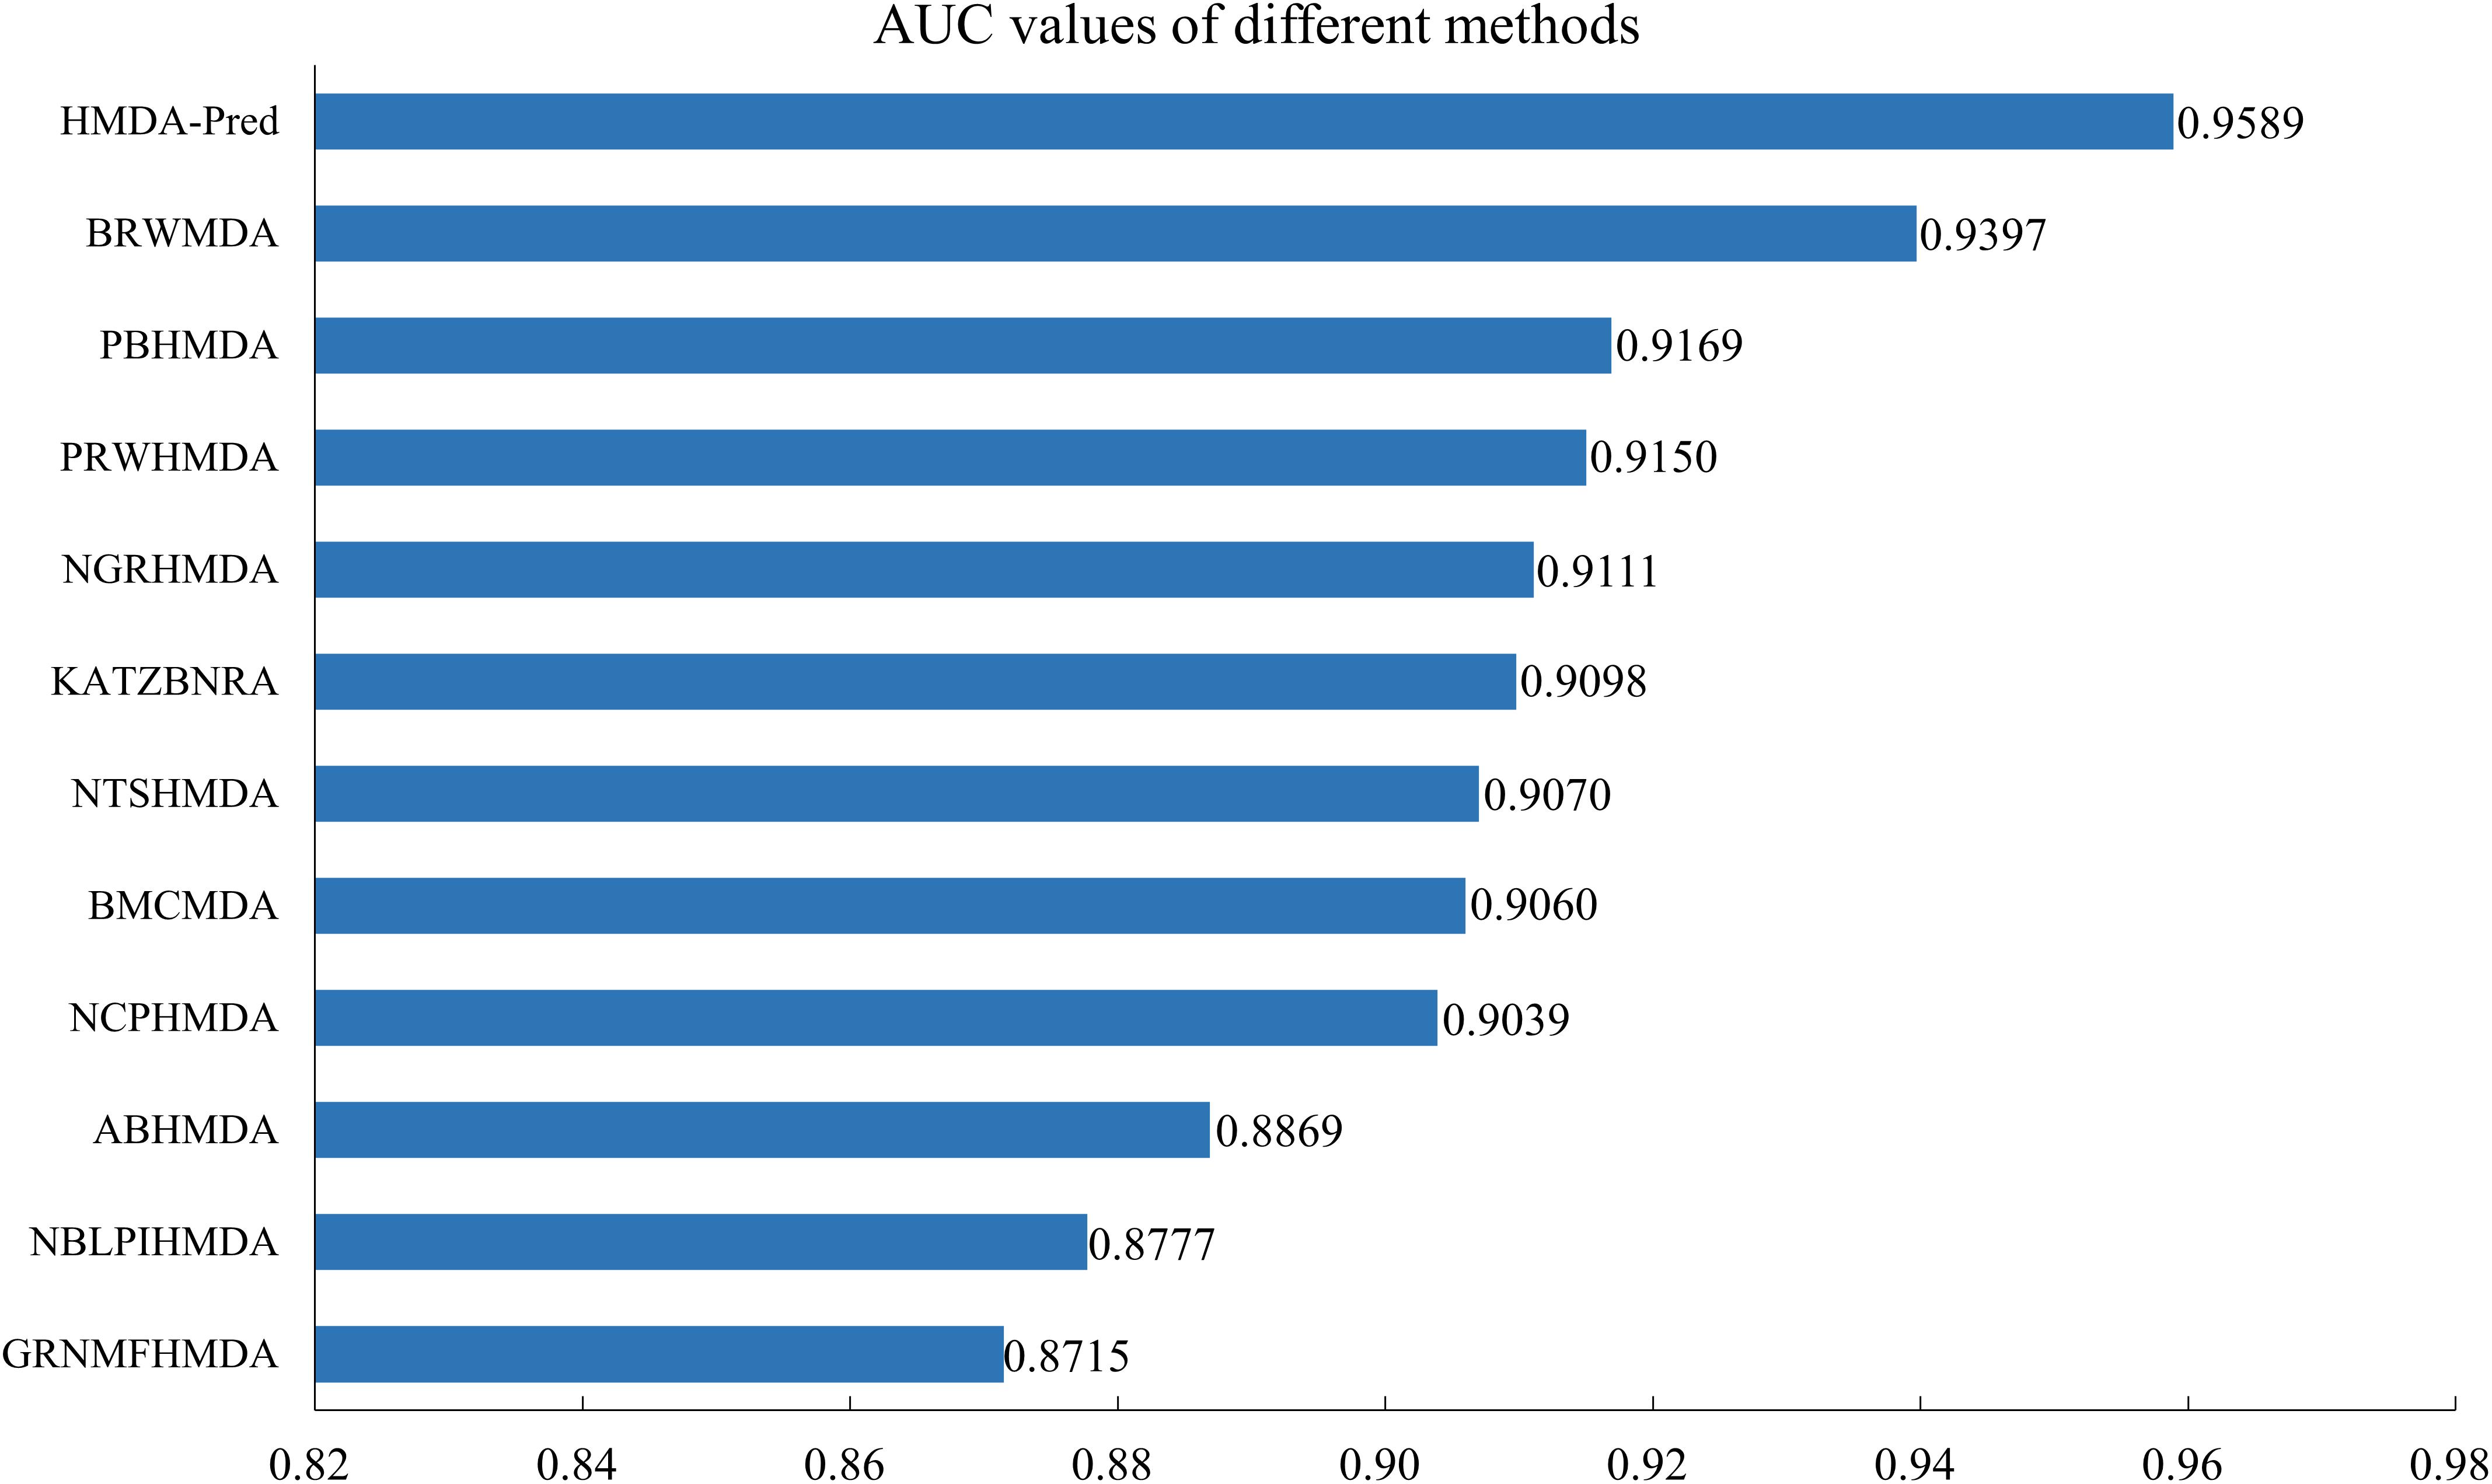
Figure 6. AUC values of different methods in LOOCV.
Case Studies
In this section, we investigated the top 10 microbes predicted by HMDA-Pred to be potentially associated with asthma, colon cancer, and inflammatory bowel disease, respectively. Then, we validated the predicted results by searching the relevant literatures, with the purpose of further evaluating the performance of HMDA-Pred.
Asthma is a common chronic disease, generally considered to be caused by a combination of genetic and environmental factors (Althani et al., 2016). The top 10 microbes predicted by the HMDA-Pred method have been confirmed to be potentially related to asthma in the relevant literatures, as shown in Table 5. Colon cancer is a common gastrointestinal malignant tumor with high morbidity and mortality (Bao et al., 2017). We selected the top 10 microbes that were potentially related to colon cancer predicted by HMDA-Pred, and through searching the relevant literatures, we confirmed that 8 of them were related to colon cancer, as shown in Table 6. Inflammatory bowel disease is also known as non-specific enteritis or idiopathic enteritis, whose etiology has not been completely clear. Also, there is no cure for it in medicine currently (Wu et al., 2018). The top 10 microbes most likely to be associated with inflammatory bowel disease were predicted by HMDA_Pred, which was confirmed by relevant literatures, as shown in Table 7.
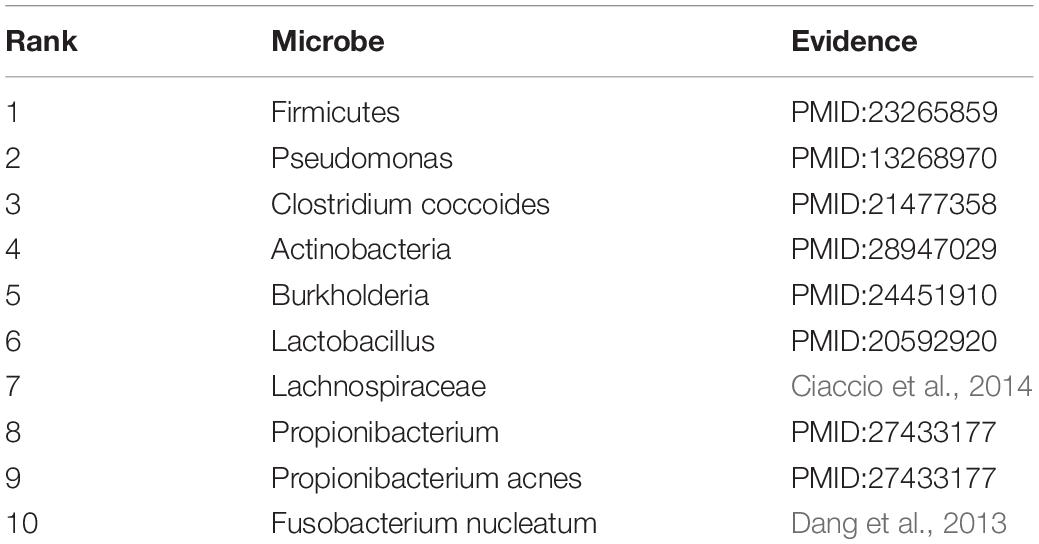
Table 5. The top 10 potential asthma-related microbes predicted by HMDA-Pred.
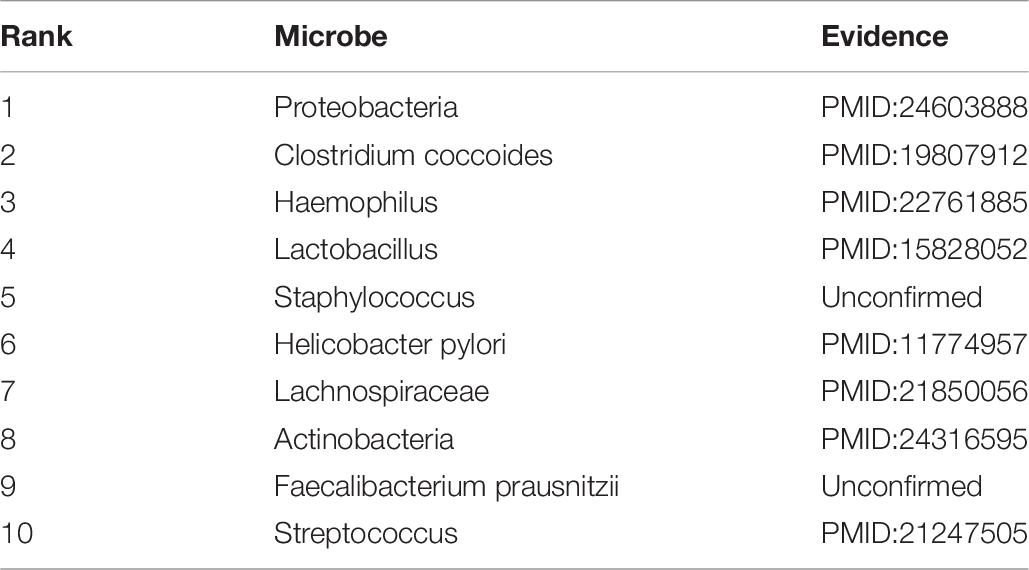
Table 6. The top 10 potential colon cancer-related microbes predicted by HMDA-pred.
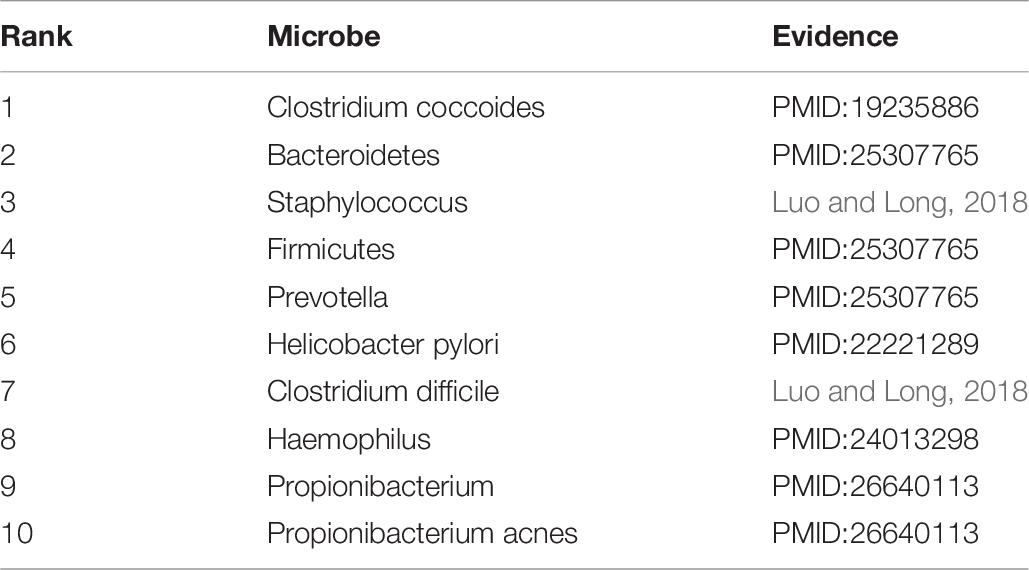
Table 7. The top 10 potential inflammatory bowel disease-related microbes predicted by HMDA-Pred.
Discussion
Effective computational methods can predict microbe–disease associations in a more efficient and low-cost manner, thus becoming an important aid to biological experimental methods.
In this study, we present a novel prediction method called HMDA-Pred based on known microbe–disease associations, Gaussian interaction profile kernel similarity for microbes and diseases, and cosine similarity for microbes and diseases to infer disease-associated microbes. HMDA-Pred achieved AUC values of 0.9589 and 0.9361 ± 0.0037 in the LOOCV and 5-fold CV, respectively. In addition, we conducted case studies of asthma, colon cancer, and inflammatory bowel disease to further validate the predictive performance of HMDA-Pred, where 10, 8, and 10 of the top 10 candidate microbes were confirmed from literatures, respectively. Given the superior performance of HMDA-Pred, we expect HMDA-Pred to be a promising and effective tool for assisting clinical and biological research.
There are several reasons why HMDA-Pred performs well in microbe–disease associations prediction. First, the datasets used in HMDA-Pred are relatively more reliable. Secondly, a linear network fusion method is used to fuse multiple similarity networks to obtain an informative matrix. Third, network consistency projection executed on microbe and disease spatial networks is efficient and reliable. There is also room for improvement of HMDA-Pred in future work. First, although the predictive performance of HMDA-Pred has improved compared to previous methods, it will be further improved if more reliable similarities are considered, such as the semantic similarity of diseases and the functional similarity of microbes. Second, HMDA-Pred will inevitably lead to a bias in disease with more known related microbes due to data imbalance.
Data Availability Statement
All datasets and code link for this study are included in the article.
Author Contributions
QZ developed the prediction model and designed the experiments. QZ, YF, and MC analyzed the experiment and results and wrote the manuscript. MC and WW proofread the manuscript. All authors contributed to the article and approved the submitted version.
Funding
This work was supported by the National Natural Science Foundation of China (Nos. 61762026 and 61462018), the Guangxi Key Laboratory of Trusted Software (No. kx201403) and Guangxi Colleges and Universities Key Laboratory of Intelligent Processing of Computer Images and Graphics (No. GIIP201502), the Guangxi Natural Science Foundation (Nos. 2017GXNSFAA198278 and 2016GXNSFAA380043), and the Innovation Project of GUET Graduate Education (Nos. 2018YJCX47 and 2019YCXS056).
Conflict of Interest
The authors declare that the research was conducted in the absence of any commercial or financial relationships that could be construed as a potential conflict of interest.
Footnotes
References
Althani, A. A., Marei, H. E., Hamdi, W. S., Nasrallah, G. K., El Zowalaty, M. E., Al Khodor, S., et al. (2016). Human microbiome and its association with health and diseases. J. Cell. Physiol. 231, 1688–1694. doi: 10.1002/jcp.25284
Bao, W., Jiang, Z., and Huang, D.-S. (2017). Novel human microbe-disease association prediction using network consistency projection. BMC Bioinf. 18:543. doi: 10.1186/s12859-017-1968-2
Chen, X., Huang, Y.-A., You, Z.-H., Yan, G.-Y., and Wang, X.-S. (2016). A novel approach based on KATZ measure to predict associations of human microbiota with non-infectious diseases. Bioinformatics 33, 733–739. doi: 10.1093/bioinformatics/btw715
Chen, X., Liu, M., and Yan, G. (2012). RWRMDA: predicting novel human microRNA-disease associations. Mol Biosyst. 8, 2792–2798. doi: 10.1039/c2mb25180a
Chen, X., and Yan, G.-Y. (2013). Novel human lncRNA-disease association inference based on lncRNA expression profiles. Bioinformatics 29, 2617–2624. doi: 10.1093/bioinformatics/btt426
Ciaccio, C. E., Kennedy, K., Barnes, C. S., Portnoy, J. M., and Rosenwasser, L. J. (2014). The home microbiome and childhood asthma. J. Allergy Clin. Immunol. 133:AB70. doi: 10.1016/j.jaci.2013.12.274
Dang, H. T., Park, H. K., Shin, J. W., Park, S.-G., and Kim, W. (2013). Analysis of oropharyngeal microbiota between the patients with bronchial asthma and the non-asthmatic persons. J. Bacteriol. Virol. 43, 270–278. doi: 10.4167/jbv.2013.43.4.270
Fan, Y.-X., and Shen, H.-B. (2014). Predicting pupylation sites in prokaryotic proteins using pseudo-amino acid composition and extreme learning machine. Neurocomputing 128, 267–272. doi: 10.1016/j.neucom.2012.11.058
Frank, D. N., Amand, A. L. S., Feldman, R. A., Boedeker, E. C., Harpaz, N., and Pace, N. R. (2007). Molecular-phylogenetic characterization of microbial community imbalances in human inflammatory bowel diseases. Proc. Natl. Acad. Sci. U.S.A. 104, 13780–13785. doi: 10.1073/pnas.0706625104
Fredricks, D. N., Fiedler, T. L., and Marrazzo, J. M. (2005). Molecular identification of bacteria associated with bacterial vaginosis. N. Engl. J. Med. 353, 1899–1911. doi: 10.1056/NEJMoa043802
Gu, C., Liao, B., Li, X., and Li, K. (2016). Network consistency projection for human miRNA-disease associations inference. Sci. Rep. 6:36054. doi: 10.1038/srep36054
He, B.-S., Peng, L.-H., and Li, Z. (2018). Human microbe-disease association prediction with graph regularized non-negative matrix factorization. Front. Microbiol. 9:2560. doi: 10.3389/fmicb.2018.02560
Hilty, M., Burke, C., Pedro, H., Cardenas, P., Bush, A., Bossley, C., et al. (2010). Disordered microbial communities in asthmatic airways. PLoS ONE 5:e8578. doi: 10.1371/journal.pone.0008578
Hoppe, B., Groothoff, J. W., Hulton, S.-A., Cochat, P., Niaudet, P., Kemper, M. J., et al. (2011). Efficacy and safety of oxalobacter formigenes to reduce urinary oxalate in primary hyperoxaluria. Nephrol. Dial. Transplant. 26, 3609–3615. doi: 10.1093/ndt/gfr107
Huang, Y.-A., You, Z.-H., Chen, X., Huang, Z.-A., Zhang, S., and Yan, G.-Y. (2017). Prediction of microbe-disease association from the integration of neighbor and graph with collaborative recommendation model. J. Transl. Med. 15:209. doi: 10.1186/s12967-017-1304-7
Huang, Z.-A., Chen, X., Zhu, Z., Liu, H., Yan, G.-Y., You, Z.-H., et al. (2017). PBHMDA: path-based human microbe-disease association prediction. Front. Microbiol. 8:233. doi: 10.3389/fmicb.2017.00233
Jiang, L., Ding, Y., Tang, J., and Guo, F. (2018). MDA-SKF: similarity kernel fusion for accurately discovering miRNA-disease association. Front. Genet. 9:618. doi: 10.3389/fgene.2018.00618
Kostic, A. D., Gevers, D., Pedamallu, C. S., Michaud, M., Duke, F., Earl, A. M., et al. (2012). Genomic analysis identifies association of Fusobacterium with colorectal carcinoma. Genome Res. 22, 292–298. doi: 10.1101/gr.126573.111
Kouzuma, A., Kato, S., and Watanabe, K. (2015). Microbial interspecies interactions: recent findings in syntrophic consortia. Front. Microbiol. 6:477. doi: 10.3389/fmicb.2015.00477
Li, G., Luo, J., Xiao, Q., Liang, C., and Ding, P. (2018). Predicting microRNA-disease associations using label propagation based on linear neighborhood similarity. J. Biomed. Inf. 82, 169–177. doi: 10.1016/j.jbi.2018.05.005
Li, S., Xie, M., and Liu, X. (2019). A novel approach based on bipartite network recommendation and KATZ model to predict potential micro-disease associations. Front. Genet. 10:1147. doi: 10.3389/fgene.2019.01147
Liu, B. (2019). BioSeq-analysis: a platform for DNA, RNA and protein sequence analysis based on machine learning approaches. Brief Bioinform. 20, 1280–1294. doi: 10.1093/bib/bbx165
Liu, B., Gao, X., and Zhang, H. (2019). BioSeq-Analysis2.0: an updated platform for analyzing DNA, RNA and protein sequences at sequence level and residue level based on machine learning approaches. Nucleic Acids Res. 47:e127. doi: 10.1093/nar/gkz740
Luo, J., and Long, Y. (2018). NTSHMDA: prediction of human microbe-disease association based on random walk by integrating network topological similarity. IEEE/ACM Trans. Comput. Biol. Bioinf. doi: 10.1109/tcbb.2018.2883041∗
Ma, W., Zhang, L., Zeng, P., Huang, C., Li, J., Geng, B., et al. (2016). An analysis of human microbe-disease associations. Briefings Bioinf. 18, 85–97. doi: 10.1093/bib/bbw005
Methé, B. A., Nelson, K. E., Pop, M., Creasy, H. H., Giglio, M. G., Huttenhower, C., et al. (2012). A framework for human microbiome research. Nature 486:215. doi: 10.1038/nature11209
Pan, X., and Shen, H. B. (2018). Predicting RNA-protein binding sites and motifs through combining local and global deep convolutional neural networks. Bioinformatics 34, 3427–3436. doi: 10.1093/bioinformatics/bty364
Pan, X., and Shen, H.-B. (2019). Inferring disease-associated microRNAs using semi-supervised multi-label graph convolutional networks. iScience 20, 265–277. doi: 10.1016/j.isci.2019.09.013
Pan, X., and Shen, H.-B. (2020). Scoring disease-microRNA associations by integrating disease hierarchy into graph convolutional networks. Pattern Recognit. 105:107385. doi: 10.1016/j.patcog.2020.107385
Peng, L.-H., Yin, J., Zhou, L., Liu, M.-X., and Zhao, Y. (2018). Human microbe-disease association prediction based on adaptive boosting. Front. Microbiol. 9:2440. doi: 10.3389/fmicb.2018.02440
Qin, J., Li, R., Raes, J., Arumugam, M., Burgdorf, K. S., Manichanh, C., et al. (2010). A human gut microbial gene catalogue established by metagenomic sequencing. Nature 464, 59–65. doi: 10.1038/nature08821
Sears, C. L., and Garrett, W. S. (2014). Microbes, microbiota, and colon cancer. Cell Host Microbe 15, 317–328. doi: 10.1016/j.chom.2014.02.007
Shi, J., Huang, H., Zhang, Y., Cao, J., and Yiu, S. (2018). BMCMDA: a novel model for predicting human microbe-disease associations via binary matrix completion. BMC Bioinformatics 19:281. doi: 10.1186/s12859-018-2274-3
Sobhani, I., Tap, J., Roudot-Thoraval, F., Roperch, J. P., Letulle, S., Langella, P., et al. (2011). Microbial dysbiosis in colorectal cancer (CRC) patients. PLoS ONE 6:e16393. doi: 10.1371/journal.pone.0016393
Sommer, F., and Bäckhed, F. (2013). The gut microbiota-masters of host development and physiology. Nat. Rev. Microbiol. 11:227. doi: 10.1038/nrmicro2974
Sun, D., Li, A., Feng, H., and Wang, M. (2016). NTSMDA: prediction of miRNA-disease associations by integrating network topological similarity. Mol. BioSyst. 12, 2224–2232. doi: 10.1039/c6mb00049e
Turnbaugh, P. J., Hamady, M., Yatsunenko, T., Cantarel, B. L., Duncan, A., Ley, R. E., et al. (2009). A core gut microbiome in obese and lean twins. Nature 457:480. doi: 10.1038/nature07540
van Laarhoven, T., Nabuurs, S. B., and Marchiori, E. (2011). Gaussian interaction profile kernels for predicting drug-target interaction. Bioinformatics 27:3036–3043. doi: 10.1093/bioinformatics/btr500
Ventura, M., O’flaherty, S., Claesson, M. J., Turroni, F., Klaenhammer, T. R., Van Sinderen, D., et al. (2009). Genome-scale analyses of health-promoting bacteria: probiogenomics. Nat. Rev. Microbiol. 7, 61–71. doi: 10.1038/nrmicro2047
Wang, F., Huang, Z.-A., Chen, X., Zhu, Z., Wen, Z., Zhao, J., et al. (2017). LRLSHMDA: laplacian regularized least squares for human microbe-disease association prediction. Sci. Rep. 7:7601. doi: 10.1038/s41598-017-08127-2
Wang, L., Wang, Y., Li, H., Feng, X., Yuan, D., and Yang, J. (2019). A bidirectional label propagation based computational model for potential microbe-disease association prediction. Front. Microbiol. 10:684. doi: 10.3389/fmicb.2019.00684
Wu, C., Gao, R., Zhang, D., Han, S., and Zhang, Y. (2018). PRWHMDA: human microbe-disease association prediction by random walk on the heterogeneous network with PSO. Int. J. Biol. Sci. 14, 849–857. doi: 10.7150/ijbs.24539
Xie, G., Meng, T., Luo, Y., and Liu, Z. (2019). SKF-LDA: similarity kernel fusion for predicting lncRNA-disease association. Mol. Ther. Nucleic Acids 18, 45–55. doi: 10.1016/j.omtn.2019.07.022
Yan, C., Duan, G., Wu, F., Pan, Y., and Wang, J. (2019). BRWMDA:Predicting microbe-disease associations based on similarities and bi-random walk on disease and microbe networks. IEEE/ACM Trans. Comput. Biol. Bioinf. doi: 10.1109/TCBB.2019.2907626∗
Zheng, X., Wang, Y., Tian, K., Zhou, J., Guan, J., Luo, L., et al. (2017). Fusing multiple protein-protein similarity networks to effectively predict lncRNA-protein interactions. BMC Bioinf. 18(Suppl. 12):420. doi: 10.1186/s12859-017-1819-1
Keywords: disease, microbe, association prediction, multi-data integration, network consistency projection
Citation: Fan Y, Chen M, Zhu Q and Wang W (2020) Inferring Disease-Associated Microbes Based on Multi-Data Integration and Network Consistency Projection. Front. Bioeng. Biotechnol. 8:831. doi: 10.3389/fbioe.2020.00831
Received: 19 May 2020; Accepted: 29 June 2020;
Published: 04 August 2020.
Edited by:
Xi Wang, BASF, BelgiumReviewed by:
Hao Lin, University of Electronic Science and Technology of China, ChinaWang-Ren Qiu, Jingdezhen Ceramic Institute, China
Bin Liu, Beijing Institute of Technology, China
Copyright © 2020 Fan, Chen, Zhu and Wang. This is an open-access article distributed under the terms of the Creative Commons Attribution License (CC BY). The use, distribution or reproduction in other forums is permitted, provided the original author(s) and the copyright owner(s) are credited and that the original publication in this journal is cited, in accordance with accepted academic practice. No use, distribution or reproduction is permitted which does not comply with these terms.
*Correspondence: Yongxian Fan, eW9uZ3hpYW4uZmFuQGdtYWlsLmNvbQ==