 Yingchun Yan
 Yong Nie
 Liyun An
 Yue-Qin Tang
 Zimu Xu
 Xiao-Lei Wu
- 1Institute of New Energy and Low-carbon Technology, Sichuan University, Chengdu, China
- 2College of Engineering, Peking University, Beijing, China
- 3Institute of Ocean Research, Peking University, Beijing, China
Surface-enhanced Raman scattering (SERS) is a useful tool for label-free analysis of bacteria at the single cell level. However, low reproducibility limits the use of SERS. In this study, for the sake of sensitive and reproducible Raman spectra, we optimized the methods for preparing silver nanoparticles (AgNPs) and depositing AgNPs onto a cell surface. We found that fast dropwise addition of AgNO3 into the reductant produced smaller and more stable AgNPs, with an average diameter of 45 ± 4 nm. Compared with that observed after simply mixing the bacterial cells with AgNPs, the SERS signal was significantly improved after centrifugation. To optimize the SERS enhancement method, the centrifugal force, method for preparing AgNPs, concentration of AgNPs, ionic strength of the solution used to suspend the cells, and density of the cells were chosen as impact factors and optimized through orthogonal experiments. Finally, the improved method could generate sensitive and reproducible SERS spectra from single Escherichia coli cells, and the SERS signals primarily arose from the cell envelope. We further verified that this optimal method was feasible for the detection of low to 25% incorporation of 13C isotopes by the cells and the discrimination of different bacterial species. Our work provides an improved method for generating sensitive and reproducible SERS spectra.
Introduction
Microbes are the most diverse and abundant organisms on Earth and play crucial roles in biogeochemical carbon and nitrogen cycling. Traditional methods, such as cell culture, have been used to detect and study microorganisms. Recently, culture-independent methods, such as meta-“omics” (MacLean et al., 2009; Scholz et al., 2012), gene chips (He et al., 2007; DeAngelis et al., 2011), and PCR (Aw and Rose, 2012), have been developed and are useful tools for investigating microbes that cannot be cultured in the laboratory. However, these methods are limited in regard to speed, cost, sensitivity, or failure in correlation with the biochemical traits of the target species. In addition, they are not suitable for single-cell analysis, which is important for understanding the biochemical roles of microorganisms in their natural habitats (Davey and Kell, 1996; Amann and Fuchs, 2008; Kalisky and Quake, 2011).
In the last decade, certain tools, including nanometer-scale secondary ion mass spectrometry (NanoSIMS) (Orphan et al., 2001) and a combination of microautoradiography and fluorescence in situ hybridization (MAR-FISH) (Kindaichi et al., 2004), have been used to detect the functions and activities of single microbial cells in situ within complex communities. Among these tools, Raman spectroscopy combined with microscopy (Raman microspectroscopy) has received increasing attention for label-free analysis of bacteria at the single cell level (Wagner, 2009; Huang et al., 2010; Li et al., 2012b). Due to the high spatial resolution, Raman microspectroscopy can characterize single bacterial cells in a non-invasive and non-destructive manner based on their chemical information, which enables discrimination of different bacterial species at the single cell level (Jarvis and Goodacre, 2004; Berus et al., 2020). This technology can also be combined with stable isotope probing (SIP) (Wang Y. et al., 2016; Wang et al., 2020), FISH (Fernando et al., 2019), and cell sorting, which makes it possible to identify bacterial cells with desired functions from a complex microbial community and even capture the desired cells for subsequent genome sequencing or cultivation (Song et al., 2016; Lee et al., 2019). However, unenhanced Raman spectroscopy is inherently weak, with just one in 106–108 photons incident on the sample, and requires a long acquisition time (Huang et al., 2010). Several efforts have been made to shorten the acquisition time and improve the analytical throughput. For example, a more powerful laser source has been used to conquer the weak scattering signal but might damage biological samples (Kahraman et al., 2008). Recently, resonance Raman spectroscopy has been used to characterize bacteria species at the single cell level. However, this method is often used to detect and screen carotenoid-containing photosynthetic microorganisms (Li et al., 2012a) because it depends on the resonance Raman-active compounds, such as carotenoids.
The surface-enhanced Raman scattering (SERS) effect was first discovered in 1974 (Fleischmann et al., 1974). SERS allows identification of analytes in contact with or very close to plasmonic nanostructures and offers an improvement with enhancement factors of up to 106–1014 (Lombardi and Birke, 2009) compared with unenhanced Raman scattering. Like conventional Raman spectroscopy, SERS can be combined with other techniques for specific purposes, such as microspectroscopy, SIP, and single cell sorting (Jarvis and Goodacre, 2004; Li et al., 2012b; Kubryk et al., 2015). It can also be implemented with other modifications of normal Raman scattering, including surface-enhanced resonance Raman scattering (SERRS) (Millo et al., 2011; Bodelon et al., 2016) and tip-enhanced Raman scattering (TERS) (Deckert-Gaudig and Deckert, 2011).
In recent years, due to the high sensitivity, SERS and its modified techniques have been widely used for microbiological research at the single cell level. For example, it has been used to detect bacteria in water (Zhou et al., 2014) and blood (Boardman et al., 2016; Wei et al., 2018; Zhao et al., 2018), discriminate live and dead bacteria (Zhou et al., 2015), and discriminate different bacteria species based on the fingerprint characteristic of SERS (Weiss et al., 2019). Although SERS shows great potential in microbiological research, certain bottlenecks should be addressed. The main drawback of SERS is low reproducibility, to which several factors contribute. First, colloidal silver nanoparticles (AgNPs) are the metal nanoparticles most often used for SERS, where the AgNPs are simply mixed with the bacterial cells (Kahraman et al., 2011). Unstable nanoparticles and poor attachment of nanoparticles to the bacterial cell surface can lead to highly heterogeneous SERS spectra. Second, the microbial SERS signals are mainly attributed to flavins (Zeiri et al., 2004), peptidoglycan (Jarvis and Goodacre, 2004), and adenine-derived compounds (Kubryk et al., 2016). Uncontrollable release of the above compounds induced during sample preparation can result in erroneous spectra. Thirdly, long-time incubation of cells and AgNPs would decrease the reproducibility. Because Raman signals of the target molecules are enhanced when they are very close to metal nanoparticles (Panneerselvam et al., 2018), long-time incubation was usually used to deposit the AgNPs on the cell surface and obtain ideal enhancement. Moreover, although methods for AgNPs preparation have been reported, the effects of the AgNP preparation on SERS are still unclear.
In this work, we optimized the methods used for AgNPs preparation and deposition onto a cell surface. Using Escherichia coli as the target, the improved method generated sensitive and reproducible SERS spectra at the single cell level. Different bacterial species and SIP were also implemented to verify the application potential of the improved method for use in microbiological research.
Materials and Methods
Preparation of Silver Nanoparticles
The standard chemicals peptone, yeast extract were purchased from Sigma-Aldrich (Shanghai, China), NaCl, KCl, Na2HPO4, KH2PO4, sucrose, silver nitrate and hydroxylamine hydrochloride were purchased from Sinopharm (Shanghai, China). 13C6-glucose was purchased from Sigma-Aldrich (Shanghai, China). Four different procedures were used to prepare silver nanoparticles (AgNPs) in this study (Figure 1A). AgNPs-1 and AgNPs-2 were produced by adding 1 mL silver nitrate solution (10–2 mol/L) dropwise into 9 mL hydroxylamine hydrochloride solution (1.67 × 10⁻³ mol/L) containing 3.33 × 10⁻³ mol/L sodium hydroxide, with a flow velocity of 1 mL/min and 40 mL/min, respectively. AgNPs-3 and AgNPs-4 were produced by adding 1 mL hydroxylamine hydrochloride solution (1.5 × 10⁻² mol/L) containing 3 × 10⁻² mol/L sodium hydroxides dropwise into 9 mL silver nitrate solution (1.11 × 10⁻³ mol/L), with a flow velocity of 1 mL/min and 40 mL/min, respectively. The flow velocity was controlled with a syringe pump (Longer, China). After dropwise addition, the solutions were gently mixed immediately. This silver colloid solution is referred to as 1× in the text. The silver colloids were stored at 4°C in the dark for further use.
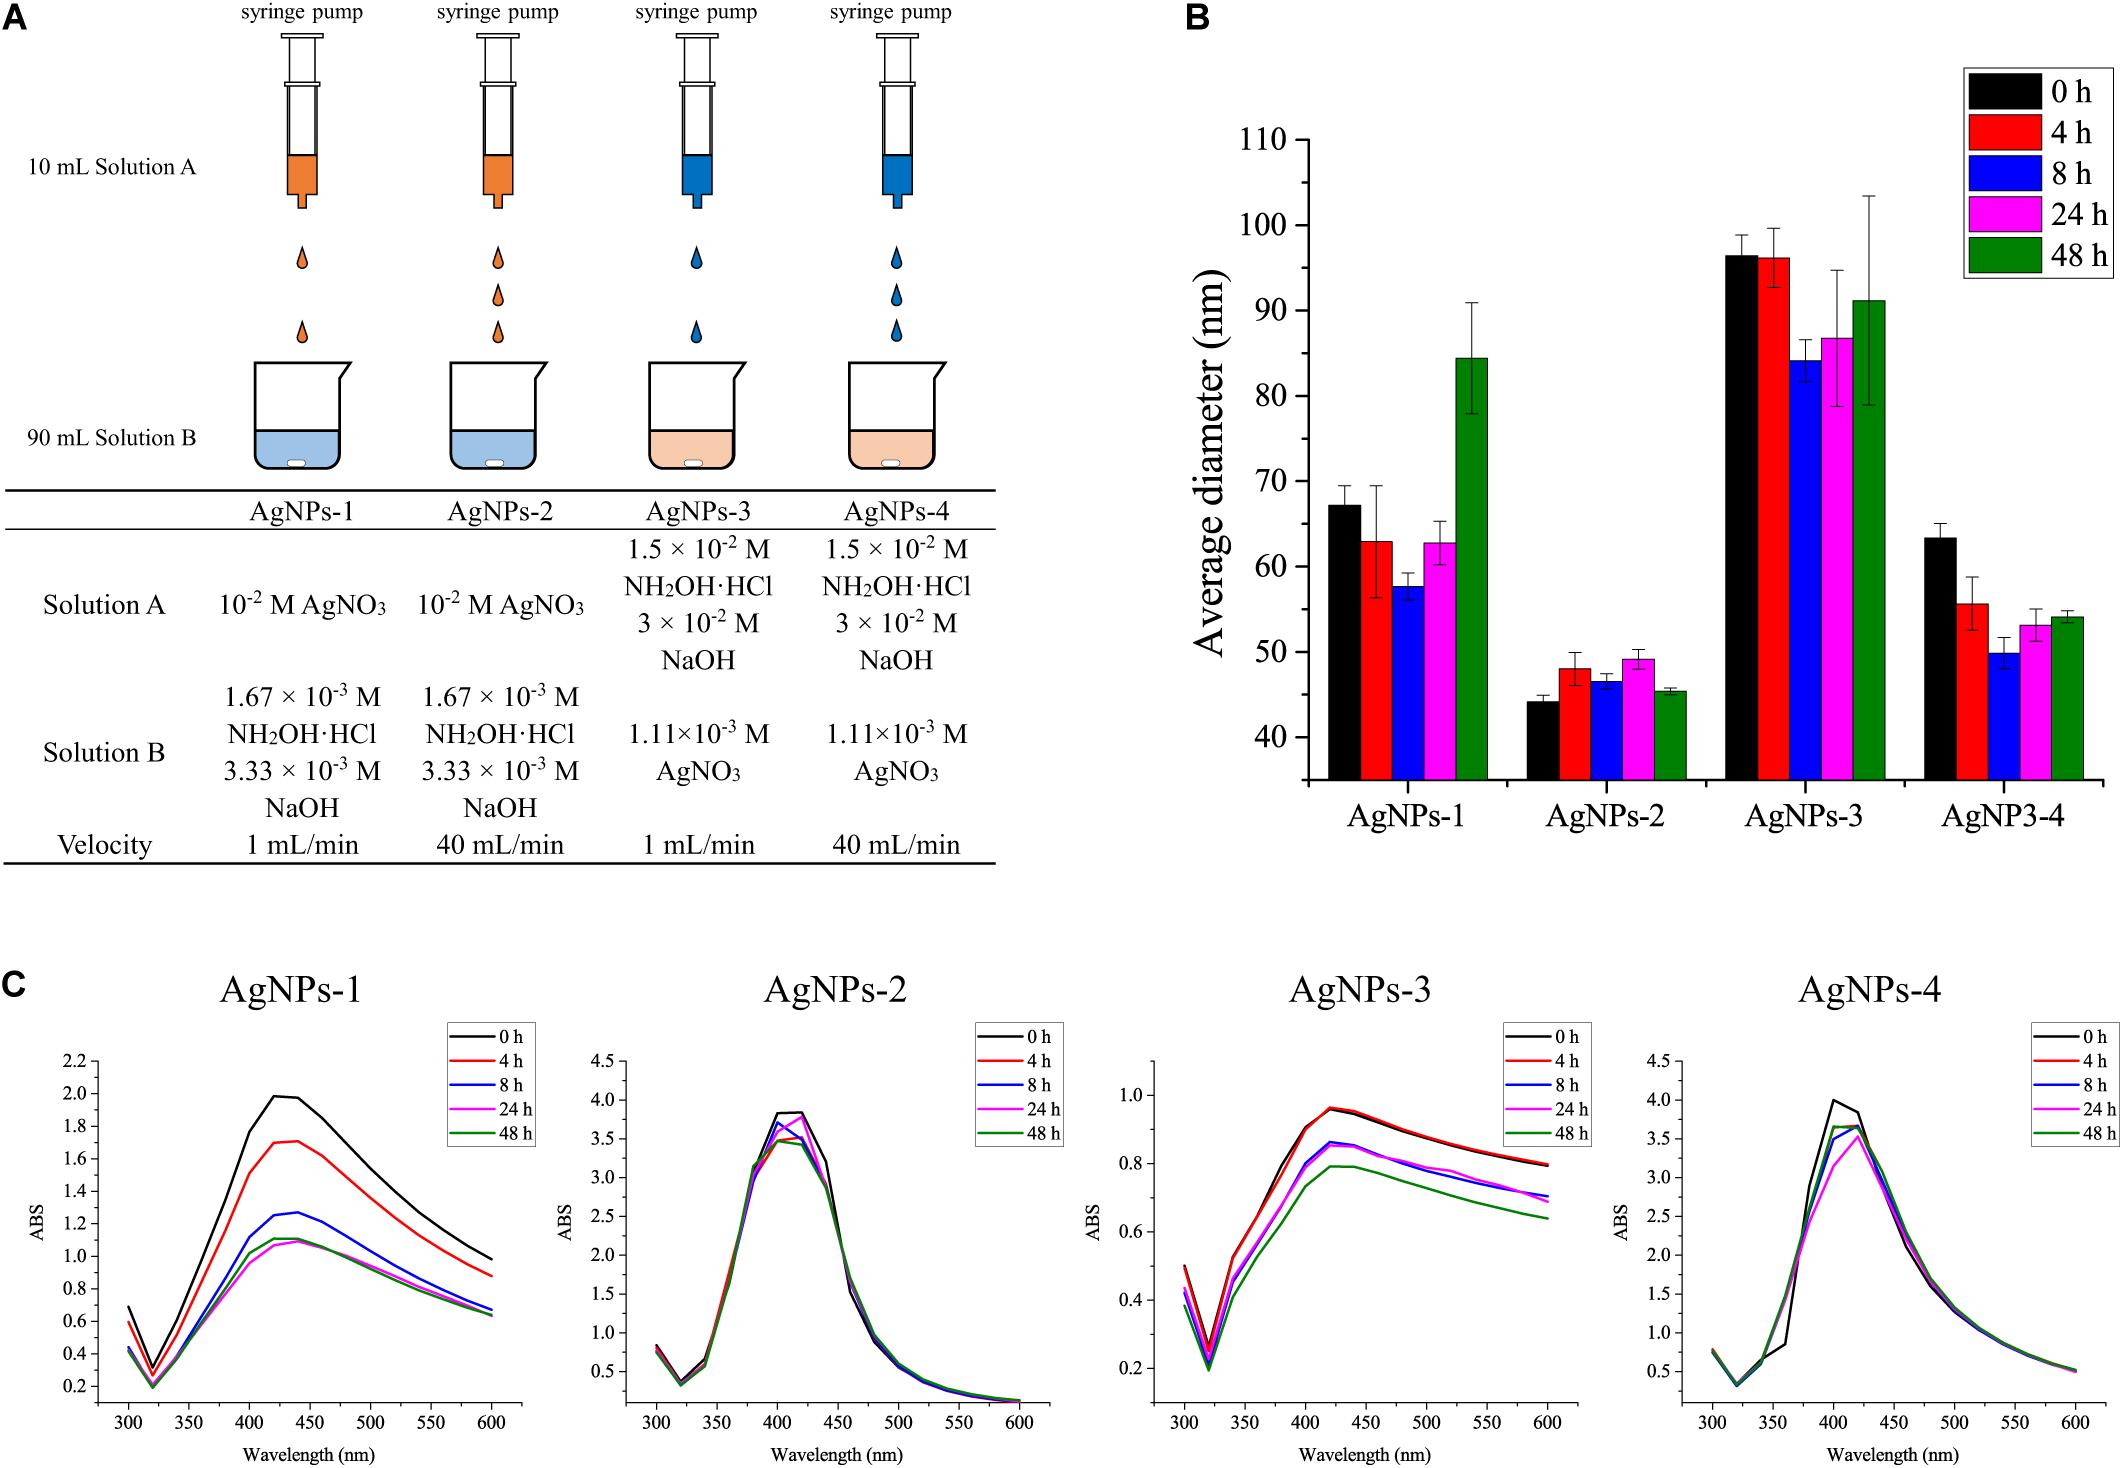
Figure 1. (A) Different AgNP preparation methods and (B) the average diameters, and (C) stability of AgNPs during storage for 48 h at 4°C. Each experiment was replicated three times.
To evaluate the size and stability of AgNPs, the fresh silver colloids were stored at 4°C in the dark for 48 h, and the UV–Vis spectra and nanopotential were recorded at 0, 4, 8, 24, and 48 h. The UV–Vis spectra of silver colloids were obtained using a UV–Vis spectrometer (UV-1700, Shimadzu, Japan), and the full width at half absorption maximum was calculated to evaluate the size and stability of AgNPs (Leopold and Lendl, 2003). The size of AgNPs was measured using a Zetasizer Nano ZS (Malvern, United Kingdom) nanoparticle size analyzer (Mathioudakis et al., 2020).
Preparation of Bacterial Cultures
Escherichia coli DH5α was purchased from TransGen Biotech (Beijing, China). Dietzia sp. DQ12-45-1b (Wang et al., 2011) and Bacillus subtilis BSw800 were isolates stored in our laboratory. E. coli DH5α and Bacillus subtilis BSw800 were cultured in lysogenic broth (LB) medium at 37°C and stirred at 150 rpm. Dietzia sp. DQ12-45-1b was cultured in GPY (Glucose, 10 g/L; Peptone, 10 g/L; Yeast extract, 5 g/L) medium at 30°C and stirred at 150 rpm. All bacterial cultures were harvested at the exponential phase, centrifuged at 4°C and 3000 × g for 5 min, and washed three times with PBS (NaCl 0.137 mol/L, KCl 2.7 × 10⁻³ mol/L, Na2HPO4 4.3 × 10⁻³ mol/L, KH2PO4 1.4 × 10⁻³ mol/L, pH adjusted to 7.2) to remove the medium. The bacterial cells were then suspended in PBS to expected densities for further use.
For analysis of isotopically labeled cells, E. coli DH5α was cultured in M9 medium supplied with different proportions of 13C6-glucose (Kubryk et al., 2015). Cells were harvested at the exponential phase and prepared as described above.
Preparation of the Membrane Fractions
The inner membrane, outer membrane and cytoplasm were separated as previously described (Marchand et al., 2012) with a small modification. Briefly, E. coli DH5α cells were harvested from LB medium at the exponential phase by centrifugation at 4°C and 3000 × g for 5 min. Cells were then washed three times with PBS. Then, the cells were broken via bead-beating three times in 5 min intervals on ice, followed by centrifugation at 7500 × g for 15 min to remove the intact cells. The supernatants were collected and further ultracentrifuged at 150,000 × g for 60 min. After centrifugation, the supernatant was collected as the cytoplasmic sample. The pellets containing membrane fractions were resuspended in deionized water and purified by sucrose density gradient centrifugation (56 to 20% (w/v), 150000 × g, 2 h). The bands between 56 and 20% sucrose were collected and layered on a sucrose gradient (56, 53, 50, 47, 44, 41, 38, and 35%). After centrifugation at 200,000 × g for 42 h, two bands were detected. The upper and lower bands were collected as the inner and outer membrane fractions, respectively.
Surface Enhancement Using AgNPs
For enhancement, 2 μL of washed bacterial cells were mixed with 2 mL silver colloid. The mixture was allowed to stand for 15 min or centrifuged at different speeds for 5 min for conjunction of AgNPs and cells before SERS measurement. The morphology of AgNPs on cells was detected using TEM. Samples were fixed with isoprene glycol for 1 h before TEM detection. TEM images of the AgNPs were obtained using a JEM 2010 (JEOL, Munich, Germany) at an accelerating voltage of 200 kV.
To optimize the conditions for SERS enhancement, we chose five factors that might influence the effects of enhancement, including the centrifugal force, the AgNPs preparation method, the AgNPs concentration, the ionic strength of the solution used to suspend cells, and the cell density. Among the above factors, the concentration of silver colloid after preparation was referred to as 1×, and the colloid was diluted with deionized water to 0.5× or concentrated to 2× by centrifugation. The ionic strength of the solution used to suspend cells was adjusted with different NaCl concentrations. An orthogonal experiment, which is an important branch of mathematics statistics to determine how to collect data efficiently and simply (Chen and Ni, 2012), was designed to determine the optimal conditions (Table 1). The signal-to-noise ratio was calculated to estimate the effect of enhancement (Greek et al., 1995).
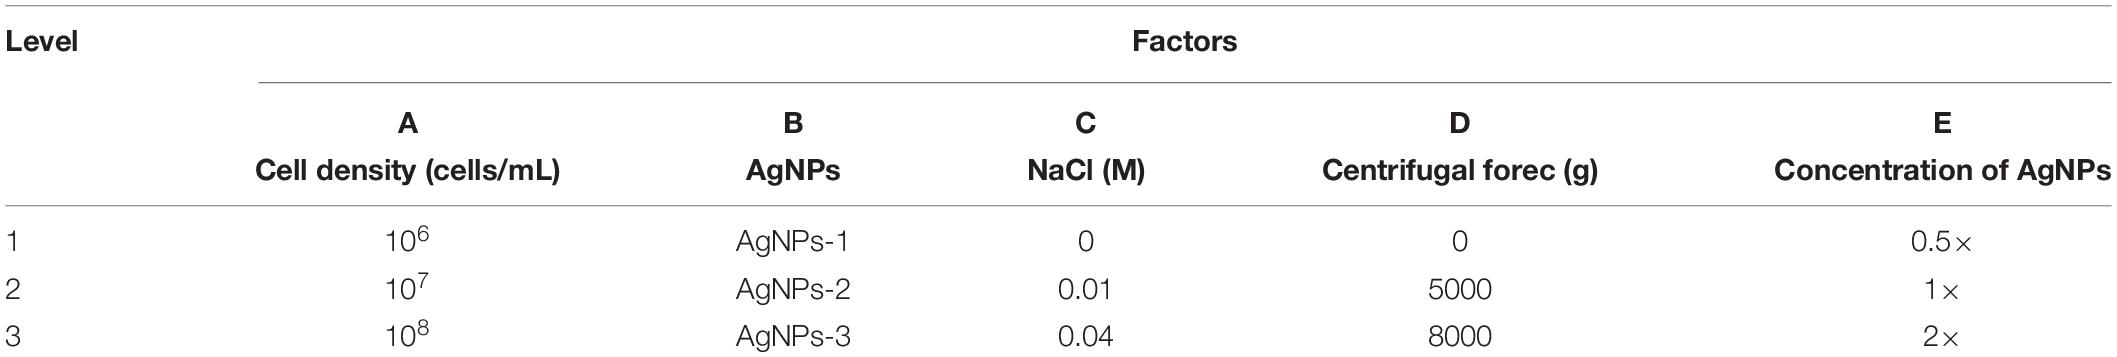
Table 1. Factors and levels for orthogonal experiments (35).
SERS Measurements
Before SERS measurement, glass slides were ultrasonically cleaned for 30 min in water, followed by another 30 min ultrasonic cleaning in ethanol. Then, the slides were submerged in 50% methanol solution for 2 h, and 2 mL trimethoxy(propyl) silane and 3 mL 25% ammonia solution were added dropwise, followed by stirring overnight. The slides were washed with ethanol three times and dried before use.
For SERS measurement of single cells, 2 μL AgNPs-cell mixture was added dropwise to a glass slide and air dried. All measurements were performed using a confocal Raman spectrometer (Renishaw, United Kingdom). The measurements were carried out with a 785 nm diode laser, and the laser beam was focused onto the sample with a 40× objective. The laser power was in the range of 0.2 to 6 mW, and the acquisition time was 10 s. The frequency stability and accuracy of the apparatus were checked by recording the Raman spectrum of silicon (520.5 cm–1). Three different cells were picked for testing of each sample. Spectra were acquired in a range of 600–1800 cm–1. Each Raman spectrum was the average of 15 successive scans obtained. SERS spectra were analyzed with WiRE 4.2 and WiRE Batch Converter software.
For enhancement of different cell fractions, samples were vacuum dried and mixed with 2 mL 1 × AgNPs-2, followed by centrifugation at 8000 × g for 5 min. The pellet was suspended in 200 μL supernatant. Two microliters of the suspension were added dropwise to a pretreated glass slide and air dried for further Raman measurement as described above.
Statistical Analysis
For each sample and test, at least three single cells were measured. Baseline correction and normalization of the spectra were done using the WiRE 4.2 software. Principal Component Analysis (PCA) was performed using Vegan package in R. The ggplot2 and scatterplot3d package in R software were used in our study to visualize the results.
Results
Optimizing AgNPs Preparation for SERS
We used four methods to prepare the AgNPs. As shown in Figure 1B, AgNPs-2 prepared by the fast dropwise addition of AgNO3 into hydroxylamine-hydrochloride solution had an average diameter of 45 ± 4 nm, which was the smallest diameter observed among the four methods. The average diameter of AgNPs-4, which were prepared by fast dropwise addition of hydroxylamine-hydrochloride into AgNO3 solution, was also significantly smaller than that of AgNPs-3 prepared by slow dropwise addition. These results suggest that fast dropwise addition and shortening of the reaction time can reduce the size of AgNPs. To test the stability of the AgNPs, all Ag colloids were stored at 4°C for 48 h, and their diameters and UV–Vis spectra were determined during the 48-h storage time. Compared with other AgNPs, AgNPs-2 exhibited the most stable particle sizes. The diameter of AgNPs-2 ranged from 45 ± 4 to 46 ± 3 nm over 48 h at 4°C (Figure 1B). The UV–Vis spectra of AgNPs-2 were also stable during the 48-h storage time at 4°C (Figure 1C). The results suggest that fast dropwise addition of AgNO3 into hydroxylamine-hydrochloride solution was the optimal method to prepare small and stable AgNPs.
Fresh AgNPs prepared using different methods were used to assess their effects on SERS. As shown in Figure 2, AgNPs prepared with different methods showed differences in SERS spectra of single E. coli cells. When cells were mixed with AgNPs-1 and AgNPs-2, which were prepared by adding AgNO3 dropwise into hydroxylamine-hydrochloride solution, the highest peak in the SERS spectra was at 732 nm–1. However, when using AgNPs-3 and AgNPs-4, the highest peak in the SERS spectra was at 1008 nm–1. In addition to the shift of the highest peak, when using AgNPs-1 and AgNPs-2, the number of peaks was much higher than when using AgNPs-3 and AgNPs-4. The results indicate that AgNPs generated by adding AgNO3 dropwise into hydroxylamine-hydrochloride solution were more favorable for SERS detection. Notably, significant differences were not found between fresh AgNPs-1 and AgNPs-2 or AgNPs-3 and AgNPs-4 (Figure 2), which suggested that the size of the nanoparticles played a weak role in enhancement of SERS signals.
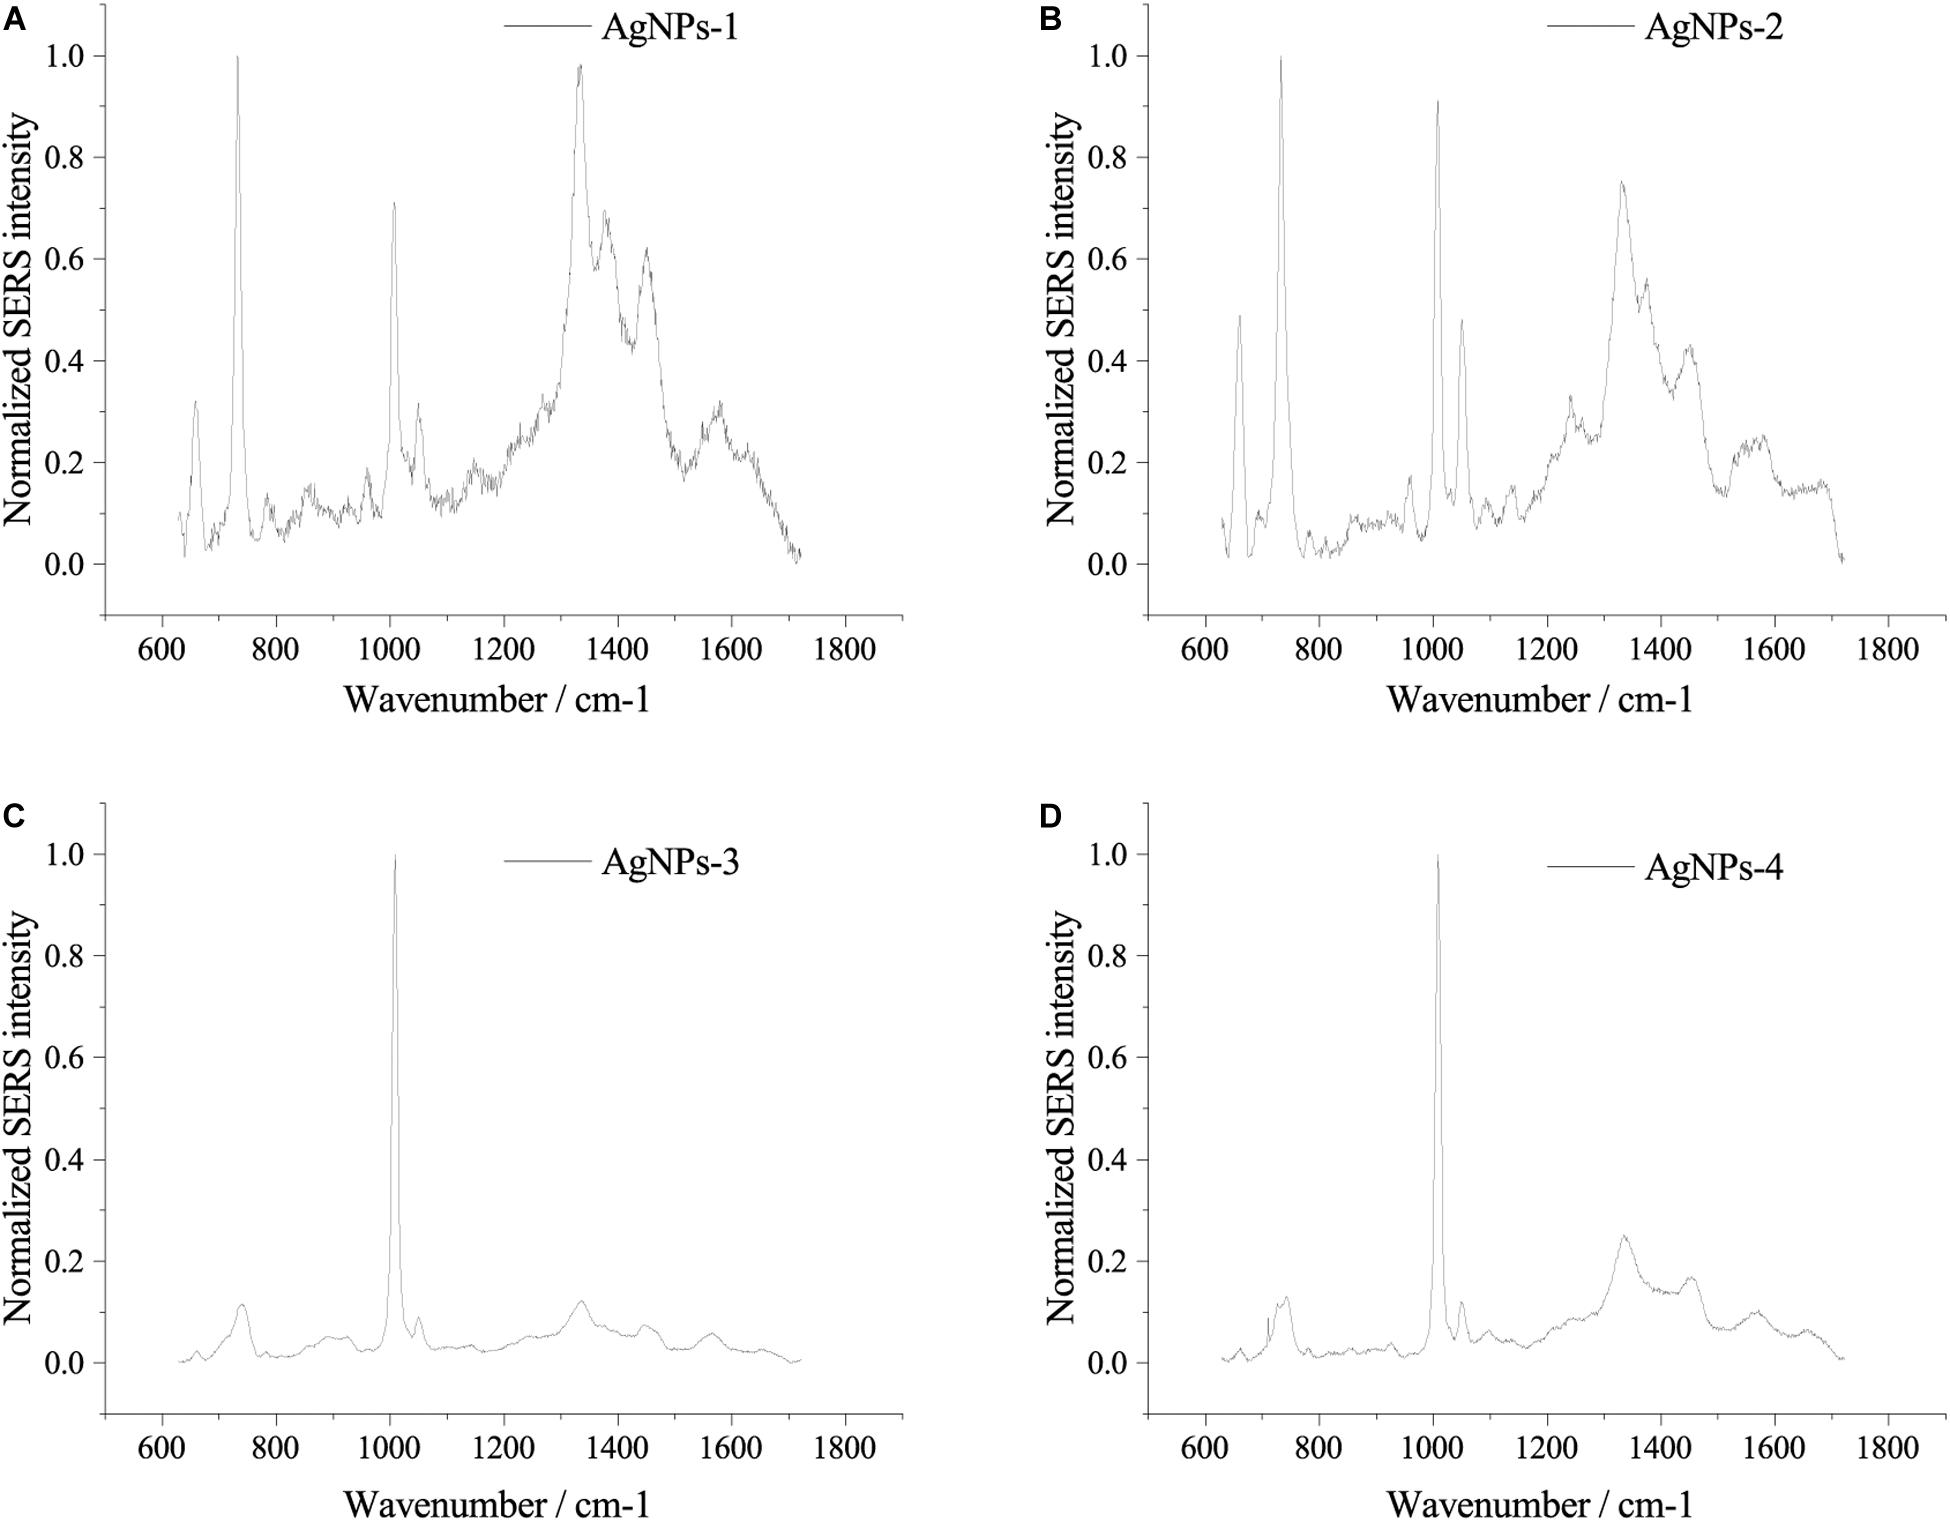
Figure 2. SERS spectra of single E. coli cells using different AgNPs. (A) AgNPs-1; (B) AgNPs-2; (C) AgNPs-3; and (D) AgNPs-4. For each sample and test, at least three single cells were measured.
Effects of Centrifugation on Enhancement of SERS Spectra
SERS allows identification of analytes in contact or very close to plasmonic nanostructures (Lombardi and Birke, 2009). Here, we used centrifugation to induce close contact between AgNPs and cells. After the cell pellets were washed with PBS three times, the cells were suspended in PBS and mixed with AgNPs-2. Cells and AgNPs were placed in contact by allowing the mixture to stand for 15 min or by centrifuging the mixture at different speeds. As shown in Figure 3A, different centrifugal rotational force led to large differences in the SERS spectra of single E. coli cells. When cells and AgNPs were mixed without centrifugation, only a broad peak at ∼1350 cm–1 was observed. After centrifugation, both the average SERS intensity and the number of peaks increased with increasing centrifugal force (Figure 3A). The highest peak in the SERS spectra was at 732 cm–1, followed by peaks at 1323 and 654 cm–1. To explain the effects of centrifugation on SERS signals, transmission electron microscopy (TEM) was performed. After centrifugation, the surface of the single cell was densely coated with AgNPs (Figure 3B). In contrast, without centrifugation, only a few AgNPs were in contact with the cell surface (Figure 3C). More AgNPs closely attached to the cells might explain the better enhancement after centrifugation.
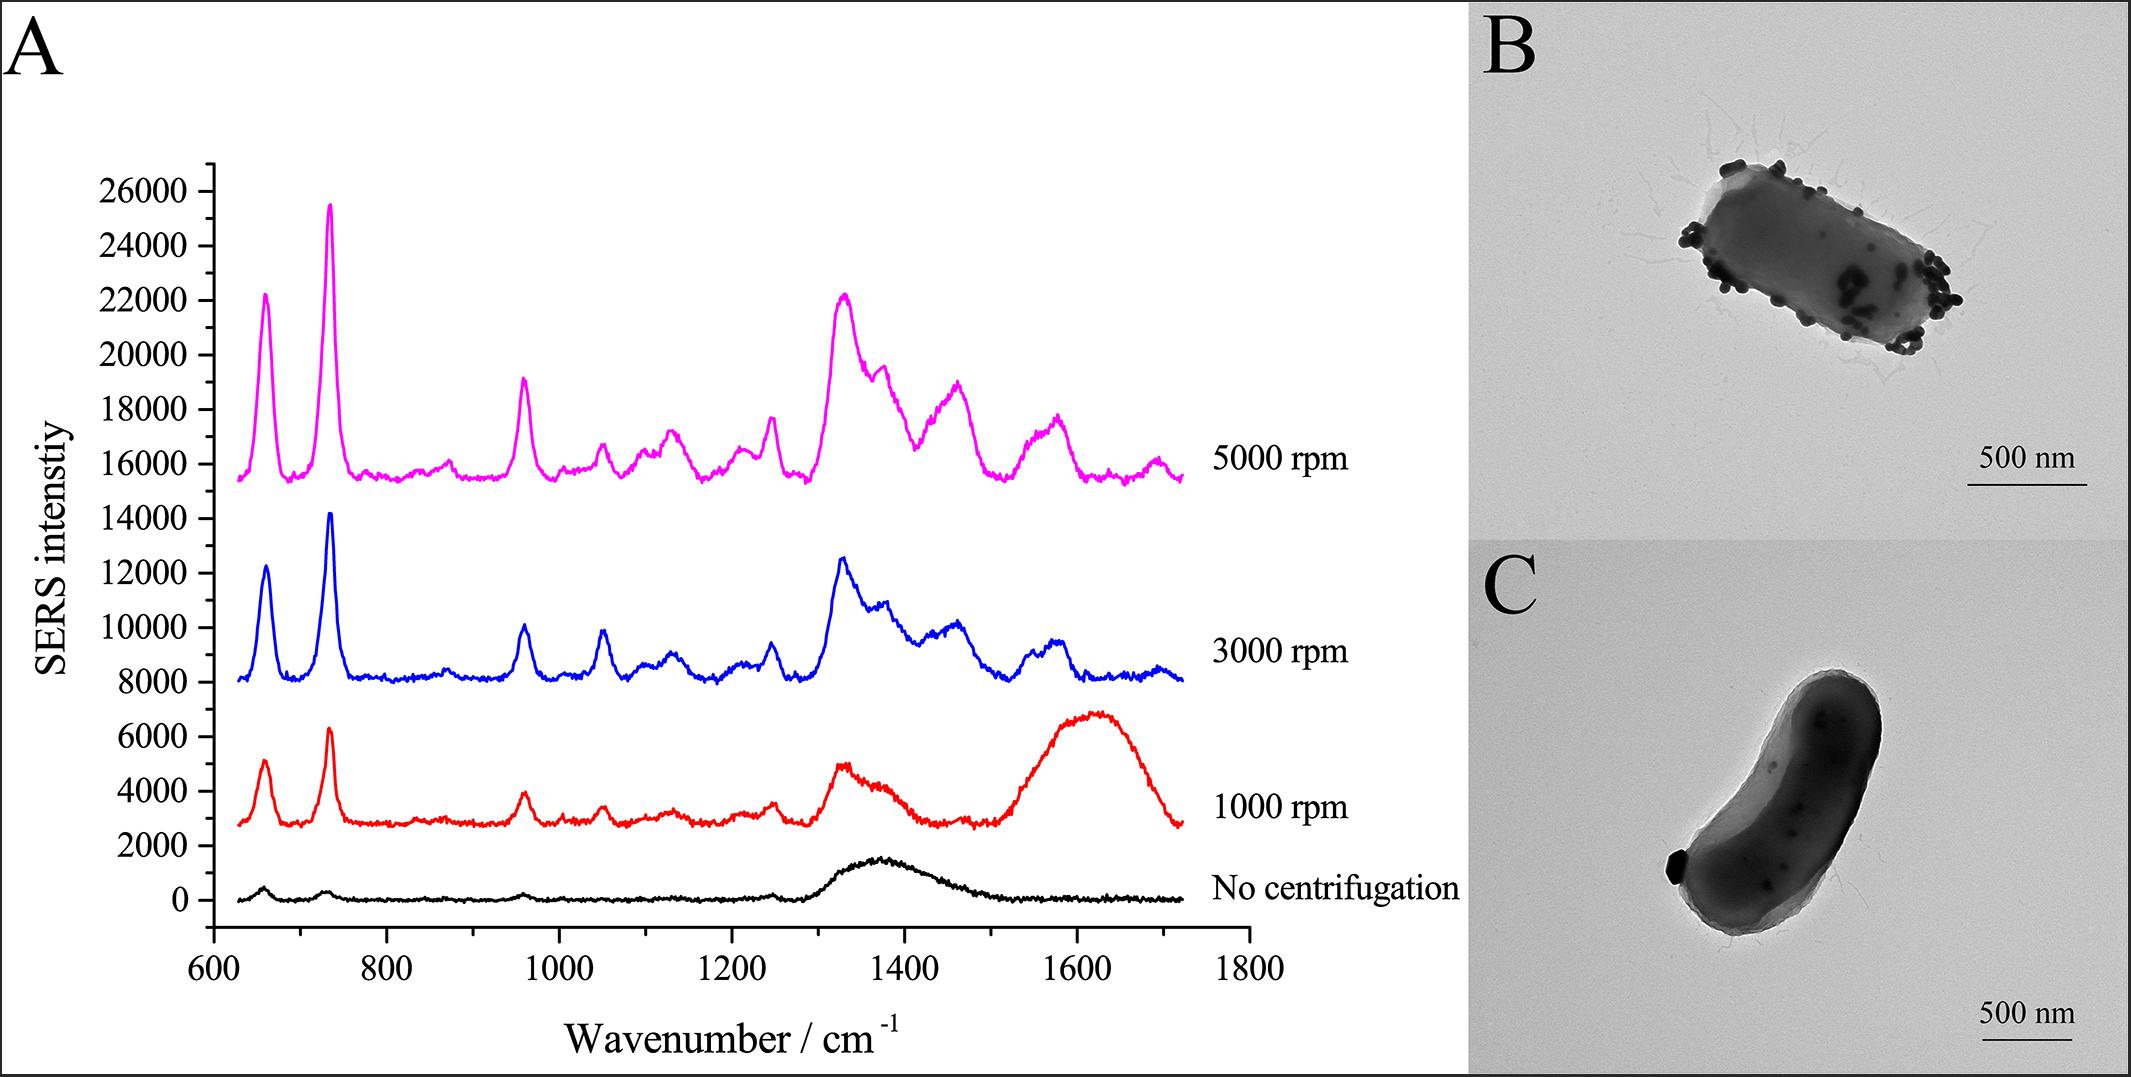
Figure 3. SERS spectra of single E. coli cells after centrifugation treatment. (A) Comparison of SERS spectra of single E. coli cells after centrifugation with different centrifugal forces; (B) TEM micrograph of E. coli cell with AgNPs after centrifugation at 3000 rpm; (C) TEM micrograph of E. coli cell with AgNPs without centrifugation.
Optimal Enhancing Method for SERS
To optimize the enhancement method for SERS, we chose the centrifugal force, method for preparing AgNPs, concentration of AgNPs, ionic strength of the solution used to suspend cells, and cell density as the impact factors, and performed orthogonal experiments. As shown in Table 2, the optimal combination of the factors was A3B2C3D3E1, under which the highest signal-to-noise ratio would be obtained. To evaluate the reproducibility of the optimal enhancement method, we numbered all cells in the microscopy field and selected cells according to a random number table without bias. All SERS spectra from different single cells showed great similarities (Figure 4). The spectra exhibited characteristic peaks at 654, 732, 958, 1008, 1244, and 1323 cm–1. Among all the peaks detected, the relative intensity of the peaks at 1008, 1244, and 1323 cm–1 showed minor differences. It has been reported that the 1008 cm–1 band of pyridine (ring breathing mode), 1244 cm–1 band of C–C stretching mode of lipids and proteins or C–N stretching of proteins, and 1323 cm–1 band of guanine may have minor differences at different sites of the cell (Stone et al., 2002; Ruiz-Chica et al., 2004; Stiles et al., 2008), which may cause this minor difference in their Raman spectral peak.
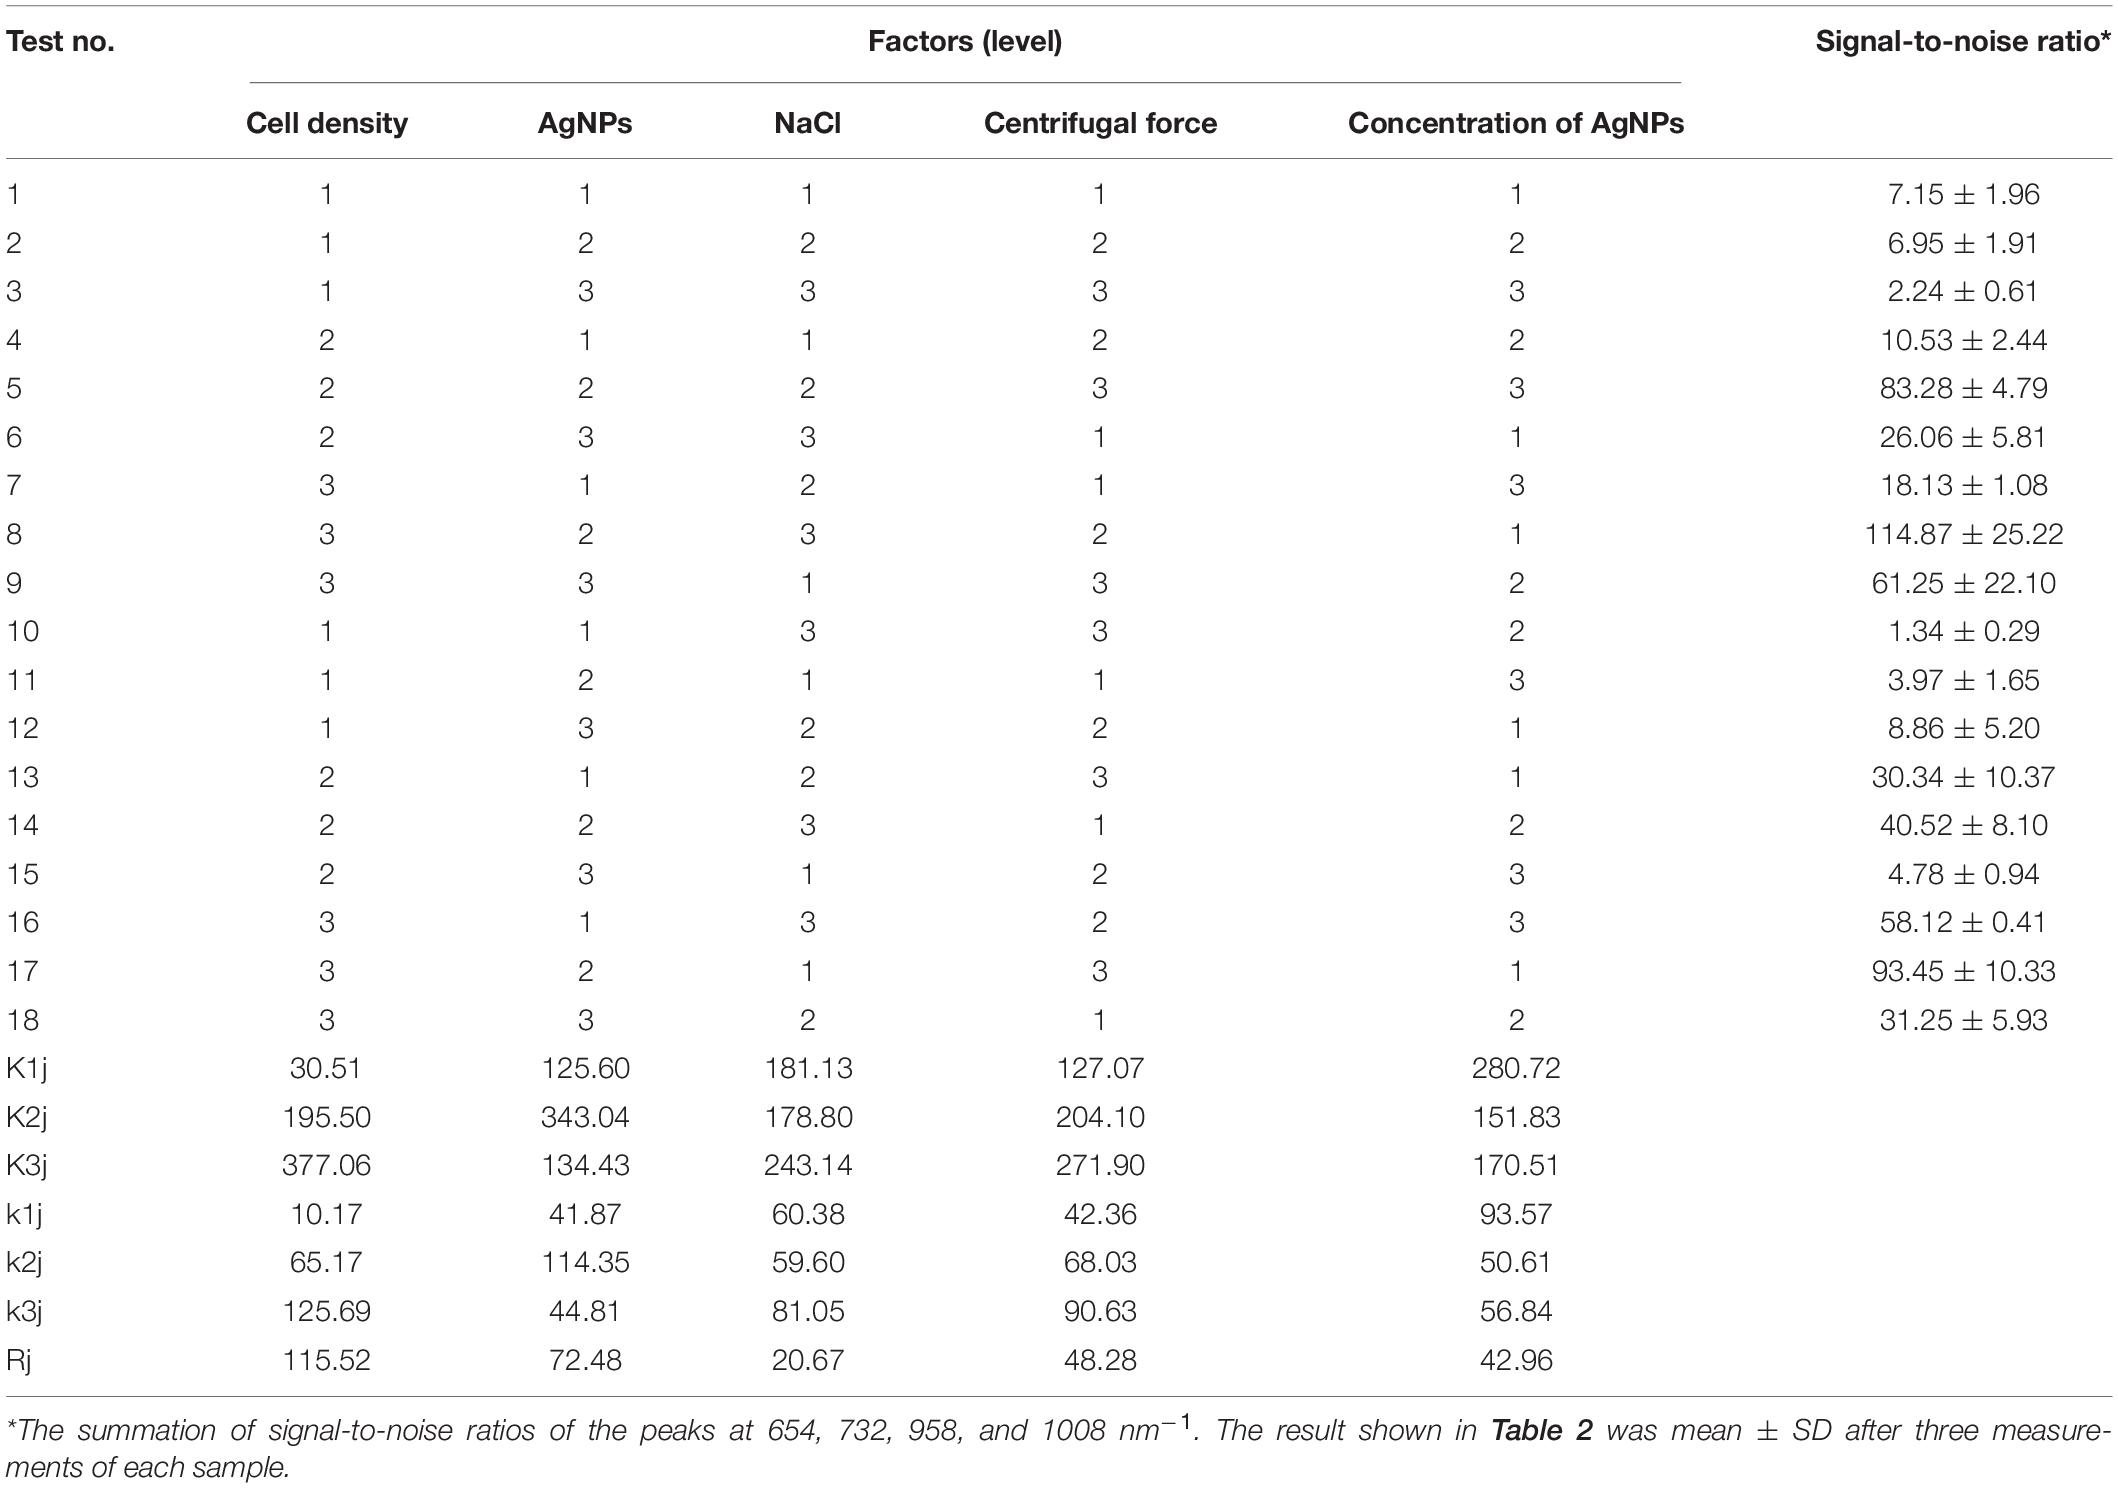
Table 2. Orthogonal experiment design, results, and analyses.
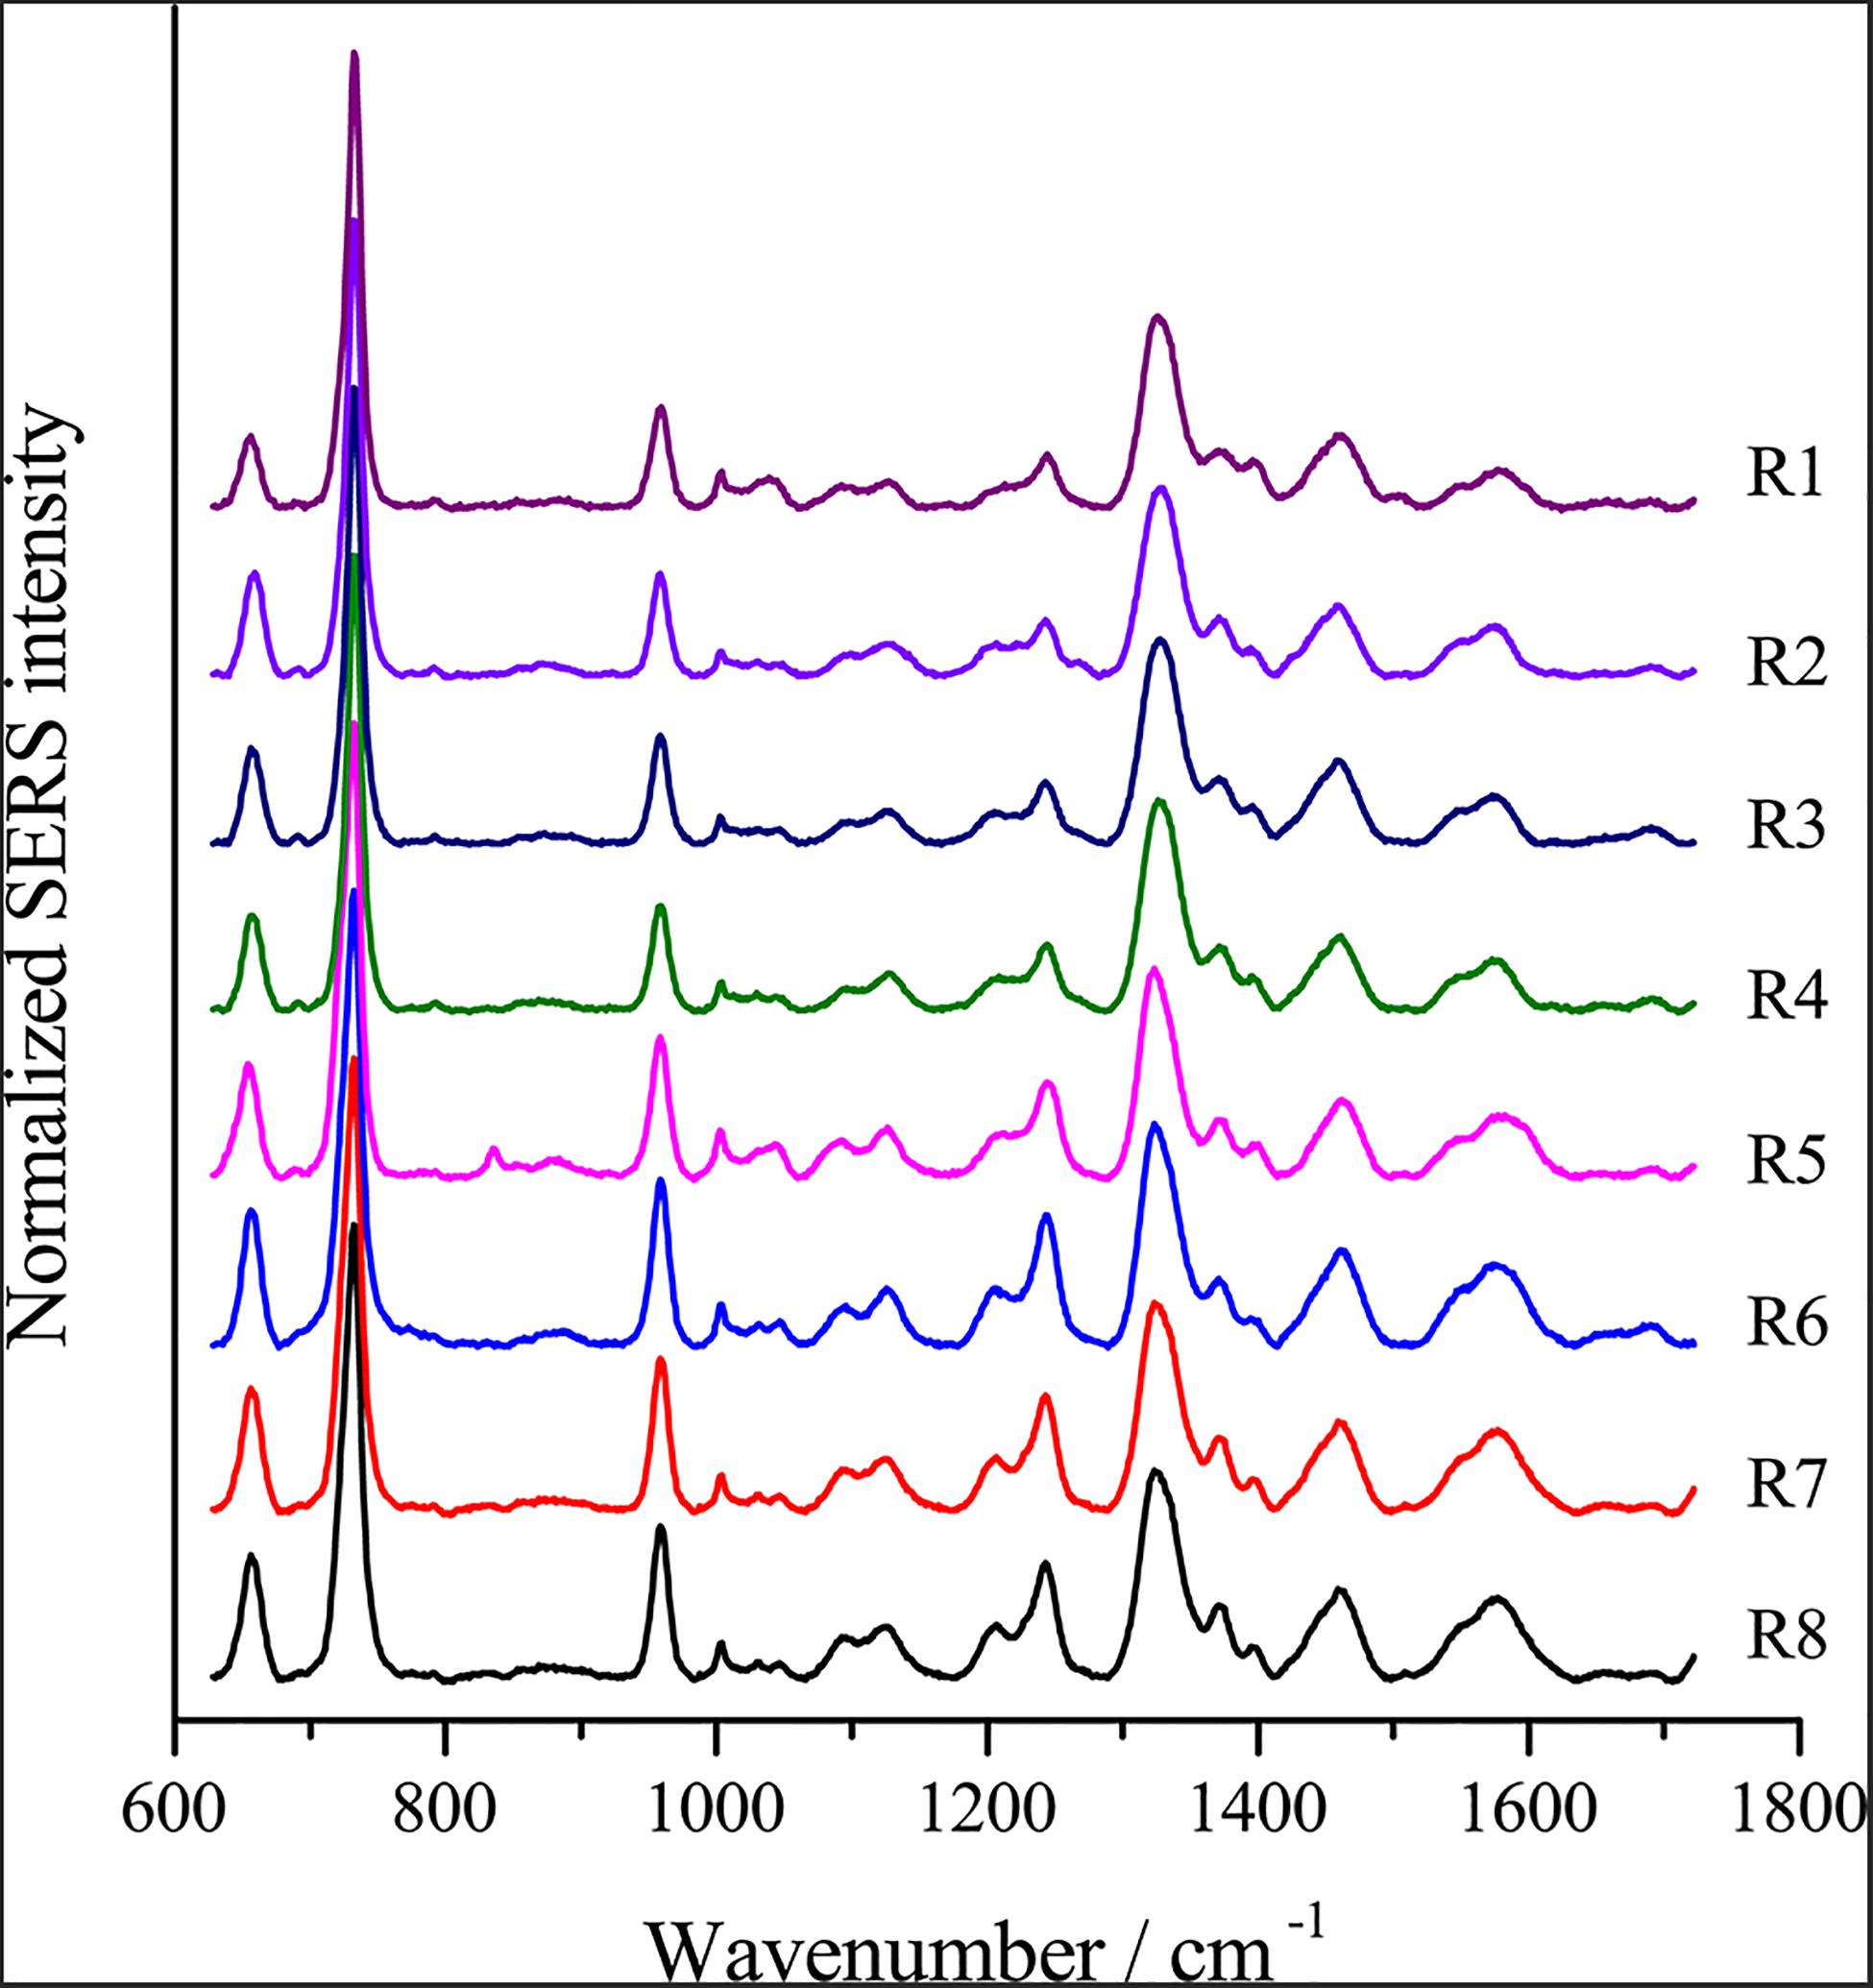
Figure 4. Reproducible single-cell SERS spectra of different E. coli cells.
The Origins of SERS Spectra of Single E. coli Cells
Van Duyne and Tian, Z.-Q. have proved that the electromagnetic field strength gradually decreased, and the SERS signal strength also gradually decreased when the distance to the surface of nanoparticles was further (Sherry et al., 2006; Tian et al., 2012), we assumed that the SERS signals of single E. coli cells might be attributable to the chemical composition of the cell envelope. To investigate whether the SERS spectra arise from the cytoplasm, inner membrane or outer membrane of E. coli cells, we separated the cell fractions using ultracentrifugation. Then, we detected the SERS spectrum of each component. As shown in Figure 5, most peaks in the SERS spectra of whole E. coli cells were found in the spectra of the outer membrane fraction, including peaks at 654, 732, 958, 1008, 1096, 1127, 1244, 1323, 1371, 1462, and 1577 cm–1. The results support the notion that the SERS spectrum of single cells arises from the cell envelope. Notably, although most peaks were found in the outer membrane spectrum, the peaks at 732 and 1323 cm–1 were also found in the spectra of both the inner membrane and cytoplasm, suggesting that the corresponding molecules are distributed throughout the cell.

Figure 5. Comparison of the SERS spectra of single E. coli cells and different cellular components. The colored squares under the wavenumbers indicate the possible origins of the peaks in the spectrum excited from intact E. coli cells.
SERS Spectra of Isotopically Labeled Single E. coli Cells
Surface-enhanced Raman scattering is a popular method to study the uptake of isotopes into cells. Here, we assessed the relationship between redshifts and the proportion of 13C incorporation into the biomass of cells using the optimal SERS method. E. coli DH5α was cultivated with different proportions of 13C6-glucose as the sole carbon source. The peaks at 660, 734, and 957 cm–1 exhibited clear redshifts of up to ∼6, 10, and 10 cm–1, respectively, in cells grown with fully labeled 13C glucose compared with cells grown with 12C glucose (Figure 6A). Moreover, linear correlations were observed between the redshift of the peaks at 660, 735, and 957 cm–1 and the proportion of 13C-labeling of the cell (Figure 6B), which suggests that the peaks at these wavenumbers were good indicators to estimate the ratio of isotope incorporation into the cells.
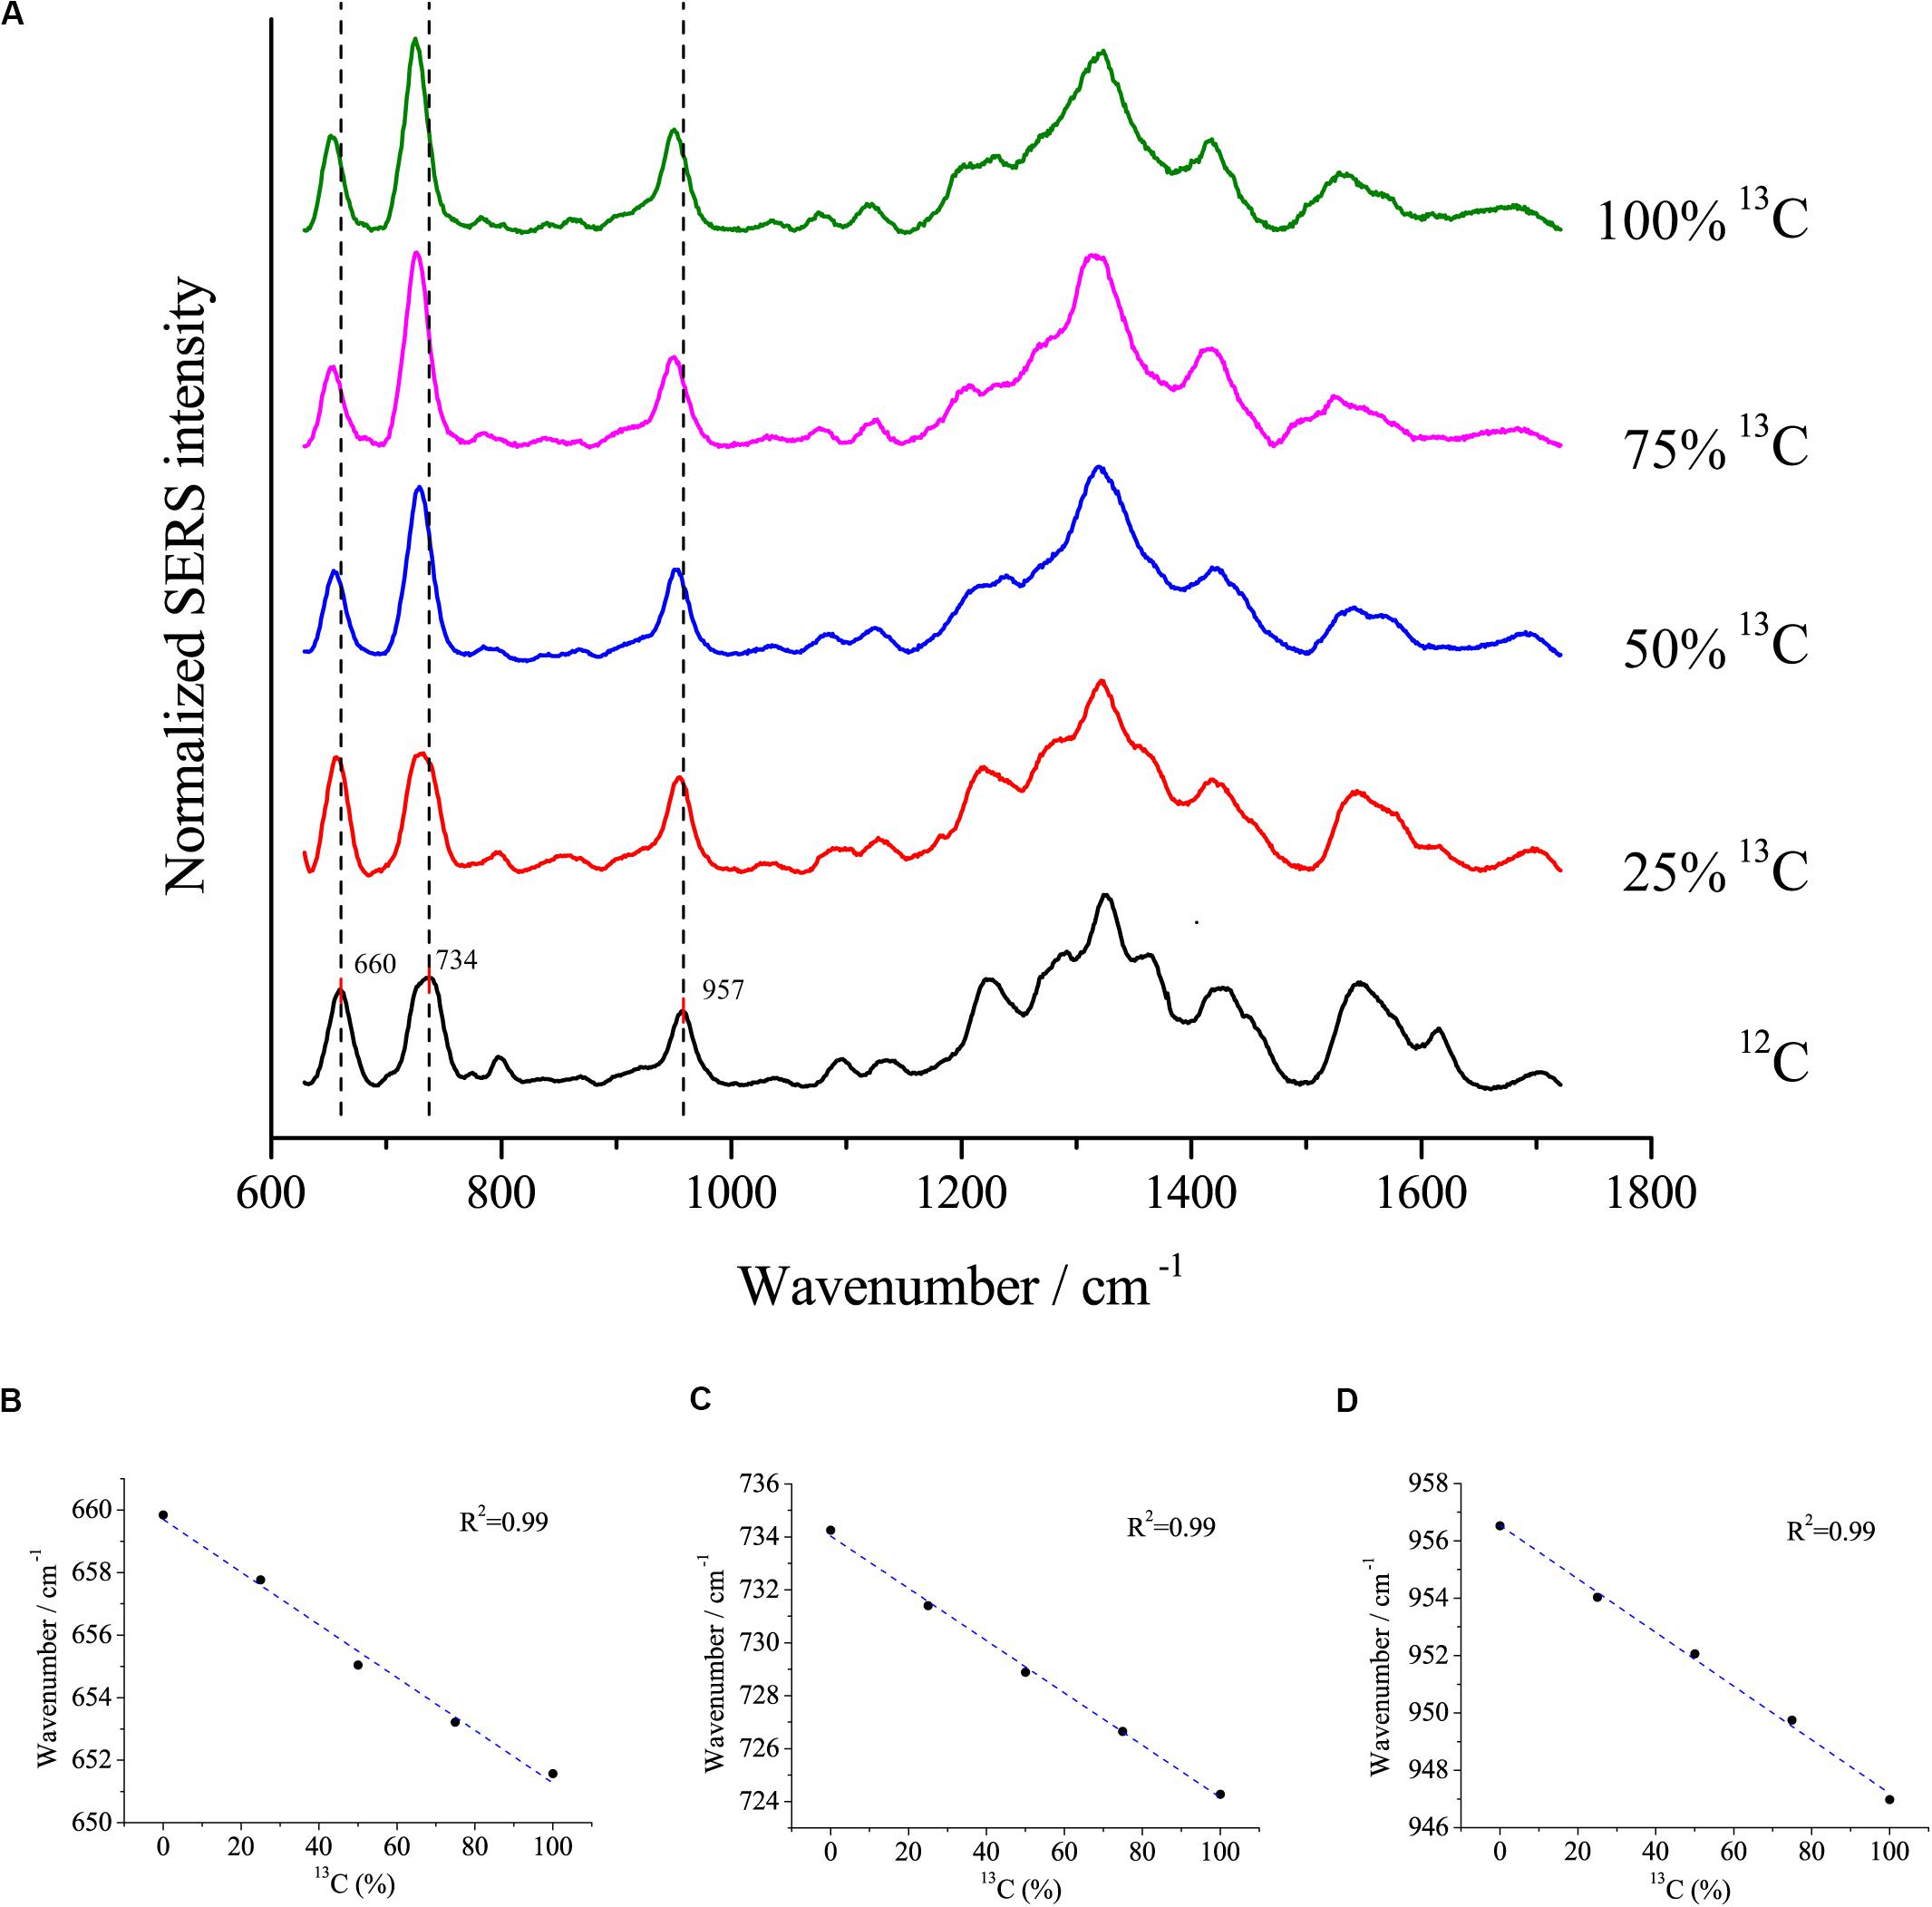
Figure 6. (A) SERS spectra of single E. coli cells cultivated in different proportions of 13C labeled glucose and the linear relationship between the redshifts at (B) 660 cm– 1, (C) 734 cm– 1, and (D) 957 cm– 1 and the proportions of 13C labeled glucose.
Discrimination of Bacteria Using SERS
To test whether SERS using the optimal method could discriminate different bacterial species, we chose three bacterial strains from three distinct phyla, i.e., E. coli DH5α from Proteobacteria, Bacillus sp. BSw800 from Firmicutes, and Dietzia sp. DQ12-45-1b from Actinobacteria, for SERS detection. As shown in Figure 7A, each bacterial species presented typical SERS spectra. E. coli DH5α and Bacillus sp. BSw800 showed similar SERS spectra in the region between 600 and 1000 cm–1. All three species exhibited distinct spectra between 1100 and 1600 cm–1, suggesting significant differences in the biochemical composition of these organisms. PCA showed that the SERS spectra of E. coli DH5α, Bacillus sp. BSw800 and Dietzia sp. DQ12-45-1b were grouped into distinct clusters (Figure 7B). We also compared the single-cell SERS spectra of two strains from Pseudomonas aeruginosa and Pseudomonas geniculate and found the spectra of these two strains were much different (Supplementary Figure S1), which indicated that the optimal SERS method provided sufficient sensitivity to distinguish bacterial species from the same genus. It was notable that the cell growth state would affect the Raman signals greatly. We compared the single-cell SERS spectra of the strain Dietzia sp. DQ12-45-1b at different growth states (i.e., the early exponential phase and later exponential phase) and found that the spectra of cells at different stages were different (Supplementary Figure S2A). The results indicated that SERS spectra could distinguish the cells of the same strain at different growth stages. Then we compared the SERS spectra from cells of the same strain at different growth stages with SERS spectra from other strains. Based on the PCA and hierarchical clustering results, we found that SERS spectra could be discriminated by phylogeny firstly, and then by growth stages (Supplementary Figure S2B). Overall, our results suggested that cells from different growth stages would influence the SERS spectra, but they would not influence the discrimination of strains of different species.
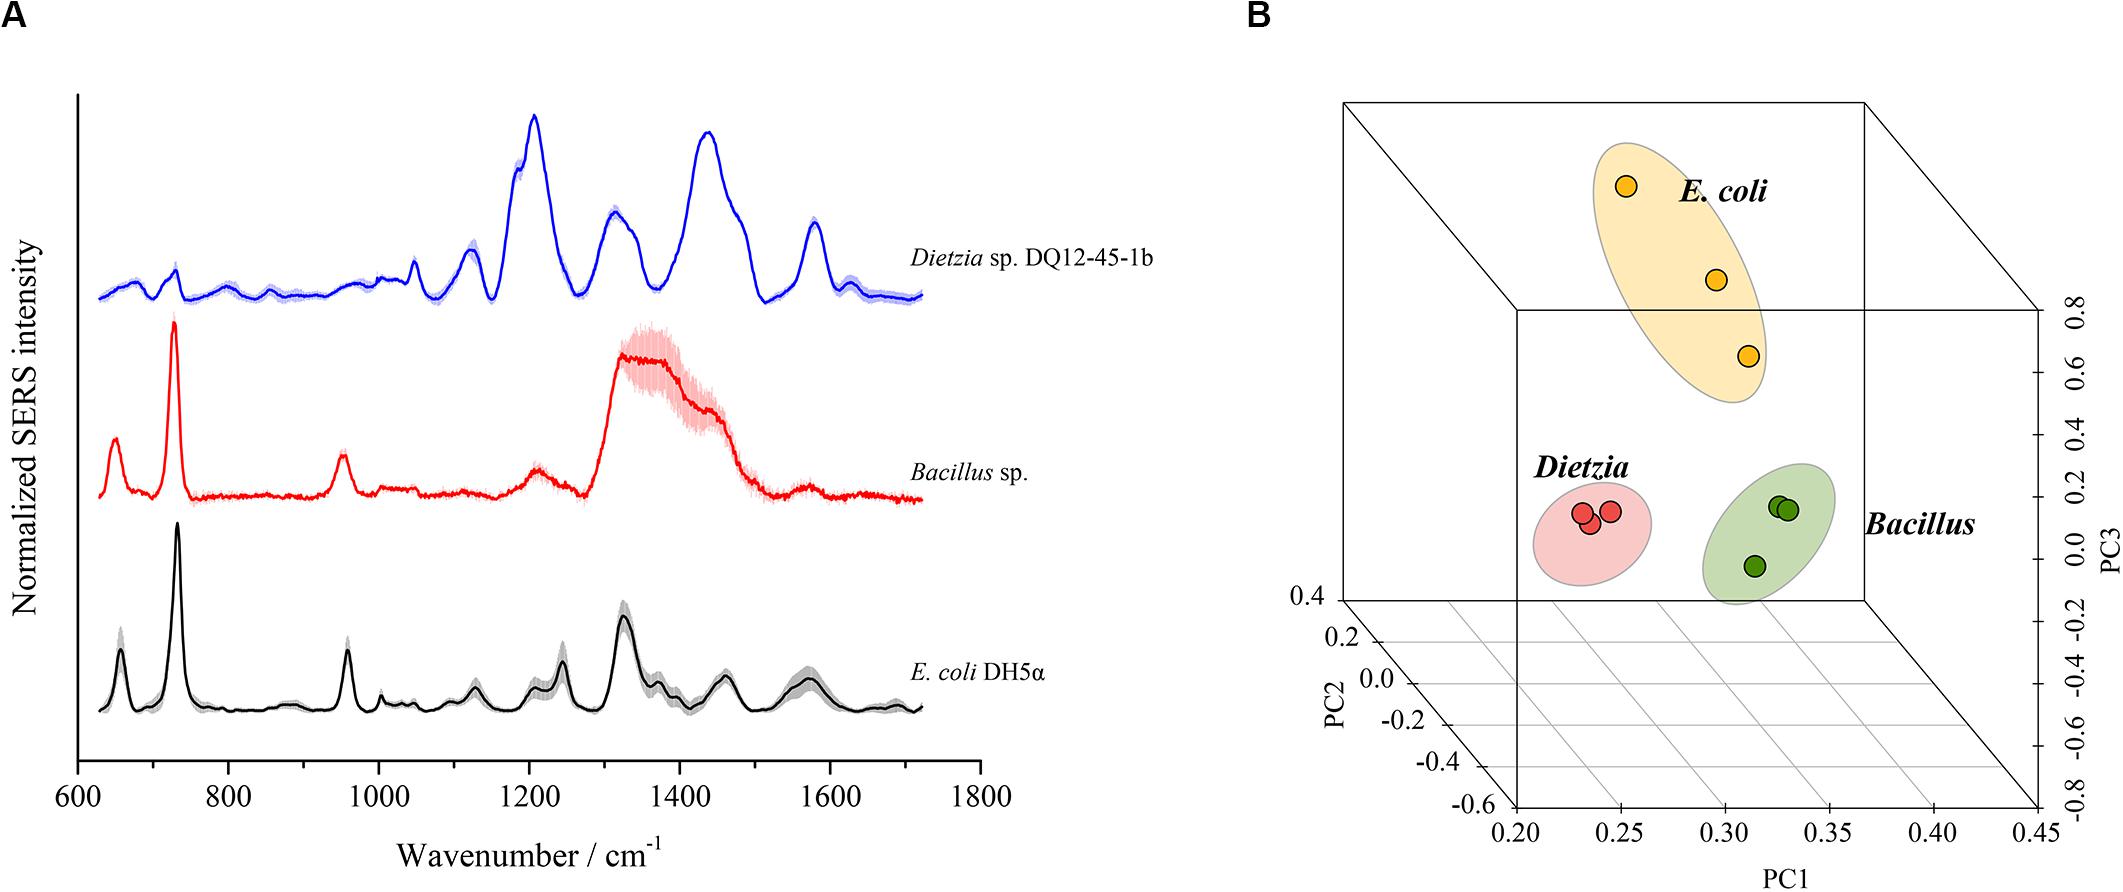
Figure 7. Discrimination of different bacterial species using SERS spectra. (A) Characteristic SERS spectra of each species. (B) PCA plot based on the SERS spectra of each species.
Discussion
In this work, we optimized the conditions for SERS and found that centrifugation and the AgNPs preparation method were crucial for sensitive and reproducible single cell SERS. The origin of the SERS signals was mainly the bacterial outer membrane. The optimized SERS method was used to discriminate bacterial species and indicate the incorporation of isotopes.
Although single cell SERS has been reported for diverse applications in discrimination of bacterial species (Jarvis and Goodacre, 2004; Berus et al., 2020) and detection of pathogens (Boardman et al., 2016), how to improve the reproducibility and sensitivity is still an important issue. The morphology and stability of nanoparticles affects the reproducibility and sensitivity of SERS. A non-homogenous particle size and uncontrollable aggregation process can result in large spectral variations and low reproducibility (Wang P. X. et al., 2016). The shape and size of nanoparticles can be controlled by the reaction conditions (Liu et al., 2013; Zong et al., 2014). We found that for silver colloid preparation, the fast dropwise addition method led to formation of smaller and more stable AgNPs than the slow dropwise addition method, suggesting that a fast, reductive reaction favors better performance of nanoparticles. Based on the Ostwald ripening process, in the fast dropwise addition method, there is not sufficient time for growth and aggregation of the nanoparticles (Bastus et al., 2011; Yang et al., 2014). Comparing the effects of different AgNPs on the enhancement of SERS signals, SERS spectra obtained with fresh AgNPs-1 and AgNPs-2, which were prepared by fast dropwise addition of AgNO3 into reductant, exhibited more peaks than those obtained with AgNPs-3 or AgNPs-4. The major difference was that when AgNPs-1 and AgNPs-2 were prepared, the reductant was in excess. The excess reductant might contribute to sufficient reduction of AgNO3. Considering the stability and number of peaks, AgNPs prepared by fast dropwise addition of AgNO3 into reductant were better for enhancement of SERS signals.
Several methods can be used to coat the cells with nanoparticles in order to form so-called hotspots and obtain ideal enhancement. Among these methods, in situ synthesis of silver nanoparticles on bacterial cells (Zhou et al., 2014; Gao et al., 2017) and direct incubation of bacterial cells with metal nanoparticles (Willets, 2009) are frequently used. In situ synthesis of Ag colloid ensures the integrity of bacterial cells and generates SERS signals with high sensitivity and specificity. However, the enhancement effect of this method depends on the zeta potential of the cell wall, which is influenced by diverse factors, such as the culture medium (Zhou et al., 2014) and surface structure of distinct bacteria (Wang P. X. et al., 2016). Incubation of cells with AgNPs provides a simple method for enhancement. Although widely used for detection and discrimination of bacterial species (Kahraman et al., 2011; Yang et al., 2016), this method also has disadvantages, such as the long time necessary for incubation before Raman measurement.
The long cell-AgNPs incubation time necessary to obtain ideal enhancement may be due to difficulties in depositing the AgNPs on the cell surface. In SERS, Raman signals of the target molecules are enhanced when they are very close to metal nanoparticles (Panneerselvam et al., 2018). Electromagnetic enhancement and chemical enhancement are thought to be the main mechanisms in SERS (Li et al., 2012b). Electromagnetic enhancement, in which surface plasmon is excited by incident light in the far field and by the Raman scattered oscillating dipole in the near field, predominantly contributes to SERS enhancement. Its effect is restricted in a field less than 5 nm (Panneerselvam et al., 2018). Therefore, shortening the distance between the metal nanoparticles and target molecules is essential for successful enhancement. For single cell enhancement, a strong driving force must be applied to deposit the AgNPs on the bacterial cell surface and form close contact between the cells and AgNPs. In this study, we used centrifugation to drive the deposition of AgNPs. This method is suitable for both Gram-negative bacteria (E. coli from Proteobacteria), low GC-content Gram-positive bacteria (Bacillus from Firmicutes) and high GC-content Gram-positive bacteria (Dietzia from Actinobacteria), which suggests that it may be used generally for detecting diverse bacterial species.
Microbial SERS signals are mainly attributed to flavins (Zeiri et al., 2004), peptidoglycan (Jarvis and Goodacre, 2004), and adenine-derived compounds (Kubryk et al., 2016). The distinct chemical composition of different bacterial species is believed to be the basis of bacterial species discrimination by SERS signals (Hassoun et al., 2017; Genova et al., 2018). However, the correlation between the wavenumber of the peaks and the corresponding compounds is still unclear. Leaking of adenine-derived compounds on the cell surface is thought to be the main origin of the characteristic peak at approximately 730 nm–1 in SERS spectra (Kubryk et al., 2016). In this study, we found that the peak at 732 nm–1, which is believed to represent compounds such as adenine-derived compounds (Kubryk et al., 2016), could be detected in SERS spectra of the cytoplasm, inner membrane, outer membrane, and intact cells. Surprisingly, the normalized intensity of this peak was higher in spectra of the outer membrane than in those of the cytoplasm, suggesting another possible origin among the outer membrane components. In the SERS spectra of single E. coli cells, the major peaks at 654, 958, 1008, and 1323 nm–1 were only found in spectra of the outer membrane. These results suggest that the discrimination of bacterial species by SERS is based on the distinct composition of the outer membrane. Further SERS detection of single E. coli, Bacillus, and Dietzia cells also support this point. The SERS spectra of Bacillus and E. coli shared peaks at 654, 732, and 958 nm–1 and showed many similarities. In contrast, the SERS spectra of Dietzia were much more different. This result can be explained by the distinct chemical composition of the Dietzia cell outer membrane. The cell wall of Dietzia and related species differs in composition from other Gram-positive and Gram-negative bacteria (Daffe and Marrakchi, 2019) in that an arabinogalactan layer is covalently linked to the peptidoglycan layer, and a special outer membrane consisting of mycolic acids is present. The distinct composition of the Dietzia cell envelope results in SERS spectra that are distinct from those of the other two species.
Conclusion
In this study, we optimized the enhancement conditions and investigated the possible origins of SERS signals. The results indicated that fast dropwise addition of AgNO3 into hydroxylamine-hydrochloride solution was the optimal method to prepare small and stable AgNPs. We also found that fast reaction centrifuging the cell-AgNPs mixture could significantly improve the SERS signals. Finally, the improved method could generate sensitive and reproducible SERS spectra which primarily arose from the outer membrane. Our work provides an improved method for generating sensitive and reproducible SERS spectra.
Data Availability Statement
The raw data supporting the conclusions of this article will be made available by the authors, without undue reservation.
Author Contributions
YN and YY designed this study and wrote the manuscript. YY and LA finished the experiments and collected the data. X-LW, Y-QT, and ZX revised the manuscript critically for important intellectual content. All authors read and approved the final manuscript.
Funding
This work was supported by the National Key R&D Program of China (2018YFA0902100 and 2018YFA0902103), the National Natural Science Foundation of China (31770107, 31770118, and 31770120), and the National Basic Research Program of China (“973” Program, 2014CB846002).
Conflict of Interest
The authors declare that the research was conducted in the absence of any commercial or financial relationships that could be construed as a potential conflict of interest.
Supplementary Material
The Supplementary Material for this article can be found online at: https://www.frontiersin.org/articles/10.3389/fbioe.2020.573777/full#supplementary-material
References
Amann, R., and Fuchs, B. M. (2008). Single-cell identification in microbial communities by improved fluorescence in situ hybridization techniques. Nat. Rev. Microbiol. 6, 339–348. doi: 10.1038/nrmicro1888
Aw, T. G., and Rose, J. B. (2012). Detection of pathogens in water: from phylochips to qPCR to pyrosequencing. Curr. Opin. Biotechnol. 23, 422–430. doi: 10.1016/j.copbio.2011.11.016
Bastus, N. G., Comenge, J., and Puntes, V. (2011). Kinetically controlled seeded growth synthesis of citrate-stabilized gold nanoparticles of up to 200 nm: size focusing versus ostwald ripening. Langmuir 27, 11098–11105. doi: 10.1021/la201938u
Berus, S., Witkowska, E., Nicinski, K., Sadowy, E., Puzia, W., Ronkiewicz, P., et al. (2020). Surface-enhanced Raman scattering as a discrimination method of Streptococcus spp. and alternative approach for identifying capsular types of S. pneumoniae isolates. Spectrochim. Acta A 233:118088. doi: 10.1016/j.saa.2020.118088
Boardman, A. K., Wong, W. S., Premasiri, W. R., Ziegler, L. D., Lee, J. C., Miljkovic, M., et al. (2016). Rapid detection of bacteria from blood with surface-enhanced raman spectroscopy. Anal. Chem. 88, 8026–8035. doi: 10.1021/acs.analchem.6b01273
Bodelon, G., Montes-Garcia, V., Lopez-Puente, V., Hill, E. H., Hamon, C., Sanz-Ortiz, M. N., et al. (2016). Detection and imaging of quorum sensing in Pseudomonas aeruginosa biofilm communities by surface-enhanced resonance Raman scattering. Nat. Mater. 15, 1203–1211. doi: 10.1038/Nmat4720
Chen, Q. G., and Ni, S. H. (2012). Orthogonal experiment design and analysis on ABS power in SLS. Adv. Mater. Res. 562–564, 660–663. doi: 10.4028/www.scientific.net/AMR.562-564.660
Daffe, M., and Marrakchi, H. (2019). Unraveling the structure of the mycobacterial envelope. Microbiol. Spectr. 7:GPP3-0027-2018, doi: 10.1128/microbiolspec.GPP3-0027-2018
Davey, H. M., and Kell, D. B. (1996). Flow cytometry and cell sorting of heterogeneous microbial populations: the importance of single-cell analyses. Microbiol. Rev. 60, 641–696. doi: 10.1128/MMBR.60.4.641-696.1996
DeAngelis, K. M., Wu, C. H., Beller, H. R., Brodie, E. L., Chakraborty, R., DeSantis, T. Z., et al. (2011). PCR amplification-independent methods for detection of microbial communities by the high-density microarray PhyloChip. Appl. Environ. Microbiol. 77, 6313–6322. doi: 10.1128/AEM.05262-11
Deckert-Gaudig, T., and Deckert, V. (2011). Nanoscale structural analysis using tip-enhanced Raman spectroscopy. Curr. Opin. Chem. Biol. 15, 719–724. doi: 10.1016/j.cbpa.2011.06.020
Fernando, E. Y., Mcllroy, S. J., Nierychlo, M., Herbst, F. A., Petriglieri, F., Schmid, M. C., et al. (2019). Resolving the individual contribution of key microbial populations to enhanced biological phosphorus removal with Raman-FISH. ISME J. 13, 1933–1946. doi: 10.1038/s41396-019-0399-7
Fleischmann, M., Hendra, P. J., and Mcquillan, A. J. (1974). Raman-spectra of pyridine adsorbed at a silver electrode. Chem. Phys. Lett. 26, 163–166. doi: 10.1016/0009-2614(74)85388-1
Gao, W. C., Li, B., Yao, R. Z., Li, Z. P., Wang, X. W., Dong, X. L., et al. (2017). Intuitive label-free SERS detection of bacteria using aptamer-based in situ silver nanoparticles synthesis. Anal. Chem. 89, 9836–9842. doi: 10.1021/acs.analchem.7b01813
Genova, E., Pelin, M., Decorti, G., Stocco, G., Sergo, V., Ventura, A., et al. (2018). SERS of cells: what can we learn from cell lysates? Anal. Chim. Acta 1005, 93–100. doi: 10.1016/j.aca.2017.12.002
Greek, L. S., Schulze, H. G., Blades, M. W., Bree, A. V., Gorzalka, B. B., and Turner, R. F. B. (1995). Snr enhancement and deconvolution of Raman-spectra using a 2-point entropy regularization method. Appl. Spectrosc. 49, 425–431. doi: 10.1366/0003702953964246
Hassoun, M., Schie, I. W., Tolstik, T., Stanca, S. E., Krafft, C., and Popp, J. (2017). Surface-enhanced Raman spectroscopy of cell lysates mixed with silver nanoparticles for tumor classification. Beilstein J. Nanotech. 8, 1183–1190. doi: 10.3762/bjnano.8.120
He, Z., Gentry, T. J., Schadt, C. W., Wu, L., Liebich, J., Chong, S. C., et al. (2007). GeoChip: a comprehensive microarray for investigating biogeochemical, ecological and environmental processes. ISME J. 1, 67–77. doi: 10.1038/ismej.2007.2
Huang, W. E., Li, M. Q., Jarvis, R. M., Goodacre, R., and Banwart, S. A. (2010). Shining light on the microbial world: the application of Raman microspectroscopy. Adv. Appl. Microbiol. 70, 153–186. doi: 10.1016/S0065-2164(10)70005-8
Jarvis, R. M., and Goodacre, R. (2004). Discrimination of bacteria using surface-enhanced Raman spectroscopy. Anal. Chem. 76, 40–47. doi: 10.1021/ac034689c
Kahraman, M., Keseroglu, K., and Culha, M. (2011). On sample preparation for surface-enhanced Raman scattering (SERS) of bacteria and the source of spectral features of the spectra. Appl. Spectrosc. 65, 500–506. doi: 10.1366/10-06184
Kahraman, M., Yazici, M. M., Sahin, F., and Culha, M. (2008). Convective assembly of bacteria for surface-enhanced Raman scattering. Langmuir 24, 894–901. doi: 10.1021/la702240q
Kalisky, T., and Quake, S. R. (2011). Single-cell genomics. Nat. Methods 8, 311–314. doi: 10.1038/nmeth0411-311
Kindaichi, T., Ito, T., and Okabe, S. (2004). Ecophysiological interaction between nitrifying bacteria and heterotrophic bacteria in autotrophic nitrifying biofilms as determined by microautoradiography-fluorescence in situ hybridization. Appl. Environ. Microbiol. 70, 1641–1650. doi: 10.1128/Aem.70.3.1641-1650.2004
Kubryk, P., Kolschbach, J. S., Marozava, S., Lueders, T., Meckenstock, R. U., Niessner, R., et al. (2015). Exploring the potential of stable isotope (resonance) Raman microspectroscopy and surface-enhanced Raman scattering for the analysis of microorganisms at single cell level. Anal. Chem. 87, 6622–6630. doi: 10.1021/acs.analchem.5b00673
Kubryk, P., Niessner, R., and Ivleva, N. P. (2016). The origin of the band at around 730 cm-1 in the SERS spectra of bacteria: a stable isotope approach. Analyst 141, 2874–2878. doi: 10.1039/c6an00306k
Lee, K. S., Palatinszky, M., Pereira, F. C., Nguyen, J., Fernandez, V. I., Mueller, A. J., et al. (2019). An automated Raman-based platform for the sorting of live cells by functional properties. Nat. Microbiol. 4, 1035–1048. doi: 10.1038/s41564-019-0394-9
Leopold, N., and Lendl, B. (2003). A new method for fast preparation of highly surface-enhanced raman scattering (SERS) active silver colloids at room temperature by reduction of silver nitrate with hydroxylamine hydrochloride. J. Phys. Chem. B 107, 5723–5727. doi: 10.1021/jp027460u
Li, M. Q., Canniffe, D. P., Jackson, P. J., Davison, P. A., FitzGerald, S., Dickman, M. J., et al. (2012a). Rapid resonance Raman microspectroscopy to probe carbon dioxide fixation by single cells in microbial communities. ISME J. 6, 875–885. doi: 10.1038/ismej.2011.150
Li, M. Q., Xu, J., Romero-Gonzalez, M., Banwart, S. A., and Huang, W. E. (2012b). Single cell Raman spectroscopy for cell sorting and imaging. Curr. Opin. Biotechnol. 23, 56–63. doi: 10.1016/j.copbio.2011.11.019
Liu, X. X., Yin, Y. D., and Gao, C. B. (2013). Size-Tailored synthesis of silver quasi-nanospheres by kinetically controlled seeded growth. Langmuir 29, 10559–10565. doi: 10.1021/la402147f
Lombardi, J. R., and Birke, R. L. (2009). A unified view of surface-enhanced Raman scattering. Accounts Chem. Res. 42, 734–742. doi: 10.1021/ar800249y
MacLean, D., Jones, J. D., and Studholme, D. J. (2009). Application of ‘next-generation’ sequencing technologies to microbial genetics. Nat. Rev. Microbiol. 7, 287–296. doi: 10.1038/nrmicro2122
Marchand, C. H., Salmeron, C., Bou Raad, R., Meniche, X., Chami, M., Masi, M., et al. (2012). Biochemical disclosure of the mycolate outer membrane of Corynebacterium glutamicum. J. Bacteriol. 194, 587–597. doi: 10.1128/jb.06138-11
Mathioudakis, G. N., Beobide, A. S., Bokias, G., Koutsoukos, P. G., and Voyiatzis, G. A. (2020). Surface-enhanced Raman scattering as a tool to study cationic surfactants exhibiting low critical micelle concentration. J. Raman Spectrosc. 51, 452–460. doi: 10.1002/jrs.5798
Millo, D., Harnisch, F., Patil, S. A., Ly, H. K., Schroder, U., and Hildebrandt, P. (2011). In situ spectroelectrochemical investigation of electrocatalytic microbial biofilms by surface-enhanced resonance Raman spectroscopy. Angew. Chem. Int. Ed. Engl. 50, 2625–2627. doi: 10.1002/anie.201006046
Orphan, V. J., House, C. H., Hinrichs, K. U., McKeegan, K. D., and DeLong, E. F. (2001). Methane-consuming archaea revealed by directly coupled isotopic and phylogenetic analysis. Science 293, 484–487. doi: 10.1126/science.1061338
Panneerselvam, R., Liu, G. K., Wang, Y. H., Liu, J. Y., Ding, S. Y., Li, J. F., et al. (2018). Surface-enhanced Raman spectroscopy: bottlenecks and future directions. Chem. Commun. 54, 10–25. doi: 10.1039/c7cc05979e
Ruiz-Chica, A. J., Medina, M. A., Sánchez-Jiménez, F., and Ramírez, F. J. (2004). Characterization by Raman spectroscopy of conformational changes on guanine–cytosine and adenine–thymine oligonucleotides induced by aminooxy analogues of spermidine. J. Raman Spectrosc. 35, 93–100. doi: 10.1002/jrs.1107
Scholz, M. B., Lo, C. C., and Chain, P. S. (2012). Next generation sequencing and bioinformatic bottlenecks: the current state of metagenomic data analysis. Curr. Opin. Biotechnol. 23, 9–15. doi: 10.1016/j.copbio.2011.11.013
Sherry, L. J., Jin, R., Mirkin, C. A., Schatz, G. C., and Van Duyne, R. P. (2006). Localized surface plasmon resonance spectroscopy of single silver triangular nanoprisms. Nano Lett. 6, 2060–2065. doi: 10.1021/nl061286u
Song, Y. Z., Yin, H. B., and Huang, W. E. (2016). Raman activated cell sorting. Curr. Opin. Chem. Biol. 33, 1–8. doi: 10.1016/j.cbpa.2016.04.002
Stiles, P. L., Dieringer, J. A., Shah, N. C., and Van Duyne, R. P. (2008). Surface-enhanced Raman spectroscopy. Annu. Rev. Analyt. Chem. 1, 601–626. doi: 10.1146/annurev.anchem.1.031207.112814
Stone, N., Kendall, C., Shepherd, N., Crow, P., and Barr, H. (2002). Near-infrared Raman spectroscopy for the classification of epithelial pre-cancers and cancers. J. Raman Spectros. 33, 564–573. doi: 10.1002/jrs.882
Tian, H., Zhuang, G., Ma, A., and Jing, C. (2012). Arsenic interception by cell wall of bacteria observed with surface-enhanced Raman scattering. J. Microbiol. Methods 89, 153–158. doi: 10.1016/j.mimet.2012.03.018
Wagner, M. (2009). Single-cell ecophysiology of microbes as revealed by Raman microspectroscopy or secondary ion mass spectrometry imaging. Annu. Rev. Microbiol. 63, 411–429. doi: 10.1146/annurev.micro.091208.073233
Wang, P. X., Pang, S., Chen, J. H., McLandsborough, L., Nugen, S. R., Fan, M. T., et al. (2016). Label-free mapping of single bacterial cells using surface-enhanced Raman spectroscopy. Analyst 141, 1356–1362. doi: 10.1039/c5an02175h
Wang, Y., Huang, W. E., Cui, L., and Wagner, M. (2016). Single cell stable isotope probing in microbiology using Raman microspectroscopy. Curr. Opin. Biotechnol. 41, 34–42. doi: 10.1016/j.copbio.2016.04.018
Wang, X.-B., Chi, C.-Q., Nie, Y., Tang, Y.-Q., Tan, Y., Wu, G., et al. (2011). Degradation of petroleum hydrocarbons (C6-C40) and crude oil by a novel Dietzia strain. Bioresour. Technol. 102, 7755–7761. doi: 10.1016/j.biortech.2011.06.009
Wang, Y., Xu, J. B., Kong, L. C., Liu, T., Yi, L. B., Wang, H. J., et al. (2020). Raman-deuterium isotope probing to study metabolic activities of single bacterial cells in human intestinal microbiota. Microb. Biotechnol. 13, 572–583. doi: 10.1111/1751-7915.13519
Wei, C., Li, M., and Zhao, X. (2018). Surface-enhanced Raman scattering (SERS) with silver nano substrates synthesized by microwave for rapid detection of foodborne pathogens. Front. Microbiol. 9:2857. doi: 10.3389/fmicb.2018.02857
Weiss, R., Palatinszky, M., Wagner, M., Niessner, R., Elsner, M., Seidel, M., et al. (2019). Surface-enhanced Raman spectroscopy of microorganisms: limitations and applicability on the single-cell level. Analyst 144, 943–953. doi: 10.1039/c8an02177e
Willets, K. A. (2009). Surface-enhanced Raman scattering (SERS) for probing internal cellular structure and dynamics. Anal. Bioanal. Chem. 394, 85–94. doi: 10.1007/s00216-009-2682-3
Yang, D. T., Zhou, H. B., Haisch, C., Niessner, R., and Ying, Y. B. (2016). Reproducible E. coli detection based on label-free SERS and mapping. Talanta 146, 457–463. doi: 10.1016/j.talanta.2015.09.006
Yang, H. J., He, S. Y., and Tuan, H. Y. (2014). Self-seeded growth of five-fold twinned copper nanowires: mechanistic study, characterization and SERS applications. Langmuir 30, 602–610. doi: 10.1021/la4036198
Zeiri, L., Bronk, B. V., Shabtai, Y., Eichler, J., and Efrima, S. (2004). Surface-enhanced Raman spectroscopy as a tool for probing specific biochemical components in bacteria. Appl. Spectrosc. 58, 33–40. doi: 10.1366/000370204322729441
Zhao, X., Li, M., and Xu, Z. (2018). Detection of foodborne pathogens by surface enhanced raman spectroscopy. Front. Microbiol. 9:1236. doi: 10.3389/fmicb.2018.01236
Zhou, H. B., Yang, D. T., Ivleva, N. P., Mircescu, N. E., Niessner, R., and Haisch, C. (2014). SERS detection of bacteria in water by in situ coating with Ag nanoparticles. Anal. Chem. 86, 1525–1533. doi: 10.1021/ac402935p
Zhou, H. B., Yang, D. T., Ivleva, N. P., Mircescu, N. E., Schubert, S., Niessner, R., et al. (2015). Label-free in situ discrimination of live and dead bacteria by surface-enhanced Raman scattering. Anal. Chem. 87, 6553–6561. doi: 10.1021/acs.analchem.5b01271
Keywords: Raman microscopy, SERS, bacteria, single cell analysis, bacteria detection
Citation: Yan Y, Nie Y, An L, Tang Y-Q, Xu Z and Wu X-L (2020) Improvement of Surface-Enhanced Raman Scattering Method for Single Bacterial Cell Analysis. Front. Bioeng. Biotechnol. 8:573777. doi: 10.3389/fbioe.2020.573777
Received: 18 June 2020; Accepted: 25 August 2020;
Published: 17 September 2020.
Edited by:
Wen-Yong Lou, South China University of Technology, ChinaCopyright © 2020 Yan, Nie, An, Tang, Xu and Wu. This is an open-access article distributed under the terms of the Creative Commons Attribution License (CC BY). The use, distribution or reproduction in other forums is permitted, provided the original author(s) and the copyright owner(s) are credited and that the original publication in this journal is cited, in accordance with accepted academic practice. No use, distribution or reproduction is permitted which does not comply with these terms.
*Correspondence: Yong Nie, bmlleW9uZ0Bwa3UuZWR1LmNu; Xiao-Lei Wu, eGlhb2xlaV93dUBwa3UuZWR1LmNu