 Marleny M. Arones
 Mohammad S. Shourijeh
 Carolynn Patten
 Benjamin J. Fregly
- 1Department of Mechanical Engineering, Rice University, Houston, TX, United States
- 2Department of Physical Medicine and Rehabilitation, University of California, Davis, Davis, CA, United States
Assessment of metabolic cost as a metric for human performance has expanded across various fields within the scientific, clinical, and engineering communities. As an alternative to measuring metabolic cost experimentally, musculoskeletal models incorporating metabolic cost models have been developed. However, to utilize these models for practical applications, the accuracy of their metabolic cost predictions requires improvement. Previous studies have reported the benefits of using personalized musculoskeletal models for various applications, yet no study has evaluated how model personalization affects metabolic cost estimation. This study investigated the effect of musculoskeletal model personalization on estimates of metabolic cost of transport (CoT) during post-stroke walking using three commonly used metabolic cost models. We analyzed walking data previously collected from two male stroke survivors with right-sided hemiparesis. The three metabolic cost models were implemented within three musculoskeletal modeling approaches involving different levels of personalization. The first approach used a scaled generic OpenSim model and found muscle activations via static optimization (SOGen). The second approach used a personalized electromyographic (EMG)-driven musculoskeletal model with personalized functional axes but found muscle activations via static optimization (SOCal). The third approach used the same personalized EMG-driven model but calculated muscle activations directly from EMG data (EMGCal). For each approach, the muscle activation estimates were used to calculate each subject’s CoT at different gait speeds using three metabolic cost models (Umberger et al., 2003; Bhargava et al., 2004; Umberger, 2010). The calculated CoT values were compared with published CoT data as a function of walking speed, step length asymmetry, stance time asymmetry, double support time asymmetry, and severity of motor impairment (i.e., Fugl-Meyer score). Overall, only SOCal and EMGCal with the Bhargava metabolic cost model were able to reproduce accurately published experimental trends between CoT and various clinical measures of walking asymmetry post-stroke. Tuning of the parameters in the different metabolic cost models could potentially resolve the observed CoT magnitude differences between model predictions and experimental measurements. Realistic CoT predictions may allow researchers to predict human performance, surgical outcomes, and rehabilitation outcomes reliably using computational simulations.
Introduction
Metabolic cost has been used to evaluate human performance during daily activities such as walking (Waters and Mulroy, 1999; Donelan et al., 2002, 2008; Mian et al., 2006; Long and Srinivasan, 2013) and athletic activities such as running (Roberts et al., 1998; Chang and Kram, 1999; Teunissen et al., 2007; Franz et al., 2012; Long and Srinivasan, 2013) and cycling (Davies, 1980; Gnehm et al., 1997; Neptune and Van Den Bogert, 1997; McDaniel et al., 2002; van der Woude et al., 2008). Metabolic cost is defined as the energy consumed by the body during a given activity, a quantity that has also been adopted as a metric to evaluate the design or operational settings of assistive devices (Malcolm et al., 2013; Collins et al., 2015; Galle et al., 2017). Additional applications for which knowledge of metabolic cost is useful include: prescription of training intensities (American College of Sports Medicine, 2000), advancement of geriatric medicine (Mian et al., 2006; Canavan et al., 2009; Corbett et al., 2017), treatment of clinical gait disorders (Waters and Mulroy, 1999), and monitoring of energy intake and expenditure in obese patients (Brychta et al., 2010). Various methods exist to measure metabolic cost, with the two most popular being indirect and direct calorimetry. Direct calorimetry measures metabolic cost using a calorimeter and is the most accurate method. However, its usage is limited due to the cost of dedicated equipment and the need for specific expertise to acquire and interpret the data. In contrast, indirect calorimetry estimates metabolic cost by measuring respiratory gases influenced by the body’s metabolism (Lam and Ravussin, 2016). Although indirect calorimetry is more affordable than direct calorimetry, the trade-off is reduced accuracy. Regardless of the method, the various applications of metabolic cost measurement often require subjects to walk repeatedly for long periods of time, limiting the participation of subjects with severe impairments or who quickly fatigue (Markovitz et al., 2004; Awad et al., 2017).
With advances in computational biomechanics, musculoskeletal models incorporating metabolic cost models have emerged as tools to estimate metabolic cost. These tools have been used to predict human movement and response to mechanical interventions (Uchida et al., 2016; Falisse et al., 2019). Although the creation and calibration of musculoskeletal models involves high computational cost, once a subject-specific model is created, it is easier, faster, and cheaper to evaluate various treatment options in silico. Specifically, within the field of exoskeleton design, musculoskeletal models can eliminate the time and expense of iteratively designing and building physical prototypes. Uchida et al. (2016) used the OpenSim simulation framework (Seth et al., 2018) to optimize the design of an assistive device intended to reduce the metabolic cost of running. Dembia et al. (2017) simulated an ideal assistive device to minimize the metabolic cost of several individuals walking with heavy loads. Fey et al. (2012) developed an optimization to identify an optimal prosthetic foot stiffness to minimize metabolic cost for amputee walking. Miller et al. (2013) used direct collocation optimal control to predict a gait pattern that reduced metabolic cost while minimizing peak axial knee contact force. By predicting the factors, designs, or movements that minimize metabolic cost, these studies highlight the potential benefits of combining musculoskeletal and metabolic cost models. However, for these predictions to be used for practical applications, they need to be validated against experimental measurements. Studies that have performed a direct comparison between measured and predicted metabolic cost have reported noticeable differences depending on the metabolic cost model chosen (Miller, 2014; Koelewijn et al., 2019), emphasizing the need to improve either the accuracy of existing metabolic cost models, the fidelity of the associated musculoskeletal models, or both.
Previous studies that estimated metabolic cost during walking have focused on using scaled generic musculoskeletal models. However, several studies have reported that personalization of anatomical and physiological characteristics of a musculoskeletal model can influence prediction of muscle forces, joint moments, and novel movements, factors that also play a role in metabolic cost calculations. Reinbolt et al. (2007) found that personalization of the joint functional axes is important for obtaining reliable inverse dynamic joint moments. Several studies (e.g., Lloyd and Besier, 2003; Buchanan et al., 2005; Shao et al., 2009; Sartori et al., 2012; Meyer et al., 2017) reported large improvements in joint moment matching when muscle force-generating properties were personalized using an electromyographic (EMG)-driven model. Gerus et al. (2013) demonstrated that personalizing knee geometry and corresponding muscle-tendon model parameter values resulted in improved predictions of knee contact force compared to predictions generated by a generic model. Since muscle force estimates depend on joint moments, and the production of muscle forces and activations depends on muscle-tendon model parameters, the confounding effect of model personalization may also affect metabolic cost estimates. However, to the best of the authors’ knowledge, no study to date has explored this possibility.
This study evaluated the influence of musculoskeletal model personalization on metabolic cost estimates of walking post-stroke. To evaluate the physical realism of different metabolic cost modeling methods, we compared metabolic cost estimates to trends reported in the literature for individuals post-stroke. Finley and Bastian (2017) reported a decrease in metabolic cost as walking speed increased and severity of motor impairment decreased. For the same subject population, Finley et al. (2015) and Finley and Bastian (2017) also reported that metabolic cost increased as asymmetries in step length, stance time, and double support time increased. To compare with these experimental trends, the present study calculated metabolic cost estimates using extensive gait data sets collected previously from two individuals post-stroke for whom metabolic cost measurements were not available. Our goal was to determine whether any combination of musculoskeletal modeling method and metabolic cost modeling method could reproduce all five physically realistic metabolic cost trends observed in the literature. Since metabolic cost has been adopted as a tool in various scientific, clinical, and engineering fields to evaluate human performance, surgical outcomes, and rehabilitation outcomes, the results of this study may be useful for identifying which modeling methods are most likely to predict physically realistic metabolic cost estimates.
Materials and Methods
Experimental Data and Data Processing
Experimental walking data collected from two male stroke survivors–one high functioning and one low functioning–were used as inputs to the metabolic cost analyses (see Table 1 for subject characteristics). Data collected from both subjects included marker-based motion, ground reaction, and surface and fine-wire EMG data (Table 2, 16 channels per leg). The data were collected at different walking speeds using a split-belt instrumented treadmill with belts tied. Walking speeds ranged from slower than self-selected to a maximum comfortable speed. For the high functioning subject, the speed range was from 0.4 to 0.8 m/s in increments of 0.1 m/s, while for the low functioning subject, the speed range was from 0.35 to 0.65 m/s also in increments of 0.1 m/s. Additional experimental data were also collected for static and isolated joint motion trials. A static standing trial was collected for model scaling purposes. Isolated joint motion trials were collected for each hip, knee, and ankle for purposes of personalizing the model’s lower body joint centers and functional axes. All functional axes for the joint of interest were exercised during each isolated joint motion trial (Reinbolt et al., 2005, 2008).
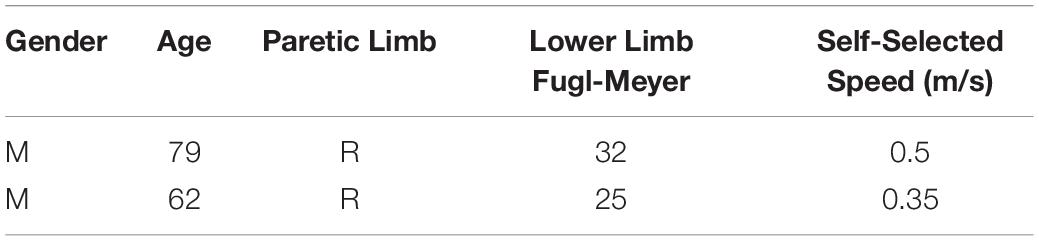
Table 1. Clinical characteristics of study participants.
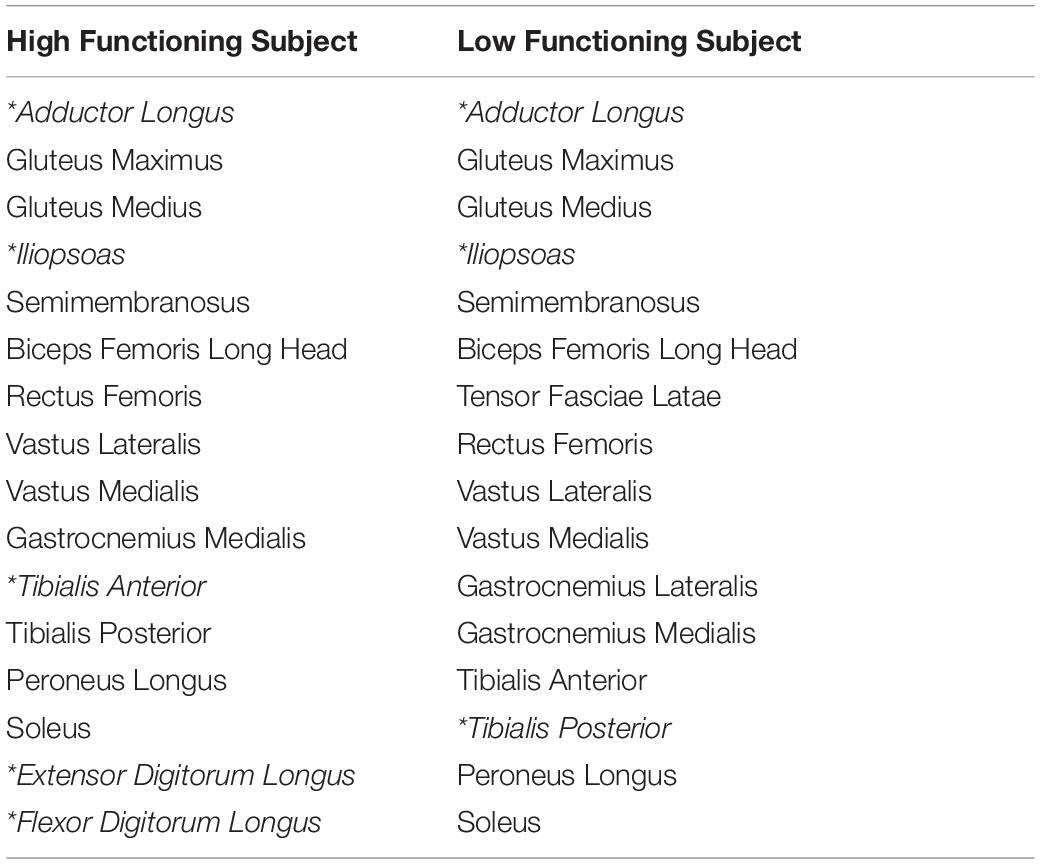
Table 2. Muscle groups from which a surface or fine-wire (*) EMG signal was recorded.
The experimental data were processed using standard methods. The ground reaction and marker motion data were low-pass filtered using a fourth-order zero-phase lag Butterworth filter with a cut-off frequency of 7/tf Hz (Hug, 2011), where tf is the period of the gait cycle being processed (Meyer et al., 2017). On average, this variable cut-off frequency caused data collected at a normal walking speed to be filtered at approximately 6 Hz. The EMG data were high-pass filtered (40 Hz), demeaned, rectified, and low-pass filtered (3.5/tf Hz) using a fourth-order zero-phase lag Butterworth filter. EMG amplitudes for each muscle were normalized to the maximum value over all trials and resampled to 101 time points per gait cycle, as described in Meyer et al. (2017).
Musculoskeletal Model
A generic full-body OpenSim musculoskeletal model (Rajagopal et al., 2016; Seth et al., 2018) served as the starting point for all three metabolic cost analyses. The generic model used for both subjects started with 40 Hill-type muscle-tendon actuators per leg and 37 degrees of freedom (DOFs), including: 3 DOF hip joints, 1 DOF knee joints, 2 DOF ankle joints. For the high functioning subject, six muscles without related EMG data were eliminated (extensor hallucis longus, flexor hallucis longus, gracilis, piriformis, sartorius, tensor fascia latae). For the low functioning subject, seven muscles without related EMG data were eliminated (extensor digitorum longus, flexor digitorum longus, extensor hallucis longus, flexor hallucis longus, gracilis, piriformis, sartorius). The remaining muscles actuated hip flexion-extension, hip adduction-abduction, hip internal-external rotation, knee flexion-extension, ankle flexion-extension, and ankle inversion–eversion on each leg.
Joint Model Personalization
Personalization of the joint functional axes for the hip, knee, and ankle of each leg was performed by following a two-step process. First, the geometry of the generic OpenSim model was scaled to match the dimensions of each subject using the OpenSim Scale Model tool and the static standing trial data. Second, marker positions and functional axes of the model’s lower body joints were personalized as described in Reinbolt et al. (2005, 2008), Meyer et al. (2016), and Sauder et al. (2019). The personalization process involved using non-linear optimization to adjust the positions and orientations of the model’s lower body joints and marker triads placed on the body segments. The cost function minimized the sum of squares of errors between the experimental and model marker positions from all isolated joint motion trials and one walking trial analyzed together. The optimization process was performed using Matlab’s lsqnonlin algorithm, which iteratively ran OpenSim Inverse Kinematics analyses to calculate marker location errors.
Muscle-Tendon Model and Geometry Personalization
Experimental data from ten gait trials collected at each available walking speed were used to calibrate an EMG-driven model of both legs for each subject. Before performing EMG-driven model calibration, we analyzed marker data from each gait trial using the OpenSim Inverse Kinematics tool to generate joint angle trajectories. The OpenSim Inverse Dynamics tool was then used to calculate the joint moments produced by muscle forces. Next, a surrogate model of each subject’s musculoskeletal geometry was generated to allow the EMG-driven model to modify musculoskeletal geometry (Meyer et al., 2016, 2017). The surrogate model was developed by sampling a wide range of joint angle combinations for the lower limbs using a Latin hypercube design. Muscle-tendon lengths and moment arms for each muscle were then calculated using the OpenSim Muscle Analysis tool. Linear regression using least squares was used to fit muscle-tendon lengths and moment arms simultaneously as related polynomial functions of the corresponding joint angles actuated by each muscle. Each muscle-tendon moment arm polynomial was defined to be the first derivative of the related muscle-tendon length polynomial with respect to the associated joint angle (An et al., 1984). Muscle-tendon velocity was defined as the first derivative of the resulting muscle-tendon length polynomial with respect to time.
To personalize the model’s muscle-tendon force-generating properties, we allowed our EMG-driven model calibration process to modify three types of parameters: EMG-to-activation parameters (electromechanical delays, activation dynamics time constants, activation non-linearization shape factors, and EMG scale factors), Hill-type muscle-tendon model parameters (optimal muscle fiber lengths and tendon slack lengths), and surrogate musculoskeletal geometry parameters. Using Matlab’s fmincon algorithm with sequential quadratic programming, we adjusted the model parameter values to best match calculated experimental inverse dynamic joint moments and published passive joint moments (Silder et al., 2007). In addition, penalty terms were added to the cost function to discourage substantial divergence of model parameter values from their original values (Supplementary Tables S1, S2). A detailed description of our EMG-driven modeling approach can be found in Meyer et al. (2017) as well as in the Supplementary Material.
Metabolic Cost Analysis
To evaluate the extent to which model personalization affects estimated metabolic cost, we developed three musculoskeletal models for each subject with varying levels of personalization. The least personalized model was a scaled generic OpenSim model where muscle activations were calculated via static optimization using quadratic programming (SOGen) (Supplementary Figure S1; Shourijeh and Fregly, 2020). The intermediate personalized model used the subject’s calibrated EMG-driven model but with muscle activations found via static optimization (SOCal) (Supplementary Figure S2). The most personalized model again used the subject’s calibrated EMG-driven model but with muscle activations calculated from the subject’s experimental EMG data (EMGCal) (Figure 1 and Supplementary Figure S3). The muscle activations found by each approach were used to calculate each subject’s cost of transport (CoT in J/m/kg) for different gait speeds using metabolic cost models published by Umberger et al. (2003) (U03), Umberger (2010) (U10), and Bhargava et al. (2004) (B04). CoT is defined as the metabolic cost expended to move a unit of body mass a unit of distance. These three metabolic cost models were chosen due to their popularity, where all three models are a function of work and heat rate due to muscle activation, muscle shortening and lengthening, and maintenance of muscle contraction. The key difference between these models is the assignment of negative (B04) or positive (U10 and U03) heat rate during muscle lengthening, along with the inclusion (U03 and B04) or exclusion (U10) of eccentric contraction work rate in the metabolic cost calculations.
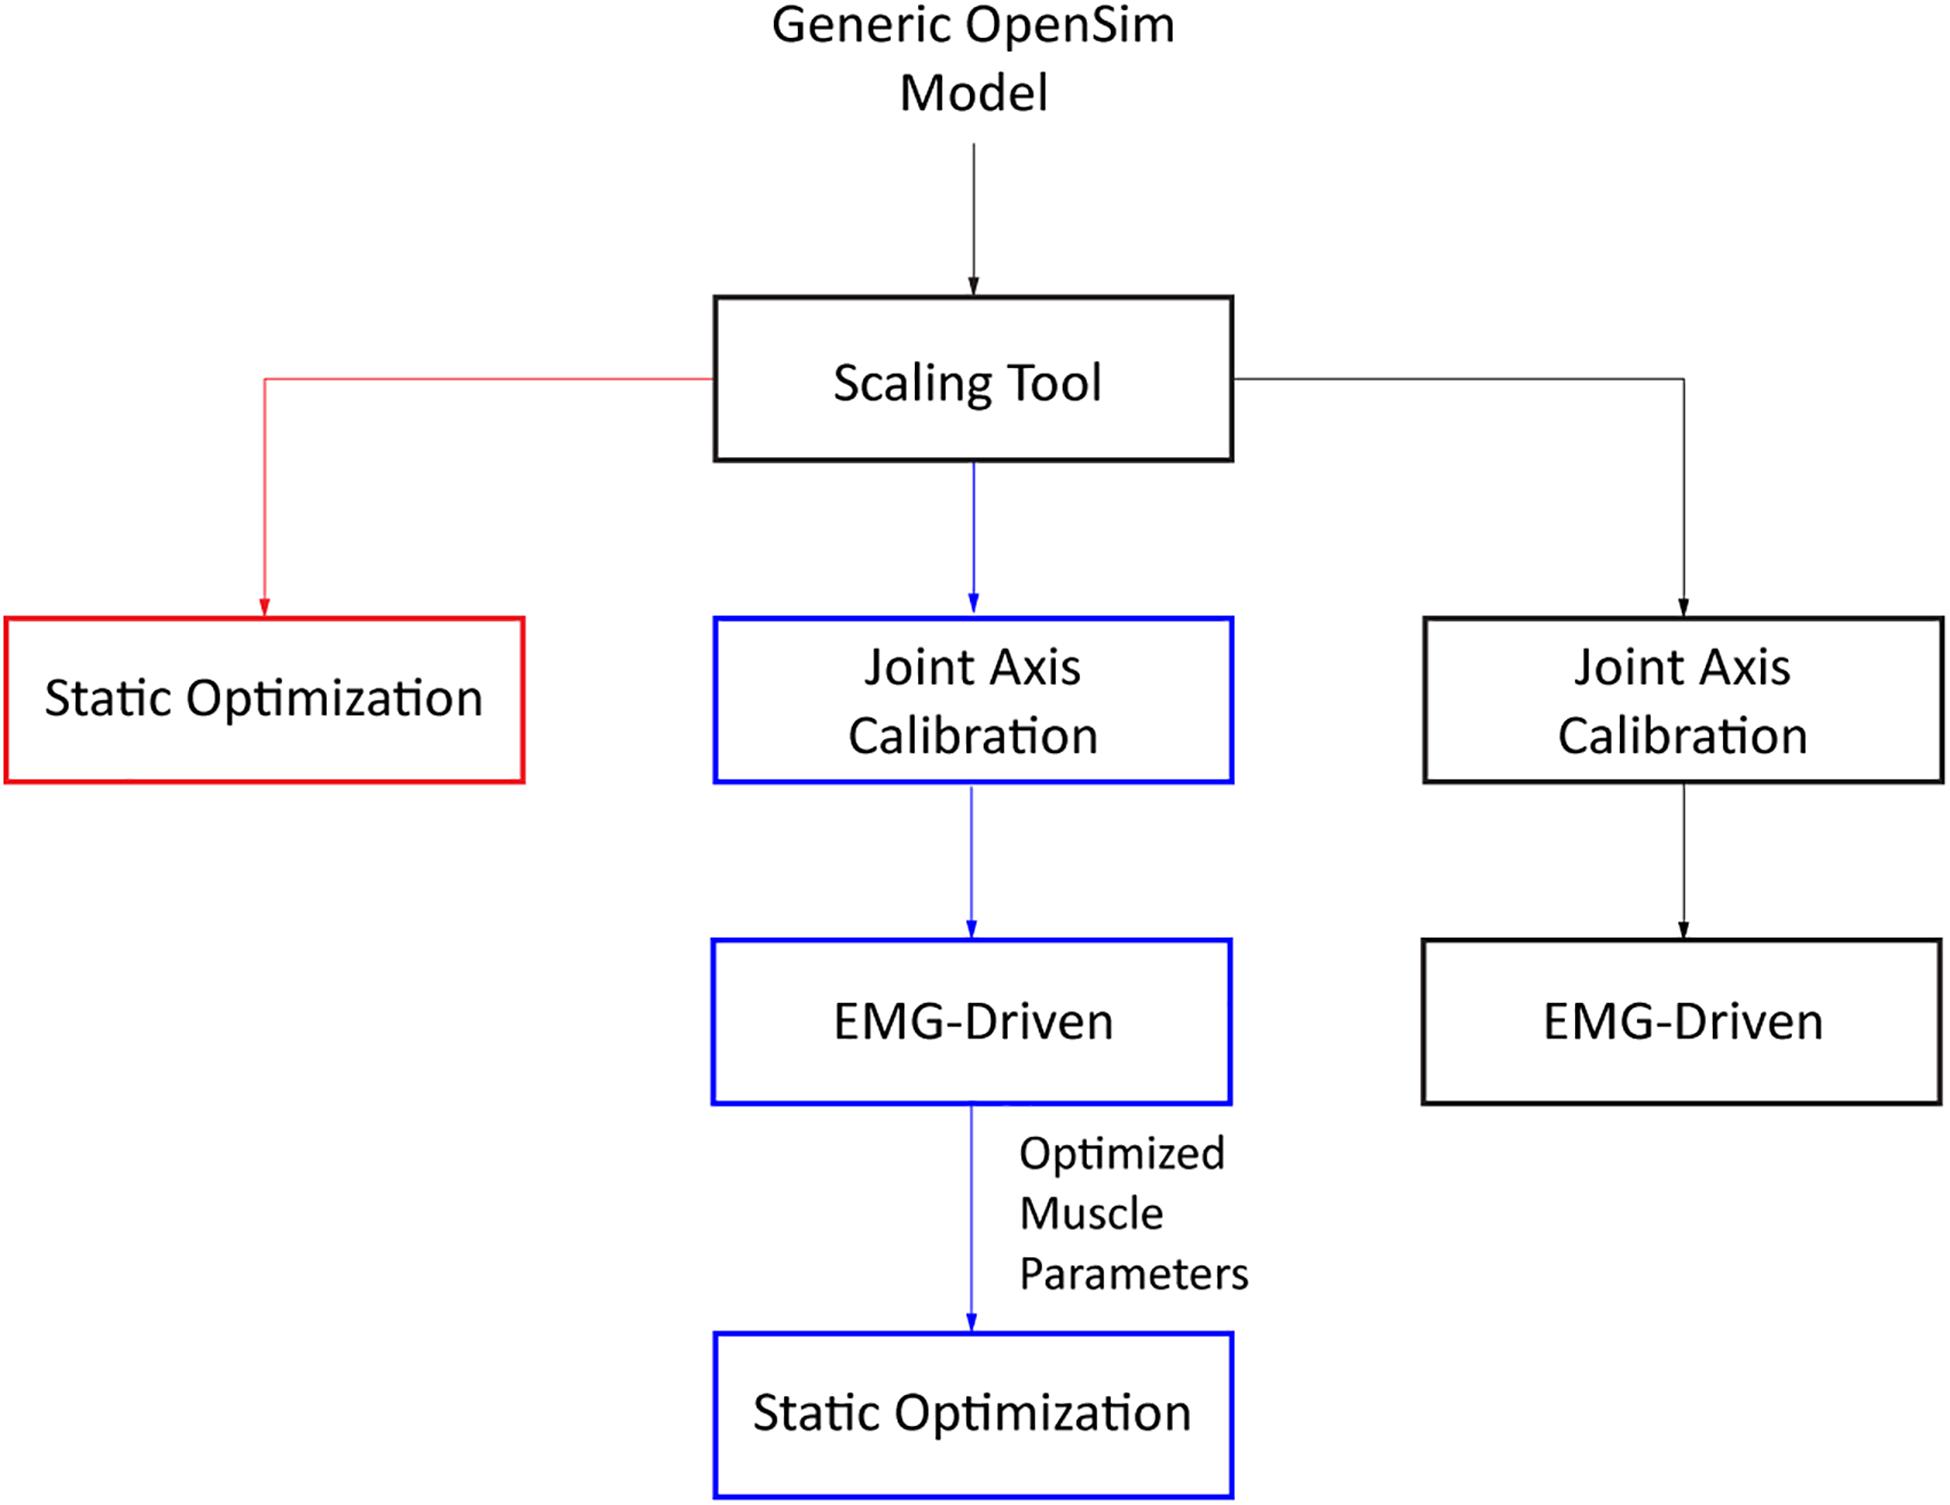
Figure 1. Flowchart of the three different approaches used to obtain estimates of muscle activations (SOGen: red, SOCal: blue, EMGCal: black).
To evaluate the physical realism of each musculoskeletal model/metabolic cost model combination, we identified five experimental trends in the literature for how CoT varies as a function of other clinically relevant quantities for individuals post-stroke. The first three quantities were step length asymmetry, stance time asymmetry, and double-support time asymmetry, all of which have been reported to increase as the CoT increases (Finley and Bastian, 2017). The two other quantities were walking speed and Fugl-Meyer score, which have been observed to decrease as the CoT increases. Asymmetries in step length, stance time, and double-support time between the paretic and non-paretic legs were calculated as specified in Finley et al. (2015) and Finley and Bastian (2017), where paretic leg values were subtracted from the non-paretic leg values and then absolute values taken. Step length asymmetry was computed as the difference between distance between the non-paretic foot and the pelvis during heel strike of the non-paretic leg and distance between the paretic foot and the pelvis at heel strike of the paretitc leg (defined as the difference in step position in Finley et al., 2015 and Finley and Bastian, 2017). Stance time asymmetry was computed as the difference between duration from heel strike to toe-off of the non-paretic leg and duration from heel strike to toe-off of the paretic leg. Double-support time asymmetry was computed as the difference between duration from heel strike of the paretic leg to toe-off of the non-paretic leg and duration from heel strike of the non-paretic leg to toe-off of the paretic leg.
We performed statistical analyses to evaluate whether trends in CoT as a function of the five quantities described above were different between each musculoskeletal model/metabolic cost model combination and the experimental data published in Finley and Bastian (2017). The selected statistical analysis was analysis of covariance, which compared the slopes and y-intercepts of regression models that fitted model predictions and experimental measurements. To provide a fair comparison with the experimental data published in Finley and Bastian (2017), we cropped the experimental data points to within ±0.05 m/s of the maximum and minimum speeds used in our study. This criterion was chosen to maximize the number of experimental data points retained from Finley and Bastian (2017) study while being consistent with the 0.05 m/s speed interval present in our study. To examine the relationship between Fugl-Meyer score and CoT, we first calculated the average CoT value across all speeds and trials per subject. These values were then compared to the average CoT values published in Finley and Bastian (2017) for a subset of subjects whose Fugl-Meyer scores were within ±3 of our high and low functioning subjects.
Results
The ability to predict CoT trends consistent with experimental measurements varied across the nine modeling combinations (Table 3 and Figures 2–5). Overall, only the Bhargava et al. (2004) metabolic cost model predicted slopes of CoT versus walking speed, step length asymmetry, stance time asymmetry, and double support time asymmetry regression lines that were statistically similar to those measured experimentally in Finley and Bastian (2017). Within the Bhargava metabolic cost model, p-values tended to increase as the level of musculoskeletal model personalization increased, with the EMGCal musculoskeletal model generally exhibiting the largest p-values and thus the greatest statistical similarity to experimental measurements. In contrast, the Umberger et al. (2003) and Umberger (2010) metabolic cost models predicted slopes that were statistically similar to those measured experimentally for only stance time asymmetry and double support time asymmetry. Within the two Umberger metabolic cost models, p-values tended to be comparable across the three levels of musculoskeletal model personalization.
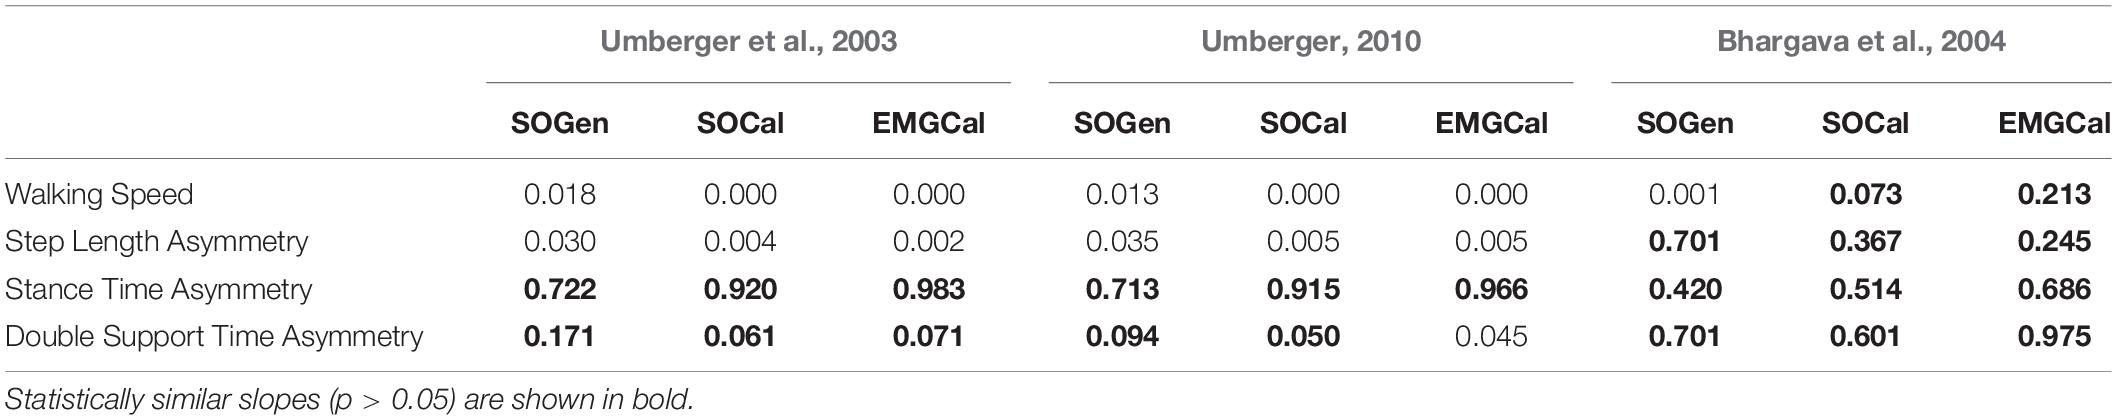
Table 3. Analysis of covariance p-values comparing slopes of CoT versus walking speed, step length asymmetry, stance time asymmetry, and double support time asymmetry regression lines between the nine model predictions and experimental measurements from Finley and Bastian (2017).
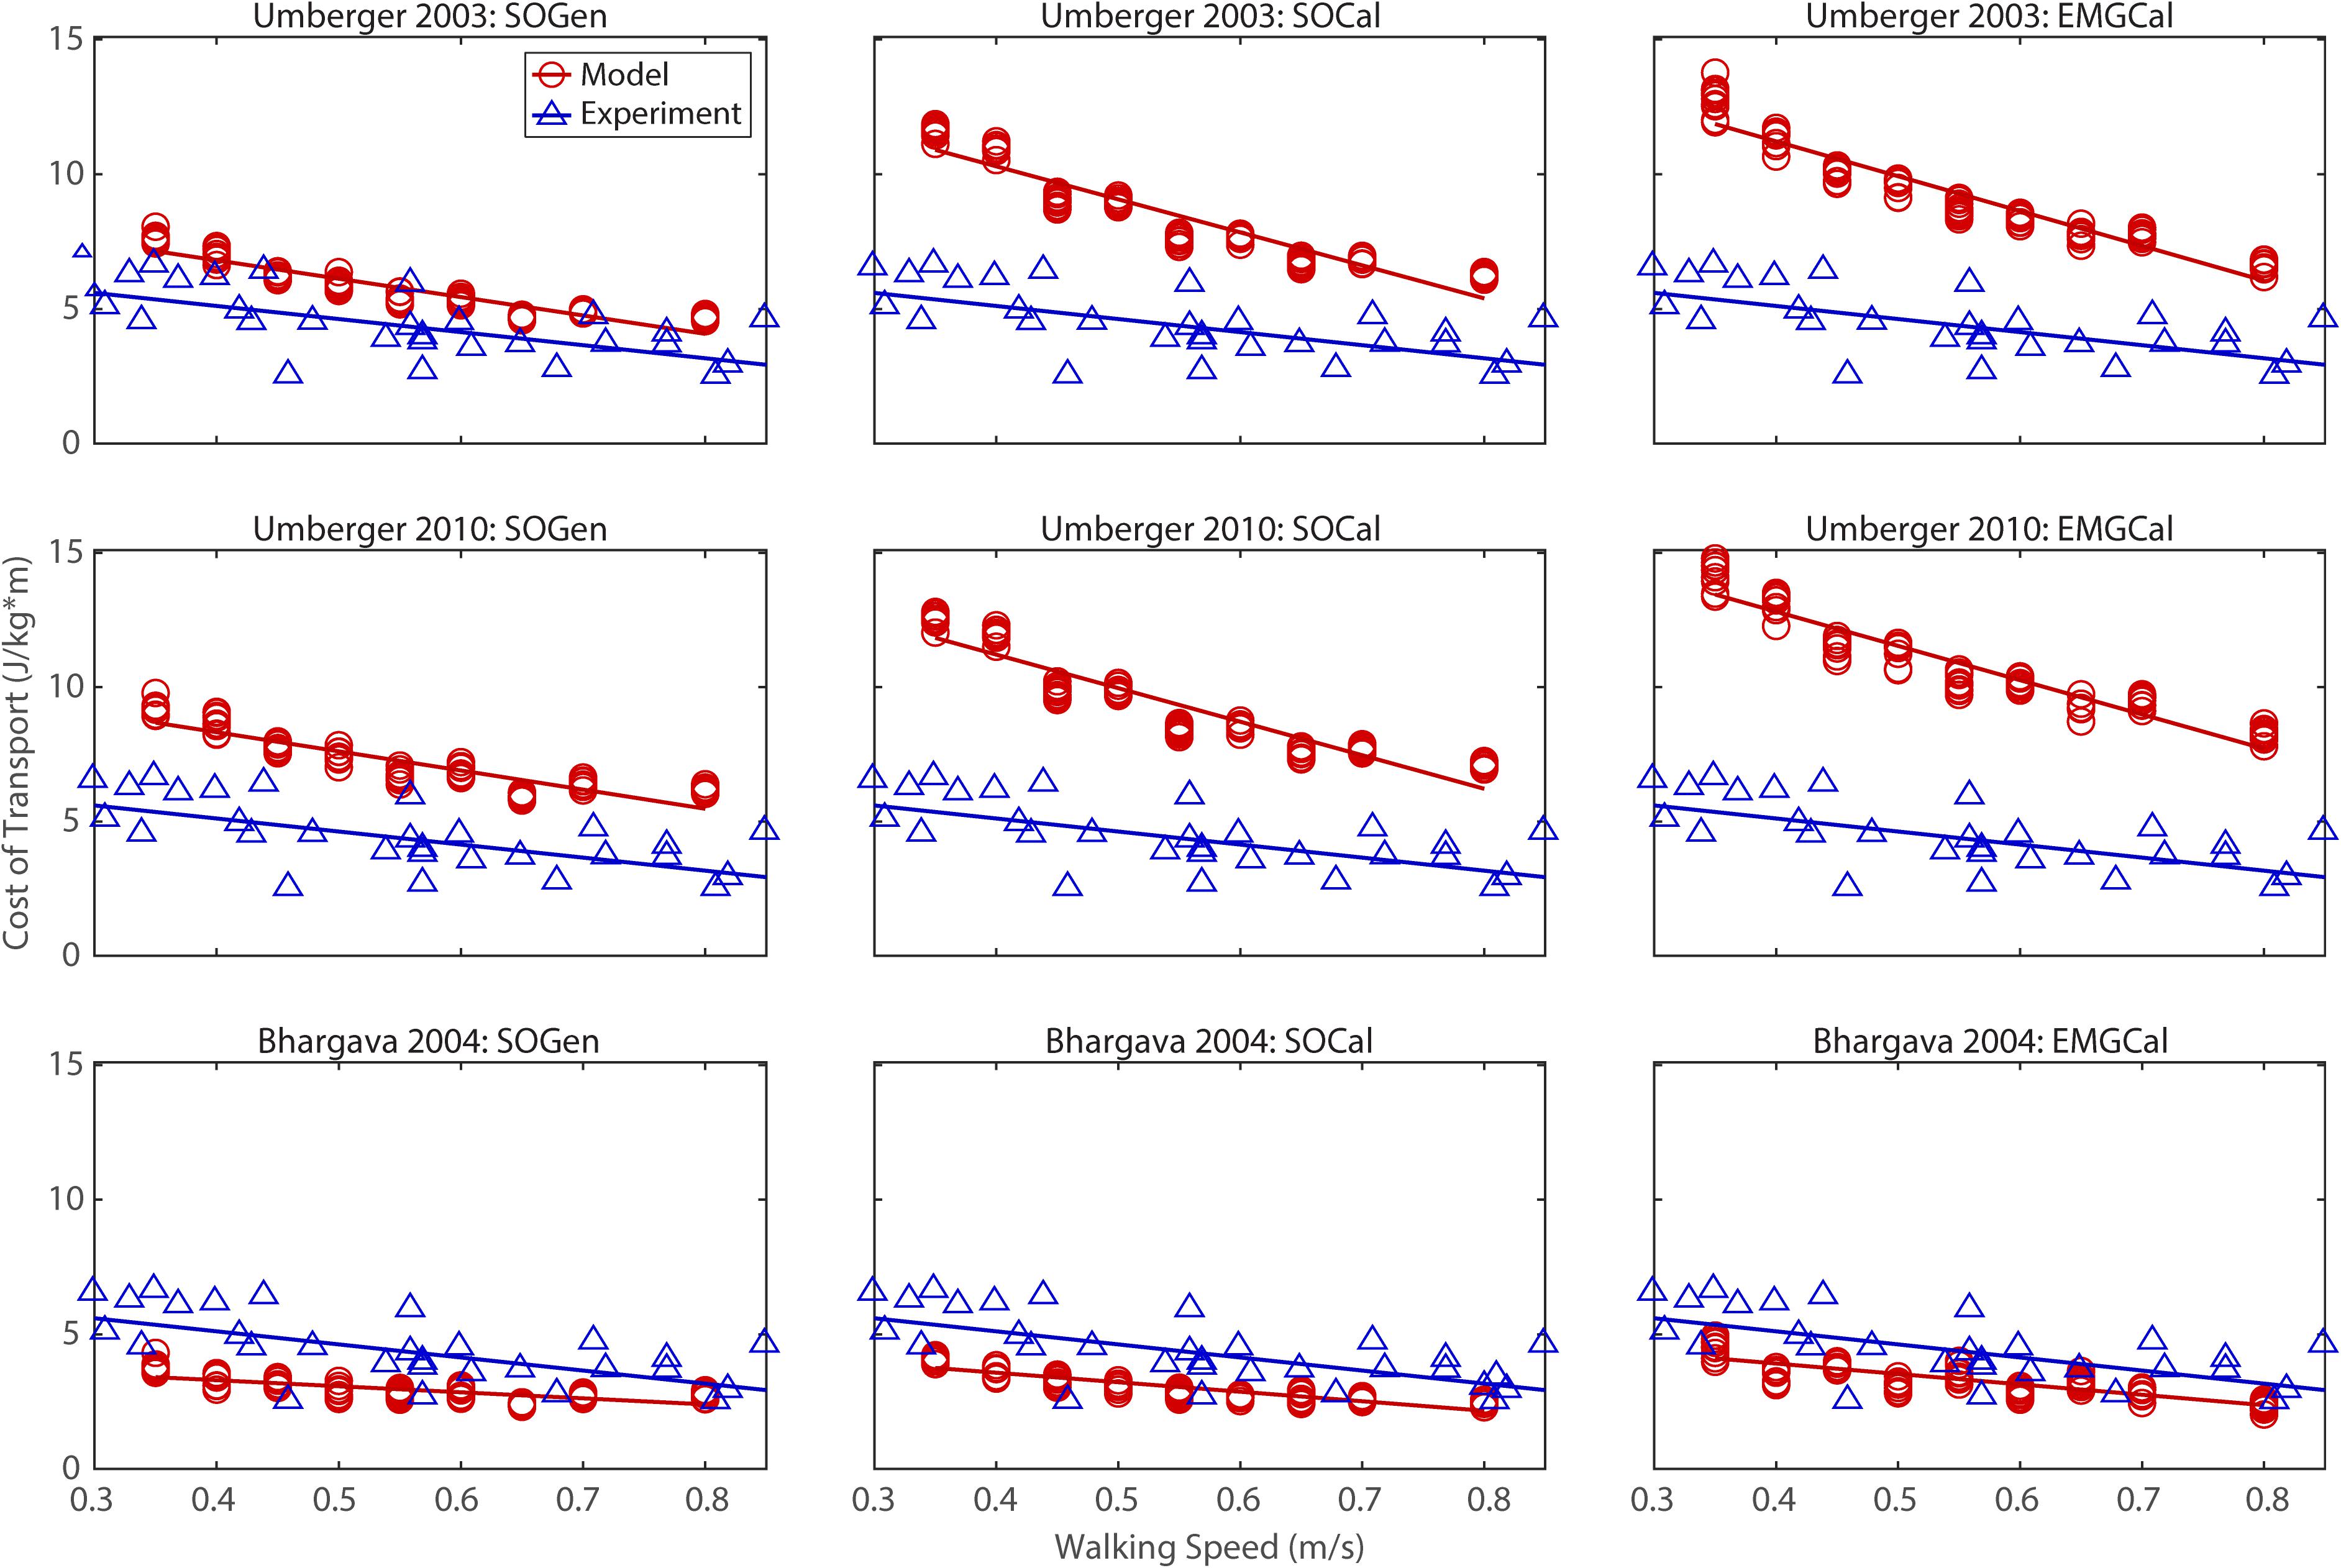
Figure 2. Comparison of model predicted (red circles) and experimentally measured (blue triangles) cost of transport as a function of walking speed. Model predictions include all possible combinations of three musculoskeletal models possessing different levels of personalization (columns) and three metabolic cost models (rows). Experimental measurements were obtained from Finley and Bastian (2017).
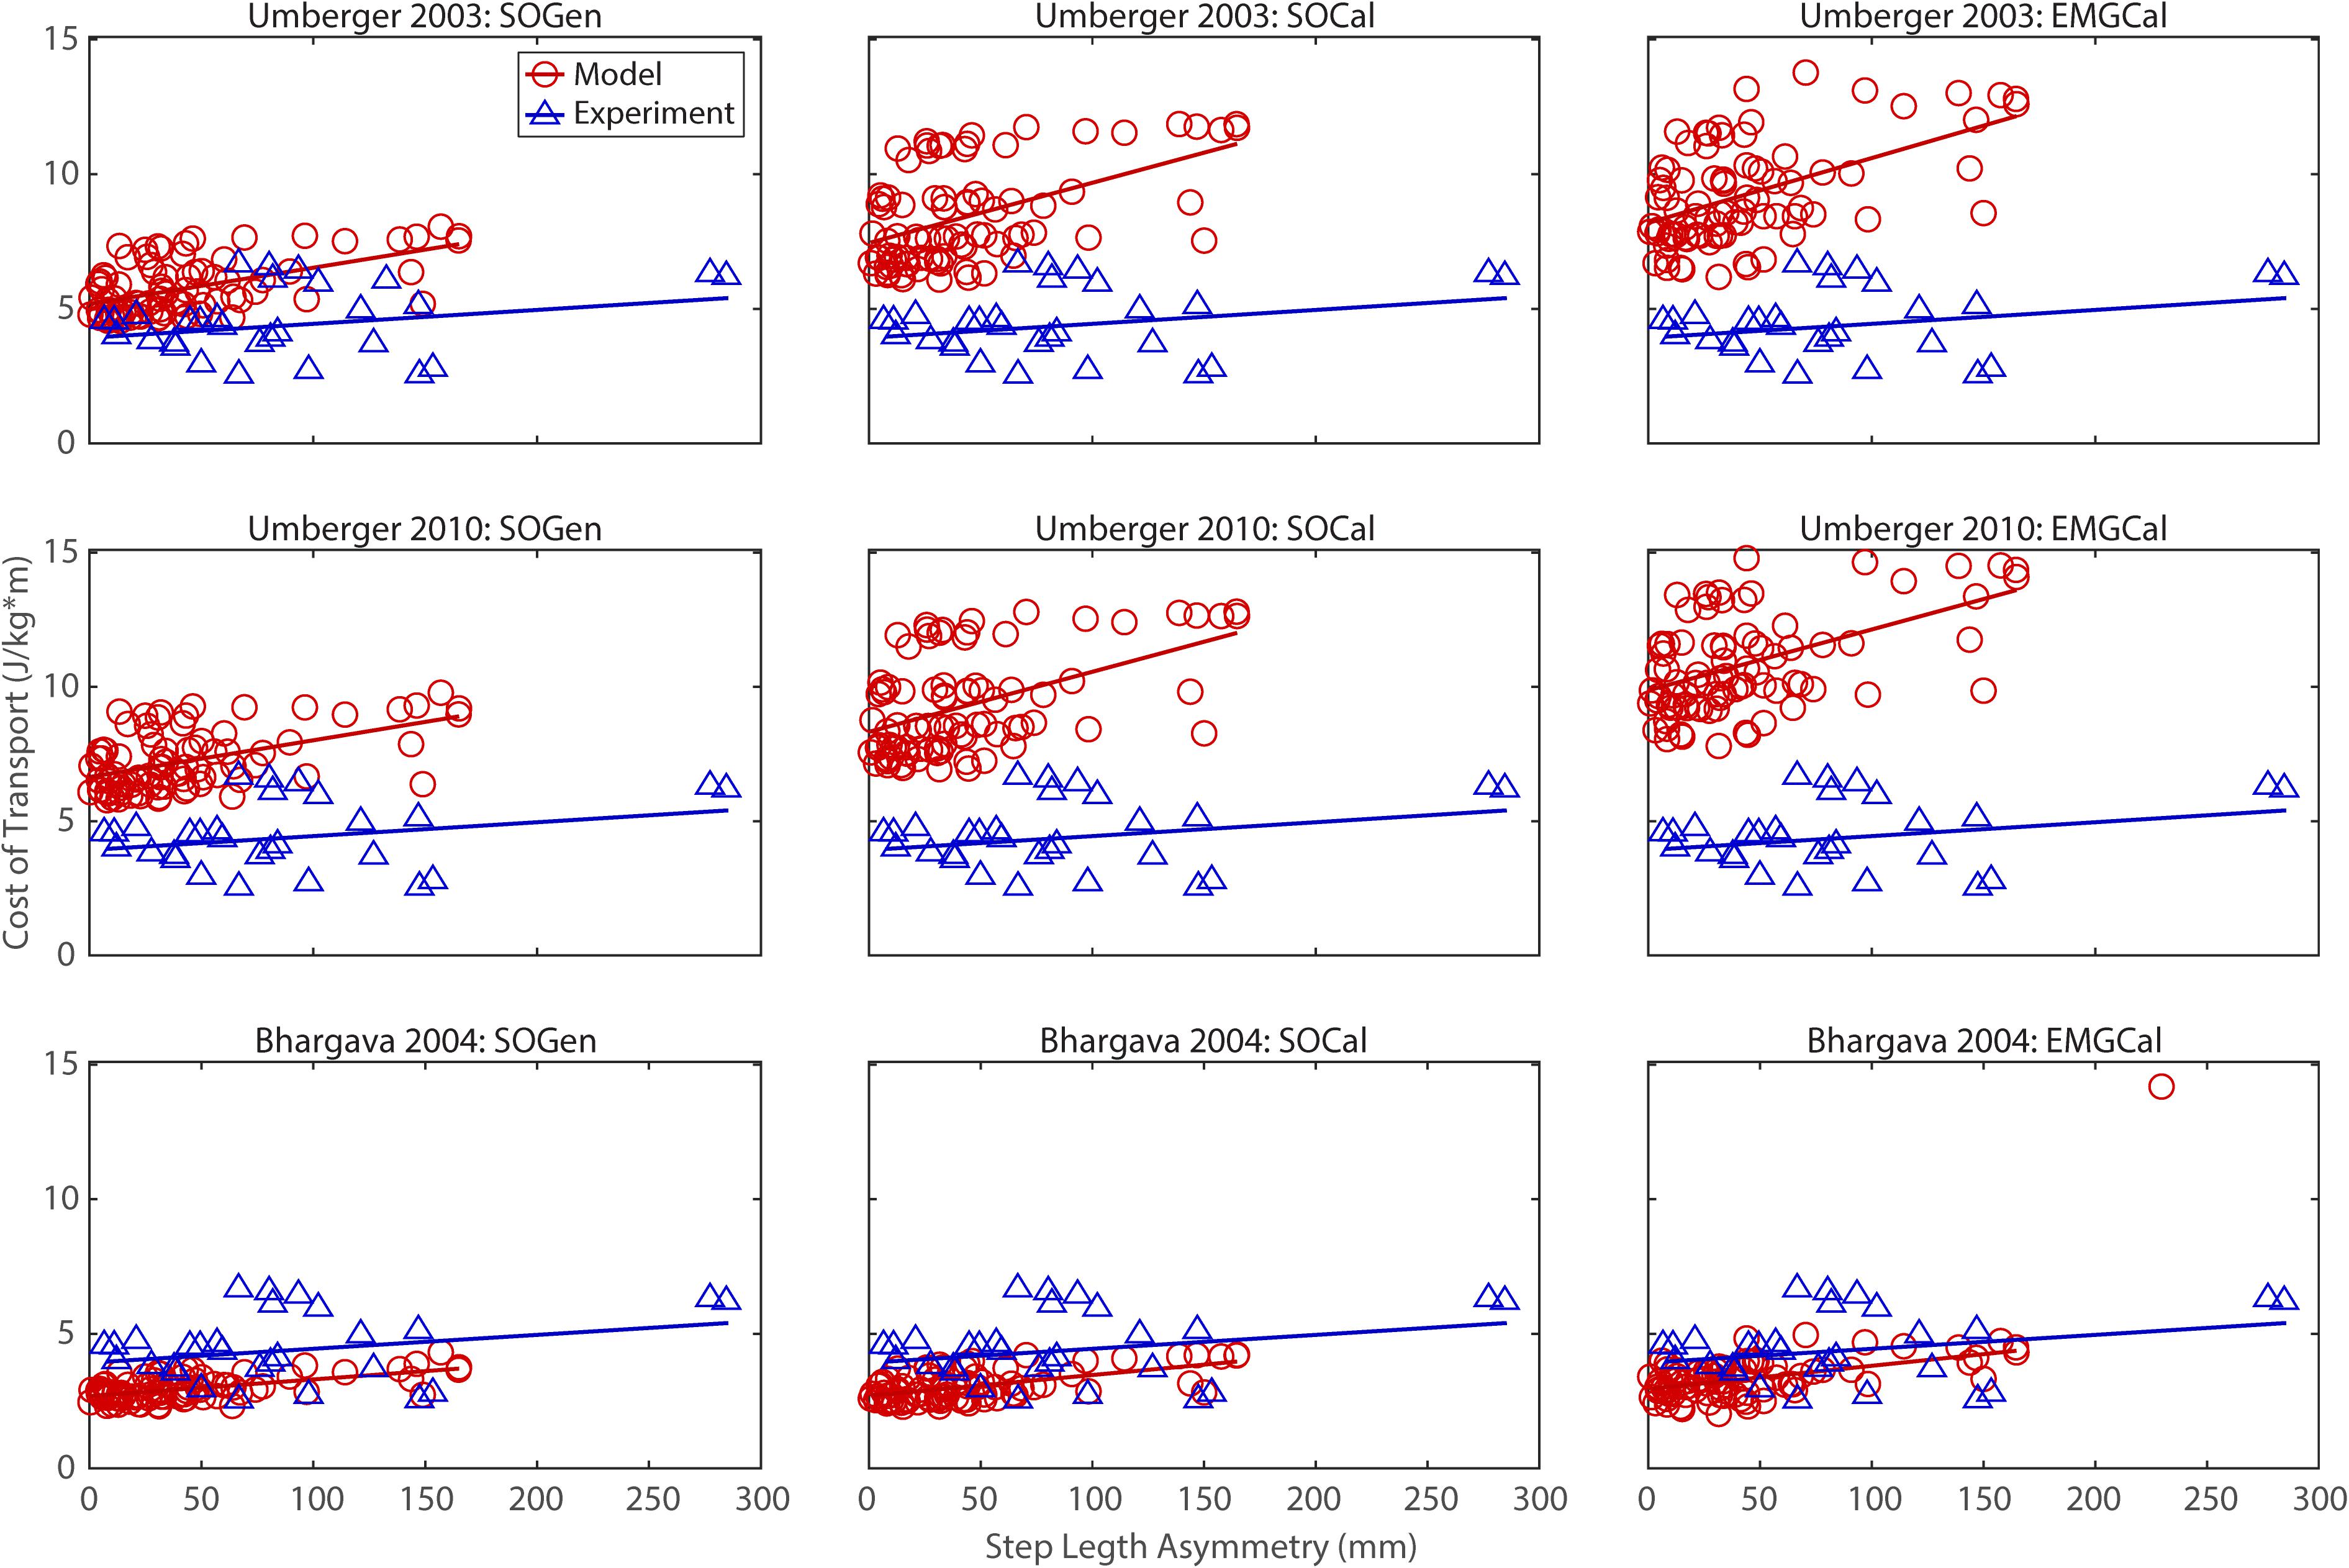
Figure 3. Comparison of model predicted (red circles) and experimentally measured (blue triangles) cost of transport as a function of step length asymmetry between paretic and non-paretic legs. See Figure 2 caption for additional details.
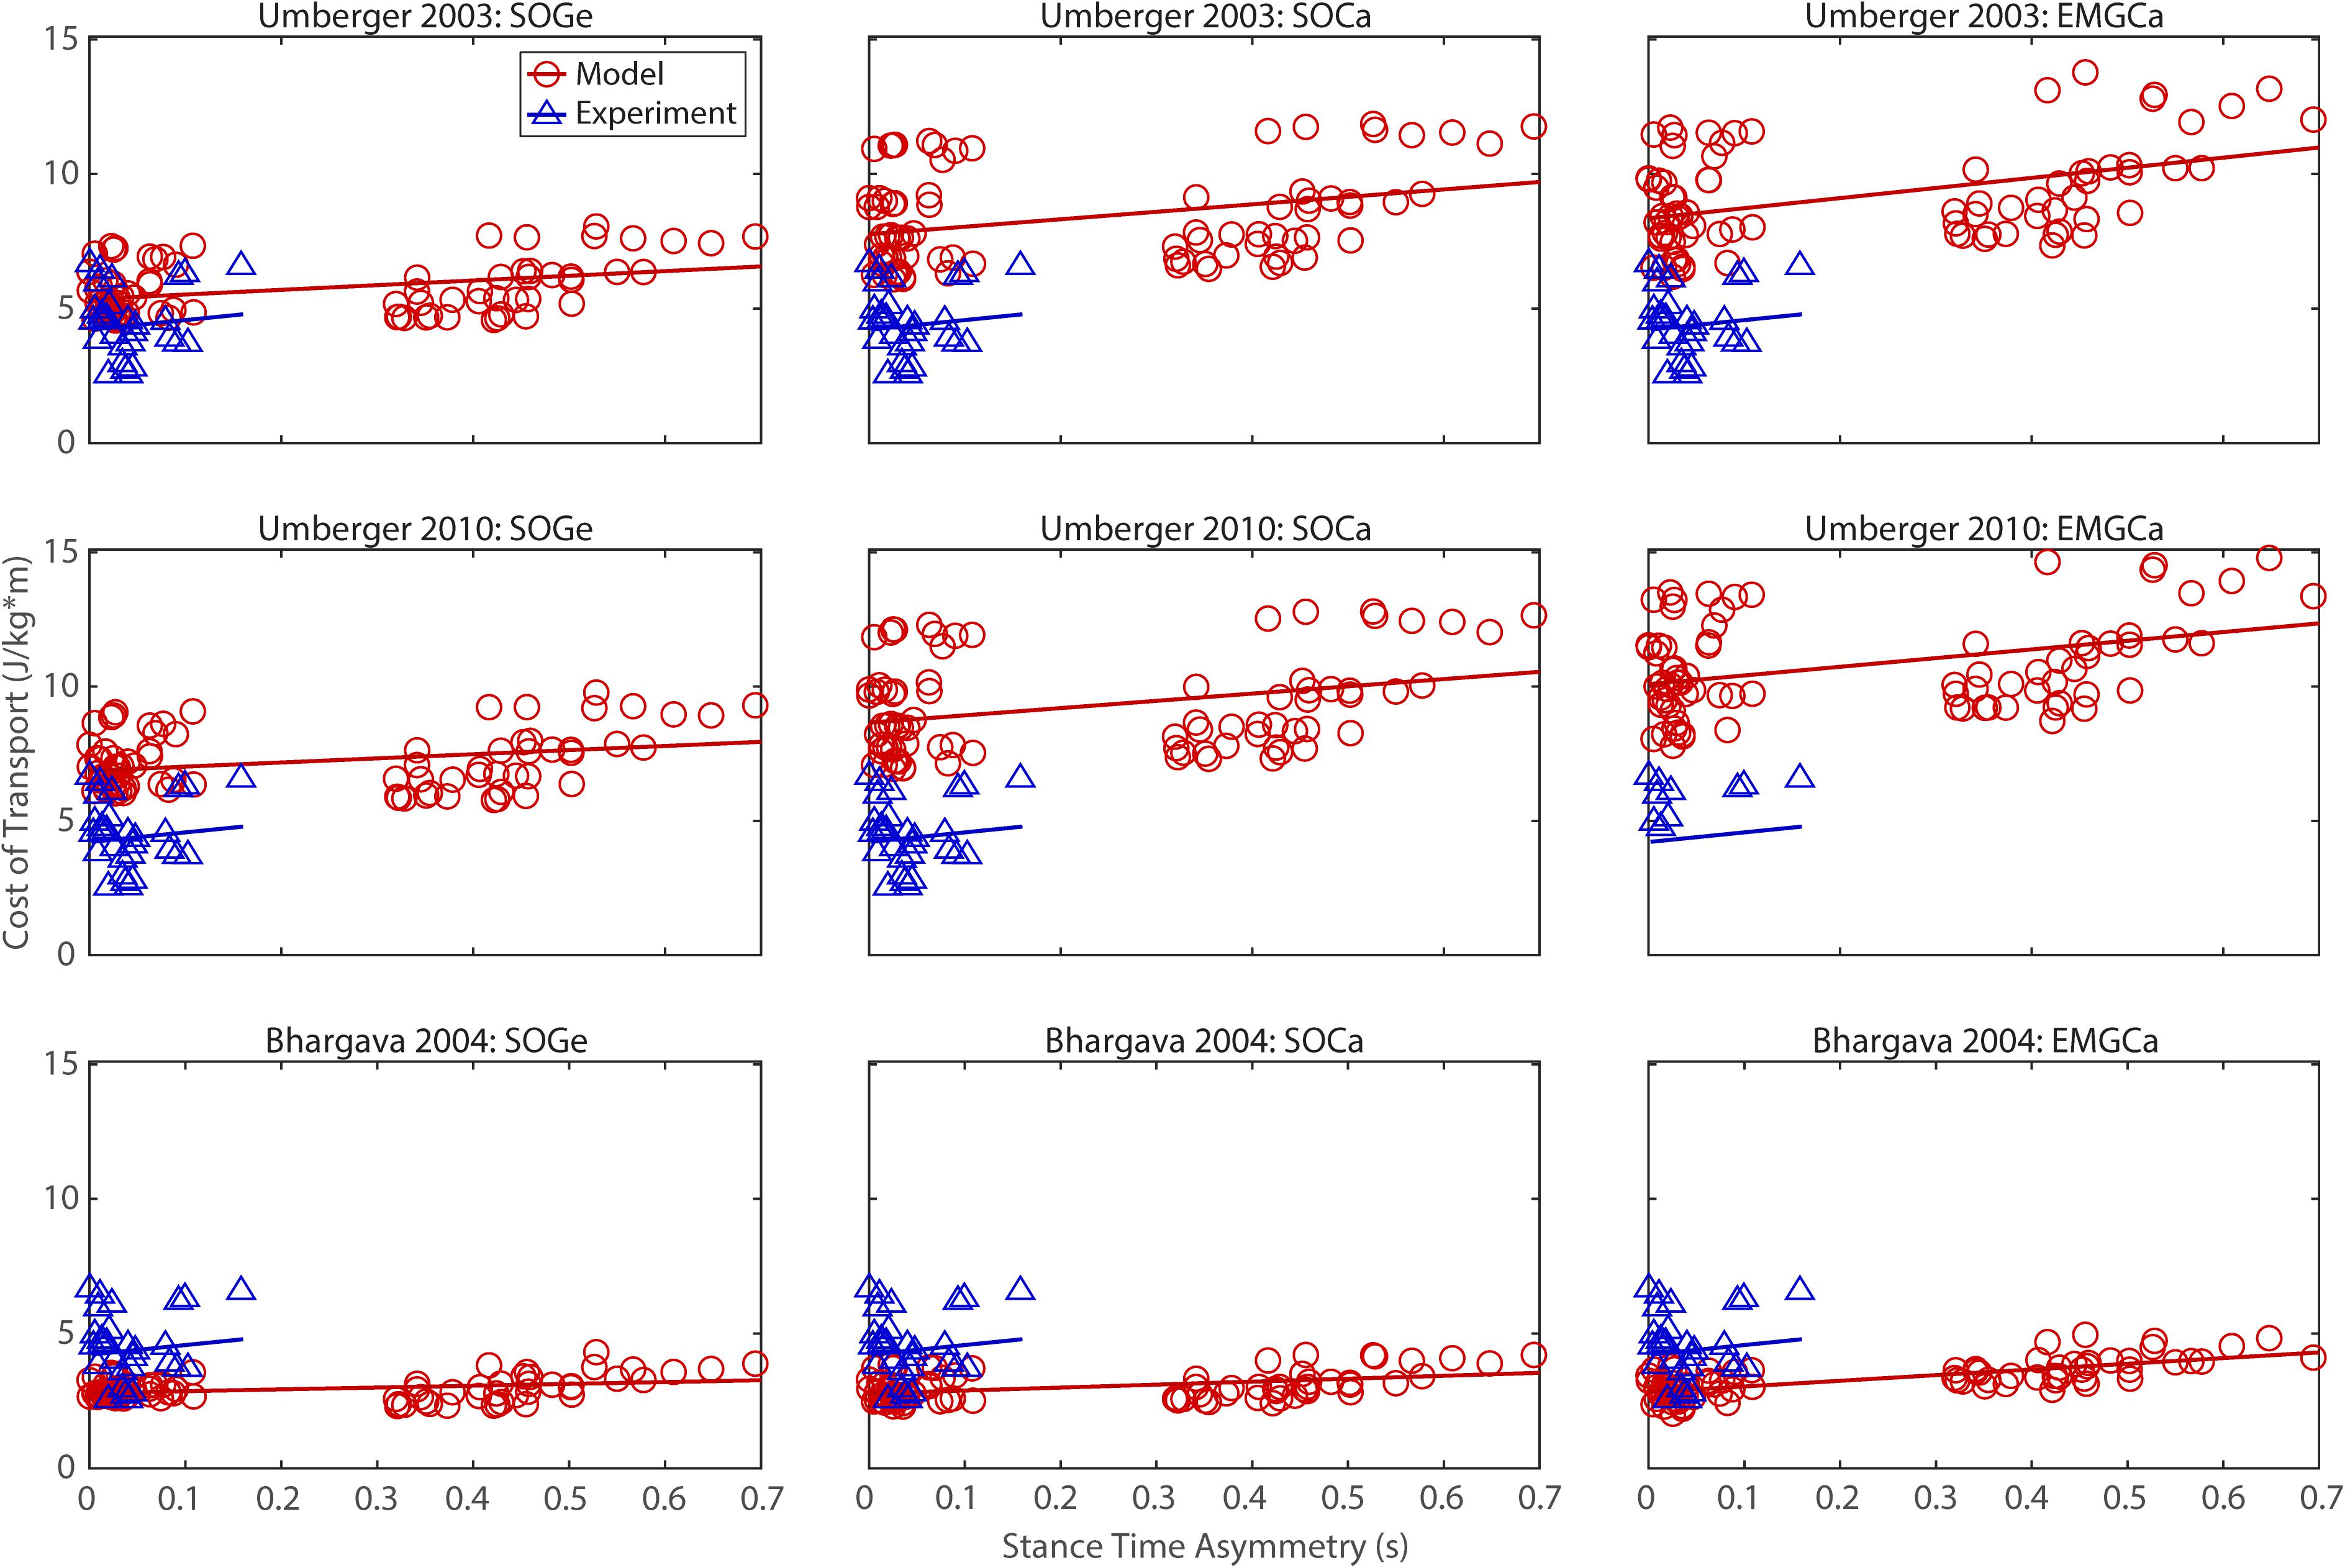
Figure 4. Comparison of model predicted (red circles) and experimentally measured (blue triangles) cost of transport as a function of stance time asymmetry between paretic and non-paretic legs. See Figure 2 caption for additional details.
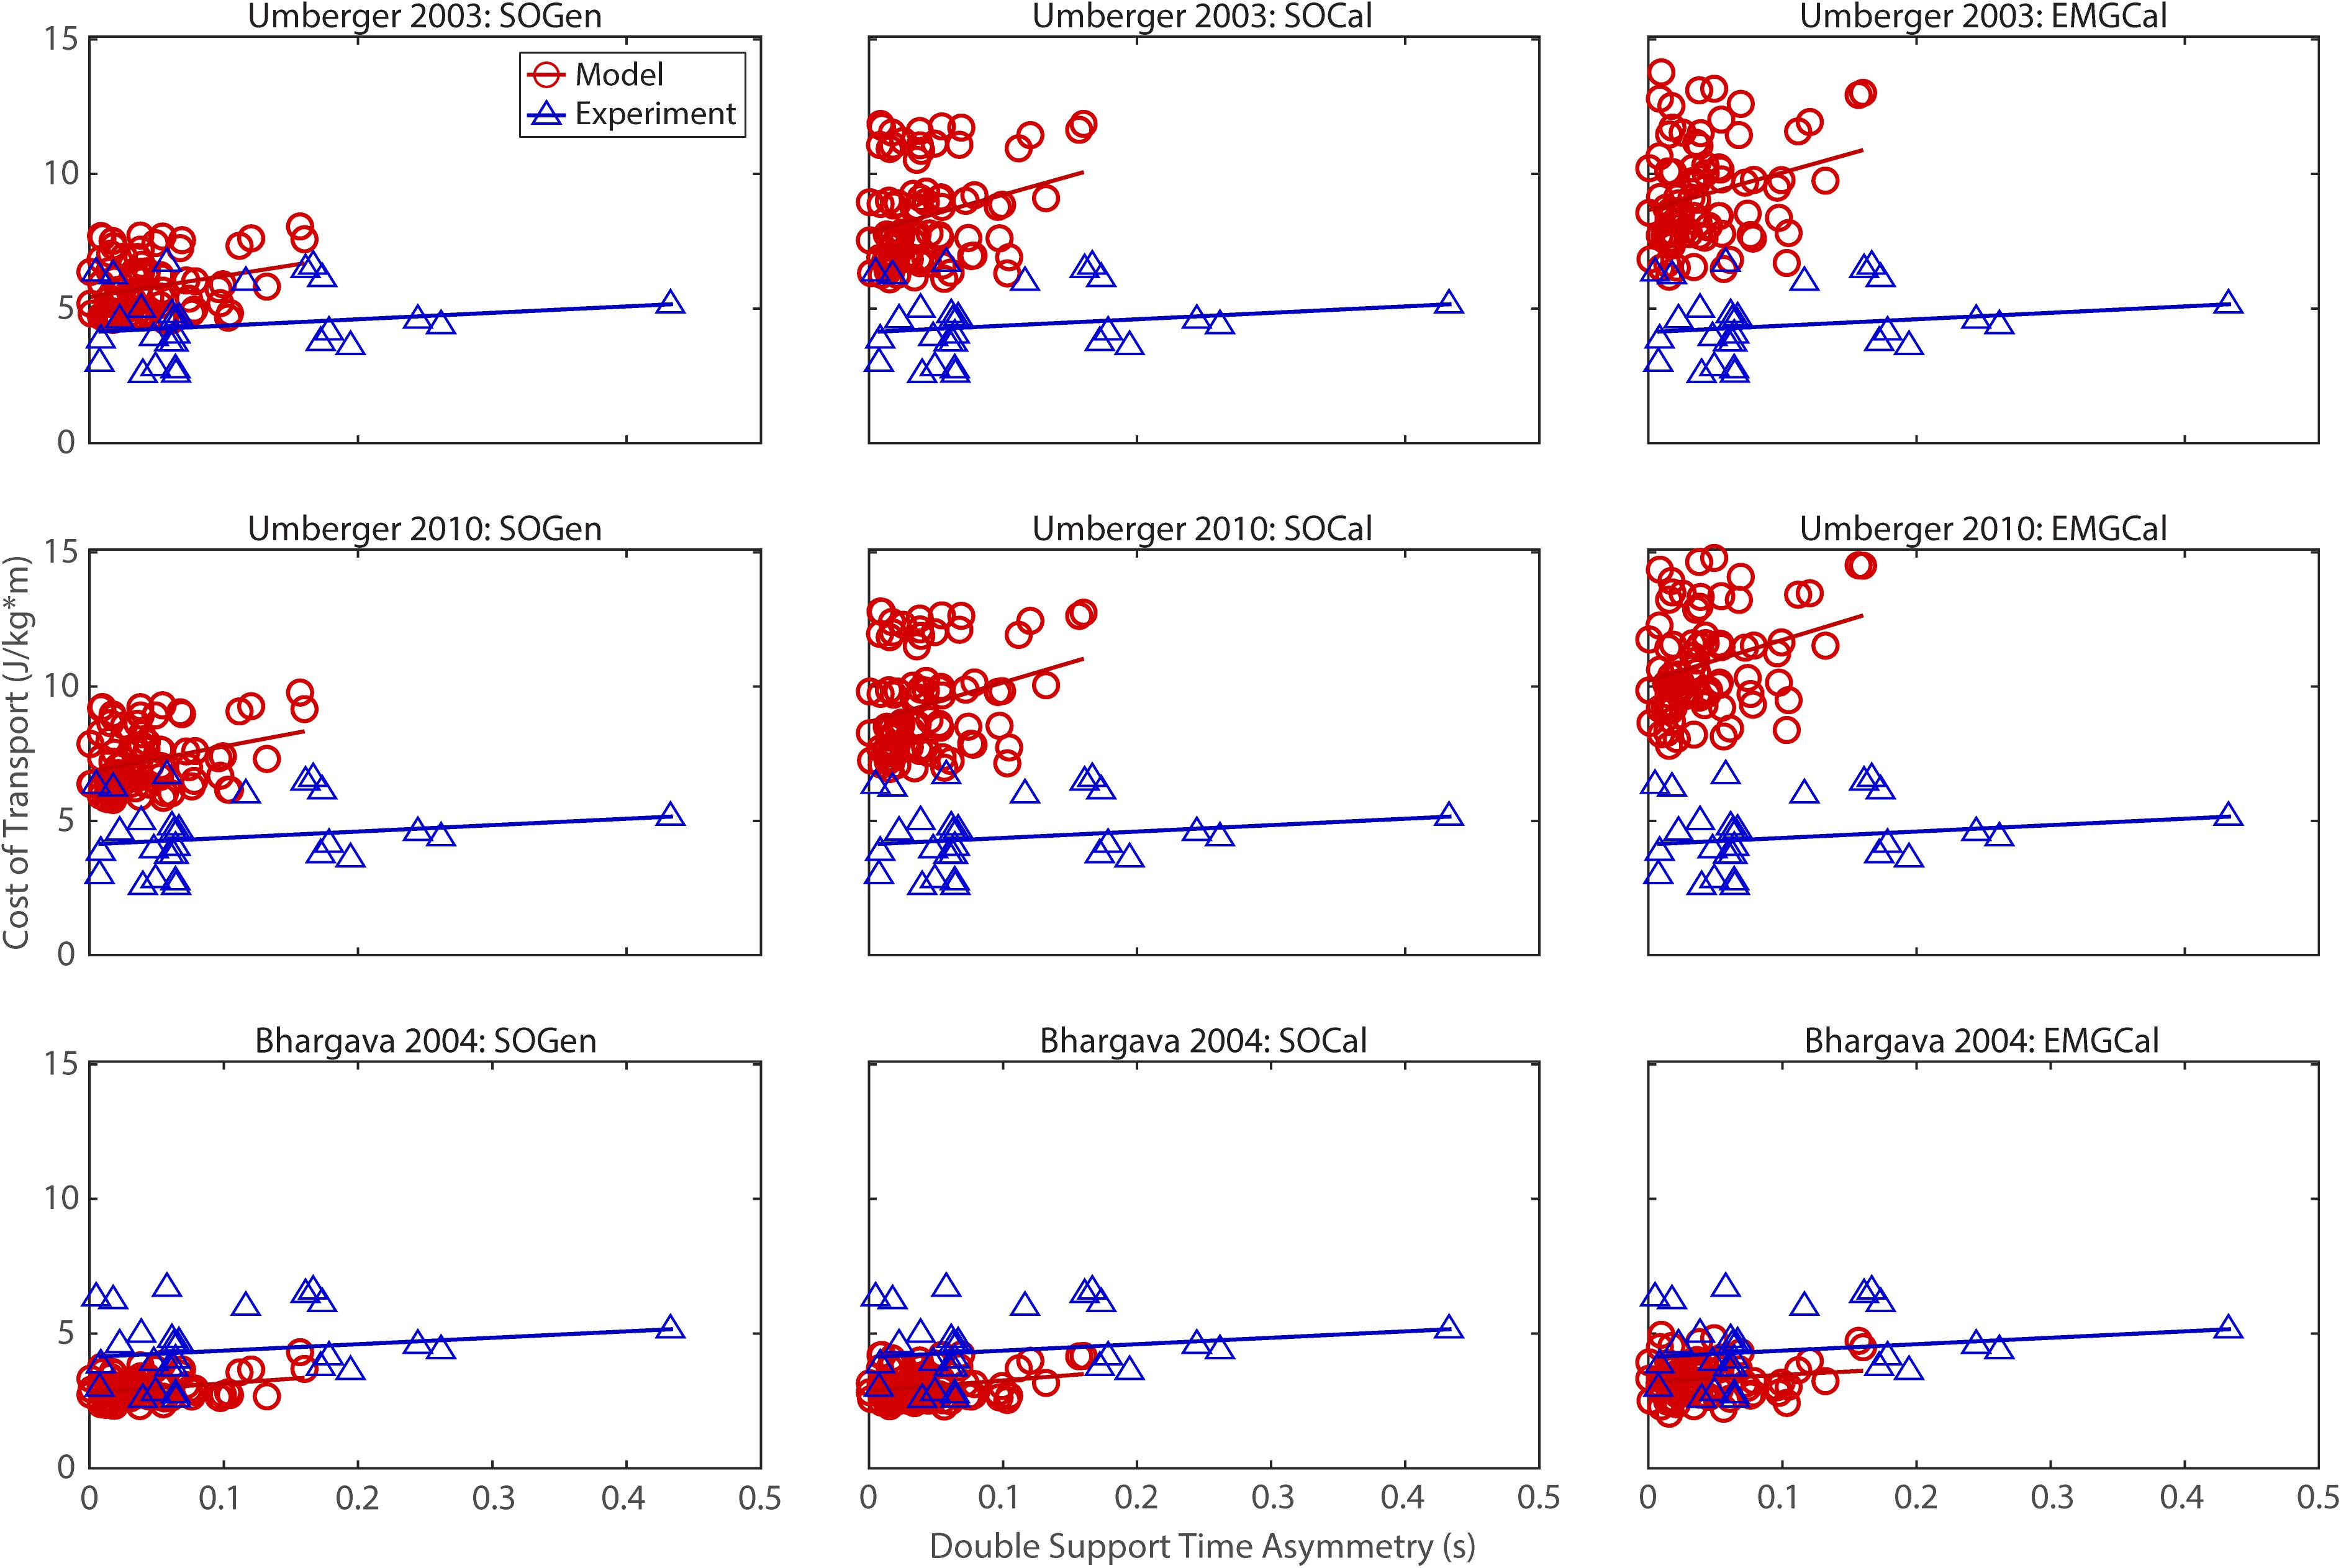
Figure 5. Comparison of model predicted (red circles) and experimentally measured (blue triangles) cost of transport as a function of double support time asymmetry between paretic and non-paretic legs. See Figure 2 caption for additional details.
In contrast, the ability to predict CoT magnitudes consistent with experimental measurements was weak for all nine modeling combinations. Specifically, none of the nine modeling combinations predicted y-intercepts of CoT versus speed, step position asymmetry, stance time asymmetry, or double support time asymmetry regression lines that were statistically similar to those measured experimentally in Finley and Bastian (2017) (all p-values < 0.05). However, when absolute values of y-intercept differences were calculated (Table 4), the Bhargava et al. (2004) metabolic cost model tended to have the smallest differences, consistent with possessing the smallest regression line offsets relative to the experimental regression lines (Figures 2–5). Furthermore, within the Bhargava metabolic cost model, y-intercept differences generally decreased as the level of musculoskeletal model personalization increased, with the EMGCal musculoskeletal model again exhibiting the greatest similarity to experimental measurements.
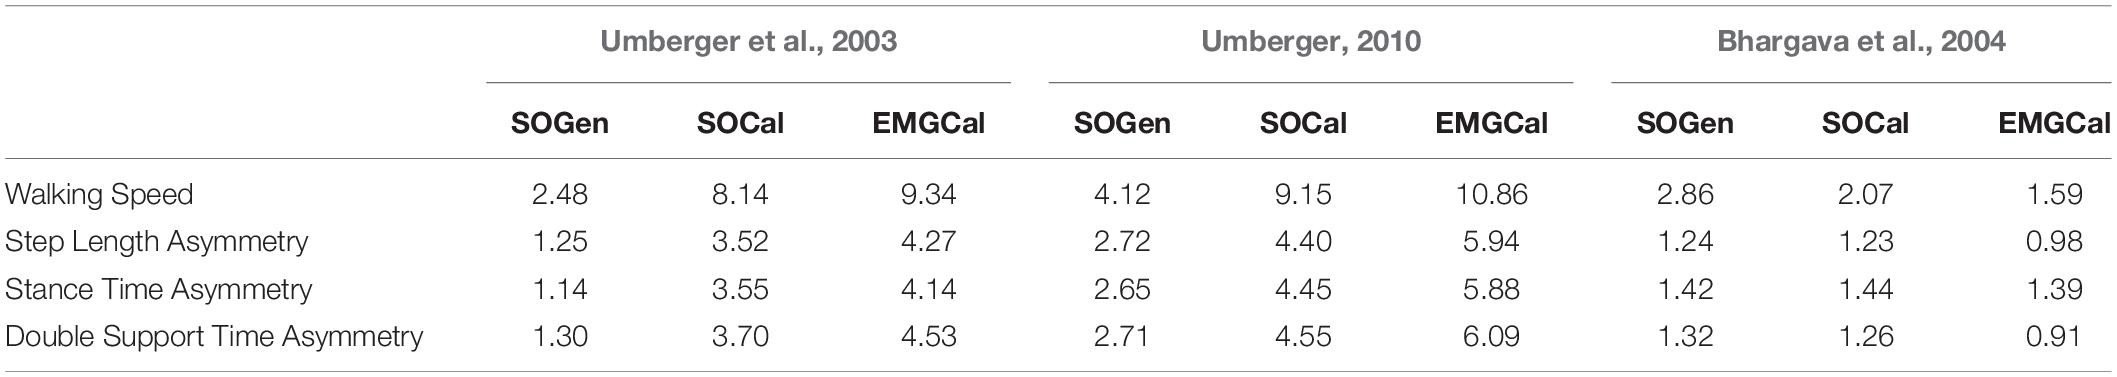
Table 4. Absolute differences in regression line y-intercepts of CoT versus walking speed, step length asymmetry, stance time asymmetry, and double support time asymmetry between the nine model predictions and experimental measurements from Finley and Bastian (2017).
When mean CoT across speeds was compared between each subject used in our study and subjects with comparable Fugl-Meyer scores in Finley and Bastian (2017), the U03-SOGen, B04-SOCal, and B04-EMGCal model combinations exhibited the best ability to predict CoT as a function of Fugl-Meyer score (Table 5). Specifically, for both subjects, U03-SOGen, B04-SOCal, and B04-EMGCal predicted mean CoT values within two standard deviations of the mean CoT value calculated for corresponding subjects in Finley and Bastian (2017). The B04-SOGen mean CoT value for the high functioning subject was also within two standard deviations of Finley and Bastian’s subjects. In addition, all nine modeling combinations predicted a higher mean CoT value for the low functioning subject than for the high functioning subject, in agreement with (Finley and Bastian, 2017).
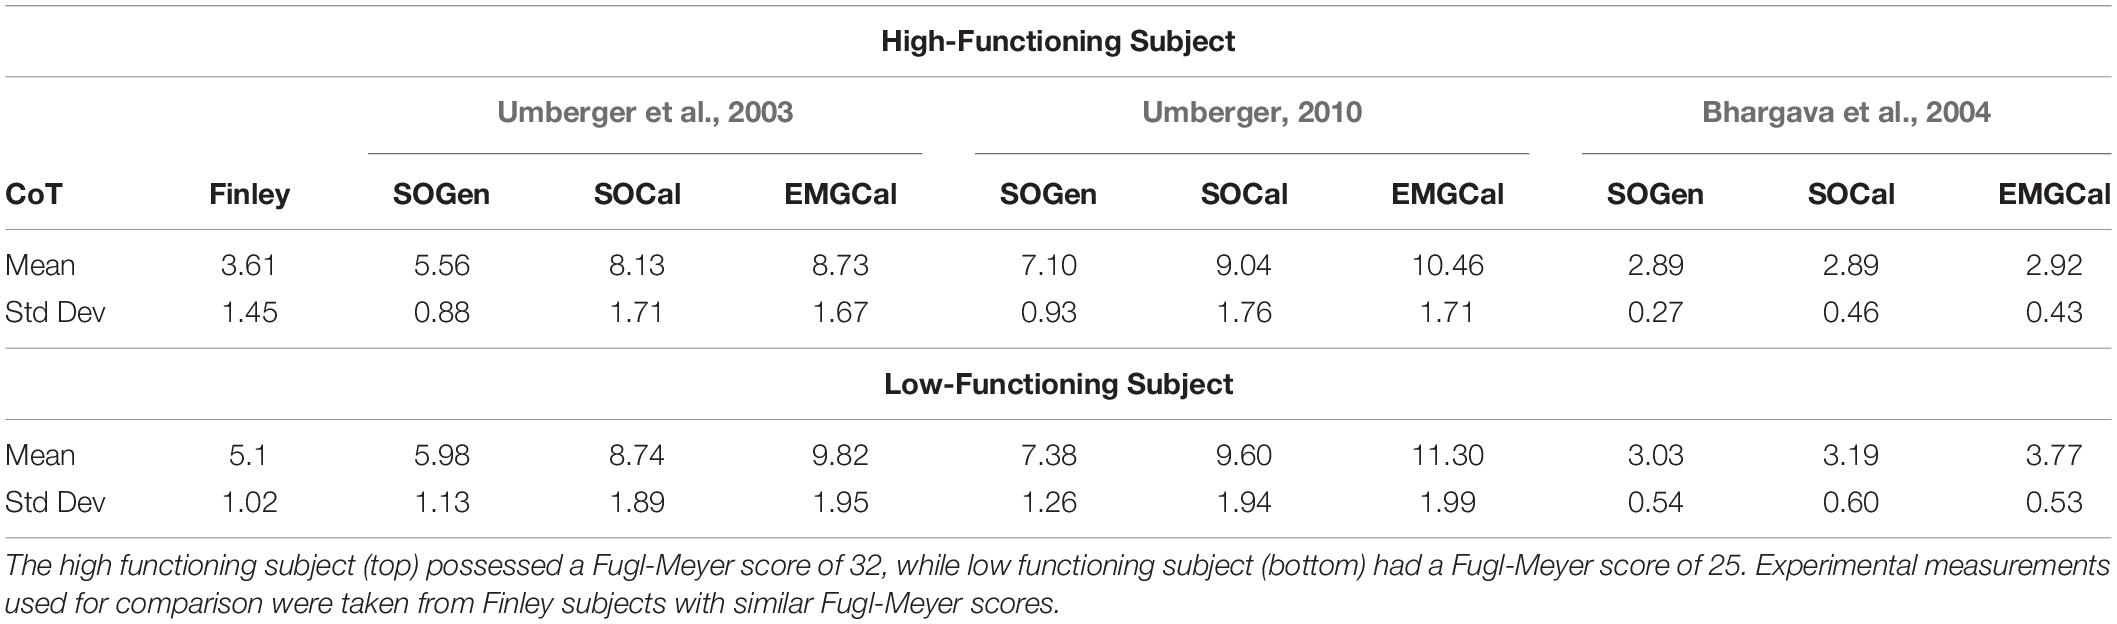
Table 5. Comparison of cost of transport between the nine modeling combinations and the experimental measurements reported in Finley and Bastian (2017) as a function of Fugl-Meyer score.
Discussion
This study evaluated the effect of musculoskeletal model personalization on metabolic cost estimates for walking post-stroke obtained using three published metabolic cost models: Umberger et al. (2003) (U03), Umberger (2010) (U10), and Bhargava et al. (2004) (B04). These three metabolic cost models were implemented within three musculoskeletal models incorporating varying levels of personalization: scaled generic musculoskeletal models with muscle activations found by static optimization (SOGen), calibrated EMG-driven musculoskeletal models with muscle activations found by static optimization (SOCal), and calibrated EMG-driven musculoskeletal models with muscle activations found from experimental EMG data (EMGCal). These nine modeling combinations were investigated using published walking data collected from two individuals post-stroke, and trends in estimated CoT as a function of walking speed, step length asymmetry, stance time asymmetry, and double support time asymmetry were compared with published experimental data collected from individuals post-stroke (Finley and Bastian, 2017). All nine modeling combinations predicted the correct positive and negative correlations between CoT and the four selected quantities (excluding Fugl-Meyer score) as observed in Finley and Bastian’s post-stroke population. However, for the four other quantities, only the personalized musculoskeletal models (SOCal and EMGCal) paired with the Bhargava et al. (2004) metabolic cost model produced slopes that were statistically similar to those calculated from Finley and Bastian’s experimental data. Specifically, B04-EMGCal exhibited the strongest similarities to Finley and Bastian (2017) as noted by p-values that were all greater than 0.2 (Table 3). Although B04-SOCal and B04-EMGCal were the only modeling combinations that produced slopes for CoT versus speed regression lines that were statistically similar to Finley and Bastian (2017), B04-SOCal’s p-value of 0.073 approached a statistically significant difference. In addition, between these two modeling combinations, B04-EMGCal produced y-intercepts for CoT versus speed regression lines that were closest to Finley and Bastian (2017). While we could not investigate thoroughly the relationship between CoT and Fugl-Meyer score due to having only two subjects in our study, B04-EMGCal was still one of the best model combinations for consistency with (Finley and Bastian, 2017). These findings suggest that a calibrated EMG-driven musculoskeletal model combined with the Bhargava et al. (2004) metabolic cost model may provide the best CoT estimates during walking for individuals post-stroke.
In general, p-values assessing statistical differences between predicted and measured (Finley and Bastian, 2017) regression slopes of CoT versus walking speed, step length asymmetry, stance time asymmetry, and double support time asymmetry increased as the level of musculoskeletal model personalization increased from B04-SOGen to B04-SOCal and B04-EMGCal. Similarly, absolute differences between predicted and measured regression y-intercepts decreased as the level of musculoskeletal model personalization increased from B04-SOGen to B04-SOCal and B04-EMGCal. This pattern was not observed across musculoskeletal model personalization levels for the Umberger et al. (2003) and Umberger (2010) metabolic cost models. For these models, the magnitudes of predicted CoT values were almost twice as large as the published CoT averages. These observations can be explained by looking at the RMSE errors between muscle activations produced by static optimization to those obtained from the EMG-Driven model (Supplementary Table S3). On average, SOGen produced RMSE errors of 0.13 (±0.10) for the high functioning patient and 0.14 (±0.12) for the low functioning patient. SOCal produced RMSE errors of 0.10 (±0.09) for the high functioning subject and 0.11 (±0.10) for the low functioning subject. Thus, SOGen produced slightly larger RMSE errors than did SOCal. However, due to minimization of muscle activation inherent to static optimization, SOGen and SOCal both struggled to match the larger muscle activations produced in the EMG-driven model. This difference in magnitude is amplified in both of Umberger’s models due to the activation dependent scaling factors associated to the calculation of the maintenance heat rate and the shortening/lengthening heat rate.
Apart from differences in muscle activations, differences in joint moment matching also existed between static optimization and EMG-driven modeling (Supplementary Table S4). On average, due to the omission of calibrated joint functional axes, SOGen produced RMSE errors of 1.52 ± 1.08 Nm for the high functioning subject and 1.89 ± 2.48 Nm for the low functioning subject. In contrast, EMGCal produced RMSE errors of 4.78 ± 1.91 Nm for the high functioning subject and 4.55 ± 2.09 Nm for the low functioning subject. Although the RMSE errors were lower for SOGen than for EMGCal, the average errors in joint moment matching for EMGCal were within the ranges reported by Meyer et al. (2017), even though the present study matched an additional moment at the hip (i.e., internal-external rotation).
For all three levels of musculoskeletal model personalization, the Bhargava et al. (2004) metabolic cost model tended to slightly underestimate the experimental CoT values reported in Finley and Bastian (2017), while the Umberger et al. (2003) and Umberger (2010) metabolic cost models tended to overestimate the experimental values. The same trends were observed in Miller (2014), which compared the performance of B04 and U10, among other models. In contrast to studies like Miller (2014) and Ong et al. (2019), which used a musculoskeletal model combined with the U03 metabolic cost model and predicted CoT values within the range of 2 to 8 J/Kg.m, the U03-SOCal, U03-EMGCal, U10-SOCal, and U10-EMGCal model combinations in our study produced CoT values ranging from 7 to 15 J/Kg.m. This magnitude difference was unexpected but may be due to the minimization of a metabolic cost term within the optimization cost function used for estimating muscle activations in these two previous studies. Furthermore, in contrast to the two studies mentioned above, our study used calibrated EMG-driven models to calculate CoT. The absence of muscle activation minimization may help explain why our EMGCal musculoskeletal model paired with any metabolic cost model produced CoT estimates that were larger than those produced by SOGen and SOCal, as static optimization is known to produce the lowest possible level of muscle co-contraction while still matching the joint moment constraints (Heintz and Gutierrez-Farewik, 2007; Shourijeh and Fregly, 2020).
Although all modeling combinations correctly predicted the positive or negative trends in published experimental CoT data, not all combinations resulted in regression slopes that were statistically similar to those found in Finley and Bastian’s (2017) experimental data. This finding is similar to a recent study by Koelewijn et al. (2019), where several metabolic cost models (including U03 and B04) were shown to predict the correct trends for CoT as a function of walking slope or gait speed in accordance with trends found in the literature (Margaria, 1968). In addition, Koelewijn et al. (2019) found that B04 tended to underestimate CoT values in comparison to experimental values, consistent with our findings.
To improve CoT predictions further, researchers should consider optimizing the various parameters within metabolic cost models, such as maximum muscle stress. As reported in Russell Esposito and Miller (2018), decreasing the maximum muscle stress value increases metabolic cost and vice versa, which could help reduce magnitude discrepancies in CoT predictions. Interestingly, when (Falisse et al., 2019) used the Bhargava et al. (2004) metabolic cost model with different values of maximum muscle stress for different muscles, they obtained reasonable agreement between model predicted and experimentally measured CoT values. Alternatively, one could use a single scale factor to calibrate metabolic cost models as reported in Michaud et al. (2019), who used both B04 and U03 to find good agreement between model predicted and published experimentally measured CoT values.
The most significant limitation of this study was the absence of experimental metabolic cost data for evaluating our model-based estimates. This limitation makes it difficult to determine the accuracy of our modeling methods. Furthermore, none of the musculoskeletal models used in our analyses included muscles to actuate the upper body. Consequently, the calculated CoT for all nine model combinations may be an underestimate. However, since Finley and Bastian’s data set was collected from subjects who were allowed to use handrails, their measurements may also be underestimates. In addition, we were limited to studying only two subjects, since extensive EMG data sets were required to perform the study. In contrast, the data reported in Finley and Bastian (2017) were based on 15 individuals who were more than 6 months post-stroke (58 ± 14 years old) with an average Fugl-Meyer score of 23 ± 6 and an average self-selected speed of 0.43 m/s ± 0.3. Both of our subjects were more than 6 months post-stroke, and the age and Fugl-Meyer score of the high functioning subject exceeded one standard deviation above the average population metrics found in Finley and Bastian (2017) (Table 1). Therefore, our high functioning subject may not have been as well represented in the published data from Finley and Bastian.
Conclusion
In conclusion, this study investigated the effect of musculoskeletal model personalization on estimated metabolic cost for walking post-stroke as calculated using three published metabolic cost models. Previously collected walking data from two stroke survivors were used to analyze correlations between estimated CoT and various variables commonly associated with gait asymmetry. Although all modeling combinations exhibited the correct positive and negative correlations observed in Finley and Bastian (2017), only B04-SOCal and B04-EMGCal produced statistically similar regression slopes to those found in Finley and Bastian for walking speed and all gait asymmetry variables (excluding Fugl-Meyer score). While the regression y-intercepts were not statistically similar to those found in Finley and Bastian (2017), B04-EMGCal produced CoT estimates that were closest in magnitude to those calculated from Finlay and Bastian’s data. Our results suggest that use of a personalized EMG-driven model paired with Bhargava’s metabolic cost model may improve prediction of CoT during walking for individuals post-stroke. Since metabolic cost can be used as a tool to gauge physical exertion, the results of this study may impact scientific, clinical, and engineering fields that target minimization of metabolic cost through surgical or rehabilitation methods.
Data Availability Statement
The experimental data used to perform this study are available at https://simtk.org/projects/cot-personalize.
Ethics Statement
All experimental procedures were approved by the University of Florida Health Science Center Institutional Review Board (IRB-01), and the subject provided written informed consent prior to participation.
Author Contributions
CP and BF performed the experiments. MA performed all model personalization tasks, prepared the figures, and drafted the manuscript. MA and MS analyzed the data. MA, MS, and BF interpreted the results of analyses. All authors revised the manuscript.
Funding
This work was conducted with support from the Cancer Prevention and Research Institute of Texas (grant RR170026 to BF), the National Science Foundation (Graduate Research Fellowship to MA), and the United States Department of Veterans Affairs (Research Career Scientist Award – Rehabilitation R&D #N9274S to CP).
Conflict of Interest
The authors declare that the research was conducted in the absence of any commercial or financial relationships that could be construed as a potential conflict of interest.
Acknowledgments
We would like to thank Dr. James Finley for sharing the published experimental data needed to evaluate our cost of transport predictions.
Supplementary Material
The Supplementary Material for this article can be found online at: https://www.frontiersin.org/articles/10.3389/fbioe.2020.588925/full#supplementary-material
References
American College of Sports Medicine (2000). American College of Sports Medicine Guide to Exercise Testing and Prescription, 6th Edn. Philadelphia, PA: Lippincott Williams & Wilkins.
An, K. N., Takahashi, K., Harrigan, T. P., and Chao, E. Y. (1984). Determination of muscle orientations and moment arms. J. Biomech. Eng. 106, 280–282. doi: 10.1115/1.3138494
Awad, L. N., Bae, J., O’donnell, K., De Rossi, S. M. M., Hendron, K., Sloot, L. H., et al. (2017). A soft robotic exosuit improves walking in patients after stroke. Sci. Transl. Med. 9:eaai9084. doi: 10.1126/scitranslmed.aai9084
Bhargava, L. J., Pandy, M. G., and Anderson, F. C. (2004). A phenomenological model for estimating metabolic energy consumption in muscle contraction. J. Biomech. 37, 81–88. doi: 10.1016/s0021-9290(03)00239-2
Brychta, R., Wohlers, E., Moon, J., and Chen, K. (2010). Energy expenditure: measurement of human metabolism. IEEE Eng. Med. Biol. Mag. 29, 42–47. doi: 10.1109/memb.2009.935463
Buchanan, T. S., Lloyd, D. G., Manal, K., and Besier, T. F. (2005). Estimation of muscle forces and joint moments using a forward-inverse dynamics model. Med. Sci. Sports Exerc. 37, 1911–1916. doi: 10.1249/01.mss.0000176684.24008.6f
Canavan, P. K., Cahalin, L. P., Lowe, S., Fitzpatrick, D., Harris, M., and Plummer-D’Amato, P. (2009). Managing gait disorders in older persons residing in nursing homes: a review of literature. J. Am. Med. Dir. Assoc. 10, 230–237. doi: 10.1016/j.jamda.2009.02.008
Chang, Y.-H., and Kram, R. (1999). Metabolic cost of generating horizontal forces during human running. J. Appl. Physiol. 86, 1657–1662. doi: 10.1152/jappl.1999.86.5.1657
Collins, S. H., Wiggin, M. B., and Sawicki, G. S. (2015). Reducing the energy cost of human walking using an unpowered exoskeleton. Nature 522, 212–215. doi: 10.1038/nature14288
Corbett, D. B., Wanigatunga, A. A., Valiani, V., Handberg, E. M., Buford, T. W., Brumback, B., et al. (2017). Metabolic costs of daily activity in older adults (chores xl) study: design and methods. Contemp. Clin. Trials Commun. 6, 1–8. doi: 10.1016/j.conctc.2017.02.003
Davies, C. T. M. (1980). Effect of air resistance on the metabolic cost and performance of cycling. Eur. J. Appl. Physiol. Occup. Physiol. 45, 245–254. doi: 10.1007/bf00421332
Dembia, C. L., Silder, A., Uchida, T. K., Hicks, J. L., and Delp, S. L. (2017). Simulating ideal assistive devices to reduce the metabolic cost of walking with heavy loads. PLoS One 12:e0180320. doi: 10.1371/journal.pone.0180320
Donelan, J. M., Kram, R., and Kuo, A. D. (2002). Mechanical work for step-to-step transitions is a major determinant of the metabolic cost of human walking. J. Exp. Biol. 205, 3717–3727.
Donelan, J. M., Li, Q., Naing, V., Hoffer, J. A., Weber, D. J., and Kuo, A. D. (2008). Biomechanical energy harvesting: generating electricity during walking with minimal user effort. Science 319, 807–810. doi: 10.1126/science.1149860
Falisse, A., Serrancolí, G., Dembia, C. L., Gillis, J., Jonkers, I., and De Groote, F. (2019). Rapid predictive simulations with complex musculoskeletal models suggest that diverse healthy and pathological human gaits can emerge from similar control strategies. J. R. Soc. Interface 16:20190402. doi: 10.1098/rsif.2019.0402
Fey, N. P., Klute, G. K., and Neptune, R. R. (2012). Optimization of prosthetic foot stiffness to reduce metabolic cost and intact knee loading during below-knee amputee walking: a theoretical study. J. Biomech. Eng. 134:111005. doi: 10.1115/1.4007824
Finley, J. M., and Bastian, A. J. (2017). Associations between foot placement asymmetries and metabolic cost of transport in hemiparetic gait. Neurorehabil. Neural Repair. 31, 168–177. doi: 10.1177/1545968316675428
Finley, J. M., Long, A., Bastian, A. J., and Torres-Oviedo, G. (2015). Spatial and temporal control contribute to step length asymmetry during split-belt adaptation and hemiparetic gait. Neurorehabil. Neural Repair. 29, 786–795. doi: 10.1177/1545968314567149
Franz, J. R., Wierzbinski, C. M., and Kram, R. (2012). Metabolic cost of running barefoot versus shod: is lighter better? Med. Sci. Sport. Exerc. 44, 1519–1525. doi: 10.1249/mss.0b013e3182514a88
Galle, S., Malcolm, P., Collins, S. H., and De Clercq, D. (2017). Reducing the metabolic cost of walking with an ankle exoskeleton: interaction between actuation timing and power. J. Neuroeng. Rehabil. 14:35. doi: 10.1186/s12984-017-0235-0
Gerus, P., Sartori, M., Besier, T. F., Fregly, B. J., Delp, S. L., Banks, S. A., et al. (2013). Subject-specific knee joint geometry improves predictions of medial tibiofemoral contact forces. J. Biomech. 46, 2778–2786. doi: 10.1016/j.jbiomech.2013.09.005
Gnehm, P., Reichenbach, S., Altpeter, E., Widmer, H., and Hoppeler, H. (1997). Influence of different racing positions on metabolic cost in elite cyclists. Med. Sci. Sports Exerc. 29:818. doi: 10.1097/00005768-199706000-00013
Heintz, S., and Gutierrez-Farewik, E. M. (2007). Static optimization of muscle forces during gait in comparison to EMG-to-force processing approach. Gait Posture 26, 279–288. doi: 10.1016/j.gaitpost.2006.09.074
Hug, F. (2011). Can muscle coordination be precisely studied by surface electromyography? J. Electromyogr. Kinesiol. 21, 1–12. doi: 10.1016/J.JELEKIN.2010.08.009
Koelewijn, A. D., Heinrich, D., and van den Bogert, A. J. (2019). Metabolic cost calculations of gait using musculoskeletal energy models, a comparison study. PLoS One 14:e0222037. doi: 10.1371/journal.pone.0222037
Lam, Y. Y., and Ravussin, E. (2016). Analysis of energy metabolism in humans: a review of methodologies. Mol. Metab. 5, 1057–1071. doi: 10.1016/j.molmet.2016.09.005
Lloyd, D. G., and Besier, T. F. (2003). An EMG-driven musculoskeletal model to estimate muscle forces and knee joint moments in vivo. J. Biomech. 36, 765–776. doi: 10.1016/S0021-9290(03)00010-1
Long, L. L. III, and Srinivasan, M. (2013). Walking, running, and resting under time, distance, and average speed constraints: optimality of walk–run–rest mixtures. J. R. Soc. Interface 10:20120980. doi: 10.1098/rsif.2012.0980
Malcolm, P., Derave, W., Galle, S., and De Clercq, D. (2013). A simple exoskeleton that assists plantarflexion can reduce the metabolic cost of human walking. PLoS One 8:e56137. doi: 10.1371/journal.pone.0056137
Margaria, R. (1968). Positive and negative work performances and their efficiencies in human locomotion. Int. Zeitschrift fur Angew. Physiol. Einschl. Arbeitsphysiol. 25, 339–351. doi: 10.1007/BF00699624
Markovitz, G. H., Sayre, J. W., Storer, T. W., and Cooper, C. B. (2004). On issues of confidence in determining the time constant for oxygen uptake kinetics. Br. J. Sports Med. 38, 553–560. doi: 10.1136/bjsm.2003.004721
McDaniel, J., Durstine, J. L., Hand, G. A., and Martin, J. C. (2002). Determinants of metabolic cost during submaximal cycling. J. Appl. Physiol. 93, 823–828. doi: 10.1152/japplphysiol.00982.2001
Meyer, A. J., Eskinazi, I., Jackson, J. N., Rao, A. V., Patten, C., and Fregly, B. J. (2016). Muscle synergies facilitate computational predict ion of subject-specific walking motions. Front. Bioeng. Biotechnol. 4:77. doi: 10.3389/fbioe.2016.00077
Meyer, A. J., Patten, C., and Fregly, B. J. (2017). Lower extremity EMG-driven modeling of walking with automated adjustment of musculoskeletal geometry. PLoS One 12:e0179698. doi: 10.1371/journal.pone.0179698
Mian, O. S., Thom, J. M., Ardigò, L. P., Narici, M. V., and Minetti, A. E. (2006). Metabolic cost, mechanical work, and efficiency during walking in young and older men. Acta Physiol. 186, 127–139. doi: 10.1111/j.1748-1716.2006.01522.x
Michaud, F., Mouzo, F., Lugrís, U., and Cuadrado, J. (2019). Energy expenditure estimation during crutch-orthosis-assisted gait of a spinal-cord-injured subject. Front. Neurorobot. 13:55. doi: 10.3389/fnbot.2019.00055
Miller, R. H. (2014). A comparison of muscle energy models for simulating human walking in three dimensions. J. Biomech. 47, 1373–1381. doi: 10.1016/j.jbiomech.2014.01.049
Miller, R. H., Brandon, S. C. E., and Deluzio, K. J. (2013). Predicting sagittal plane biomechanics that minimize the axial knee joint contact force during walking. J. Biomech. Eng. 135:011007.
Neptune, R. R., and Van Den Bogert, A. J. (1997). Standard mechanical energy analyses do not correlate with muscle work in cycling. J. Biomech. 31, 239–245. doi: 10.1016/s0021-9290(97)00129-2
Ong, C. F., Geijtenbeek, T., Hicks, J. L., and Delp, S. L. (2019). Predicting gait adaptations due to ankle plantarflexor muscle weakness and contracture using physics-based musculoskeletal simulations. PLoS Comput. Biol. 15:e1006993. doi: 10.1371/journal.pcbi.1006993
Rajagopal, A., Dembia, C. L., DeMers, M. S., Delp, D. D., Hicks, J. L., and Delp, S. L. (2016). Full-body musculoskeletal model for muscle-driven simulation of human gait. IEEE Trans. Biomed. Eng. 63, 2068–2079. doi: 10.1109/TBME.2016.2586891
Reinbolt, J. A., Haftka, R. T., Chmielewski, T. L., and Fregly, B. J. (2007). Are patient-specific joint and inertial parameters necessary for accurate inverse dynamics analyses of gait? IEEE Trans. Biomed. Eng. 54, 782–793. doi: 10.1109/tbme.2006.889187
Reinbolt, J. A., Haftka, R. T., Chmielewski, T. L., and Fregly, B. J. (2008). A computational framework to predict post-treatment outcome for gait-related disorders. Med. Eng. Phys. 30, 434–443. doi: 10.1016/J.MEDENGPHY.2007.05.005
Reinbolt, J. A., Schutte, J. F., Fregly, B. J., Il, B., Haftka, R. T., George, A. D., et al. (2005). Determination of patient-specific multi-joint kinematic models through two-level optimization. J. Biomech. 38, 621–626. doi: 10.1016/j.jbiomech.2004.03.031
Roberts, T. J., Kram, R., Weyand, P. G., and Taylor, C. R. (1998). Energetics of bipedal running. I. Metabolic cost of generating force. J. Exp. Biol. 201, 2745–2751.
Russell Esposito, E., and Miller, R. H. (2018). Maintenance of muscle strength retains a normal metabolic cost in simulated walking after transtibial limb loss. PLoS One 13:e0191310. doi: 10.1371/journal.pone.0191310
Sartori, M., Reggiani, M., Farina, D., and Lloyd, D. G. (2012). EMG-driven forward-dynamic estimation of muscle force and joint moment about multiple degrees of freedom in the human lower extremity. PLoS One 7:e52618. doi: 10.1371/journal.pone.0052618
Sauder, N. R., Meyer, A. J., Allen, J. L., Ting, L. H., Kesar, T. M., and Fregly, B. J. (2019). Computational design of FastFES treatment to improve propulsive force symmetry during post-stroke gait: a feasibility study. Front. Neurorobotics 13:80. doi: 10.3389/fnbot.2019.00080
Seth, A., Hicks, J. L., Uchida, T. K., Habib, A., Dembia, C. L., Dunne, J. J., et al. (2018). OpenSim: simulating musculoskeletal dynamics and neuromuscular control to study human and animal movement. PLoS Comput. Biol. 14:e1006223. doi: 10.1371/journal.pcbi.1006223
Shao, Q., Bassett, D. N., Manal, K., and Buchanan, T. S. (2009). An EMG-driven model to estimate muscle forces and joint moments in stroke patients. Comput. Biol. Med. 39, 1083–1088. doi: 10.1016/j.compbiomed.2009.09.002
Shourijeh, M. S., and Fregly, B. J. (2020). Muscle synergies modify optimization estimates of joint stiffness during walking. J. Biomech. Eng. 142:011011. doi: 10.1115/1.4044310
Silder, A., Whittington, B., Heiderscheit, B., and Thelen, D. G. (2007). Identification of passive elastic joint moment-angle relationships in the lower extremity. J. Biomech. 40, 2628–2635. doi: 10.1016/j.jbiomech.2006.12.017
Teunissen, L. P. J., Grabowski, A., and Kram, R. (2007). Effects of independently altering body weight and body mass on the metabolic cost of running. J. Exp. Biol. 210, 4418–4427. doi: 10.1242/jeb.004481
Uchida, T. K., Seth, A., Pouya, S., Dembia, C. L., Hicks, J. L., and Delp, S. L. (2016). Simulating ideal assistive devices to reduce the metabolic cost of running. PLoS One 11:e0163417. doi: 10.1371/journal.pone.0163417
Umberger, B. R. (2010). Stance and swing phase costs in human walking. J. R. Soc. Interface 7, 1329–1340. doi: 10.1098/rsif.2010.0084
Umberger, B. R., Gerritsen, K. G. M., and Martin, P. E. (2003). A model of human muscle energy expenditure. Comput. Methods Biomech. Biomed. Engin. 6, 99–111. doi: 10.1080/1025584031000091678
van der Woude, L. H. V., Horstman, A., Faas, P., Mechielsen, S., Bafghi, H. A., and de Koning, J. J. (2008). Power output and metabolic cost of synchronous and asynchronous submaximal and peak level hand cycling on a motor driven treadmill in able-bodied male subjects. Med. Eng. Phys. 30, 574–580. doi: 10.1016/j.medengphy.2007.06.006
Keywords: metabolic cost, musculoskeletal model, EMG-driven model, model personalization, stroke, gait
Citation: Arones MM, Shourijeh MS, Patten C and Fregly BJ (2020) Musculoskeletal Model Personalization Affects Metabolic Cost Estimates for Walking. Front. Bioeng. Biotechnol. 8:588925. doi: 10.3389/fbioe.2020.588925
Received: 29 July 2020; Accepted: 04 November 2020;
Published: 26 November 2020.
Edited by:
Nicola Francesco Lopomo, University of Brescia, ItalyReviewed by:
Claudio Pizzolato, Griffith University, AustraliaWei Meng, Wuhan University of Technology, China
Copyright © 2020 Arones, Shourijeh, Patten and Fregly. This is an open-access article distributed under the terms of the Creative Commons Attribution License (CC BY). The use, distribution or reproduction in other forums is permitted, provided the original author(s) and the copyright owner(s) are credited and that the original publication in this journal is cited, in accordance with accepted academic practice. No use, distribution or reproduction is permitted which does not comply with these terms.
*Correspondence: Benjamin J. Fregly, ZnJlZ2x5QHJpY2UuZWR1