Abstract
A vibrating screen is important equipment in industrial production. According to the principle of bionics, a vibrating screen can be divided into a linear vibrating screen, elliptical vibrating screen, ball vibrating screen, and banana vibrating screen. There are also great problems with the use of a vibrating screen. The vibrating screen works due to the vibration excitation force generated by vibration. This work studies the motion trajectory of a vibrating screen by taking the vibrating screen with line motion trajectory as the research object. In this study, the vibration information is detected by an intelligent sensor, and the signal is filtered by an intelligent algorithm. Then, the spherical error compensation is used to improve the calculation accuracy, and the least square method is used to evaluate the error. Finally, the accurate vibration trajectory of the vibrating screen is obtained. The acquisition of a vibration track can provide the working efficiency and safety performance of the vibrating screen, and has social and economic benefits.
Introduction
At present, the vibrating screen at home and abroad has the characteristics of high efficiency and high reliability. The working performance of the vibrating screen has been continuously optimized. With the development of the economy, some equal energy vibrating screens such as small vibrating screen and artificial vibrating screen cannot meet people’s needs in life and industry. The development of vibrating screens in China tends to be large-scale and intelligent.
1) Because a large-scale vibrating screen is complex in structural stiffness and strength, and its screen surface mesh is also difficult to manufacture, the service life of the large-scale vibrating screen is relatively low due to structural problems, so it is difficult to manufacture. Although the manufacturing process of a large vibrating screen is cumbersome, especially in terms of its stiffness and strength, the advantages of the large vibrating screen in work cannot be achieved by a small vibrating screen. For example, in the screening stage, the screen surface ratio of a large vibrating screen is large, so the screening efficiency is relatively high (Guo and Kuang, 2009; Wang, 2010; Zhang et al., 2013).
2) The intelligent vibrating screen is also increasingly favored by many enterprises and factories. At present, the vibrating screen is connected with computer software to realize the intelligent vibrating screen (Hou et al., 2003; Kuang, 2009; Du and Chen, 2010). At present, advanced enterprises and factories at home and abroad use the most advanced, reliable, and practical monitoring instruments, use the optimization method of establishing a mathematical model, and conduct timely monitoring and diagnosis of the working and fault state of the elliptical vibrating screen through accurate computer calculation, so as to liberate the vibrating screen from simple mechanical operations. The serialization of a vibrating screen can enable its parameters to be debugged during its work so that it can work within a normal working range, which can not only improve its working efficiency but also prolong its working life (Duan and Guo, 2009; Wang, 2010; Peng, 2012; Zhang and Zhu, 2012). With the development of intelligence, the machine can effectively replace artificial dullness in hearing, vision, and touch, and make use of accurate mathematical models in the process of machine work and high-speed computer programs to achieve rapid real-time detection and control of the machine. Spherical error compensation will be introduced to improve trajectory accuracy.
The development trend at home and abroad should be toward large-scale standardization and serialization, which not only greatly improves the working efficiency of the vibrating screen but also makes the vibrating screen more widely used, and the economic value and use value are more comprehensively applied (Hou et al., 2003; Jiao et al., 2006).
Composition and Working Principle of a Monitoring System
Composition and Working Principle of a Hardware System
The monitoring system used in this study is shown in Table 1:
TABLE 1
| Component name | Piezoelectric gravity sensor | Three-axis output acceleration sensor | 24 V switching power supply | Data acquisition card | Frequency amplifier (transmitter) | Upper computer | Shielding wire |
|---|---|---|---|---|---|---|---|
| Number | 4 | 1 | 1 | 1 | 4 | 1 | Several |
Hardware of the monitoring system.
Special attention should be paid to connecting these components together with shielded wire because the detected signal is relatively weak during detection. If these components are not connected with shielded wire, the detected signal may be disturbed by the surrounding environment and cause distortion to the detected signal.
At present, there are two kinds of gravity sensors in use: one is a dynamic sensor and the other is a dynamic and static sensor (Yan, 2007). Here, the static and dynamic sensor is selected in this design, because the vibrating screen vibrates when working, and the vibration is static and dynamic. The dynamic sensor cannot accurately reflect the dynamic real-time effect, so the static and dynamic sensor should be selected. When selecting the transmitter, the voltage type transmitter should be selected, because the output of the gravity sensor is voltage. If the transmitter selects the current type, the transmitter needs to convert the input voltage of the sensor into current and the output into voltage. The detected signal itself is very weak, through the conversion from voltage to current and then to voltage. It is easy to lose the signal, so the voltage type should be selected when selecting the transmitter (Chen, 2004). Before the test, the hydraulic press shall be used to check each sensor.
The hydraulic press is gradually pressurized, and then the error between the actual pressure and the measured pressure is tested. By debugging the transmitter, the hydraulic press is used to test the error between the actual value and the real value again, and finally, the error of the monitored sensor is minimized to ensure that the accuracy of the sensor will not affect the verification accuracy of the whole experiment. Some results of the verification measurement are shown in Table 2. From the data in the table, we can see that the error of each sensor under load is within the error range, and the error under static load is controlled within 100 kg, which is allowed by industrial production conditions.
TABLE 2
| Sensor1 (channel 1) | Sensor 2 (channel 2) | Sensor 3 (channel 3) | Sensor 4 (channel 4) | ||||||||
|---|---|---|---|---|---|---|---|---|---|---|---|
| Display load | Actual load | Error | Display load | Actual load | Error | Display load | Actual load | Error | Display load | Actual load | Error |
| 221 | 208 | 13 | 506 | 510 | −4 | 119 | 110 | 9 | 505 | 502 | 3 |
| 516 | 503 | 13 | 1,038 | 1,038 | 0 | 517 | 512 | 5 | 1,015 | 1,010 | 5 |
| 1,019 | 1,009 | 10 | 1,545 | 1,545 | 0 | 1,008 | 1,007 | 1 | 1,532 | 1,526 | 6 |
| 1,533 | 1,528 | 5 | 2,130 | 2,132 | 7 | 1,503 | 1,516 | −13 | 2045 | 2045 | 0 |
| 2028 | 2023 | 5 | 2,560 | 2,555 | 5 | 2012 | 2012 | 0 | 2,520 | 2,518 | 2 |
| 2,536 | 2,536 | 0 | 3,040 | 3,040 | 0 | 2,502 | 2,503 | −1 | 3,010 | 3,010 | 0 |
| 3,000 | 3,000 | 0 | 3,560 | 3,564 | −4 | 3,012 | 3,007 | 5 | 3,502 | 3,506 | −4 |
| 3,565 | 3,565 | 0 | 4,000 | 4,010 | −10 | 3,517 | 3,510 | 7 | 4,040 | 4,054 | −14 |
| 4,012 | 4,007 | 5 | 4,507 | 4,527 | −20 | 4,020 | 4,014 | 6 | 4,500 | 4,503 | −3 |
| 4,527 | 4,522 | 5 | 5,020 | 5,030 | −10 | 4,518 | 4,512 | 6 | 5,018 | 5,014 | 4 |
Verification of measurement results.
During measurement, the triaxial voltage signal output acceleration sensor is connected with the frequency amplifier. When the triaxial voltage signal output acceleration sensor is vibrated, its internal piezoelectric plate has a piezoelectric effect. At this time, an alternating charge is generated on its two surfaces. The alternating charge is directly proportional to the force, that is, it is directly proportional to the acceleration of the vibrating screen and passes through the transmitter. The collected signal is transmitted to the data acquisition card in the form of voltage. The data acquisition card converts the voltage into an electrical signal and transmits it to the computer through Ethernet, and then the corresponding software in the computer displays the electrical signal in the form of waves (Xue and Yang, 2002; Zhou, 2004; Zhang et al., 2014). When the vibrating screen vibrates, the piezoelectric gravity sensor placed on the four corners of the vibrating screen receives the impact force from the vibration of the vibrating screen, transmits the collected signal to the computer through the information acquisition card through the frequency amplifier, and the corresponding software in the computer displays the signal collected by the impact force received by the piezoelectric gravity sensor in the form of waves through the operation. The flow chart of the monitoring system of this subject is shown in Figure 1.
FIGURE 1
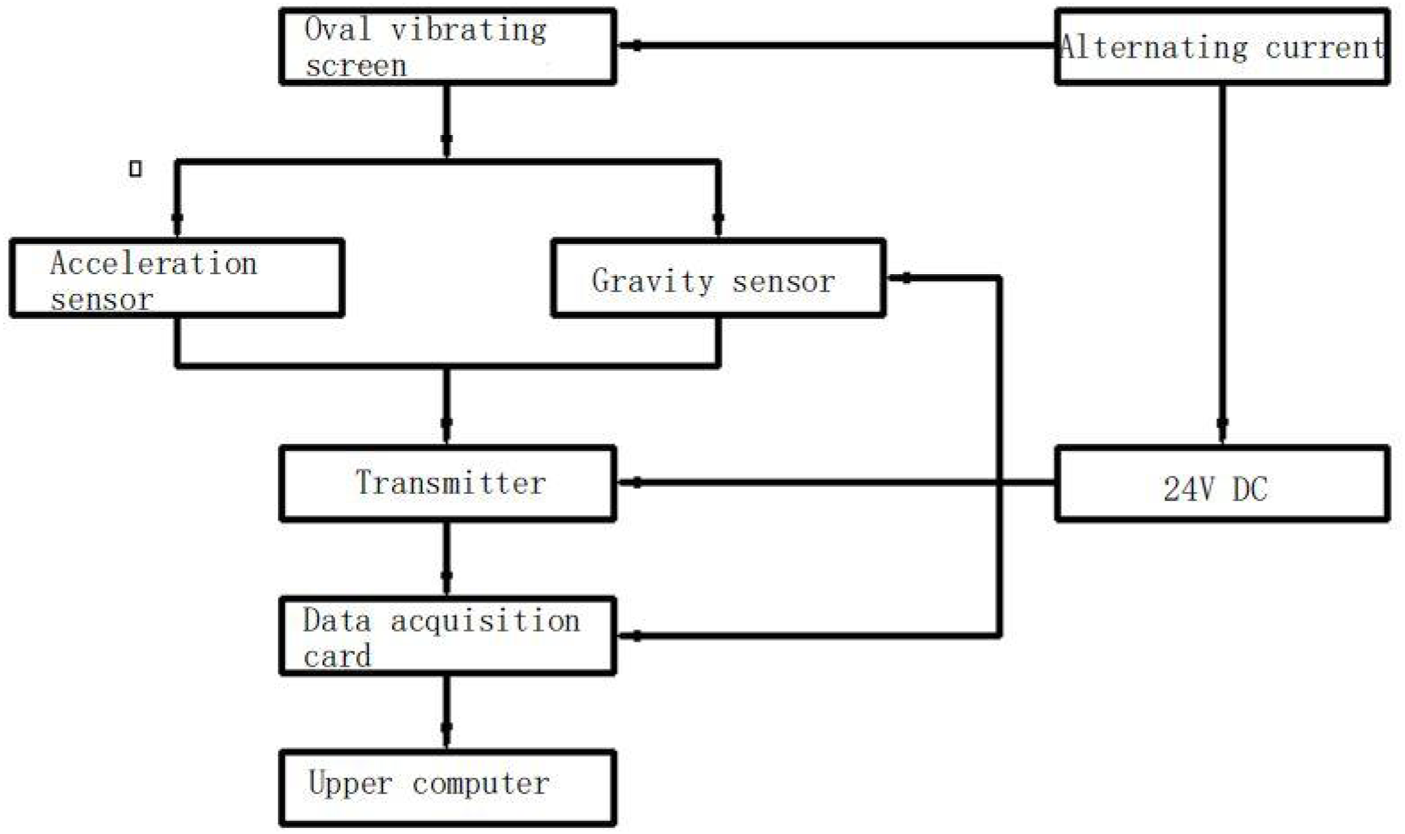
Monitoring system flow.
Working Principle of the Software System
The software system plays a key role in the monitoring and signal acquisition of the vibrating screen. The software system collects the running track of the vibrating screen through the impact of the vibrating screen on the gravity sensor and acceleration sensor, and realizes the monitoring of the vibrating screen and the impact on the ground. The software part uses visual builder software to compile the calculation software in the design process and uses an access database to store data and visualize its design calculation. The software part mainly compiles the changes in images and values in the design so that the gravity sensor can quickly and accurately reflect the impact force when it is impacted by the vibrating screen. When the gravity sensor is impacted by the vibration of the vibrating screen, the computer will accurately display the change of the waveform and the change in the weight value. Special attention is paid to that the gravity and pressure here are the same because the pressure and weight have been converted in the program when writing the software, which not only reduces the error of work but can also improve the efficiency of work. The system software platform consists of the following main parts:
1) Data acquisition module: when the gravity sensor and acceleration sensor are vibrated by the vibrating screen, the monitored data are collected through the compiled software system.
2) Waveform display module: the waveform is displayed on the upper computer by the impact force when the gravity sensor and acceleration sensor are vibrated by the vibrating screen.
3) Data analysis module: when the gravity sensor and acceleration sensor are vibrated by the vibrating screen, the impact force displayed on the upper computer is different from the actual load and the displayed fluctuation error (Xue and Yang, 2002).
4) User operation interface: the setting of the user operation interface makes the vibration signal more visual, intuitive, and controllable. Through the waveform display and data display of the vibration signal in the user interface, the staff can quickly and timely see the changes of the vibration signal, to timely adjust the working performance of the vibrating screen in the case of failure of the vibrating screen.
Data Analysis and Error Compensating
In order to enhance the accuracy, this study puts forward the improved least-squares ellipsoid fitting method. The method is based on the assumption ellipsoid (Madhow and Honig, 1994; Yun et al., 2022). The error compensation coefficient is calculated by the least square method, and the constraint has been solved by the matrix decomposition of the matrix singularity problem to overcome the instability of the algorithm. The approach reduces the amount of calculation time. The software simulation and experiment verify the effectiveness of the algorithm (Schneider, 1979; Jiang et al., 2021a; Huang et al., 2021; Sun et al., 2022).
For a three-axial sensor, its inherent error is mainly characterized by zero error, error sensitivity, orthogonal error, etc. Assuming that the actual output of the sensor is , no error exists for the ideal output , and its mathematical model is expressed as follows:
Error matrix is a third-order diagonal matrix, which stands for the sensitivity of various shaft sensors. stands for non-orthogonality between the axis of the sensors and the soft magnetic material part. Then, a sensor proper reference coordinate system can be established. can be presented by a third-order diagonal matrix. stands for the sensor’s zero error and hard magnetic materials. Error compensation of sensors equals to determine the error coefficient matrix and . By the known actual output , to solve the ideal output , the following equation is used:
In Eq. 2, , .
The vector of is in the form of
At a certain moment for a fixed position, assume that the magnetic field strength and the direction are constant, the rotation of the sensor is in a three-dimensional space, and the ideal output data within the space of trajectory are spherical, thenwhere H means the location of the magnetic field intensity. Combining Eq. 2 with Eq. 4, we can get
where and , based on the assumption that the ellipsoid compensation approach considers the measurements of the actual output trajectory to be an ellipsoid, namely, Eq. 5 said ellipsoid equation of vector. The problem of error compensation of sensors becomes an ellipsoid fitting problem.
Changing Eq. 5 into the general equation of a quadric surface, then we can get
The measurement data of the ellipsoid fitting are to solve the coefficient of the ellipsoid. It is to meet all the sum of the squares of the algebraic distance measurement data to the ellipsoid minimum as .
, which is an matrix.
To guarantee that the quadric surface is an ellipsoid, to satisfy the following constraints,
and. As the free parameters, can be of suitable magnification, making Eq. 8 satisfies .
The solution satisfied the constraint conditions of the matrix Eq. 7, using the Lagrange multiplier method:
By solving Eq. 11, the coefficient of the ellipsoid for the least positive characteristics of the corresponding eigenvectors will be obtained.
According to the special structure of the matrix, through the matrix decomposition, we can overcome the defects of the constraint matrix which is singular, and simplify the feature vector to solve the following equations.
First, and ,then , and , , , and .
We can get the constrain matrix and , , , , making,and,
Substituting the aforementioned matrix decomposition into (11), we can get
When the sampling data are not in the same plane, is a singular matrix [12], finishing available:
Then, Eq. 10 can be changed into
The aforementioned matrix decomposition combines Eq. 11 with Eqs 14–16 solutions that get the minimum corresponding eigenvectors, characteristic root, and plug in Eq. 9. This formula (11) solving the 10-day feature vector into the formula (14) solution of the three-dimensional feature vector to decrease the amount of calculation for about a third of the original, and at the same time, using the improved algorithm on accuracy is consistent with the original algorithm.
According to Eqs 5, 6, matrices , can be obtained, and because of Eq. 10 for amplification coefficient , the matrix is relative. As the absolute value of magnification by Eqs 5, 6, the corresponding relation can be obtained:
Calculated according to Eq. 17, matrices , , and by Eq. 5 work out the corresponding relationship between the error compensation coefficient matrix and , and complete the error compensation.
In order to validate the aforementioned algorithm, simulation software is used. Assuming that the magnetic sensor location in the uniform magnetic field with a magnetic field strength of 0.52 G, we divide the ideal output spherical area into regions, and each segmented region is the random selection of measuring point data (Patel and Holtzman, 1994; Jiang et al., 2019a; Zhao et al., 2022).
To test algorithm’s calculation accuracy, a given magnetic sensor attitude as a benchmark and the computed error compensation of the magnetic sensor course are used. Record of location, respectively, sets the pitching angle and tilt angle, pitching angle and tilt angle, pitching angle and tilt angle, and pitching ngle and tilt angle for the round, and each group of uniform records 36 points. Calculation of the yaw angle error is shown in Figure 2.
FIGURE 2
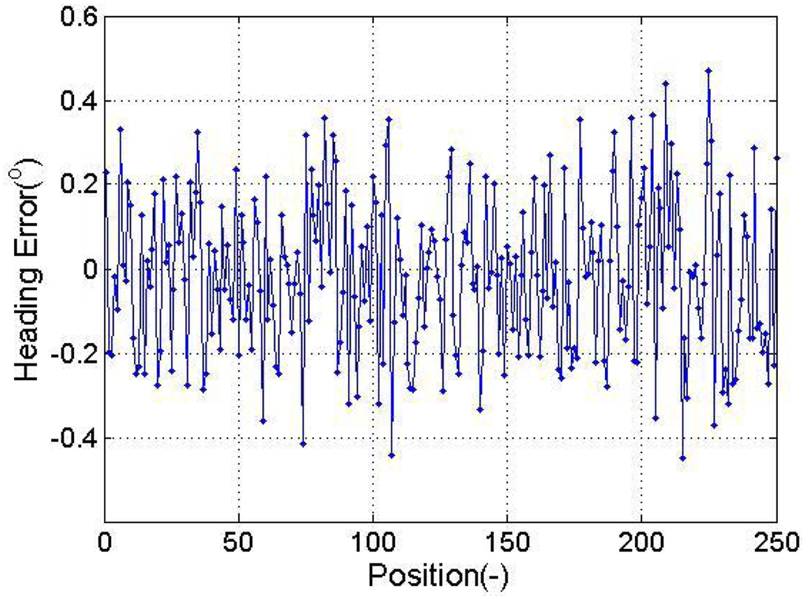
Heading error of simulation.
Acquisition of a Motion Track of the Vibrating Screen
Acquisition of the Vibration Signal
The vibrating screen studied in this work is an elliptical vibrating screen. The motion track of the elliptical vibrating screen is determined by the relationship between the frequency, amplitude, and phase angle of the vibrating screen during vibration. The working principle of the elliptical vibrating screen monitoring system is shown in Figure 3.
FIGURE 3
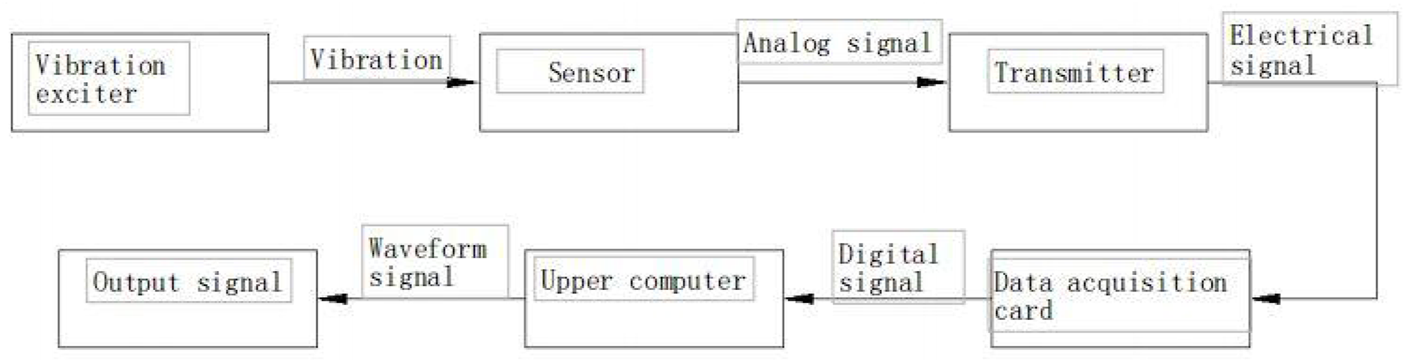
Working principle.
The vibration frequency of the vibrating screen is between 0 and 24 hz and the amplitude is between 0 and 5 mm. After debugging the relevant parameters, the computer, monitoring hardware, and vibrating screen must be energized. Using four steel plate foot sleeves, four gravity sensors are put into the four steel foot sleeves, then four feet of the vibrating screen are put on four sensors. The sensor is under pressure. At this time, the line with the zero waveform starts to fluctuate until the force on the sensor is stable and the wave shape gradually becomes a stable horizontal line, and then the power is turned on. After the power is turned on, the vibrating screen starts to vibrate. With the vibration of the vibrating screen, the gravity sensor will be impacted to varying degrees and then transmitted to the data acquisition card through the transmitter. A continuously changing waveform will be displayed on the waveform display interface of the computer software. The change of the waveform will not only change with different motion frequencies of the vibrating screen but the amplitude of the frequency will also be different with the different impact forces of the vibrating screen. Moreover, this change is generally not periodic, but random (this experiment is carried out when one sensor works, that is, the sensor is placed under one corner of the vibrating screen, and the other three corners are leveled with other articles) (Kohno et al., 1983; Verdu, 1986; Jiang et al., 2019b).
Denoising and Amplification of the Vibration Signal
The vibration signal of the vibrating screen is transmitted to the transmitter by the sensor, then the vibration signal (vibration signal is a non-electric signal) transmitted by the sensor is transformed into a voltage signal under the action of the transmitter, and then the transformed voltage signal is amplified to facilitate the measurement and control of the following signals. Because the vibration signal is weak during detection, it is easily disturbed by the surrounding environment and media during monitoring (Wang, 1998; Woodward and Vucetic, 1998; Jiang et al., 2021b). After being disturbed, the detected signal will produce distortion, as shown in Figure 4, which is the sinusoidal image monitored by vibration signal distortion.
FIGURE 4
Vibration signal distortion.
Most of the reasons for the waveform distortion of the motion track of the vibrating screen are because the accuracy of the acceleration value measured by the acceleration sensor is not high when the vibrating screen is vibrating, so the waveform presented in the upper computer is distorted.
Denoising: for this phenomenon, the general method is to use the fast Fourier transform (FFT) method to solve the problem of inaccurate signals detected by the acceleration sensor. FFT has a fast and prominent amplitude-frequency analysis ability to timely determine the frequency, phase, and amplitude of the waveform, to modify the parameters of the vibrating screen during vibration and ensure the smooth operation of the vibrating screen (Madhow, 1998; Li et al., 2017; Liu et al., 2022a).
Amplification: the internal structure of the transmitter comprises many amplifiers. The vibrator converts the analog signal sent by the sensor into a voltage signal. The amplifier inside the transmitter will amplify the weak voltage signal received. Even if the noise is large, the voltage signal is submerged in the noise (Duel-Hallen et al., 1995; Liu X et al., 2022; Wu et al., 2022). After amplification by the amplifier, the voltage signal is easier to detect.
Calculation of the Vibration Signal
The motion track of the vibrating screen is determined by the relationship between the frequency, amplitude, and phase angle of the vibration. The vibrating screen detects the electrical signal of the acceleration sensor through vibration, expresses the electrical signal in the form of waves through the computer software, and then expresses it in the vibration image of the X, y, and Z axes of the vibrating screen. The motion trajectories of any two axes of three axes are fitted and simulated (Klein et al., 1996; Liu et al., 2022b; Yun et al., 2022).
The following is the relationship expression of amplitude, frequency, and phase angle on three axes:
Time is expressed in twhere A1, A2, and A3 represent the amplitudes in the X, y, and Z axes, respectively;
represent the phase angles on the X and Y axes;
F represents the frequency; and
T represents time.
Because the research object of this study is the elliptical vibrating screen, it is enough to fit the moving track of the vibrating screen as an ellipse with VC + + on the XY axis of the plane coordinate, that is, the ellipse is the moving track of the vibrating screen.
Testing of the Data Acquisition Module
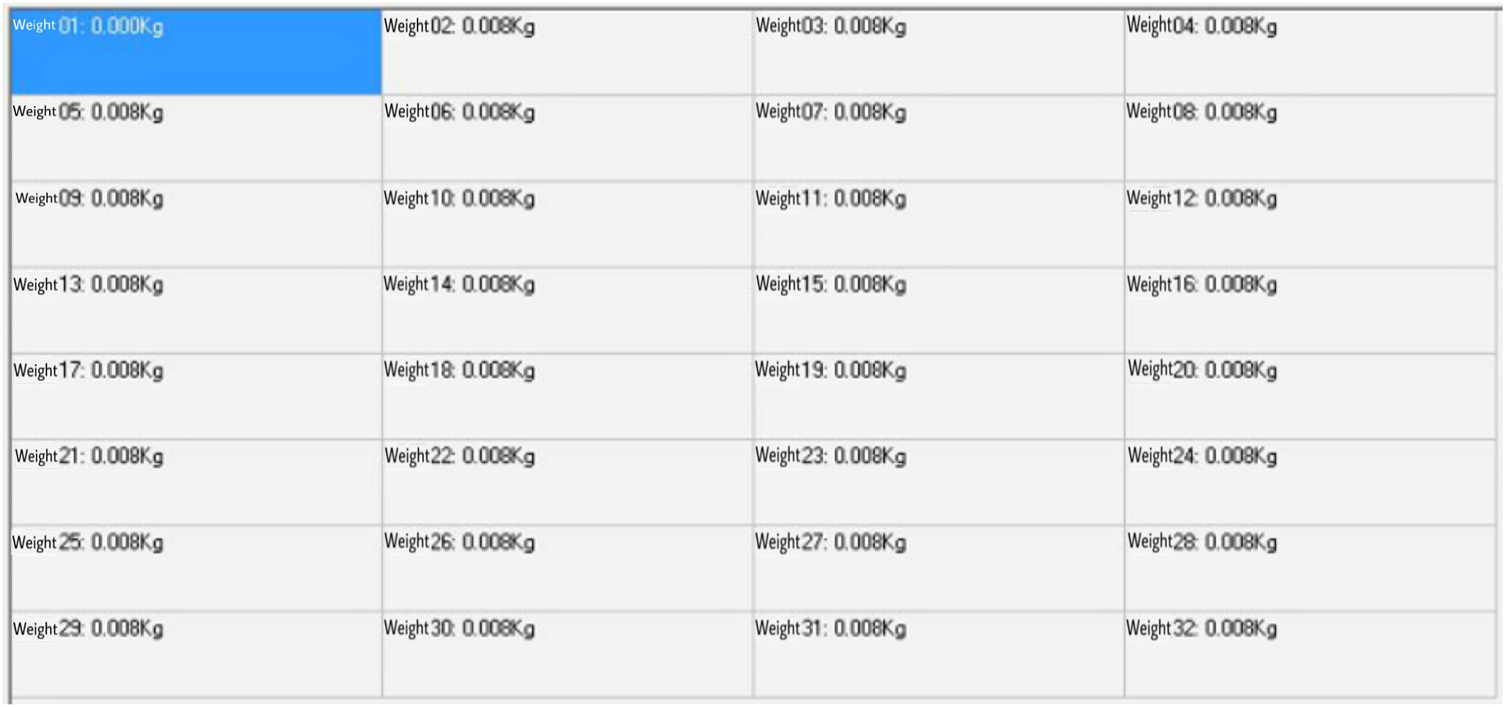
The data acquisition module of the monitoring system is combined with TP410 to realize the simultaneous acquisition of multiple modules, USB2.0 communication output, upper computer software display, unified display, acquisition, recording, control, and analysis. It can collect and analyze a variety of sensor signals, including pressure, flow, liquid level, temperature, displacement sensors, etc. An independent configuration channel is set, and the effective resolution is 16 bits. It can realize a communication distance of 500 m without shielding, and the communication frequency band is 2.5 hz. At the same time, it can adapt to various working environments such as −10°C ∼ + 70°C.
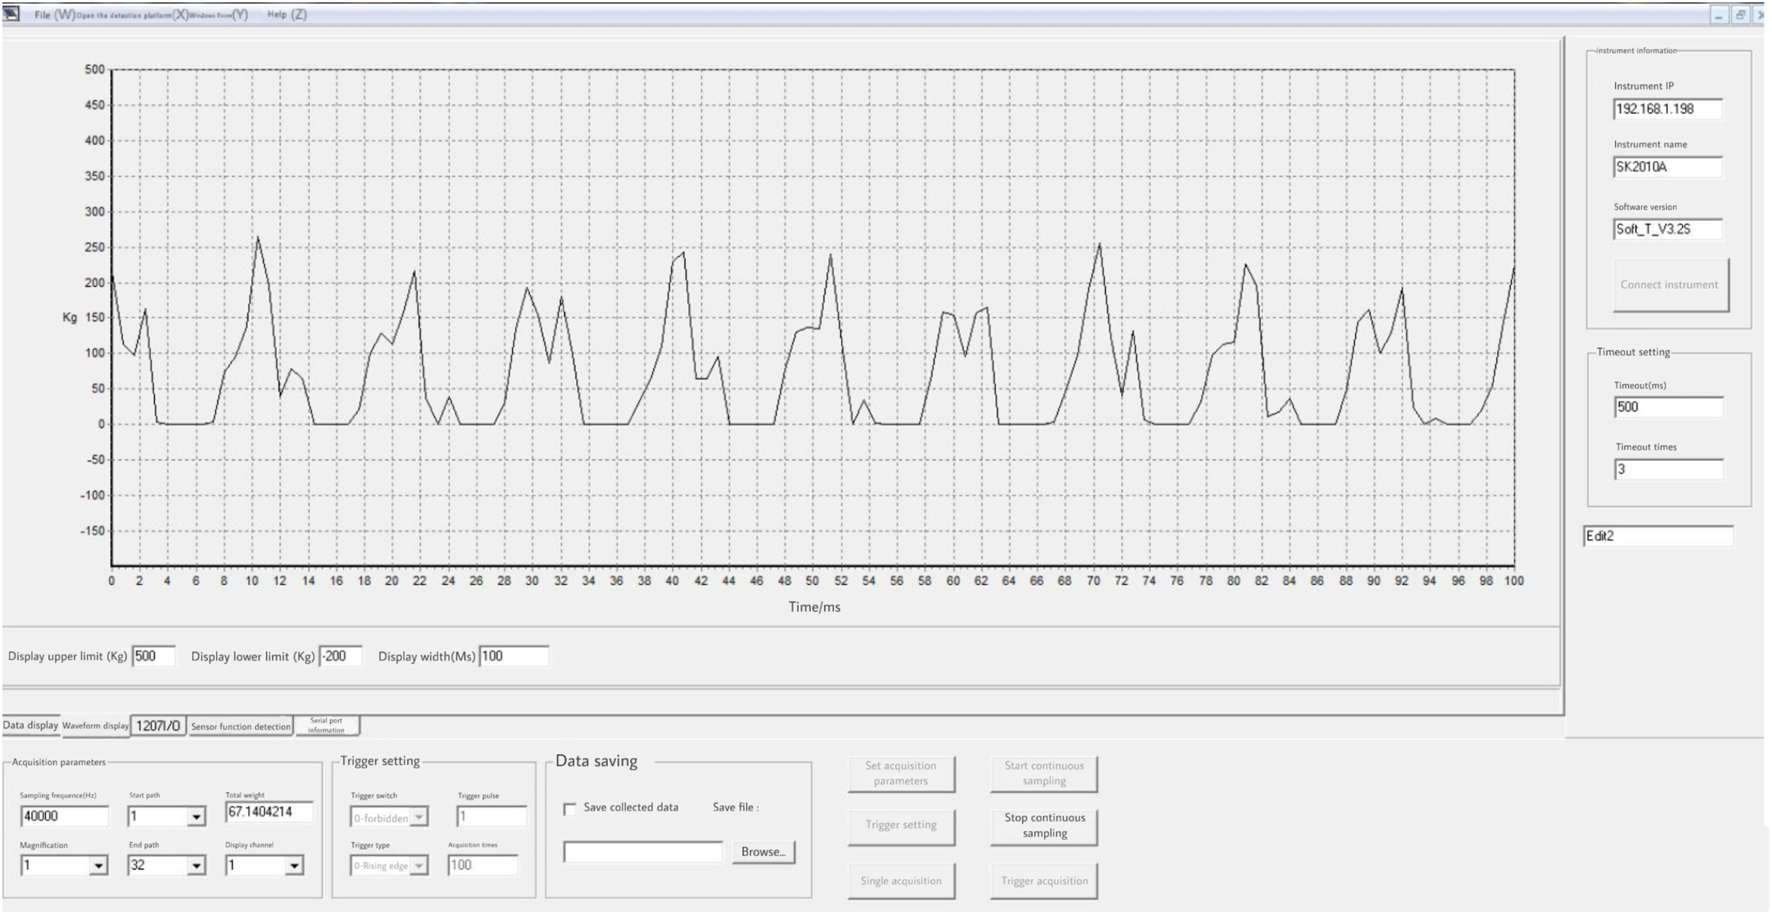
The monitoring system includes a total of 32 data acquisition channels. Each channel collects information independently of each other. Finally, it is summarized in the display window, and the auxiliary waveform accurately displays the operation status of the equipment. During calibration, each channel is tested one by one, the pressure sensor is placed under the hydraulic press, a fixed load and a dynamic load, respectively, are applied, the signal is collected and fed back to the signal amplifier through the sensor for signal processing, the information is collected, processed, and transmitted through the data acquisition card, and the test results are displayed through the monitoring platform. Each channel is tested one by one and the experiment is repeated until all channels are tested accurately. The data collected by the acquisition channel are shown in Figure 5.
FIGURE 5
Data display of the acquisition channel.
The collected data are organized into a table, the actual load applied by the hydraulic press is analyzed, the sensor measurement structure is compared, and the test load curve and the collected measurement curve are drawn in the same table for fitting. The fitting curve between the actual load and the collected data can be observed, and the two lines almost completely coincide, indicating that the data acquisition module operates normally. The data acquisition and fitting images are shown in Table 3 and Figure 6.
TABLE 3
| Sensor 1 (channel I) | Sensor 2 (channel 2) | ||||||||||
|---|---|---|---|---|---|---|---|---|---|---|---|
| Positive testing | Reverse test | Positive testing | Reverse test | ||||||||
| Display load | Actual load | Error | Display load | Actual load | Error | Display load | Actual load | Error | Display load | Actual load | Error |
| 119 | 110 | 9 | 9586 | 9510 | 76 | 505 | 502 | 3 | 9075 | 9010 | 65 |
| 517 | 512 | 5 | 9110 | 9039 | 71 | 1015 | 1010 | 5 | 8521 | 8467 | 57 |
| 1008 | 1007 | I | 8568 | 8506 | 62 | 1532 | 1526 | 6 | 8062 | 8011 | 51 |
| 1503 | 1516 | −13 | 8073 | 8015 | 58 | 2045 | 2045 | 0 | 7574 | 7530 | 44 |
| 2012 | 2012 | 0 | 7568 | 7520 | 48 | 2520 | 2518 | 2 | 7040 | 7007 | 33 |
| 2502 | 2503 | −1 | 7085 | 7046 | 39 | 3010 | 3010 | 0 | 6500 | 6572 | −72 |
| 3012 | 3007 | 5 | 6548 | 6520 | 28 | 3502 | 3506 | −4 | 6040 | 6025 | 15 |
| 3517 | 3510 | 7 | 6026 | 6005 | 21 | 4010 | 4054 | −14 | 5503 | 5500 | 3 |
| 4020 | 4014 | 6 | 5526 | 5513 | 13 | 4500 | 4503 | −3 | 5018 | 5019 | −1 |
| 4518 | 4512 | 6 | 5012 | 5006 | 6 | 5018 | 5014 | 4 | 4521 | 4529 | −8 |
| 5017 | 5008 | 9 | 4527 | 4529 | −2 | 5520 | 5514 | 6 | 4020 | 4035 | −15 |
| 5524 | 5500 | 24 | 4013 | 4016 | −3 | 6030 | 6012 | 18 | 3495 | $503 | −8 |
| 6031 | 6005 | 26 | 3503 | 3508 | −5 | 6532 | 6508 | 21 | 3020 | 3030 | −10 |
| 6530 | 6500 | 30 | 3010 | 3015 | −5 | 7050 | 7017 | 33 | 2507 | 2514 | −7 |
| 7010 | 7000 | 40 | 2509 | 2514 | −5 | 7540 | 7491 | 49 | 1998 | 2000 | −2 |
| 7553 | 7506 | 47 | 2032 | 2041 | −9 | 8085 | 8030 | 55 | 1522 | 1522 | 0 |
| 8070 | 8009 | 61 | 1518 | 1518 | 0 | 8580 | 8525 | 55 | 1020 | 1020 | 0 |
| 8616 | 8550 | 66 | 1020 | 1010 | 10 | 9076 | 9018 | 58 | 525 | 519 | 6 |
| 9093 | 9021 | 72 | 526 | 510 | 16 | 396 | 390 | 6 | |||
| 9553 | 9470 | 83 | 315 | 303 | 12 | 296 | 290 | 6 | |||
| 207 | 196 | II | |||||||||
Comparison of data sets.
FIGURE 6
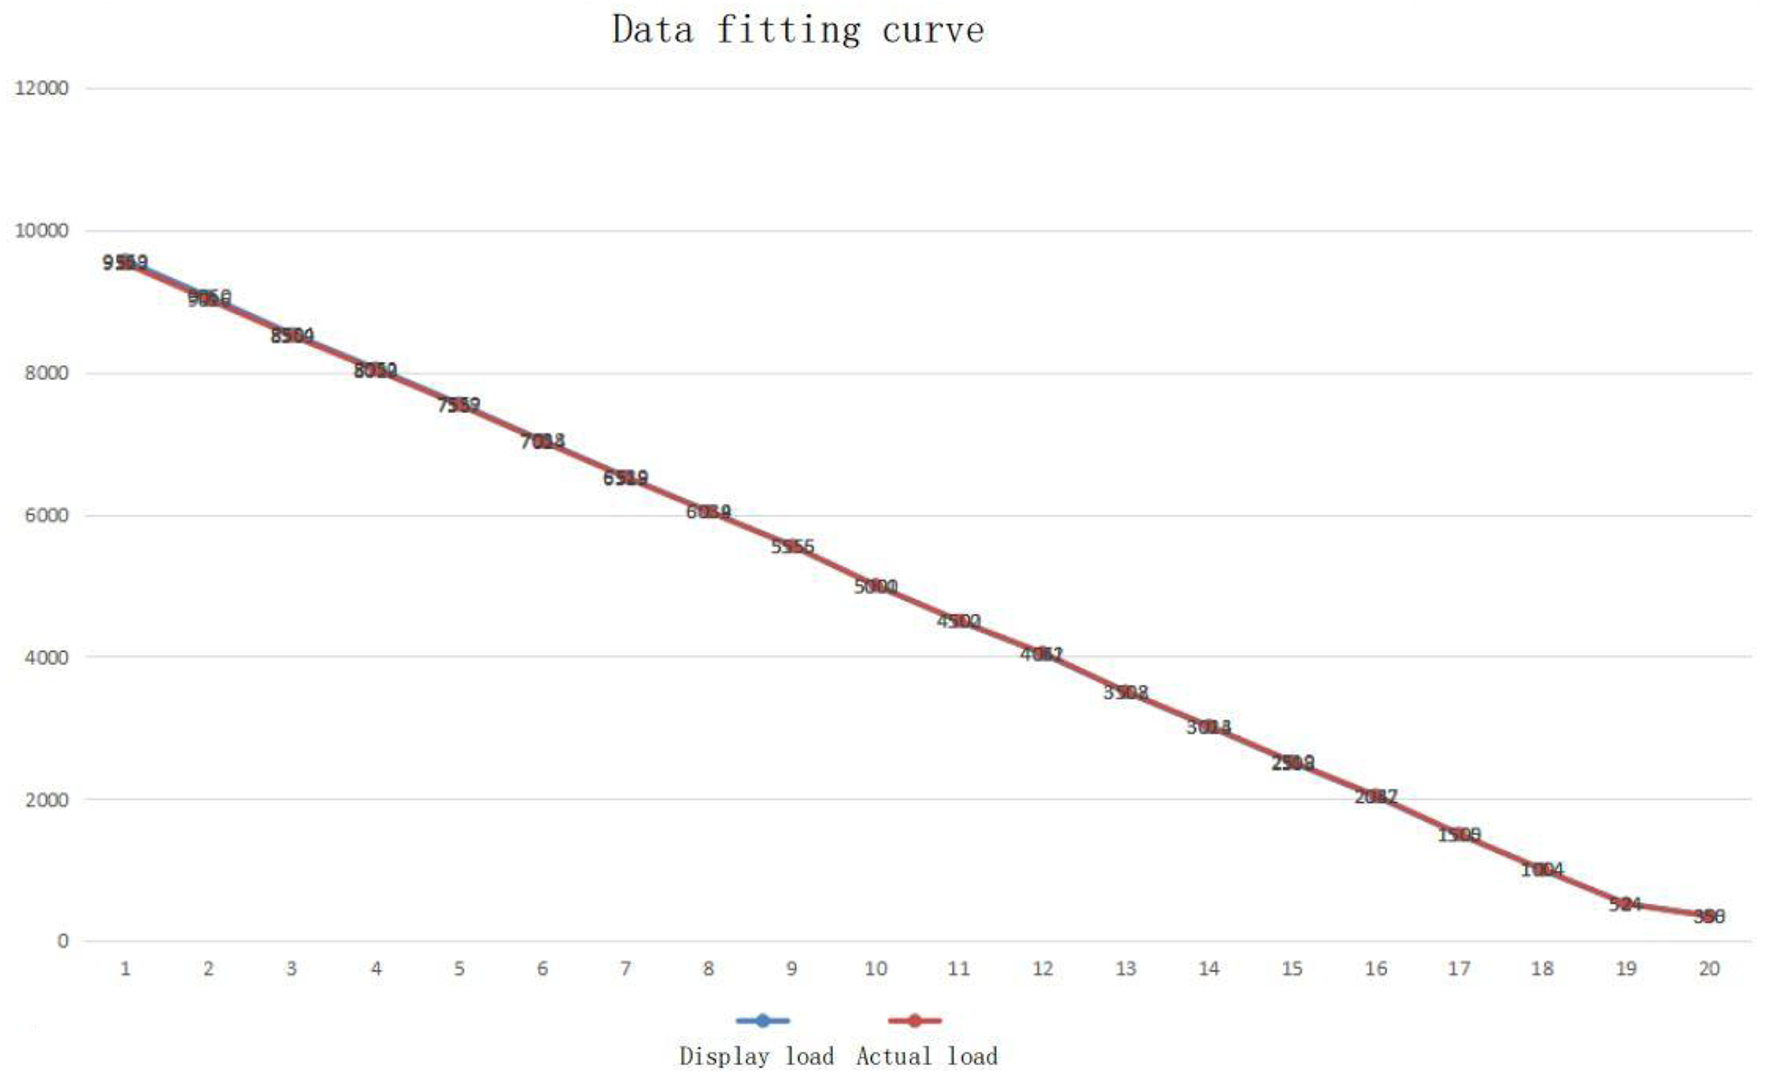
Fitting image of collected data and applied load.
Summary
The vibrating screen will be subjected to a static load when leaving the factory. The verification of the dynamic load and the research of its motion trajectory have important application value. The research object of this study is a 20 t elliptical vibrating screen. Through the construction of a hardware and software system, and a real-time system monitoring and motion trajectory fitting, the following conclusions can be drawn:
1) This study takes the 20 t vibrating screen as the research object. Through the construction of a software and hardware system and the simulation and simulation software written by VC + +, the real-time monitoring of the vibrating screen is realized.
2) The vibrating screen will emit strong vibration during operation, which will have an immeasurable impact on the surrounding environment and buildings. Therefore, the vibrating screen must be monitored by a real-time monitoring system when leaving the factory. Spherical error compensation improves trajectory accuracy.
3) The designed hardware and software have certain reliability for whether there are dangerous factors during the operation of the vibrating screen.
Statements
Data availability statement
The original contributions presented in the study are included in the article/Supplementary Material; further inquiries can be directed to the corresponding author.
Author contributions
The author confirms being the sole contributor of this work and has approved it for publication.
Conflict of interest
The author declares that the research was conducted in the absence of any commercial or financial relationships that could be construed as a potential conflict of interest.
Publisher’s note
All claims expressed in this article are solely those of the authors and do not necessarily represent those of their affiliated organizations, or those of the publisher, the editors, and the reviewers. Any product that may be evaluated in this article, or claim that may be made by its manufacturer, is not guaranteed or endorsed by the publisher.
References
1
ChenW. (2004). Technical Application and Self Synchronization of Triaxial Elliptical Equal Thickness Vibrating Screening Equipment. China: Master's thesis of Xiangtan University.
2
DuX.ChenB. (2010). Development Status and Trend of Vibrating Screening Machinery. Sci. Technol. Inf. (10), 109.
3
DuanZ. S.GuoB. L. (2009). Current Situation and Development Direction of Vibration Screening Equipment in China. Min. Mach.37 (04), 1–5.
4
Duel-HallenA.HoltzmanJ.ZvonarZ. (1995). Multiuser Detection for CDMA Systems. IEEE Pers. Commun.2 (2), 46–58. 10.1109/98.382531
5
GuoN. Q.KuangY. J. (2009). Research Status and Development of Vibrating Screen at Home and Abroad. World nonferrous met. (05), 26–27.
6
HouY. J.LiG. Z.LiuH. B. (2003). Working Principle and Simulation of Variable Linear Vibrating Screen. Pet. Min. Mach. (06), 17–19.
7
HuangL.FuQ.HeM.JiangD.HaoZ. (2021). Detection Algorithm of Safety Helmet Wearing Based on Deep Learning. Concurr. Comput. Pract. Exper33 (13), e6234. 10.1002/CPE.6234
8
JiangD.LiG.SunY.HuJ.YunJ.LiuY. (2021a). Manipulator Grabbing Position Detection with Information Fusion of Color Image and Depth Image Using Deep Learning. J. Ambient. Intell. Hum. Comput.12 (12), 10809–10822. 10.1007/s12652-020-02843-w
9
JiangD.LiG.SunY.KongJ.TaoB.ChenD. (2019a). Grip Strength Forecast and Rehabilitative Guidance Based on Adaptive Neural Fuzzy Inference System Using sEMG. Pers. Ubiquit Comput.. 10.1007/s00779-019-01268-3
10
JiangD.LiG.TanC.HuangL.SunY.KongJ. (2021b). Semantic Segmentation for Multiscale Target Based on Object Recognition Using the Improved Faster-RCNN Model. Future Gener. Comput. Syst.123, 94–104. 10.1016/j.future.2021.04.019
11
JiangD.ZhengZ.LiG.SunY.KongJ.JiangG.et al (2019b). Gesture Recognition Based on Binocular Vision. Clust. Comput.22 (Suppl. 6), 13261–13271. 10.1007/s10586-018-1844-5
12
JiaoH. G.BuZ. W.ZhaoJ. F. (2006). Research Status and Development Trend of Screening Technology. Coal Min. Mach. (10), 8–10.
13
KleinA.KalehG. K.BaierP. W. (1996). Zero Forcing and Minimum Mean-Square-Error Equalization for Multiuser Detection in Code-Division Multiple-Access Channels. IEEE Trans. Veh. Technol.45 (2), 276–287. 10.1109/25.492851
14
KohnoR.ImaiH.HatoriM. (1983). Cancellation Technique of Co-channel Interference in A Synchronous Spread-Spectrum Multiple Access Systems. IEICE Trans. Commun.65 (1), 416–423.
15
KuangY. J. (2009). Calculation, Analysis and Optimization Design of Structural Parameters of 2YAC2460 Ultra Heavy Vibrating Screen. China: master's thesis of Jiangxi University of technology, 18–25.
16
LiC. H.DingW. X.GuoY. (2017). Design of Classification Screen Vibration Test System Based on LabVIEW. Mach. Manuf. automation46 (04), 170–173.
17
LiuX.JiangD.TaoB.JiangG.SunY.KongJ.et al (2022). Genetic Algorithm-Based Trajectory Optimization for Digital Twin Robots. Front. Bioeng. Biotechnol.9, 793782. 10.3389/fbioe.2021.793782
18
LiuY.JiangD.TaoB.QiJ.JiangG.YunJ.et al (2022a). Grasping Posture of Humanoid Manipulator Based on Target Shape Analysis and Force Closure. Alexandria Eng. J.61 (5), 3959–3969. 10.1016/j.aej.2021.09.017
19
LiuY.JiangD.YunJ.SunY.LiC.JiangG.et al (2022b). Self-tuning Control of Manipulator Positioning Based on Fuzzy PID and PSO Algorithm. Front. Bioeng. Biotechnol.9, 817723. 10.3389/fbioe.2021.817723
20
MadhowU.HonigM. L. (1994). MMSE Interference Suppression for Direct-Sequence Spread-Spectrum CDMA. IEEE Trans. Commun.42 (12), 3178–3188. 10.1109/26.339839
21
MadhowU. (1998). MMSE Interference Suppression for Timing Acquisition and Demodulation in Direct-Sequence CDMA Systems. IEEE Trans. Commun.46 (8), 1065–1075. 10.1109/26.705407
22
PatelP.HoltzmanJ. (1994). Analysis of a Simple Successive Interference Cancellation Scheme in a DS/CDMA System. IEEE J. Sel. Areas Commun.12 (5), 796–807. 10.1109/49.298053
23
PengC. Y. (2012). Study on Random Dynamics of Vibrating Screen Structure. China: Liaoning University of engineering and technology, 2–5.
24
SchneiderK. S. (1979). Optimum Detection of Code Division Multiplexed Signals. IEEE Trans. Aerosp. Electron. Syst.15 (3), 181–185. 10.1109/taes.1979.308816
25
SunY.ZhaoZ.JiangD.TongX.TaoB.JiangG.et al (2022). Low-illumination Image Enhancement Algorithm Based on Improved Multi-Scale Retinex and ABC Algorithm Optimization. Front. Bioeng. Biotechnol.10, 865820. 10.3389/fbioe.2022.865820
26
TYunJ.LiuY.SunY.TaoB.KongJ. Y.XuM. M.et al (2022). Real-time Target Detection Method Based on Lightweight Convolutional Neural Network. Front. Bioeng. Biotechnol.10, 861286. 10.3389/fbioe.2022.861286
27
VerduS. (1986). Minimum Probability of Error for Asynchronous Gaussian Multi-Access Channels. IEEE Trans. Inf. Theory32 (11), 85–96. 10.1109/tit.1986.1057121
28
WangF. (2004). Development and Prospect of Screening Machinery. Min. Mach. (01), 37–39.
29
WangZ. M. (2010). Study on Screening Mechanism and Optimization Design of Elliptical Motion Vibrating Screen Doctoral Dissertation of China University of Petroleum. China: University of Petroleum, 1–3.
30
WoodwardG.VuceticB. S. (1998). Adaptive Detection for DS-CDMA. Proc. IEEE86 (7), 1413–1434. 10.1109/5.681371
31
WuX.JiangD.YunJ.LiuX.SunY.TaoB.et al (2022). Attitude Stabilization Control of Autonomous Underwater Vehicle Based on Decoupling Algorithm and PSO-ADRC. Front. Bioeng. Biotechnol.10, 843020. 10.3389/fbioe.2022.843020
32
Xiaodong WangX. D.PoorH. V. (1998). Blind Multiuser Detection: a Subspace Approach. IEEE Trans. Inf. Theory44 (2), 677–690. 10.1109/18.661512
33
XueH.YangR. G. (2002). High Precision Harmonic Detection Algorithm Based on FFT. Chin. J. Electr. Eng. (12), 107–111.
34
YanJ. J. (2007). Working Principle and Dynamic Characteristic Analysis of Variable Elliptical Trajectory Vibrating Screen. China: Master's thesis of Xihua University, 11–16.
35
YunJ.SunY.LiC.JiangD.TaoB.LiG.et al (2022). Self-adjusting Force/bit Blending Control Based on Quantitative Factor-Scale Factor Fuzzy-PID Bit Control. Alexandria Eng. J.61 (6), 4389–4397. 10.1016/j.aej.2021.09.067
36
ZhangF. R.ZhuQ. H. (2012). Application of Wavelet Genetic Neural Network in Fault Diagnosis of Large Linear Vibrating Screen. Min. Mach.40 (08), 81–86.
37
ZhangM. H.DengR.XuQ. (2013). Working Theory and Measurement Technology of Drilling Shale Shaker. Beijing: Petroleum Industry Press, 18.2
38
ZhangX. K.LiuW. Q.ShiJ.et al (2014). Design of Vibration Shape Monitoring System Based on Accelerometer. Industrial Instrum. automation device (01), 32–35.
39
ZhaoG.JiangD.LiuX.TongX.SunY.TaoB.et al (2022). A Tandem Robotic Arm Inverse Kinematic Solution Based on an Improved Particle Swarm Algorithm. Front. Bioeng. Biotechnol.10, 832829. 10.3389/fbioe.2022.832829
40
ZhuoM. (2004). Principle and Application of Vibration Measurement Based on Piezoelectric Accelerometer. Aviat. Precis. Manuf. Technol. (03), 31–41.
Summary
Keywords
vibrating screen, vibration excitation force, simulation, path of particle, spherical error compensation
Citation
Wei S (2022) Vibration Signal Analysis Based on Spherical Error Compensation. Front. Bioeng. Biotechnol. 10:950580. doi: 10.3389/fbioe.2022.950580
Received
23 May 2022
Accepted
15 June 2022
Published
19 August 2022
Volume
10 - 2022
Edited by
Gongfa Li, Wuhan University of Science and Technology, China
Reviewed by
Feng Qin Wang, Zhengzhou University of Light Industry, China
Aiping Huang, Northwestern Polytechnical University, China
Updates
Copyright
© 2022 Wei.
This is an open-access article distributed under the terms of the Creative Commons Attribution License (CC BY). The use, distribution or reproduction in other forums is permitted, provided the original author(s) and the copyright owner(s) are credited and that the original publication in this journal is cited, in accordance with accepted academic practice. No use, distribution or reproduction is permitted which does not comply with these terms.
*Correspondence: Shan Wei, Shanwei123@xxu.edu.cn
This article was submitted to Bionics and Biomimetics, a section of the journal Frontiers in Bioengineering and Biotechnology
Disclaimer
All claims expressed in this article are solely those of the authors and do not necessarily represent those of their affiliated organizations, or those of the publisher, the editors and the reviewers. Any product that may be evaluated in this article or claim that may be made by its manufacturer is not guaranteed or endorsed by the publisher.