 Marijn Winkelhorst
 Oriol Cabau-Peinado
 Adrie J.J. Straathof
 Ludovic Jourdin
- Department of Biotechnology, Faculty of Applied Sciences, Delft University of Technology, Delft, Netherlands
Microbial electrochemical technologies (METs) employ microorganisms utilizing solid-state electrodes as either electron sink or electron source, such as in microbial electrosynthesis (MES). METs reaction rate is traditionally normalized to the electrode dimensions or to the electrolyte volume, but should also be normalized to biomass amount present in the system at any given time. In biofilm-based systems, a major challenge is to determine the biomass amount in a non-destructive manner, especially in systems operated in continuous mode and using 3D electrodes. We developed a simple method using a nitrogen balance and optical density to determine the amount of microorganisms in biofilm and in suspension at any given time. For four MES reactors converting CO2 to carboxylates, >99% of the biomass was present as biofilm after 69 days of reactor operation. After a lag phase, the biomass-specific growth rate had increased to 0.12–0.16 days−1. After 100 days of operation, growth became insignificant. Biomass-specific production rates of carboxylates varied between 0.08–0.37 molC molX−1d−1. Using biomass-specific rates, one can more effectively assess the performance of MES, identify its limitations, and compare it to other fermentation technologies.
1 Introduction
In recent years, Microbial Electrochemical Technologies (METs) gained substantial interest as innovative methods to replace fossil fuel based technologies and processes such as energy and chemicals production (Wang and Ren, 2013). METs exploit microorganisms by utilizing solid-state electrodes as either electron sink or electron source. To date, most studies on METs determine their performance by determining titers, current density or production rates normalized to volume (catholyte, cathode chamber or electrode volume) or electrode surface area (Patil et al., 2015; Fruehauf et al., 2020; Jourdin and Burdyny, 2021). While these performance indicators are important from an engineering perspective and to determine the technologies’ readiness level, they provide limited information on the actual metabolic activity. While the microorganisms perform the reaction(s) of interest, replicate, die, and wash-out, their amount changes over time. Traditional fermentation studies report performance and rates normalized to the amount of microbial biomass (X) in the reactor at any given time, i.e., biomass-specific rates of production or consumption (e.g., qi in moli molx−1 h−1 or gi gx−1 h−1) (Heijnen et al., 1979; Rice, 1984; Wechselberger et al., 2013). This allows to assess the performance of the microbial catalyst under any condition. Similarly, chemo-catalytic electrochemical systems or other catalytic processes typically report the amount of catalyst used. The same approach should be followed for METs.
One MET of interest is microbial electrosynthesis (MES). In MES, microorganisms capable of reducing CO2 into valuable organic compounds such as carboxylic acids and alcohols are grown in a bioreactor in the presence of a cathode (Rabaey and Rozendal, 2010). This cathode supplies electrons for the CO2 reduction by the microorganisms. To date, the only experimental study reporting a biomass-specific growth rate in MES is from Sydow et al. (2017), who derived a biomass-specific growth rate μ = 2.16 days−1 for Cupriavidus necator. They measured the amount of planktonic biomass (i.e., microorganisms in suspension) by calibrating cell dry mass with optical density at 600 nm. However, this method is only applicable to systems using planktonic cells. Cabau-Peinado et al. (2021) constructed a generalized model for biofilm-driven MES of carboxylates from CO2 and derived μ = 0.12 days−1 based on the open culture system of Jourdin et al. (2019a). The model showed that the microbial rates were probably kinetically limited by CO2 availability even though dissolved CO2 was far from being depleted during the first 100 days. After 100 days, the system became limited by product toxicity, mainly from acetate and butyrate. These findings show that invaluable fundamental insights on the performance of the microorganisms can be derived from biomass-specific rates, also referred to as q-values. The real impact of variables such as operating conditions, electrode composition, and reactor design can be assessed from q-values. Consequently, there is a need for a low-cost operando method for quantifying biomass amount retained in the system to determine q-values at any given time in biofilm-based METs. Operando methods refer to methods used to describe systems over time in a non-destructive manner (Weckhuysen, 2002).
Several methods exist to quantify biomass amount, including in biofilm studies, such as dry weight measurements (Sydow et al., 2017), qPCR (Magalhães et al., 2019), optical density measurements (Sydow et al., 2017), protein content (Babanova et al., 2017), flow cytometry (Vignola et al., 2018), optical coherence tomography (OCT) (Molenaar et al., 2018; Hou et al., 2019), magnetic resonance imaging (Wolf et al., 2002; Häuser et al., 2022), cell counting using microscopy (Eddie et al., 2016; Phillips et al., 2020; Relucenti et al., 2021) or by cryo-sectioning thin biofilm slices (Huang et al., 1996; Franklin et al., 2015; Persson et al., 2017). However, these techniques suffer from key limitations to determine time-dependent q-values in biofilm-based systems. Most prominently, several of these techniques are destructive, allowing only one data point for biofilm biomass quantification at the end of operation. Tracking optical density of the fermentation broth allows non-destructive cell density determination over time, but only of microorganisms in suspension. OCT does allow tracking of the amount of biofilm over time, but only on 2D surfaces and the equipment is costly and requires a specific experimental design as well as specialized skills and expertise of the operator (Hackbarth et al., 2020).
Several of the aforementioned techniques to determine biomass amount are compromised in reactors fitted with 3D electrodes. Biofilm coverage might not be equally thick throughout the cathode due to regional differences in porosity (especially in fibrous 3D electrodes such as carbon felt), preferred flow patterns, and sheer stress. These can significantly alter the biofilm density and thickness, and become dynamic due to biofilm growth and its intrinsic effect on porosity (Stewart, 2012; Bottero et al., 2013). For example, Jourdin et al. (2018), who forced their catholyte to flow through a carbon felt cathode to overcome mass transfer limitations in their MES system, visually observed that a thick biofilm developed on the membrane-side of the electrode and a less thick biofilm on the outflow side of the electrode. Moreover, they described full biofilm coverage of the carbon felt fibers inside the electrode. To the best of our knowledge, biomass-specific rates have not been experimentally determined in biofilm-based METs.
The purpose of this study was to develop a simple method to experimentally derive biomass-specific rates in biofilm-based METs and to show its usefulness. A biofilm-based microbial electrosynthesis system (bMES) was used as case study here. The developed method consists of determining the amount of biomass present in the system, as biofilm and in suspension, at any given time, using total nitrogen and optical density (OD600 nm) measurements. To demonstrate the need for biomass-specific rates in bMES, biomass-specific production rate (qp) and biomass specific growth rate (μ) were experimentally determined and used to assess the microorganisms’ performance during bMES by comparing with other relevant technologies, i.e., syngas fermentation and chain elongation fermentation.
2 Materials and methods
2.1 Microbial electrosynthesis reactor operation
Four identical bioelectrochemical reactors were used (R1 to R4), each with a 7.35 cm3 piece of unmodified carbon felt (CGT Carbon, Germany) as cathode (7.35 cm2 projected surface area, 1 cm thickness as supplied by the manufacturer). The carbon felt volume of 7.35 cm3 was chosen to allow fast full biofilm colonization. An overview of the reactor and cathode dimensions can be found in the Supplementary Material I. Prior to use, carbon felt was cleaned by submerging it in 1 mol L−1 HCl and 1 mol L−1 NaOH for 24 h and subsequently treated with UV/ozone (Novascan, United States) for 45 min. A titanium wire (Advent Research Materials, United Kingdom) of 7 ± 0.5 cm was weaved through the carbon felt as current collector. To improve the conductivity between carbon felt and wire, a conductive coating was applied where the wire entered and exited the carbon felt, and was left to dry in an oscillator for 2 days. Each reactor was operated continuously for 194 days with a hydraulic retention time (HRT) of 8 days (Fin = 0.625 mL h−1) and a total catholyte volume of
2.2 Maintenance events
On day 42 and on day 52 of the experiment, electricity was switched off for 3 h (no gas feed, heat control, pH control, liquid recirculation or potential control by the potentiostat) due to maintenance (events I and II, repectively). To prevent acidification of the cathode chamber due to proton crossover, the anolyte was drained and refilled with the same composition, except for phosphoric acid, which was not added in order to maintain a pH of 5.8. After the power restart, the anolyte was changed again to its normal composition described earlier.
2.3 Analytical methods
A catholyte sample of 5 mL was taken twice a week from all reactors after inoculation. 100 µL was used to measure alcohols and carboxylic acids by GC-FID (Thermofisher, United States) with a Stabil-waxTM column of 25 m × 0.2 µm ID. The column was kept at 50°C for 7 min, ramped to 180°C in 8 min and kept at this temperature for 9 min. Helium was carrier gas at 1 mL min−1. Flame ionization detection was used at 250°C.
To investigate microbial growth, 2 mL catholyte was diluted ∼7.5x, filtered (0.2 µm), and the filtrate was analysed for total nitrogen using a TOC analyser coupled with a TN unit and auto sampler (TOC-L Series Total Organic Carbon Analyzer, Shimadzu, Japan). The oven temperature was set at 720°C. Optical density of the original undiluted sample was recorded at 600 nm (OD600 nm) to account for planktonic cells in the outflow of the system using a UV-VIS spectrophotometer (UV-1800 series, Shimadzu, Japan). The OD was calibrated to the nitrogen concentration in suspended biomass (planktonic cells, cN-pX in mol L−1) in the catholyte. The calibration was obtained by the aforementioned total nitrogen analysis on a series of biomass (obtained from filtration of catholyte outflow on day 75) dilutions in catholyte without a nitrogen source. The derived calibration curve for concentration of nitrogen in planktonic biomass (mol L−1) was:
The obtained R2 value for the calibration curve was 0.9989. The calibration data can be found in Supplementary Material (II).
2.4 Imaging
After terminating the reactors, three samples were taken from each biocathode using a sterile stainless steel knife under anaerobic conditions for viability analysis. For live/dead staining a FilmTracerTM LIVE/DEAD Biofilm Viability kit (InvitrogenTM) was used. The biofilm viability checker tool developed by Mountcastle et al. (2021) was used to quantify biofilm viability at the end of the experiments (Mountcastle et al., 2021). For imaging the stained samples a confocal laser scanning microscope system, LSM 710 (Zeiss Observer Z.1, Carl Zeiss), equipped with an AxioCam MRm camera was used. This LSM 710 system uses a Zeiss Observer Z.1 inverted microscope stand with transmitted light (HAL 100), UV (HBO 50), and laser illumination sources. The microscope is completely motorized with a motorized stage, z-drive (for focusing), objective turret. The samples were irradiated at excitation wavelengths at 488 nm and 543 nm for SYTO 9 and propidium iodine respectively, whereas the detection wavelengths were set to 493–578 nm and 566–797 nm respectively. The pinhole was set at 1 AU, and the detector gain at 500 and 700 for SYTO 9 and propidium iodine, respectively. For most images a Plan-Apochromat 20x/0.8 M27 objective was used, with the exception of the image for the R4 outflow sample where a Fluar 2.5x/0.12 M27 objective was used with a pinhole set at 0.68 AU.
2.5 Reactor performance determination
The mass balance for each reactor’s cathode compartment was defined as:
Where ni is the mole amount of compound i, t is time (d), F is the flow rate (L d−1), ci,in is the ingoing concentration (0 moli L−1 for products in this study), ci,out is the outgoing concentration, ri is the volume-specific production rate of i (moli L−1 d−1) and
2.6 Biomass-specific rates determination
One method that does not suffer from being destructive and/or costly is using the elemental balances to quantify biomass amount and differentiate between planktonic and biofilm-based microorganisms. de Rink et al. (2022) used a nitrogen balance in their desulfurization process. They measured organic nitrogen using Hach kits to account for planktonic cells. Here, we measure total nitrogen to account for nitrogen assimilation into biomass, and calibrate optical density to nitrogen in planktonic cells to measure the planktonic cells amount at any given time as described in the analytical methods section. This prevents the needs for expensive testing kits for nitrogen species present in the medium. Biomass production was estimated based on a total nitrogen mass balance, assuming that nitrogen assimilation into biomass was the only relevant reaction involving elemental nitrogen. A schematic overview of the parameters used as well as a list of all parameters and subscripts used in the following equations can be found in supplementary material (II). Elemental nitrogen balances are used because the carbon balances include large terms for CO2 inflow and outflow, which will obscure carbon accumulation in biomass.
For total elemental nitrogen (N), balance Eq. 1 becomes:
where nN is the amount of total nitrogen in the cathode compartment, cN-aq,in is the incoming dissolved nitrogen concentration (mol L−1), cN-aq,out is the dissolved nitrogen concentration in the outflow (mol L−1), and cN-pXout is the nitrogen content in planktonic cells in the outflow (mol L−1). No reaction rate r occurs in this equation as elemental nitrogen cannot be created nor destroyed. Integrating Eq. 4 for short time intervals Δt between two sampling moments led to an equation for the amount of nitrogen accumulating in that interval:
Overall nitrogen amount in the reactor over time was described by:
where
The concentration of planktonic cells biomass cpX (mol L−1) in the catholyte due to planktonic cell growth and detachment of cells from the biofilm was obtained from:
Biomass-specific rates (
Moreover, after multiplying cpX by
3 Results and discussion
Four reactors were operated under identical conditions as described in the materials and methods in order to derive q-values in biofilm-based microbial electrosynthesis. These reactors were used as benchmark reactors based on previous work (Jourdin et al., 2018; Jourdin et al., 2019a). For the purpose of benchmarking, the performance of these reactors are shown in Table 1 normalized to conventionally used key performance indicators in MES at pseudo steady states. As these pseudo steady states occurred at different times, the selected days vary among reactors. The time-dependent performance of all reactors are shown in Supplementary Material III. An extended version of Table 1 can be found in Supplementary Material IV.
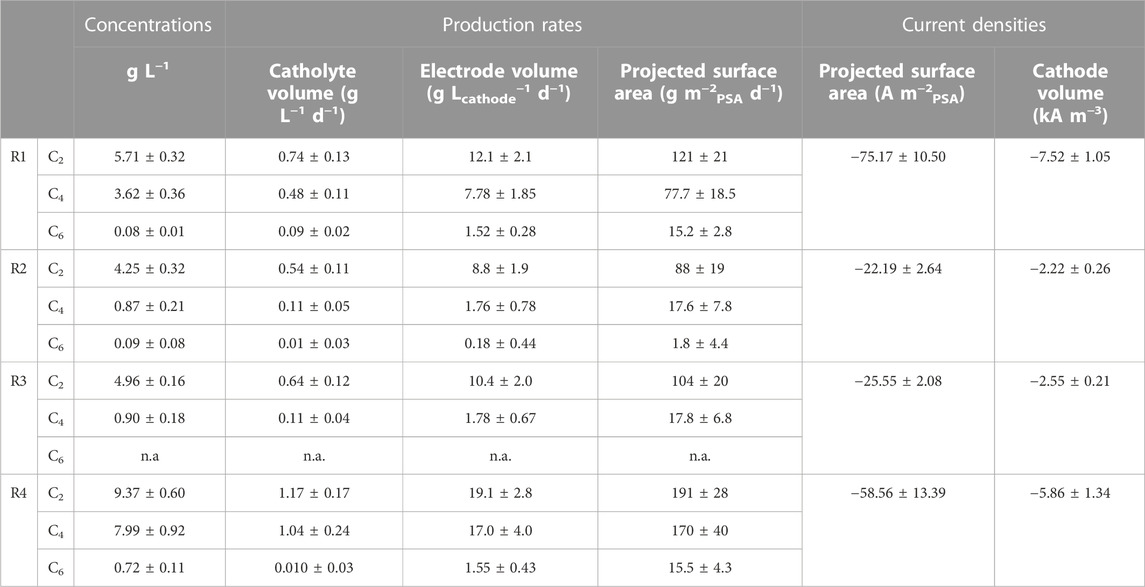
TABLE 1. Conventional key performance indicators in MES: concentration, production rates and current densities. Selected time periods for R1: days 71–101, for R2: days 75–118, for R3 days 54–92, and for R4 days 141–198. Reactors were operated for 194 days with a HRT of 8 days. C2, C4 and C6 refer to acetate, butyrate, and hexanoate respectively. PSA: projected surface area.
3.1 Operational conditions and the inoculation of an enriched culture allowed hexanoate production after 30 days
Throughout the experiment acetate, butyrate and hexanoate were the only products measured in relevant amounts. Small peaks for propionate and valerate were observed irregularly, but always below the measurement limit. No alcohol peaks were observed. The first acetate production was recorded in R1 and R3 after 13 days, immediately reaching 1.08 g L−1 and 0.46 g L−1 respectively. In this study a 50:50 CO2:N2 ratio was used versus 30:70 in previous work. R2 started producing organics on day 19. However, R4 only started producing organics on day 82. The reason behind this observed lag phase is not fully clear, but could be explained by contamination of the reactor by competing microorganisms, as biomass growth as well as current consumption were still observed during the first 82 days. On the same day as acetate was first measured, 230 mg L−1 and 210 mg L−1 butyrate was recorded in R1 and R3 respectively. This was surprising as according to previous work the threshold C2 concentration triggering butyrate production was 2.5–4 g L−1 (Jourdin et al., 2018). The start of hexanoate production did match with the threshold of 0.5–2.5 gC4 L−1 observed in said study. It was first measured after 29 days in R1, 77 days in R2, and 131 days in R4. In R3 hexanoate was only recorded in 2 data points (day 103 and day 106). When comparing the data from Table 1 with literature, it can be deduced that all reactors performed in accordance with commonly derived numbers for biofilm-based MES using 3D cathodes (Flexer and Jourdin, 2020; Prévoteau et al., 2020). The methane inhibitor BrCH2CH2SO3Na (2-BES) was used in this study, which was postulated to function as electron acceptor to oxidize ethanol to CO2 by Azospira Oryzae by Steinbusch et al. (2011). Future research should address if 2-BES affects performance in biofilm-based MES systems. The results show that the reactors were able to produce relevant concentrations of carboxylates up to hexanoate, making them suitable as benchmark systems to determine biomass-specific rates for biofilm-based MES reactors.
3.2 The amount of biomass retained in the reactors deviated by a factor of 2 after full colonization of the cathode was achieved
In Figure 1, the total nitrogen concentration (A), calculated planktonic cell amount (PCA) (B), calculated total biomass amount (C) and derived µ-values (D) are shown for all four reactors.
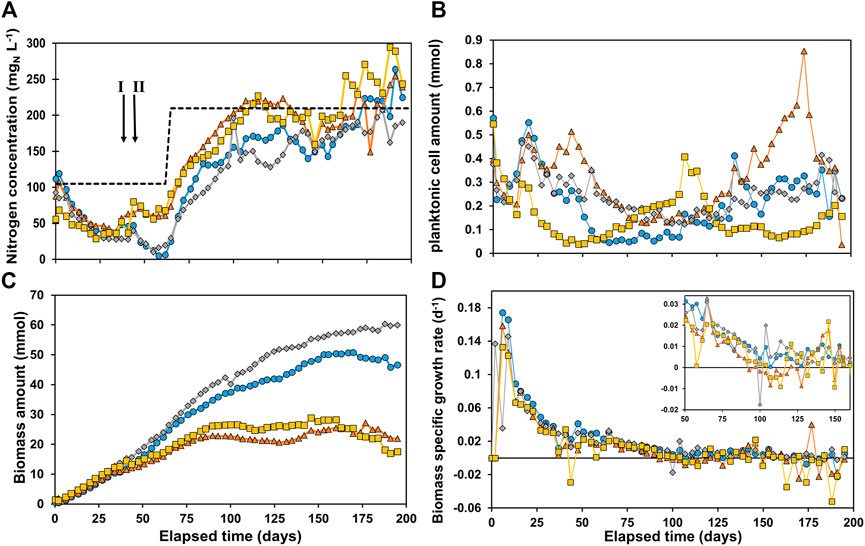
FIGURE 1. (A) Nitrogen concentration in the reactors, with the total nitrogen inflow concentration as dashed line (B) planktonic cell amount in the reactor, (C) total biomass amount in the reactor and (D) specific growth rate μ. R1 is in blue circles, R2 in orange triangles, R3 in grey diamonds, and R4 in yellow squares. The arrows in Figure 1A indicate event I and II as discussed in the materials and methods section.
A decrease in nitrogen concentration was measured in all reactors, indicating nitrogen consumption (Figure 1A). On day 62 the soluble total nitrogen in R1 and R3 was almost depleted. Hence, it was decided to double the nutrient concentration to prevent limitation. This was implemented in all reactors to maintain similar conditions. After ∼100 days the ammonium concentration was close to its feed concentration, indicating limited growth. After 160 days the nitrogen concentration measured was higher than the influent NH4+-N concentration in R4, with R2 and R1 following on day 167 and 170 respectively. The reason for this was most likely cell lysis of non-viable cells and/or extracellular polymeric substances (EPS) releasing soluble nitrogen compounds (proteins, amino acids and NH4+). Figure 1B shows an initially decreasing concentration of planktonic cell amount (PCA) in the reactor. This can be caused by: 1) washout via the effluent and/or 2) biomass attachment to the electrode and consequently biofilm formation. An increasing PCA can be caused by 1) more planktonic cells growth and/or 2) cell detachment from the biofilm. The effect of these phenomena cause significant different trends in PCA in all reactors. After 110 days the PCA started to gradually increase in R2 and performance was deteriorating (see Supplementary Material IIIb). After 173 days the reactor PCA sharply decreased and performance spiked. The reason for this observation is not clear, but it was suspected that something in the system caused substantial resistance which was suddenly reduced as cathodic current significantly increased on day 173. The amount of biomass in all reactors (Figure 1C) was very similar until reaching 10.9 ± 1.2 mmolX around day 30. From this point onwards, the amount of biomass started to deviate between R1 + R3 and R2 + R4. R1 and R3 reached significantly higher values, plateauing at 50.0 ± 1.0 mmolX and 59.2 ± 0.8 mmolX, respectively, both after ∼150 days. R2 and R4 plateaued much earlier and at lower values, after about 85 days at 23.1 ± 1.6 and 26.5 ± 1.1 mmolX, respectively. However, as these trends are not observed in the PCA in Figure 1B, the plateauing can be attributed to full colonization of the cathode by biofilm. The biomass specific growth rates (μ-values) are shown in Figure 1D. A lag phase of 3 days was observed in all reactors, after which the μ-value increased to 0.12–0.17 days−1. The μ-value steadily decreased for all reactors to 0.026 ± 0.004 days−1 after 50 days, and below 0.01 days−1 after 100 days. Yet, even after 100 days the difference in biomass amount in the reactors was increasing. This was caused by: 1) the μ-value being routinely higher in R1 and R3 than R2 and R4 over long periods as can be observed in the zoom in window in Figure 1D, and 2) The μ-value reaching negative values in R2 and R4 especially after 160 days as biofilm-based biomass decays and/or detaches. The results show that the reactors did not behave as replicates even though they were controlled at the same conditions. Due to the complexity of the systems and use of mixed culture the reactor performances are likely extremely sensitive to slight variations in operational conditions (e.g., exact applied potential, temperature, retention time, pH control, electrode packing and placement). The difference in performances between the four reactors deserves further investigation.
3.3 Biofilm accounted for >99% of biomass present in the reactors
The most plausible hypothesis for the total amount of biomass in the reactors reaching a plateau as shown in Figure 1C is biofilm saturation, in which space restriction prevents more biofilm growth. Subtracting the planktonic cells amount (Figure 1B) from the total amount of biomass (Figure 1C) gives the biomass retained in the system as biofilm at any time. In Supplementary Material V the ratio between biomass as planktonic cells and biofilm is shown, which shows that after 69 days > 99% of the biomass is in biofilm in all reactors. Photos of the cathodes (membrane side and outflow side) can be found in the Supplementary Material VI. These images show full coverage of the carbon felt, but the thickness of the biofilm varies. The variation in biomass amount per reactor may be due to the heterogeneity of the structural composition of the carbon felt. Moreover, the way the carbon felt electrode is placed and packed inside its chamber can unintentionally vary, affecting its porosity and thus the space available for biofilm formation. Consequently, the liquid flow through the carbon felt is also affected by its packing and placement, also impacting local mass transport and biofilm formation. The values of the concentrations of biomass when normalizing to electrode volume at the end of the experiments are 6.7, 3.7, 8.1, and 3.9 mmolX cm−3cathode for R1, R2, R3, and R4 respectively. These values are in a similar order of magnitude as predicted by Cabau-Peinado et al. (2021), who described microbial kinetics and reactor performance of a comparable MES system by computational modelling. In their model, the biomass concentration in the reactor plateaus after approximately 150 days, with a biomass concentration of 8.2 mmol cm−3cathode. In comparison, the theoretical biomass concentration is approximately 13 mmol cm−3 (based on a cell density of 1.09 g cm−3 and dry weight ratio of 30%) (Bakken and Olsen, 1983). This would mean that 29–63% of the physical space is occupied by biomass in the cathodes.
3.4 The biofilm colonization may be improved by growth medium engineering and enhancement of mass transport
As also found in this experimental study, μ-values reaching below 0.01 days−1 after 100 days of reactor operation resulted from model calculations by (Cabau-Peinado et al., 2021). This indicates that all reactors used in the present study reached a mature biofilm and organics production was most likely maintenance dictated. The derived biomass growth rates in this study are relatively low compared to growth rates found in related anaerobic fermentation technologies such as syngas fermentation and chain elongation. As a consequence, reaching a mature biofilm was relatively time consuming and requires improvement from an application point of view. Reported μ-values can widely vary due to suboptimal conditions for biomass growth. For acetogens grown on H2/CO2 μ-values are generally in the region of 1.2–2.9 days−1 (Heijnen et al., 1979; Groher and Weuster-Botz, 2016; Bengelsdorf et al., 2018; Acharya et al., 2019; Philips, 2020). The highest reported growth rate is by Groher and Weuster-Botz (2016), who reported a maximum biomass-specific growth rate of 5.77 days−1 for the acetogen Terrisporobacter mayombei grown on a H2:CO2 mixture using their developed growth medium specific to acetogens. Candry et al., obtained a maximum specific growth rate for Clostridium kluyveri of 2.9 days−1, a model organism frequently studied in carboxylate chain elongation using soluble electron donors (Candry et al., 2018). Allaart et al. found an average growth rate of 1.39 days−1 for an open culture when studying the effect of product inhibition in chain elongation using sequencing batch bioreactors (Allaart et al., 2021). In open cultures, generally lower growth rates are found, ranging between 0.12 days−1 to 2.9 days−1 (Roghair et al., 2016; Candry et al., 2020; Shrestha et al., 2022). The relatively low growth rates observed in our study may be attributed to absence of vitamins and/or yeast extract supplementation. Species dependent on these supplements must rely on interspecies supplementation of minerals and vitamins, potentially limiting their growth. Growth medium engineering could be performed in follow-up work in order to improve the start-up time and full colonization of the electrode (Ammam et al., 2016; Groher and Weuster-Botz, 2016). Moreover, the electron transfer mechanisms and mass transport of protons, hydroxide ions, nutrients, substrates, and products in cathodic biofilms should be studied more extensively as these may be contributing factors to growth limitations (Jourdin and Burdyny, 2021).
3.5 Biofilms are key in this system, but more does not necessarily result in higher volume-specific productivity
To study the performance of the reactor’s biofilms more extensively, biomass-specific production rates (qp) were determined over time on basis of moles of carbon in the three organic products jointly. The results are shown in Figure 2.
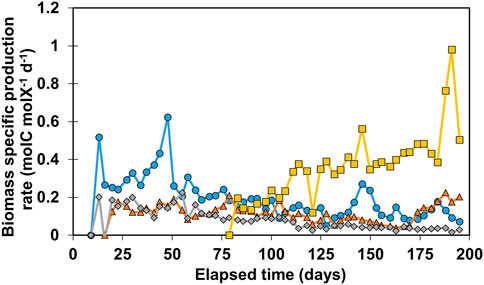
FIGURE 2. Calculated qp values for all reactors. R1 is in blue circles, R2 in orange triangles, R3 in grey diamonds, and R4 in yellow squares.
The general trend for R1-R3 shows a gradual decrease of qp over time as the biofilm matures. Biomass-specific production rates in R1 increased until day 50, reaching 0.62 molC molX−1d−1, and decreased rapidly to 0.24 molC molX−1d−1. After 55 days the performance of R1 and R3 gradually decreased from 0.2 molC molX−1d−1 to 0.12 molC molX−1d−1 and 0.06 molC molX−1d−1 respectively on day 128. R2 stayed relatively stable around 0.17 molC molX−1d−1, until day 100, after which qp decreased to 0.06 molC molX−1d−1 on day 160. As production rates increased again, R2 reached 0.2 molC molX−1d−1 at the end of the experiment. Remarkably, organics production was only recorded after 80 days of operation in R4. Contrary to the declining trend of qp observed in the other reactors, qp in R4 increased over time from 0.2 to 0.48 molC molX−1d−1 on day 175. This increase of qp can be explained by both an increase in volumetric performance during this time as well as a slight decrease in biomass amount retained in the system. It is also possible that this microbial community shifted towards enrichment of acetogens and chain elongators after 80 days. The highest qp value was recorded in R4 on day 196 at 0.96 molC molX−1d−1, after which it decreased again to 0.49 molC molX−1d−1. No clogging of influent or effluent tubing was observed between day 183–195 which could have explained the two outliers. The results of Figure 2 illustrate that qp is a variable that can fluctuate over time, showing a decreasing trend when biomass amount increased while production rates at reactor scale are relatively stable. More biomass present in the system does not necessarily mean higher volumetric productivity, especially in systems with active cell retention. For example, R4 retained three times less biomass than R3 (Figure 1C), however the biomass in R4 is 11.6 ± 3.2 times more active in terms of biomass-specific production rate than the biomass in R3 between day 150 and 183 (Figure 2).
3.6 Biomass-specific production rates in MES can be enhanced
In table 2 the average qp of the MES reactors are compared to several syngas fermentation and chain elongation studies in order to assess whether the derived values for qp are relevant or insignificant quantities. These studies were selected based on whether qp was reported and/or sufficient data was provided to calculate it. Moreover, the studies are compared based on whether they utilize open or single cultures, on the substrate (s) used, and whether a biofilm was formed or only suspended cells were considered.
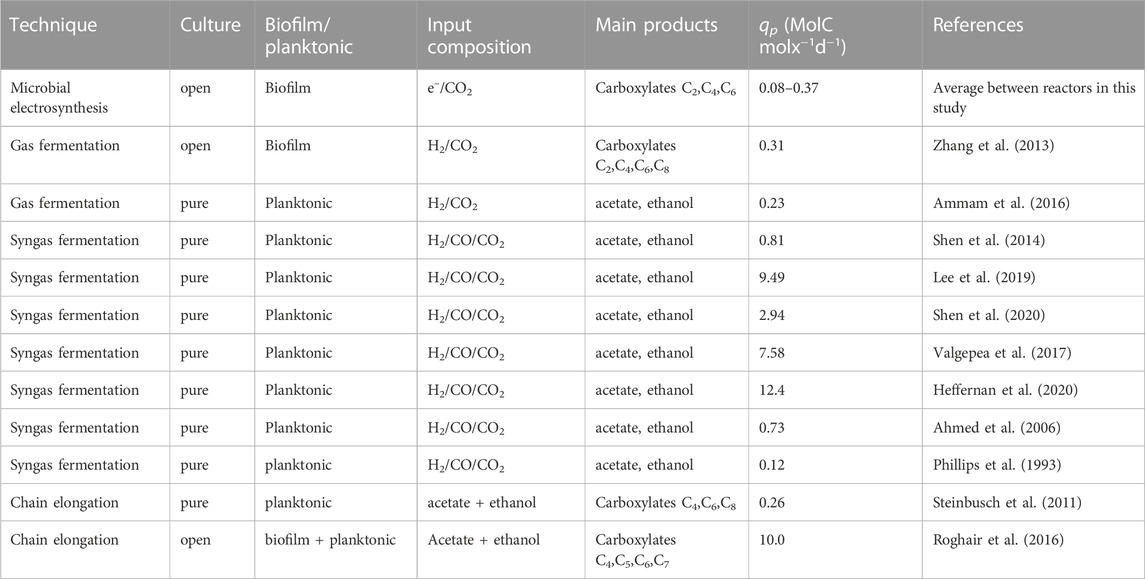
TABLE 2. Comparison of reactor performance with Syngas fermentation and Chain elongation fermentation. For studies normalizing biomass to dry cell weight (DCW), a molecular weight of 25.25 g mol−1 was used for biomass. For studies normalizing biomass to volatile suspended solids (VSS) it was assumed that 1 gVSS equals 1 gDCW. C5, C7 and C8 refer to pentanoate, heptanoate and octanoate respectively.
The table illustrates that in general, the performance of the MES reactors normalized to biomass amount was relatively low. The study most closely related to the current study is by Zhang et al. (2013), as they formed an open culture biofilm in a hollow fibre membrane bioreactor producing medium chained carboxylates up to caprylate (C8) from a CO2/H2 mixture. Their qp is lower than the average qp measured in R4, but higher than the average found in the other reactors. The highest qp values were found in more recent single culture syngas fermentation studies, with the exception of the chain elongation study Roghair et al. (2016) In their study, they managed to form chain elongating granular sludge, allowing cell retention and applying relatively short hydraulic retention time, increasing steady-state soluble substrate concentrations, decreasing product inhibition, and therefore increasing production rates. This comparative analysis highlights that there is room to significantly improve metabolic rates in MES.
3.7 Limitations of this study
Even though the method used in this study circumvents several disadvantages of more commonly used techniques, there are still some limitations. Most evident, the method relies on the assumption that the gap in the nitrogen balance when accounting for outflow of medium and suspended cells can be assigned to biofilm-based biomass. Several phenomena can potentially complicate this method. The identified complications relevant for the current study are nitrogen accumulation in extracellular polymer substances, nitrogen-containing salt precipitation and retained non-viable cells accumulating in biofilm. To determine if accumulation of non-viable cells in the biofilm may have caused an underestimation of qp, live/dead staining was performed at three different locations of the cathode for every reactor. Confocal images can be found in the Supplementary Material (VII) and were analysed for viable:non-viable ratio using Biofilm viability checker tool developed by Mountcastle et al. (2021) for ImageJ (Legland et al., 2016). The results of the analysis are illustrated in Figure 3.
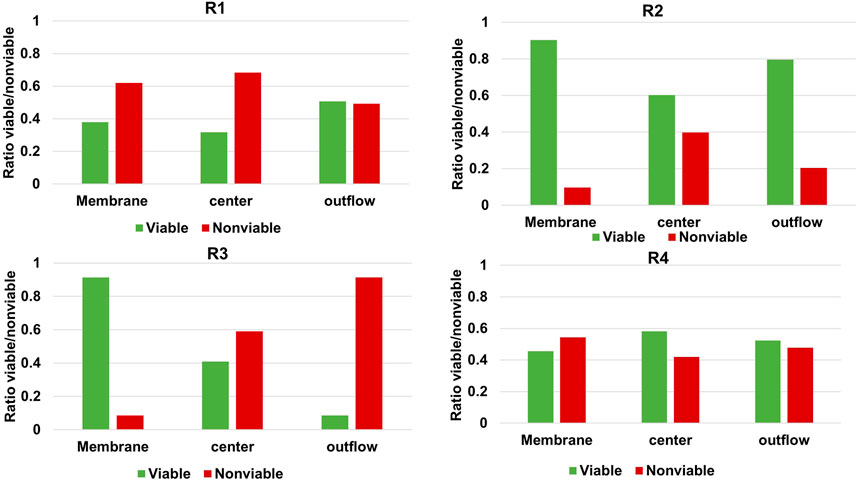
FIGURE 3. Relative abundance of live and dead microorganisms in the cathodic biofilm of each MES reactor at three different locations of the carbon felt.
Figure 3 shows that in all reactors a significant percentage of the biofilm stained as non-viable, but the extent varies greatly per reactor and per location. Izadi et al. (2020) found >90% of viable cells in their biofilm-based MES reactor when applying −1 V vs. Ag/AgCl and feeding CO2, after 104 days while refreshing 40% of the medium every 14–21 days. The higher non-viable cell ratio in our study may be explained by the longer operation of 194 days and diminished biomass growth rates as illustrated in Figure 1D. Based on the significant ratio of non-viable cells shown in Figure 3 it should therefore be noted that the biomass-specific rates (qp and μ-values) of the reactors were indeed underestimated due to retained non-viable biomass in the biofilm. The main advantages of the method are that it allows operando monitoring of biomass amount present in the system in a non-destructive manner. Techniques to improve the accuracy, e.g., EPS and live/dead determination, can be considered as complementary. When applying this method to other METs, other limitations may be important as well. In this study, reducing conditions were used, but if ammonium can get oxidized to NOx and/or elemental nitrogen, off-gas analysis may be required to close the nitrogen balance. In other cases low biomass quantity or low nitrogen content may compromise using the nitrogen balance. Moreover, in this study OD600nm was used to calibrate nitrogen content in suspended cells, which is known to fluctuate over time even in pure cultures (Candry et al., 2018). This can be circumvented by updating the calibration over time. The impact of any change in the slope of the calibration curve presented for the systems used in this study is very low. This is due to the low optical density recorded, and thus low planktonic cell concentration, in comparison to total biomass amount retained in the reactors. However, other continuous systems with a higher ratio of planktonic biomass could be impacted to a larger extent as a higher or lower ratio of the biomass retained in the system would wash out. Moreover, in systems with much higher suspended cell densities versus biofilm cells or larger reactor volumes, other methods such as routine dry weight measurements of reactor broth may become viable methods as well.
3.8 Biomass specific rates are the true microbial performance indicator
When normalizing the production rate to projected surface area of the electrode (PSA), an average production rate of 214 ± 43 g m−2PSA d−1 and current density of −75 ± 10 A m−2PSA in R1 were found, which is within the top 5% of MES studies, as reported in the review by Flexer and Jourdin (2020). Even though current densities, production rates and titers reported in this study are reasonable compared to previous studies in MES, biomass specific production rates show that the microbial community is most likely facing limitations and is not performing to its full potential. This information is key in order to assess the true impact of changes such as in operational conditions, reactor configuration or electrode modifications on the microbial performance. Studying the biofilm as described in this study allows differentiating improvements in performance thanks to increased biomass quantity or to higher metabolic activity. Moreover, it allows comparing performance to other biotechnological processes such as syngas fermentation or chain elongation. Further research should focus on investigating what is limiting biofilm-based MES. As demonstrated in the results section, significant differences in performance were observed for all reactors. The reason for these differences are currently unknown and should be studied more extensively. Proposed research areas are cathode design (especially porosity) and interactions within the microbial community, using biomass specific rates as key performance indicators (growth, uptake and production rates).
Data availability statement
The original contributions presented in the study are included in the article/Supplementary Material, further inquiries can be directed to the corresponding author.
Author contributions
MW designed and performed the experiments and drafted the manuscript. OC-P, AS and LJ contributed to the experimental design and data interpretation. All authors contributed to manuscript revision, conception, design of the study read and approved the submitted version.
Funding
This study was funded by TU Delft start-up funding.
Conflict of interest
The authors declare that the research was conducted in the absence of any commercial or financial relationships that could be construed as a potential conflict of interest.
Publisher’s note
All claims expressed in this article are solely those of the authors and do not necessarily represent those of their affiliated organizations, or those of the publisher, the editors and the reviewers. Any product that may be evaluated in this article, or claim that may be made by its manufacturer, is not guaranteed or endorsed by the publisher.
Supplementary material
The Supplementary Material for this article can be found online at: https://www.frontiersin.org/articles/10.3389/fbioe.2023.1096086/full#supplementary-material
References
Acharya, B., Dutta, A., and Basu, P. (2019). Ethanol production by syngas fermentation in a continuous stirred tank bioreactor using Clostridium ljungdahlii. Biofuels 10, 221–237. doi:10.1080/17597269.2017.1316143
Ahmed, A., Cateni, B. G., Huhnke, R. L., and Lewis, R. S. (2006). Effects of biomass-generated producer gas constituents on cell growth, product distribution and hydrogenase activity of Clostridium carboxidivorans P7T. Biomass Bioenergy 30, 665–672. doi:10.1016/j.biombioe.2006.01.007
Allaart, M. T., Stouten, G. R., Sousa, D. Z., and Kleerebezem, R. (2021). Product inhibition and pH affect stoichiometry and kinetics of chain elongating microbial communities in sequencing batch bioreactors. Front. Bioeng. Biotechnol. 9, 693030. doi:10.3389/fbioe.2021.693030
Ammam, F., Tremblay, P. L., Lizak, D. M., and Zhang, T. (2016). Effect of tungstate on acetate and ethanol production by the electrosynthetic bacterium Sporomusa ovata. Biotechnol. Biofuels 9, 163. doi:10.1186/s13068-016-0576-0
Babanova, S., Carpenter, K., Phadke, S., Suzuki, S., Ishii, S., Phan, T., et al. (2017). The effect of membrane type on the performance of microbial electrosynthesis cells for methane production. J. Electrochem. Soc. 164, H3015–H3023. doi:10.1149/2.0051703jes
Bakken, L. R., and Olsen, R. A. (1983). Buoyant densities and dry-matter contents of microorganisms: Conversion of a measured biovolume into biomass. Appl. Environ. Microbiol. 45, 1188–1195. doi:10.1128/aem.45.4.1188-1195.1983
Bengelsdorf, F. R., Beck, M. H., Erz, C., Hoffmeister, S., Karl, M. M., Riegler, P., et al. (2018). Bacterial anaerobic synthesis gas (syngas) and CO2 + H2 fermentation. Adv. Appl. Microbiol. 103, 143–221. doi:10.1016/bs.aambs.2018.01.002
Bottero, S., Storck, T., Heimovaara, T. J., van Loosdrecht, M. C. M., Enzien, M. V., and Picioreanu, C. (2013). Biofilm development and the dynamics of preferential flow paths in porous media. Biofouling 29, 1069–1086. doi:10.1080/08927014.2013.828284
Cabau-Peinado, O., Straathof, A. J. J., and Jourdin, L. (2021). A general model for biofilm-driven microbial electrosynthesis of carboxylates from CO2. Front. Microbiol. 12, 669218. doi:10.3389/fmicb.2021.669218
Candry, P., Huang, S., Carvajal-Arroyo, J. M., Rabaey, K., and Ganigue, R. (2020). Enrichment and characterisation of ethanol chain elongating communities from natural and engineered environments. Sci. Rep. 10, 3682–3710. doi:10.1038/s41598-020-60052-z
Candry, P., Van Daele, T., Denis, K., Amerlinck, Y., Andersen, S. J., Ganigué, R., et al. (2018). A novel high-throughput method for kinetic characterisation of anaerobic bioproduction strains, applied to Clostridium kluyveri. Sci. Rep. 8, 9724. doi:10.1038/s41598-018-27594-9
de Rink, R., Lavender, B., Liu, D., Klok, J. B. M., Sorokin, D. Y., ter Heijne, A., et al. (2022). Continuous electron shuttling by sulfide oxidizing bacteria as a novel strategy to produce electric current. J. Hazard. Mat. 424, 127358. doi:10.1016/j.jhazmat.2021.127358
Eddie, B. J., Wang, Z., Malanoski, A. P., Hall, R. J., Oh, S. D., Heiner, C., et al. (2016). ‘Candidatus Tenderia electrophaga’, an uncultivated electroautotroph from a biocathode enrichment. Int. J. Syst. Evol. Microbiol. 66, 2178–2185. doi:10.1099/ijsem.0.001006
Flexer, V., and Jourdin, L. (2020). Purposely designed hierarchical porous electrodes for high rate microbial electrosynthesis of acetate from carbon dioxide. Acc. Chem. Res. 53, 311–321. doi:10.1021/acs.accounts.9b00523
Franklin, M. J., Chang, C., Akiyama, T., and Bothner, B. (2015). New technologies for studying biofilms. Microbiol. Spectr. 3, 1–32. doi:10.1128/microbiolspec.mb-0016-2014
Fruehauf, H. M., Enzmann, F., Harnisch, F., Ulber, R., and Holtmann, D. (2020). Microbial electrosynthesis—an inventory on technology readiness level and performance of different process variants. Biotechnol. J. 15, 2000066. doi:10.1002/biot.202000066
Groher, A., and Weuster-Botz, D. (2016). General medium for the autotrophic cultivation of acetogens. Bioprocess Biosyst. Eng. 39, 1645–1650. doi:10.1007/s00449-016-1634-5
Hackbarth, M., Jung, T., Reiner, J. E., Gescher, J., Horn, H., Hille-Reichel, A., et al. (2020). Monitoring and quantification of bioelectrochemical Kyrpidia spormannii biofilm development in a novel flow cell setup. Chem. Eng. J. 390, 124604. doi:10.1016/j.cej.2020.124604
Häuser, L., Erben, J., Pillot, G., Kerzenmacher, S., Dreher, W., and Küstermann, E. (2022). In vivo characterization of electroactive biofilms inside porous electrodes with MR Imaging. RSC Adv. 12, 17784–17793. doi:10.1039/d2ra01162j
Heffernan, J. K., Valgepea, K., de Souza Pinto Lemgruber, R., Casini, I., Plan, M., Tappel, R., et al. (2020). Enhancing CO2-valorization using Clostridium autoethanogenum for sustainable fuel and chemicals production. Front. Bioeng. Biotechnol. 8, 204. doi:10.3389/fbioe.2020.00204
Heijnen, J. J., Roels, J. A., and Stouthamer, A. H. (1979). Application of balancing methods in modeling the penicillin fermentation. Biotechnol. Bioeng. 21, 2175–2201. doi:10.1002/bit.260211204
Hou, J., Wang, C., Rozenbaum, R. T., Gusnaniar, N., de Jong, E. D., Woudstra, W., et al. (2019). Bacterial density and biofilm structure determined by optical coherence tomography. Sci. Rep. 9, 9794–9812. doi:10.1038/s41598-019-46196-7
Huang, C. T., Mcfeters, G. A., and Stewart, P. S. (1996). Evaluation of physiological staining, cryoembedding and autofluorescence quenching techniques on fouling biofilms. Biofouling 9, 269–277. doi:10.1080/08927019609378309
Izadi, P., Fontmorin, J. M., Godain, A., Yu, E. H., and Head, I. M. (2020). Parameters influencing the development of highly conductive and efficient biofilm during microbial electrosynthesis: The importance of applied potential and inorganic carbon source. NPJ Biofilms Microbiomes 6, 40–15. doi:10.1038/s41522-020-00151-x
Jourdin, L., Winkelhorst, M., Rawls, B., Buisman, C. J. N., and Strik, D. P. B. T. B. (2019a). Enhanced selectivity to butyrate and caproate above acetate in continuous bioelectrochemical chain elongation from CO2: Steering with CO2 loading rate and hydraulic retention time. Bioresour. Technol. Rep. 7, 100284. doi:10.1016/j.biteb.2019.100284
Jourdin, L., and Burdyny, T. (2021). Microbial electrosynthesis: Where do we go from here? Trends Biotechnol. 39, 359–369. doi:10.1016/j.tibtech.2020.10.014
Jourdin, L., Raes, S. M. T., Buisman, C. J. N., and Strik, D. P. B. T. B. (2018). Critical biofilm growth throughout unmodified carbon felts allows continuous bioelectrochemical chain elongation from CO2 up to caproate at high current density. Front. Energy Res. 6, 1–15. doi:10.3389/fenrg.2018.00007
Jourdin, L., Winkelhorst, M., Rawls, B., Buisman, C. J. N., and Strik, D. P. B. T. B. (2019b). Enhanced selectivity to butyrate and caproate above acetate in continuous bioelectrochemical chain elongation from CO2: Steering with CO2 loading rate and hydraulic retention time. Bioresour. Technol. Rep. 7, 100284. doi:10.1016/j.biteb.2019.100284
Lee, J., Lee, J. W., Chae, C. G., Kwon, S. J., Kim, Y. J., Lee, J. H., et al. (2019). Domestication of the novel alcohologenic acetogen Clostridium sp. AWRP: From isolation to characterization for syngas fermentation. Biotechnol. Biofuels 12, 228. doi:10.1186/s13068-019-1570-0
Legland, D., Arganda-Carreras, I., and Andrey, P. (2016). MorphoLibJ: Integrated library and plugins for mathematical morphology with ImageJ. Bioinformatics 32, 3532–3534. doi:10.1093/bioinformatics/btw413
Magalhães, A. P., França, Â., Pereira, M. O., and Cerca, N. (2019). RNA-based qPCR as a tool to quantify and to characterize dual-species biofilms. Sci. Rep. 9, 13639–13712. doi:10.1038/s41598-019-50094-3
Molenaar, S. D., Sleutels, T., Pereira, J., Iorio, M., Borsje, C., Zamudio, J. A., et al. (2018). In situ biofilm quantification in bioelectrochemical systems by using optical coherence tomography. ChemSusChem 11, 2171–2178. doi:10.1002/cssc.201800589
Mountcastle, S. E., Vyas, N., Villapun, V. M., Cox, S. C., Jabbari, S., Sammons, R. L., et al. (2021). Biofilm viability checker: An open-source tool for automated biofilm viability analysis from confocal microscopy images. npj Biofilms Microbiomes 7, 44–12. doi:10.1038/s41522-021-00214-7
Patil, S. A., Gildemyn, S., Pant, D., Zengler, K., Logan, B. E., and Rabaey, K. (2015). A logical data representation framework for electricity-driven bioproduction processes. Biotechnol. Adv. 33, 736–744. doi:10.1016/j.biotechadv.2015.03.002
Persson, F., Suarez, C., Hermansson, M., Plaza, E., Sultana, R., and Wilén, B. M. (2017). Community structure of partial nitritation-anammox biofilms at decreasing substrate concentrations and low temperature. Microb. Biotechnol. 10, 761–772. doi:10.1111/1751-7915.12435
Philips, J. (2020). Extracellular electron uptake by acetogenic bacteria: Does H2 consumption favor the H2 evolution reaction on a cathode or metallic iron? Front. Microbiol. 10, 2997. doi:10.3389/fmicb.2019.02997
Phillips, D. A., Bird, L. J., Eddie, B. J., Yates, M. D., Tender, L. M., Voigt, C. A., et al. (2020). Activation of protein expression in electroactive biofilms. ACS Synth. Biol. 9, 1958–1967. doi:10.1021/acssynbio.0c00278
Phillips, J. R., Klasson, K. T., Clausen, E. C., and Gaddy, J. L. (1993). Biological production of ethanol from coal synthesis gas - medium development studies. Appl. Biochem. Biotechnol. 39 (40), 559–571. doi:10.1007/BF02919018
Popovic, M. (2019). Thermodynamic properties of microorganisms: Determination and analysis of enthalpy, entropy, and gibbs free energy of biomass, cells and colonies of 32 microorganism species. Heliyon 5, e01950. doi:10.1016/j.heliyon.2019.e01950
Prévoteau, A., Carvajal-Arroyo, J. M., Ganigué, R., and Rabaey, K. (2020). Microbial electrosynthesis from CO2: Forever a promise? Curr. Opin. Biotechnol. 62, 48–57. doi:10.1016/j.copbio.2019.08.014
Rabaey, K., and Rozendal, R. A. (2010). Microbial electrosynthesis - revisiting the electrical route for microbial production. Nat. Rev. Microbiol. 8, 706–716. doi:10.1038/nrmicro2422
Relucenti, M., Familiari, G., Donfrancesco, O., Taurino, M., Li, X., Chen, R., et al. (2021). Microscopy methods for biofilm imaging: Focus on sem and VP-SEM pros and cons. Biol. (Basel) 10, 51. doi:10.3390/biology10010051
Rice, D. L. (1984). A Simple mass transport model for metal uptake by marine macroalgae growing at different rates. J. Exp. Mar. Bio. Ecol. 82, 175–182. doi:10.1016/0022-0981(84)90102-3
Roghair, M., Strik, D. P. B. T. B., Steinbusch, K. J. J., Weusthuis, R. A., Bruins, M. E., and Buisman, C. J. N. (2016). Granular sludge formation and characterization in a chain elongation process. Process Biochem. 51, 1594–1598. doi:10.1016/j.procbio.2016.06.012
Shen, S., Wang, G., Zhang, M., Tang, Y., Gu, Y., Jiang, W., et al. (2020). Effect of temperature and surfactant on biomass growth and higher-alcohol production during syngas fermentation by Clostridium carboxidivorans P7. Bioresour. Bioprocess. 7, 56. doi:10.1186/s40643-020-00344-4
Shen, Y., Brown, R., and Wen, Z. (2014). Syngas fermentation of Clostridium carboxidivoran P7 in a hollow fiber membrane biofilm reactor: Evaluating the mass transfer coefficient and ethanol production performance. Biochem. Eng. J. 85, 21–29. doi:10.1016/j.bej.2014.01.010
Shrestha, S., Colcord, B., Fonoll, X., and Raskin, L. (2022). Fate of influent microbial populations during medium chain carboxylic acid recovery from brewery and pre-fermented food waste streams. Environ. Sci. Water Res. Technol. 8, 257–269. doi:10.1039/d1ew00656h
Steinbusch, K. J. J., Hamelers, H. V. M., Plugge, C. M., and Buisman, C. J. N. (2011). Biological formation of caproate and caprylate from acetate: Fuel and chemical production from low grade biomass. Energy Environ. Sci. 4, 216–224. doi:10.1039/c0ee00282h
Stewart, P. S. (2012). Mini-review: Convection around biofilms. Biofouling 28, 187–198. doi:10.1080/08927014.2012.662641
Sydow, A., Krieg, T., Ulber, R., and Holtmann, D. (2017). Growth medium and electrolyte—how to combine the different requirements on the reaction solution in bioelectrochemical systems using Cupriavidus necator. Eng. Life Sci. 17, 781–791. doi:10.1002/elsc.201600252
Valgepea, K., de Souza Pinto Lemgruber, R., Meaghan, K., Palfreyman, R. W., Abdalla, T., Heijstra, B. D., et al. (2017). Maintenance of ATP homeostasis triggers metabolic shifts in gas-fermenting acetogens. Cell Syst. 4, 505–515.e5. e5. doi:10.1016/j.cels.2017.04.008
Vignola, M., Werner, D., Hammes, F., King, L. C., and Davenport, R. J. (2018). Flow-cytometric quantification of microbial cells on sand from water biofilters. Water Res. 143, 66–76. doi:10.1016/j.watres.2018.05.053
Wang, H., and Ren, Z. J. (2013). A comprehensive review of microbial electrochemical systems as a platform technology. Biotechnol. Adv. 31, 1796–1807. doi:10.1016/j.biotechadv.2013.10.001
Wechselberger, P., Sagmeister, P., and Herwig, C. (2013). Real-time estimation of biomass and specific growth rate in physiologically variable recombinant fed-batch processes. Bioprocess Biosyst. Eng. 36, 1205–1218. doi:10.1007/s00449-012-0848-4
Weckhuysen, B. M. (2002). Snapshots of a working catalyst: Possibilities and limitations of in situ spectroscopy in the field of heterogeneous catalysis. Chem. Commun. 2, 97–110. doi:10.1039/b107686h
Wolf, G., Crespo, J. G., and Reis, M. A. M. (2002). Optical and spectroscopic methods for biofilm examination and monitoring. Rev. Environ. Sci. Biotechnol. 1, 227–251. doi:10.1023/A:1021238630092
Keywords: biomass-specific rates, biofilm, electroactive bacteria, bioelectrochemistry, chain elongation, CO2 conversion, continuous bioreactors, microbial electrosynthesis
Citation: Winkelhorst M, Cabau-Peinado O, Straathof AJJ and Jourdin L (2023) Biomass-specific rates as key performance indicators: A nitrogen balancing method for biofilm-based electrochemical conversion. Front. Bioeng. Biotechnol. 11:1096086. doi: 10.3389/fbioe.2023.1096086
Received: 11 November 2022; Accepted: 04 January 2023;
Published: 19 January 2023.
Edited by:
Ka Yu Cheng, CSIRO Land and Water, AustraliaReviewed by:
Suman Bajracharya, Luleå University of Technology, SwedenElizabeth Susan Heidrich, Newcastle University, United Kingdom
Copyright © 2023 Winkelhorst, Cabau-Peinado, Straathof and Jourdin. This is an open-access article distributed under the terms of the Creative Commons Attribution License (CC BY). The use, distribution or reproduction in other forums is permitted, provided the original author(s) and the copyright owner(s) are credited and that the original publication in this journal is cited, in accordance with accepted academic practice. No use, distribution or reproduction is permitted which does not comply with these terms.
*Correspondence: Ludovic Jourdin, bC5qb3VyZGluQHR1ZGVsZnQubmw=