- 1Chair of Applied and Molecular Microbiology, Institute of Biotechnology, Technische Universität Berlin, Berlin, Germany
- 2BASF SE, Ludwigshafen, Germany
Introduction: Thermothelomyces thermophilus, formerly known as Myceliophthora thermophila, is used in industry to produce lignocellulolytic enzymes and heterologous proteins. However, the transcriptional network driving the expression of these proteins remains elusive. As a first step to systematically uncover this network, we investigated growth, protein secretion, and transcriptomic fingerprints of strains deficient in the cellulolytic transcriptional regulators Clr1, Clr2, and Clr4, respectively.
Methods: The genes encoding Clr1, Clr2, and Clr4 were individually deleted using split marker or the CRISPR/Cas12a technology and the resulting strains as well as the parental strain were cultivated in bioreactors under chemostat conditions using glucose as the carbon source. During steady state conditions, cellulose was added instead of glucose to study the genetic and cellular responses in all four strains to the shift in carbon source availability.
Results: Notably, the clr1 and clr2 deletion strains were unable to continue to grow on cellulose, demonstrating a key role of both regulators in cellulose catabolism. Their transcriptomic fingerprints uncovered not only a lack of cellulase gene expression but also reduced expression of genes predicted to encode hemicellulases, pectinases, and esterases. In contrast, the growth of the clr4 deletion strain was very similar compared to the parental strain. However, a much stronger expression of cellulases, hemicellulases, pectinases, and esterases was observed.
Discussion: The data gained in this study suggest that both transcriptional regulators Clr1 and Clr2 activate the expression of genes predicted to encode cellulases as well as hemicellulases, pectinases, and esterases. They further suggest that Clr1 controls the basal expression of cellulases and initiates the main lignocellulolytic response to cellulose via induction of clr2 expression. In contrast, Clr4 seems to act as a repressor of the lignocellulolytic response presumably via controlling clr2 expression. Comparative transcriptomics in all four strains revealed potentially new regulators in carbohydrate catabolism and lignocellulolytic enzyme expression that define a candidate gene list for future analyses.
Introduction
Plant biomass, which consists of cellulose (38%–50%), hemicellulose (23%–32%), lignin (12%–25%), and pectin (usually very low percentages), is the most abundant carbon source on Earth and so far the only viable alternative to fossil resources for the production of biofuels and platform chemicals (Cherubini, 2010; Ponnusamy et al., 2018). However, high costs for the pre-treatment and the enzymatic hydrolysis steps, especially high costs for the isolation and purification of the required enzymes, limit commercialization of biochemical lignocellulosic biorefineries (Wertz and Bédué, 2013; Konwar et al., 2018). Filamentous fungi naturally secrete a huge variety of enzymes required for plant biomass degradation, called “CAZYs (Carbohydrate-Active enZYmes)” due to their heterotrophic lifestyle (Lange, 2017; Meyer et al., 2020). Therefore, research on fungal platform strains aims to identify and optimize highly efficient natural enzyme producer strains and to understand CAZY expression in order to tailor and boost the expression of lignocellulolytic enzymes in these hosts.
One of the fungal platform strains of high interest is Thermothelomyces thermophilus (formerly known as Myceliophthora thermophila), a highly efficient natural secretor of cellulases and hemicellulases. In industry, hypersecreting T. thermophilus strains were developed that produce 100–120 g/L of cellulases (Visser et al., 2011; Huuskonen, 2020). The fact that this fungus is a thermophilic fungus is of further interest for lignocellulosic degradation processes, since the secreted enzymes are thermostable (up to 85°C–90 °C) and allow for high process temperatures, which in turn reduce viscosity and thus increase the solubility of lignocellulosic biomass (Viikari et al., 2007; Blumer-Schuette et al., 2014; Berezina et al., 2017; Meyer et al., 2020). Besides cellulase hypersecreting strains, strains with low cellulase expression were also successfully developed in industry with the aim to reduce the natural secretion and therefore allowing for a higher yield, purity, and activity of specific homologous or heterologous proteins (Visser et al., 2011; Haefner et al., 2017b; Haefner et al., 2017a).
It is generally thought that the expression of fungal lignocellulolytic enzymes is mainly regulated at the transcriptional level. Two of the most important activators that are also conserved amongst many filamentous fungi are Clr1 and Clr2 (according to the gene nomenclature in N. crassa and Trichoderma reesei) or ClrA and ClrB, respectively (according to the gene nomenclature in Aspergillus and Penicillium species) (Benocci et al., 2017). The regulator Clr1/A occupies a central position and directly regulates genes that are necessary for the hydrolysis of cellulose as well as for the import of soluble degradation products in many filamentous fungi. In Neurospora crassa and Aspergillus nidulans, Clr1/A is involved in cellulose sensing, as the presence of cellulose or its degradation products (e.g., cellobiose) activate Clr1/A (Coradetti et al., 2012; Coradetti et al., 2013; Craig et al., 2015). Clr2/B regulates genes that are essential for cellulose degradation in A. nidulans, N. crassa, Aspergillus niger, Aspergillus oryzae and Penicillium oxalicum (Coradetti et al., 2013; Ogawa et al., 2013; Yao et al., 2015; Raulo et al., 2016). To date, N. crassa is the sole fungus in which it has been shown that Clr2 expression is controlled via Clr1, and that both jointly regulate the expression of other transcription factors important for plant biomass degradation such as Col26, Xlr1, and Vib1 (Craig et al., 2015). More recently, Clr4 was identified as another regulator in the Clr family, which was found to activate (hemi)cellulase expression and the expression of other regulators such as Clr1, Clr2 and Xyr1 in N. crassa and T. thermophilus (Liu et al., 2019).
In the present study, we therefore aimed to lay the groundwork for a systematic understanding of the role of Clr1, Clr2, and Clr4 in the thermophilic platform strain T. thermophilus. All studies in literature on lignocellulolytic enzyme expression in T. thermophilus rely on data obtained from shake flask experiments, experiments which do not reflect industrial cultivation conditions and are more prone to variation due to less control of variables such as oxygen and pH. We therefore established in this work chemostat cultivation conditions for T. thermophilus which allowed us to study growth and physiology of this fungus under non-inducing (glucose as carbon source) and inducing (cellulose as carbon source) conditions in a highly reproducible manner. We furthermore investigated the physiological, transcriptomic and secretion responses of T. thermophilus under chemostat conditions using engineered strains carrying deletions for the genes clr1, clr2 or clr4.
Materials and methods
Strains, media, and growth conditions
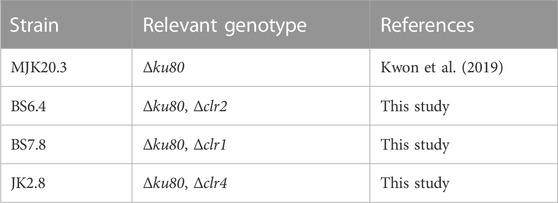
To obtain conidia, all T. thermophilus strains used in this study (Table 1) were grown at 37 °C on complete medium (CM) (Arentshorst et al., 2012) for 3 days.
For the growth assay, minimal medium (MM) (Arentshorst et al., 2012) with bromophenolblue as a pH indicator was used. For mono- and disaccharides a final concentration of 25 mM and for polysaccharides a final concentration of 1% in the medium were used. Mono- and disaccharides were sterile filtrated and added to the medium after autoclaving. Galacturonic acid, polygalacturonic acid, and pectin were added prior to autoclaving and the pH was adjusted to ∼ pH 5.5. Cellulose and xylan were added to the medium before autoclaving without adjusting the pH value. 1,000 spores (in 10 μL) of each strain were spotted on MM agar and incubated at 37 °C for 4 days.
All bacterial plasmids were propagated in Escherichia coli TOP10 (Invitrogen) using 100 μg/mL ampicillin or 50 μg/mL kanamycin for selection.
Bioreactor cultivation and analysis
For bioreactor cultivation New Brunswick BioFlo310 bioreactors (Eppendorf) were used. Prior to this, a protocol for a stable bioreactor cultivation had to be established. During this process, several hurdles had to be overcome (data not shown). In brief, too high a concentration of calcium chloride (2.7 mM CaCl2x2H2O) and too low a temperature (37 °C) were causing (independently from each other) a sporulation in batch phase when less than 10% of the supplied glucose were consumed. After adjusting the calcium chloride concentration to 0.27 mM CaCl2x2H2O and the cultivation temperature to 45°C, a stable batch cultivation without premature sporulation was possible and the chemostat cultivations were started. For this purpose, 1*109 spores/L were inoculated in bioreactor medium containing 76 mM (NH4)2SO4, 2 mM MgSO4x7H2O, 12 mM KH2PO4, 7.5 mM KCl, 0.27 mM CaCl2x2H2O, 0.025 mM biotin, 55.5 mM glucose and trace elements (134 µM EDTA disodium salt dihydrate, 70 µM ZnSO4x7H2O, 162 µM H3BO3, 23 µM MnSO4xH2O, 16.4 µM FeSO4x7H2O, 6.5 µM CoCl2x6H2O, 5.8 µM CuSO4x5H2O, 5.7 µM Na2MoO4x2H2O; pH adjusted to 6 using 1 M NaOH). CaCl2x2H2O, glucose and trace elements were autoclaved separately and added to the medium after autoclaving. Biotin was sterile filtrated and added to the medium after autoclaving. Prior to autoclaving pH was set to 6.7 using 10 M NaOH. Prior to inoculation, the temperature was set to 45°C, pH value to 6.7 (if necessary), stirring to 100 rpm, and aeration to 0.01 slpm (after reaching 100% DOT). pH regulation was achieved via 25% ammonia solution and 20% phosphoric acid. After inoculation, a time-based profile for aeration and stirring was started. Aeration and stirring were constantly increased within 10 h to 1 slpm and 750 rpm, respectively. At the end of the exponential phase when glucose concentration was close to 0–1 g/L (∼13 g base addition) chemostat cultivation was started by addition of medium at a dilution rate of 0.1 1/h and maintaining culture broth weight at 5 kg. To prevent foaming, PPG 2000 was added with a rate of 20 mg/h during chemostat cultivation. In steady state, the carbon source was changed to cellulose (autoclaved separately) by removing 500 g culture broth and subsequently adding 450 g bioreactor medium (without glucose) and 50 g microcrystalline cellulose resulting in 5 kg total weight of the culture broth. Cultivation was continued as a batch cultivation. Offgas values (O2 consumed, CO2 produced), temperature, pH, dissolved oxygen (DO), weight, and base addition were monitored during cultivation. Samples for biomass, protein and glucose determination, RNA extraction, and microscopy were taken before and after (0.5 h, 1 h, 2 h, 4 h) the addition of the medium containing cellulose. Every sample taken was split into different aliquots according to the planned analysis. For microscopy, a small amount of the culture broth was transferred to a reaction tube. The biomass sample was gained by filtrating the culture broth sample via vacuum filtration, collecting mycelium on a filter to obtain dry biomass weight. The supernatant of that sample was used for protein and glucose determination. Samples for RNA isolation were taken as described for the biomass sample, but the filter carrying the mycelium was immediately frozen in liquid nitrogen.
Molecular biology methods
Most molecular techniques were performed according to standard procedures described in (Green and Sambrook, 2012) if not mentioned separately. Transformation of T. thermophilus and isolation of genomic DNA were performed as described in (Arentshorst et al., 2012) with exceptions described in (Kwon et al., 2019). Primers and plasmids used in this study are summarized in Supplementary Material S11 and Supplementary Material S12. All Plasmids were obtained by BASF SE except plasmid pBS1.13 for the deletion of clr4. This plasmid was generated via circular polymerase extension cloning (CPEC) (Quan and Tian, 2011) using the primers listed in Supplementary Material S11 to generate the different fragments (see Supplementary Material S1) used for CPEC. The structure and content of each deletion cassette was similar for all plasmids except the respective 5′and 3′flanks for homologous recombination.
The progenitor strains of all other mentioned strains were MJK20.2 (Kwon et al., 2019) or MJK20.3 (both Δku80). MJK20.3 was generated by sub cultivating and re-analyzing MJK20.2 since wildtype contamination was detected in MJK20.2 (due to sensitivity, only detectable with diagnostic PCR not via Southern analysis, data not shown).
The regulator deletion mutants were generated by deleting the respective genes (clr1: MYCTH_2298863, clr2: MYCTH_38704, and clr4: MYCTH_2296492) in MJK20.2 or MJK20.3. Strain BS5.14 (Δku80, clr2:DR-PAngpdA–AnamdS-TAnamdS-DR) was generated via transforming 3 µg of each PCR-amplified split marker fragment (see Supplementary Material S11 and Supplementary Material S12 for plasmids and primers used) containing an amdS marker and approximately 1 kb flanks each for homologous recombination. The 3′split marker fragment contained a second 5′flank for amdS marker removal. Strains BS7.8 (Δku80, Δclr1) and JK1.8 (Δku80, clr4:DR-PAngpdA–AnamdS-TAnamdS-DR) were generated via an RNP based genome editing approach using Cas12a (Kwon et al., 2019) (see Supplementary Material S11 and Supplementary Material S12 for plasmid and primers used). For BS7.8 3 µg of each split marker fragment and for JK1.8 3 µg of the whole plasmid carrying the deletion cassette was used instead of two split marker fragments.
After transformation, the resulting strains BS5.14 and JK1.8 were sub-cultivated on fluoroacetamide (FAA) medium plates according to (Arentshorst et al., 2012) to obtain marker free strains resulting in strains BS6.4 (Δku80, Δclr2) and JK2.8 (Δku80, Δclr4). For BS7.8 counterselection on FAA medium was not necessary because sub cultivation already allowed for amdS marker removal.
Strains were analyzed via diagnostic PCR and Southern blot analysis to verify the correct integration, the absence of wildtype contamination, and removal of the marker gene. The results of the Southern blot analysis of the marker recycled strains are shown in Supplementary Material S1.
Biochemical methods
Protein concentration was determined via Bio-Rad Protein Assay Kit II (Bio-Rad) according to the manufacturer’s instructions. Absorbance was measured at 595 nm and bovine serum albumin was used as a reference.
SDS PAGEs were performed using a 12.5% resolving gel and a 5% stacking gel. Samples were prepared via using a defined volume (20 μL) or a defined amount (2 μg) of protein. This was achieved by either freeze drying the respective volume or the respective amount (based on the results of the protein concentration determination) of the sample and adding 10 μL of H2O MQ.
Glucose concentration was determined using the Glucose Fluid GOD-PAP Kit (Mti Diagnostics) according to the manufacturer’s instructions with 10 µL sample and 100 µL reagent volume. Absorbance was measured at 505 nm.
RNA isolation, purification, sequencing, and analysis
RNA was isolated with the Trizol reagent (Invitrogen) using frozen ground mycelium according to the manufacturer’s instructions.
Samples were purified using the innuPREP RNA Mini Kit 2.0 (Analytik Jena) according to the manufacturer’s instructions. Possible remaining DNA was removed via DNA-free™ DNA Removal Kit (Invitrogen) according to the manufacturer’s instructions. After purification and DNAse treatment, samples were ready for RNA sequencing.
RNA was sequenced at Microsynth AG (Balgach) for strains MJK20.3 and BS6.4 and at GenomeScan (Leiden) for strains BS7.8 and JK2.8 using an Illumina platform with 150 bp reads paired end, polyA enrichment, and >5 million reads per sample. A quality check of the RNA samples prior to sequencing was included according to the guidelines of the company. Prior to RNA sequencing at GenomeScan (Leiden), no purification and DNAse treatment was performed.
Obtained read data were first quality controlled via FastQC (Andrews, 2010) and if necessary, trimmed with BBTools (Bushnell, 2014). STAR (Dobin et al., 2013) was used for mapping the reads to the T. thermophilus ATCC 42464 genome (assembly ASM22609v1, downloaded from NCBI (https://www.ncbi.nlm.nih.gov/)). Data normalization and differential gene expression analysis was performed with DEseq2 (Love et al., 2014). Differential gene expression was evaluated with Wald test and Benjamini and Hochberg False Discovery Rate (FDR) with a threshold of 0.05 (Benjamini and Hochberg, 1995). Enrichment analyses were performed with DAVID (Huang et al., 2009b; 2009a) using standard settings and a p-value cutoff of 0.05. Gene annotations were obtained combining information from DAVID (see above), NCBI (see above), JGI (https://jgi.doe.gov/), the CAZY database (http://www.cazy.org/) and publications (Berka et al., 2011; Karnaouri et al., 2014). Venn analysis was done with the help of http://bioinformatics.psb.ugent.be/webtools/Venn/. Packages used for analysis, creating plots, and diagrams in R via RStudio (https://rstudio.com/) are “complexheatmap”, “circlize”, “devtools”, “rafalib”, “rsamtools”, “BiocParallel”, “DESeq2”, “GenomicFeatures”, “GenomicAlignments”, “ggplot2”, “pheatmap”, “RColorBrewer”, and “gplot”. RNA Seq. raw and processed data have been deposited at the GEO database (https://www.ncbi.nlm.nih.gov/geo/) under the accession number GSE183387. Supplementary Material S13 includes the raw and normalized read counts.
For quantitative polymerase chain reaction (qPCR), purified and DNAse treated RNA was transcribed into cDNA (RevertAid H Minus First Strand cDNA Synthesis Kit; Thermo Fischer Scientific). The qPCR reaction was performed using the Biozym Blue S´Green qPCR Kit (Biozym) according to the manufacturer’s instructions. No template controls (NTC) and no reverse transcriptase controls (NRT) were included. The primers used for the reaction are listed in Supplementary Material S11. The results are shown in Supplementary Material S4.
Results
Generation of clr1, clr2, and clr4 deletion strains
The general deletion strategy in T. thermophilus was based on a split marker approach using the removable amdS as selection marker (Kelly and Hynes, 1985; Nielsen et al., 2006) as well as the CRISPR/Cas12a technology established in our lab (Kwon et al., 2019) (for details see Supplementary Material S1 and Materials and Methods). Strain MJK20.3, which is deleted for the ku80 gene that encodes a component of the non-homologous end joining machinery (Critchlow and Jackson, 1998) and thus allows highly efficient targeted homologous recombination frequencies (Kwon et al., 2019), was used as parental strain. In this strain, the genes encoding the transcription factors Clr1, Clr2, or Clr4 were individually deleted using the amdS marker. The genotypes were verified after marker removal via diagnostic PCR (data not shown) and Southern analysis (Supplementary Material S1). The resulting strains were named BS7.8 (Δclr1), BS6.4 (Δclr2), and JK2.8 (Δclr4) (Table 1).
To test whether the different regulators are important for T. thermophilus to feed on monomeric and polymeric carbon sources derived from plant biomass, a growth assay was conducted with the parental and the deletion strains. As depicted in Figure 1, all strains were able to grow on the 16 different carbon sources tested. However, BS6.4 (Δclr2) displayed reduced growth on cellulose and pectin and BS7.8 (Δclr1) on cellulose and cellobiose, respectively. Notably, T. thermophilus prefers glucose, cellobiose, xylan, mannose, starch, and cellulose over the other carbon sources tested.
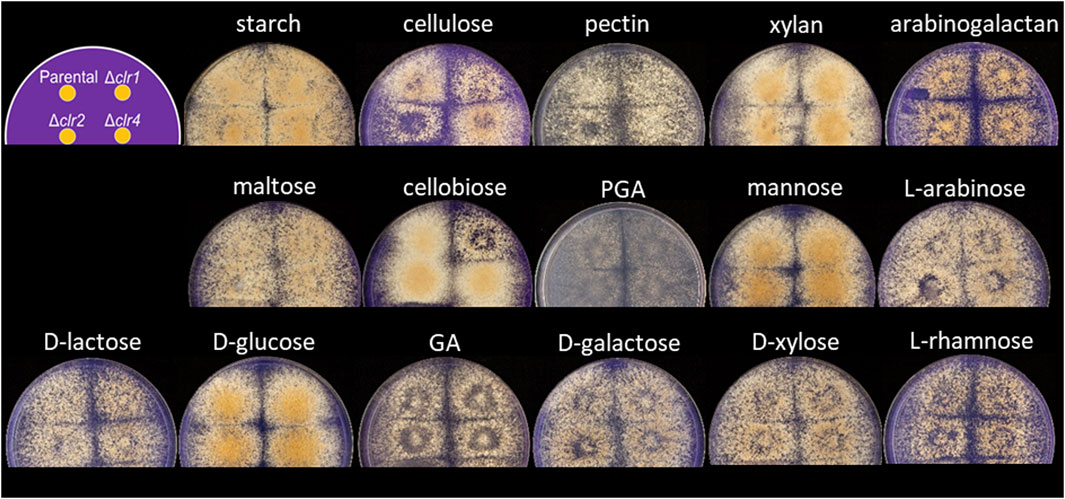
FIGURE 1. Carbon-source dependent growth of T. thermophilus strains deleted for clr1, clr2 or clr4, respectively. Minimal medium agar plates were inoculated with 1,000 spores for the strains MJK20.3, BS7.8 (Δclr1), BS6.4 (Δclr2) or JK2.8 (Δclr4) according to the scheme shown in the upper left. Pictures were taken after 4 days of cultivation at 37 °C. GA = galacturonic acid, PGA = polygalacturonic acid.
Physiology of T. thermophilus strains during glucose-limited chemostat cultivations
The parental reference strain MJK20.3 was used to establish a glucose-limited chemostat cultivation protocol. During the late exponential growth phase, when the biomass reached 5 gDCW/kg, the cultivation process was switched to the chemostat mode with a dilution rate D = 0.1 h−1. Importantly, this switch to glucose-limited feeding provoked a brief sporulation period for about 10 h, after which T. thermophilus slowly resumed filamentous growth which was stable until the end of the chemostat runs (Figure 2 A-C; Table 2). Steady state conditions, where biomass, base addition, and off-gas values (CO2 produced, O2 consumed) were constant for at least 5 residence times, were achieved after about 12–17 residence times. Therefore, strain MJK20.3 and the engineered deletion strains for clr1, clr2, and clr4, respectively, were run in duplicate glucose-limited chemostat cultures for approximately 210 h, after which cellulose was added to the bioreactor medium instead of glucose and the cultivation program switched to a batch mode (for details see Materials and Methods). The reference strain as well as strain JK2.8 (Δclr4) were able to feed on the newly added cellulose and thus started a new exponential growth phase (Figure 2 A-C and Supplementary Material S2; Figures 1A–C), whereas the strains deleted for clr1 and clr2, respectively, were unable to consume cellulose and thus stopped growing (Figure 3 A-C and Supplementary Material S2; Figures 2A–C). Color development of the fermentation broth was comparable between all cultivated strains (Figures 2, 3 D). The maximum growth rates for all strains were very similar, as well as their biomass in steady state (Table 2). Protein secretion as well as specific production rate of extracellular protein in steady state differed especially between JK2.8 (Δclr4) and the other strains (Table 2). Hyphal diameters in exponential state as well as in steady state were very similar between the four strains (Table 2). Nevertheless, notably smaller hyphal diameters could be detected during steady state conditions when compared to the respective diameters in exponential state (Table 2).
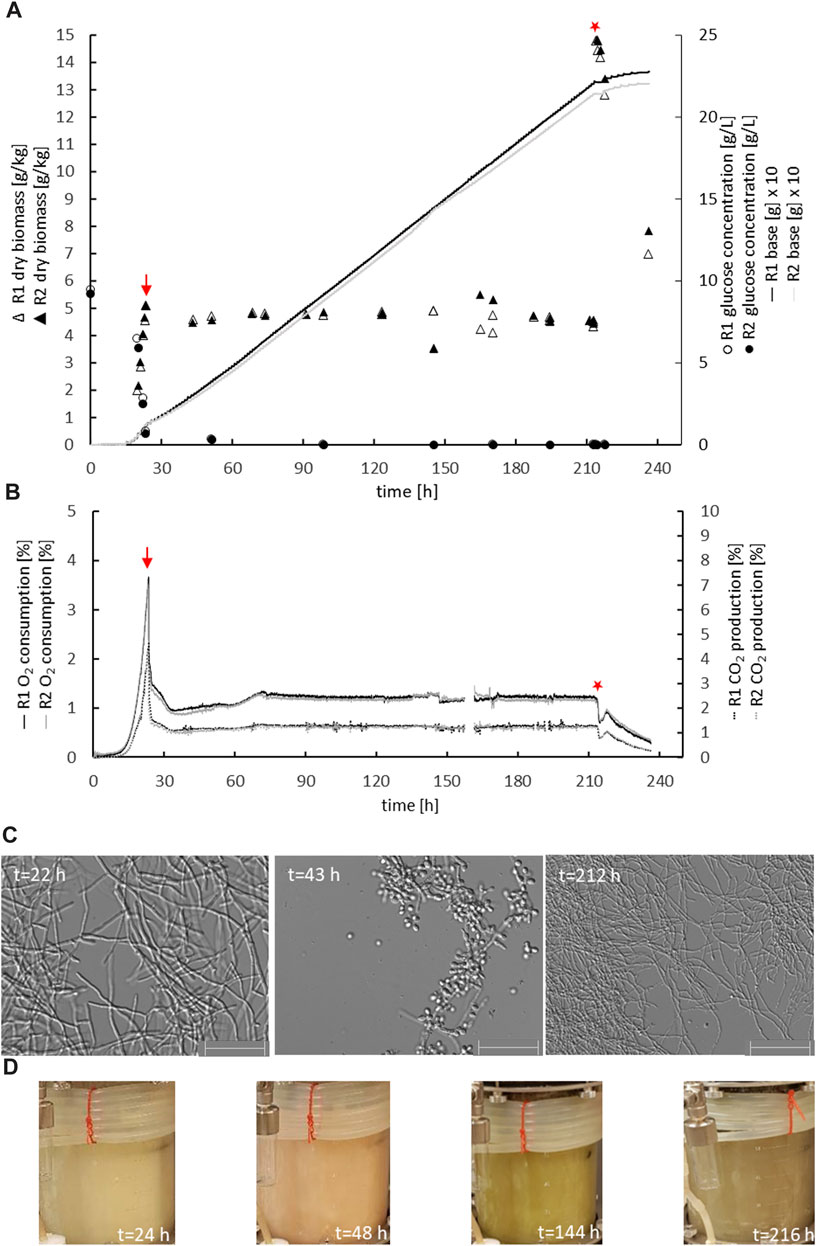
FIGURE 2. Physiology of the parental strain during chemostat bioreactor cultivation. Biomass accumulation, glucose concentration, base addition (A), oxygen consumption, carbon dioxide production (B), mycelial morphology (C), and colour of the culture broth (D) are given for duplicate cultures of strain MJK20.3 (R1, R2). The chemostat cultivation mode was started at the end of the batch phase, indicated with a red arrow. After steady state conditions were reached, 1% cellulose was spiked instead of glucose (red star) and chemostat cultivation was switched to a batch cultivation mode. Note that the addition of cellulose caused an immediate increase in culture dry weight of 10 g/kg and a short-term drop in off gas values. After this, base addition automatically continued, off gas values raised again and biomass decreased, which demonstrated the ability of the control strain to use cellulose as a carbon source. The colour of the culture broth shifted from white-greyish (exponential growth) over pinkish (sporulation after starting chemostat initiation) to brown-greyish (during steady state condition). Scale bar = 50 µm.

TABLE 2. Physiological data for the strains MJK20.3, BS7.8 (Δclr1), BS6.4 (Δclr2) and JK2.8 (Δclr4) during bioreactor cultivation. Standard deviations (±) are given for mean values of duplicate independent results. µexponential state: maximum growth rate in exponential state; Cbiomass: biomass concentration in steady state as dry cell weight (DCW); Cprotein: protein concentration in steady state; qprotein: specific production rate of extracellular protein in steady state. Hyphal diameters in exponential state and steady state were measured from at least 50 individual hyphae.
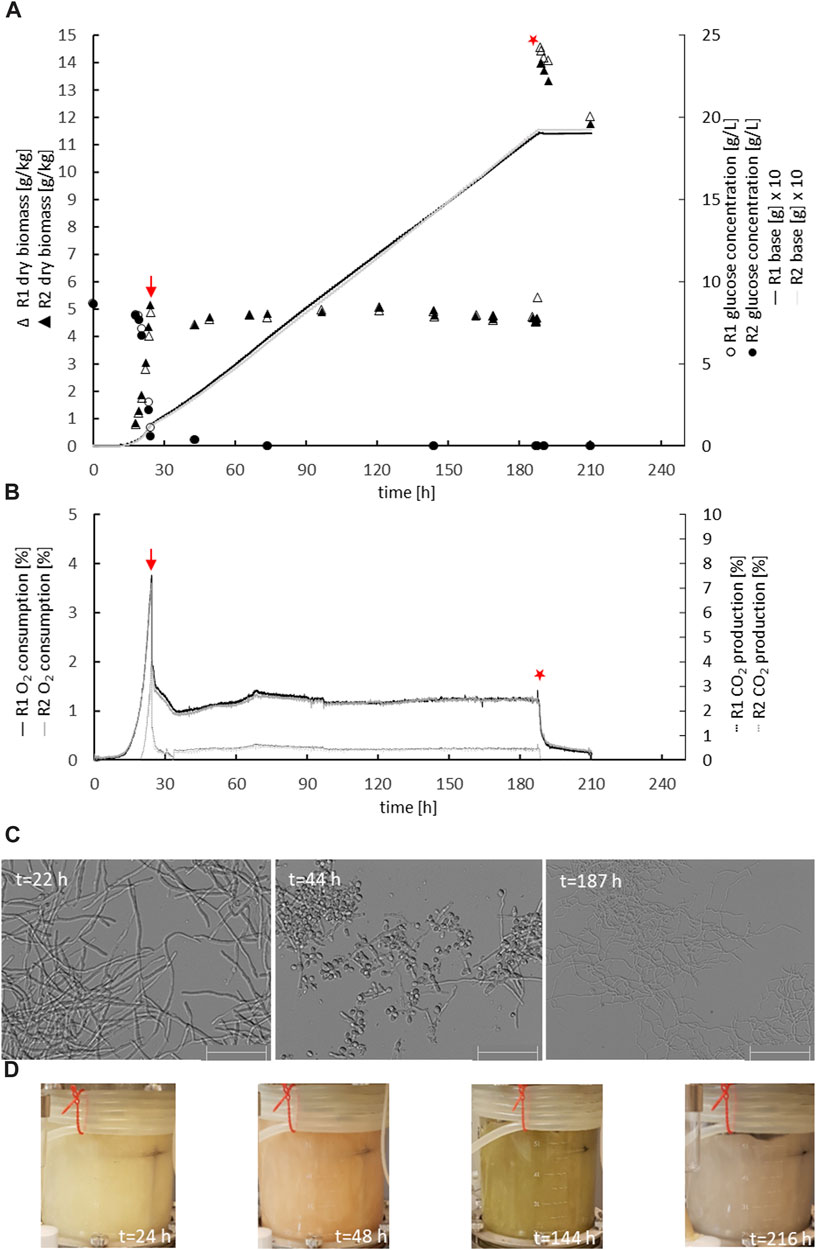
FIGURE 3. Physiology of the clr2 deletion strain during chemostat bioreactor cultivation. Strain BS6.4 was cultivated and analysed as described in Figure legend 2. Biomass accumulation, glucose concentration, base addition (A), oxygen consumption, carbon dioxide production (B), mycelial morphology (C), and colour of the culture broth (D) are given for duplicate cultures of strain BS6.4 (R1, R2). Scale bar = 50 µm.
To investigate a potential impact of cellulose feeding on protein secretion in the 4 T. thermophilus strains, proteins were isolated from the culture supernatants of all strains during steady state conditions as well as 30 min, 1 h, 2 h, and 4 h after the cellulose spike. An increase of approximately 200 mg/L (5 fold vs steady state) and 100 mg/L (3 fold vs steady state) secreted protein was detected for the parental and the Δclr4 strain, respectively (Figure 4), suggesting that the transcription factor Clr4 is important to fully induce protein secretion in response to ambient cellulose. Notably, an altered protein secretion profile became visible especially 4 h after the cellulose spike in the parental and the Δclr4 strain (Supplementary Material S3). The clr1 and clr2 deletion strains did not show any change in their secreted protein titres when confronted with cellulose (Figure 4), demonstrating that both strains - in contrast to the strain deleted for clr4 - were not able to adapt to the new polymeric carbon source and suggesting that the transcription factors Clr1 and Clr2 are key for the adaptational response to cellulose.
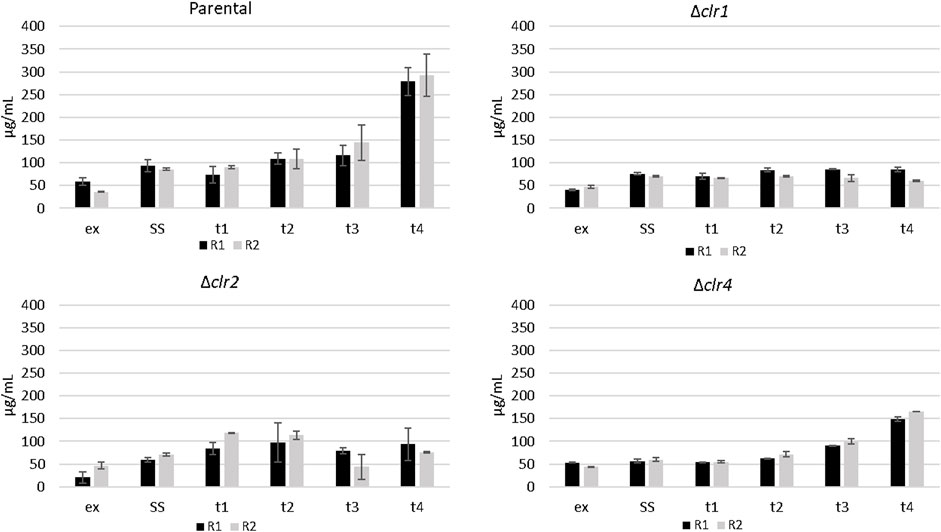
FIGURE 4. Protein secretion in T. thermophilus strains deleted for clr1, clr2 or clr4 in response to cellulose. The amount of protein in the culture supernatants of the samples taken in exponential state (ex), steady state (SS), as well as 0.5 h (t1), 1 h (t2), 2 h (t3), and 4 h after spiking cellulose (t4) for the two replicates (R1, R2) was determined via Bradford assay. The error bar represents the standard deviation of the mean value, deriving from three technical replicates for each biological duplicate sample.
Global transcriptomic responses of T. thermophilus to cellulose adaptation
RNA-sequencing (RNA-Seq.) analysis using samples extracted from duplicate chemostat cultures corresponding to steady state conditions and 30 min, 1 h, 2h, and 4 h, respectively, after the cellulose spike was performed for all three deletion strains and the parental strain. All 40 samples were normalized to allow for direct comparison and used for differential gene expression analyses using moderated t-statistics with a false discovery rate (FDR) < 0.05 (see Methods). Principal component analysis (PCA) demonstrated that steady state samples from all strains clustered together. As expected, cellulose samples from the parental and Δclr4 strain clustered together, as did cellulose samples for the Δ clr1 and Δ clr2 strains (Supplementary Material S4). Quantitative real-time PCR performed for four exemplarily selected genes of our interest confirmed the RNA sequencing data (Supplementary Material S4). The complete list of differentially expressed genes of all sample comparisons including log2fold change and statistical significance is given in Supplementary Material S5. Several thousand genes out of the 9,292 predicted T. thermophilus genes were identified as differentially expressed upon the shift to cellulose relative to the respective steady state condition (Table 3). Notably, the number of differentially expressed genes were higher in all deletion strains when compared to the parental strain MJK20.3 with highest numbers in the Δclr1 strain followed by the Δclr2 strain (Table 3). Venn diagrams uncovered that 345/146 (parental), 1,271/1,238 (Δclr1), 983/1,053 (Δclr2), and 465/225 (Δclr4) genes were up-/downregulated across all points in time after the cellulose spike (Supplementary Material S6). Based on these results, the gene sets were deemed important to study in a more detailed manner. We thus performed GO term enrichment analysis with these gene sets as described earlier (Paege et al., 2016) and in the Methods section (Supplementary Material S7). We note, however, that only ∼30–45% of all T. thermophilus genes do have a GO term annotation depending on the GO term category (https://david.ncifcrf.gov/(Huang et al., 2009b; 2009a)). Consequently, fold enrichment values can be very high despite the low number of genes that belong to a respective category. As summarized in Supplementary Material S7, processes being enriched in the upregulated gene sets of the parental and the Δclr4 strains upon cellulose adaptation belonged to “cellulose catabolic process”, “xylan catabolic process”, “cellulase activity”, “xylanase activity”, and “pectate lyase activity”, whereas processes being enriched in the downregulated gene sets included “carbon metabolic process” and “transferase activity”. The transcriptional response of the deletion strains Δclr1 and Δclr2, which were not able to continue growth after the carbon shift from glucose to cellulose, showed accordingly enriched GO terms connected to cell death in the upregulated gene sets (“mitophagy”, “late nucleophagy”, and “autophagy”) and enriched GO terms connected to growth in the downregulated gene sets (“respiration”, “replication”, “transcription”, “translation”, “biosynthesis”).
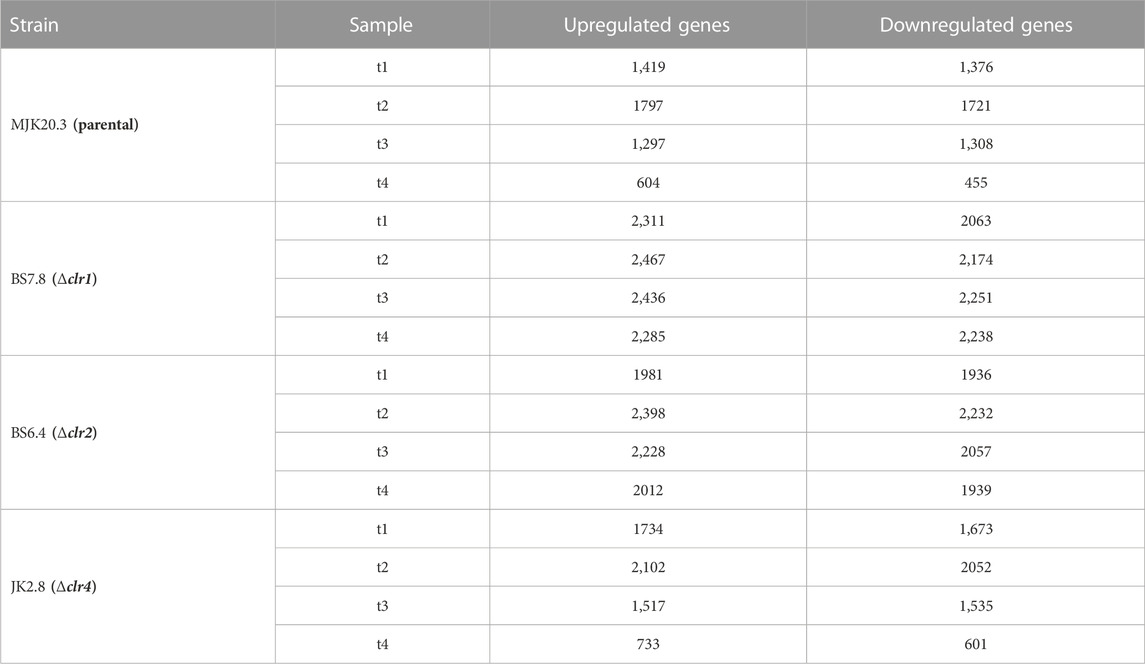
TABLE 3. Differentially expressed genes in T. thermophilus strains in response to the cellulose spike. Number of differentially expressed genes related to the respective steady state condition with a padj. ≤ 0.05, 0.5 h (t1), 1 h (t2), 2 h (t3), and 4 h (t4) after the cellulose spike compared to the respective steady state condition.
Transcriptomic response of predicted carbohydrate-hydrolysing enzymes
In order to specifically understand transcriptomic adaptations in T. thermophilus’ carbohydrate metabolism to the shift from glucose to cellulose, annotations of CAZYs predicted in the genome of T. thermophilus were retrieved from the databases JGI (https://jgi.doe.gov/), NCBI (https://www.ncbi.nlm.nih.gov/) and CAZY (http://www.cazy.org/) as well as from published literature (Berka et al., 2011; Karnaouri et al., 2014). In total, 396 predicted CAZY genes were retrieved, which were divided into different classes and types according to their function and the type of organic carbon they degrade. Genes that could not be assigned to a specific CAZY class or type were grouped into the class “other” (Supplementary Material S8). As depicted in Figure 5, CAZY expression in the parental and Δclr4 strains is almost identical with a slightly stronger differential expression for some upregulated genes especially in the cellulase, hemicellulase, pectinase, and esterase categories in the Δclr4 strain. Genes that are predicted to function in starch metabolism showed strongest downregulation. In contrast, nearly all predicted cellulase, hemicellulase, pectinase, esterase and “other” encoding genes that were strongly upregulated in the parental and Δclr4 strains, were not or only moderately upregulated in the Δclr2 strain, and not differentially expressed in the Δclr1 strain (Figure 5B).
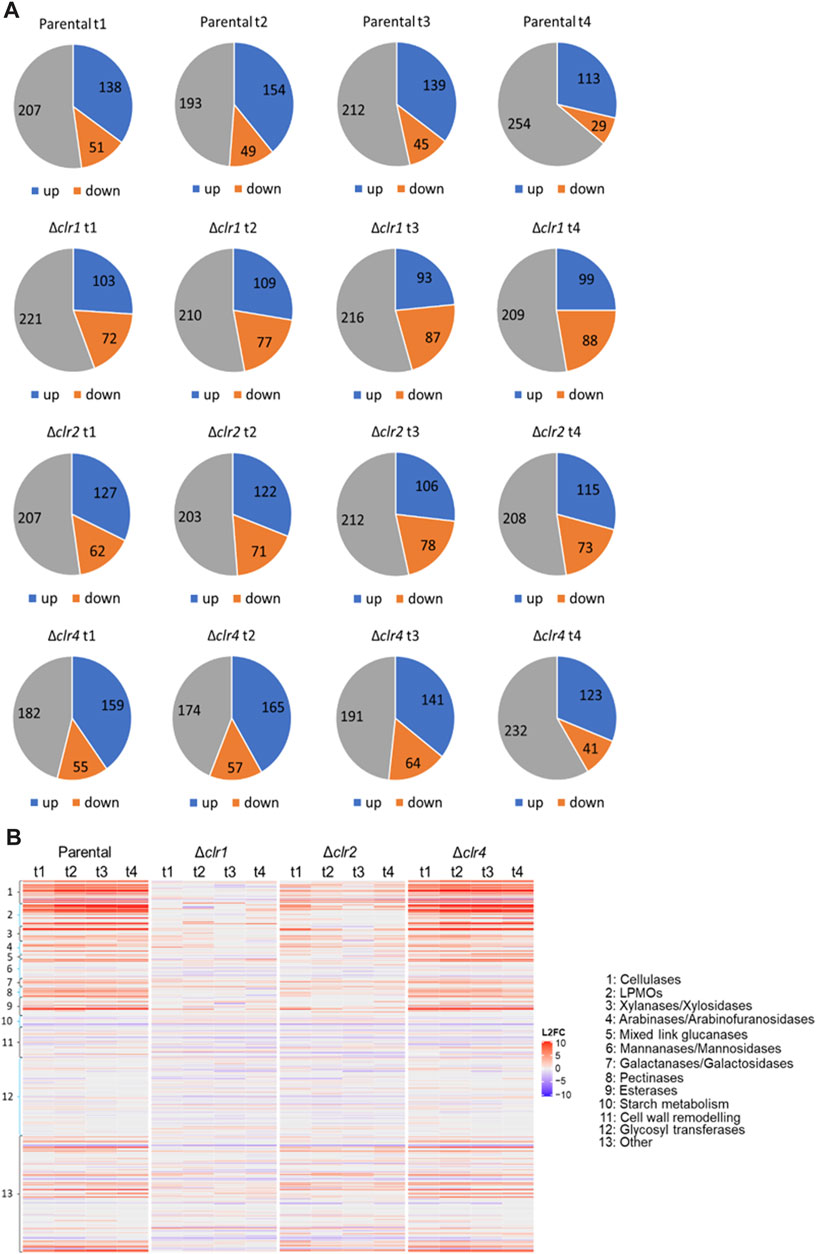
FIGURE 5. Number of differentially expressed genes predicted to encode CAZYs (A) Numbers of up- (blue) and downregulated (orange) genes as well as genes with no differential expression (grey) at 0.5 h (t1), 1 h (t2), 2 h (t3), and 4 h (t4) after the cellulose spike compared to the respective steady state condition (B) Heatmap showing the respective log2 fold change values of these genes (L2FC) belonging to different CAZY classes. Negative values (blue) represent downregulated and positive values (red) upregulated genes.
We individually analysed this set of 113 differentially expressed genes including 17 cellulases to identify candidate genes that are supposedly under strongest control of the three transcription factors Clr1, Clr2, or Clr4. Of interest are the predicted endoglucanases MYCTH_86753, MYCTH_76901, MYCTH_116384, and MYCTH_116157, because they were upregulated at highest level in the parental and Δclr4 strains but not in the Δclr1 and Δclr2 strains (Figure 6 and Supplementary Material S9). Among the predicted cellobiohydrolases, the four highest expressed upregulated genes in the parental and Δclr4 strains but not in the Δclr1 and Δclr2 strains were MYCTH_109566, MYCTH_97137, MYCTH_66729, and MYCTH_2303045 (Figure 6). Notably, none of these genes showed expression in the Δclr1 and Δclr2 strains, except for MYCTH_109566, which showed some residual expression in the Δclr2 strain. The highest expressed and upregulated predicted ß-glucosidase genes were MYCTH_115968, MYCTH_62925, and MYCTH_66804. No expression of these genes was observed in the Δclr1 and Δclr2 strains with exceptions for MYCTH_115968 (the strongest expressed ß-glucosidase in the parental strain) and MYCTH_62925 in Δclr2, where a residual expression can be observed (Figure 6). Three genes predicted to encode lytic polysaccharide monooxygenases (LPMOs) were very highly expressed and upregulated in the parental and Δclr4 strains (MYCTH_80312, MYCTH_111088, MYCTH_112089, Figure 6). Notably, MYCTH_80312 and MYCTH_111088 showed about 2-4-fold higher expression in the Δclr4 strain, when compared to the parental strain, whereas five other predicted LPMO genes (MYCTH_85556, MYCTH_46583, MYCTH_2298502, MYCTH_100518, and MYCTH_79765) showed slightly higher expression in the parental strain when compared to the Δclr4 strain. None of these LPMOs showed expression neither in the Δclr1 nor in the Δclr2 strain (Figure 6). Such a trend for cellulase-encoding genes was also observed for the categories hemicellulases, pectinases, and esterases (Supplementary Material S8 and Supplementary Material S9), i.e., many genes showed higher expression levels in the Δclr4 strain when compared to the parental strain but very low or no expression in the Δclr1 and Δclr2 strains.
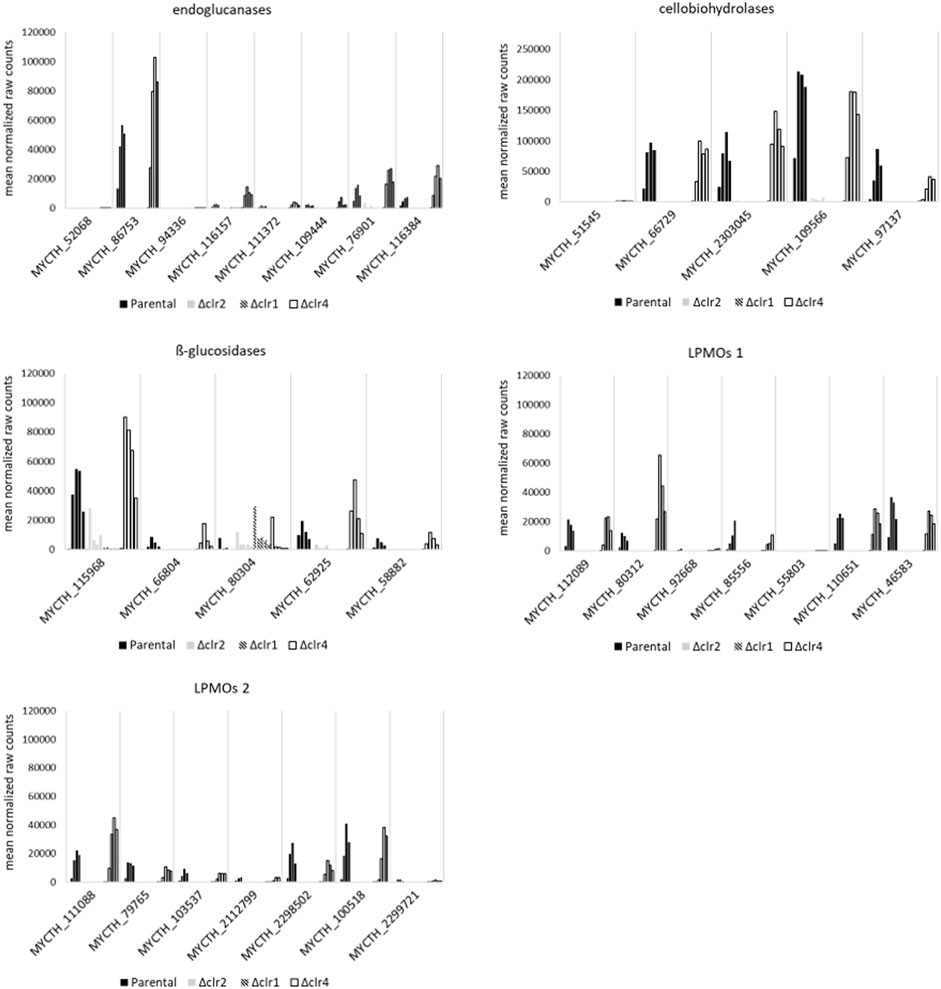
FIGURE 6. Expression of predicted cellulase genes in response to cellulose. Shown are the mean values of the normalized raw counts of the two replicates at steady state, 0.5 h, 1 h, 2 h, and 4 h after spiking with cellulose (left to right bar) for cellulases that are differentially expressed at all points in time after the cellulose spike in T. thermophilus strains deleted for clr1 (patterned), clr2 (grey), or clr4 (black, empty) in comparison to the parental strain (black, filled).
Transcriptomic response of predicted transcription factors
Annotations of predicted transcription factor genes of T. thermophilus were retrieved from the databases JGI (https://jgi.doe.gov/), NCBI (https://www.ncbi.nlm.nih.gov/) and published literature. In total, 357 genes were retrieved to potentially encode transcription factors, which were grouped into different classes according to their DNA binding domain (Supplementary Material S10). Since transcription factors can have multiple DNA binding domains, single transcription factors can be found in several classes. Classes with less than two members were grouped together in the category “other”. Transcription factors that were up- or downregulated across all time points after the cellulose spike, were for us of highest interest as these presumably control the lignocellulolytic response to cellulose. Up to 30% of the predicted transcription factors showed differential expression in the parental strain after the shift to cellulose (∼130), which increased to about 50% of the predicted transcription factors in the Δclr1 and Δclr2 strains (∼190), again suggesting that both Clr1 and Clr2 are of fundamental regulatory importance for T. thermophilus to feed on cellulose (Figure 7A). A less dramatic effect was seen in the Δclr4 strain, which is congruent with a nearly identical heatmap when compared to the parental strain but considerably different when compared to both Δclr1 and Δclr2 strains, respectively (Figure 7B). Notably, strongest differential expression were observed for genes predicted to encode fungal-specific Zn (2)-Cys (6) binuclear cluster domain transcription factors (Figure 7B).
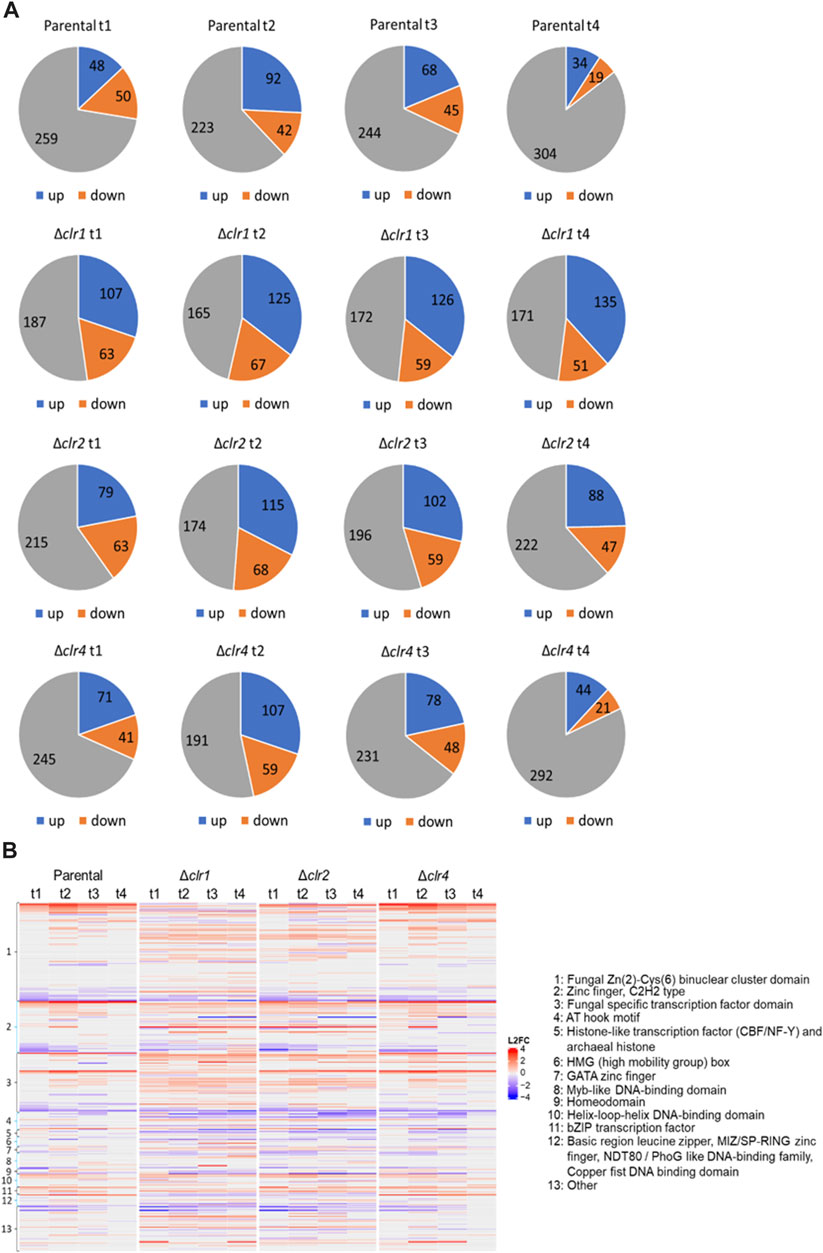
FIGURE 7. Number of differentially expressed genes predicted to encode transcription factors. (A) Numbers of up- (blue) and downregulated (orange) genes as well as genes with no differential expression (grey) at 0.5 h (t1), 1 h (t2), 2 h (t3), and 4 h (t4) after the cellulose spike compared to the respective steady state condition (B) Heatmap showing the respective log2 fold change values of these genes (L2FC) belonging to different transcription factor classes. Negative values (blue) represent downregulated genes and positive values (red) upregulated genes.
Although the function of the majority of transcription factors is unknown in T. thermophilus, we specifically scrutinized the expression pattern of 47 orthologs of known filamentous fungal transcription factors involved in carbon metabolism and growth control (Figure 8). Lack of any expression of clr1, clr2, or clr4 in the respective deletion strains confirmed their successful deletions in strains BS7.8, BS6.4, and JK2.8, respectively. Highest expression as well as upregulation in the parental and the Δclr4 strain were observed for MYCTH_38704 (Clr2), MYCTH_2310085 (Cre1), MYCTH_46266 (GaaR/Pdr2), MYCTH_2310995 (Hac1/A), and MYCTH_2310145 (Xyr1) (Figure 8). From these, all except MYCTH_2310085 (Cre1) were more strongly expressed in the Δclr4 strain, and conversely more weakly expressed in the Δclr1 and Δclr2 strains. A further exception is MYCTH_2310145 (Xyr1), which displayed higher expression after 4 h in the Δclr2 strain. Notably, MYCTH_2310145 (Xyr1) showed nearly no expression in the Δclr1 strain but was highly expressed in the three other strains during all time points. Transcription factor encoding genes that displayed high expression levels although they were not differentially expressed in all four strains (or only at one point in time after the cellulose spike) included MYCTH_2298863 (Clr1), MYCTH_2296492 (Clr4) and MYCTH_2132441 (McmA/1) (Figure 8). From these, MYCTH_2298863 (Clr1) was stronger and MYCTH_2132441 (McmA/1) more weakly expressed in the Δclr4 strain when compared to the parental strain. In contrast, MYCTH_2132441 (McmA/1) was more highly expressed in the Δclr2 strain (t1, t4 only) and much more weakly expressed in the Δclr1 strain when compared to the parental strain. For another predicted transcription factor, MYCTH_2297068 (Stk12), the opposite trend was observed, i.e., a strong expression in the Δclr1 and Δclr4 strains but not in the Δclr2 and parental strains. The data altogether imply that within the regulatory network i) Clr1 could potentially regulate clr2 expression, which is implied by the low expression levels of clr2 in the Δclr1 strain, ii) Clr4 might act as a transcriptional brake, which is implied by the much higher expression levels of, e.g., clr2, xyr1, and hacA/1 in the Δclr4 strain and iii) McmA/1 and Stk12 might play an important regulatory role for cellulase expression.
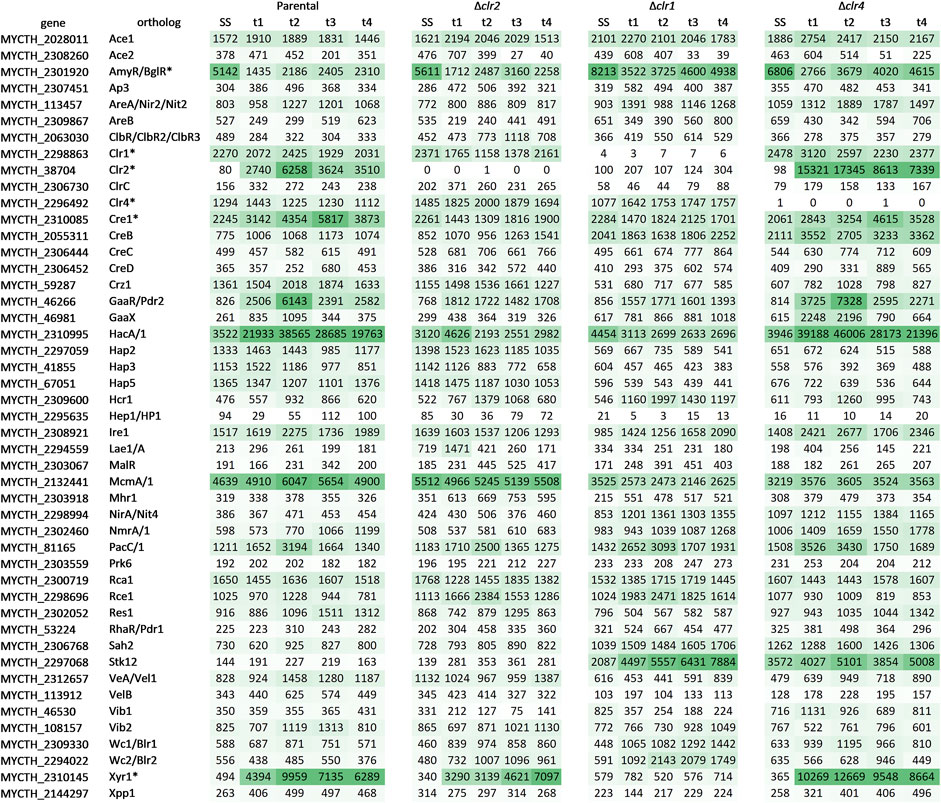
FIGURE 8. Qualitative heatmap with expression profiles of orthologous genes predicted to encode fungal transcription factors involved in carbon degradation. Shown are the mean values of the normalized raw counts of the two replicates at steady state (SS) as well as 0.5 h (t1), 1 h (t2), 2 h (t3), and 4 h (t4) after the cellulose spike compared to the respective steady state condition. The green colour scales with the expression level of the gene (the darker the higher). A dash separates possible orthologs of this regulator if more than one was found. An asterisk marks regulators that have already been investigated in T. thermophilus. The original data including the respective log2 fold change values can be found in Supplementary Material S10.
Discussion
The experimental approach followed in this study enabled us to obtain and compare physiological and transcriptomic fingerprints for strains deleted for the transcriptional regulators Clr1, Clr2, and Clr4 with their parental T. thermophilus strain. The results from mutually confirming data obtained from PCA plot analyses, differential gene expression analyses, GO term enrichment analyses, protein analyses and growth assays indicate an important role of these transcription factors for the expression of lignocellulosic enzymes including cellulases, hemicellulases, pectinases, and esterases.
The role of Clr1 in T. thermophilus
We could confirm a key role of Clr1 for growth on cellulose and cellobiose as described earlier for N. crassa (Coradetti et al., 2012) and T. thermophilus (Haefner et al., 2017a). Nearly all predicted cellulase, hemicellulase, pectinase, and esterase genes, which became upregulated in the parental strain in response to cellulose, failed to do so in the strain deleted for clr1. Nevertheless, growth on glucose was unaffected in the clr1 deletion strain. Based on the observations in this study, clr1 seems to be constitutively expressed. As described for N. crassa and A. nidulans, Clr1 becomes activated via inducers only (e.g., cellulose) (Coradetti et al., 2013) and clr1 overexpression does not lead to expression of Clr1 target genes in N. crassa (Coradetti et al., 2012; Craig et al., 2015). It remains to be shown in future studies whether this is also the case in T. thermophilus. Our data further suggest that the transcriptional factors Clr2, Cre1, Xyr1, GaaR/Pdr2, HacA/1, and McmA/1 are under direct or indirect control of Clr1 in T. thermophilus. Regarding regulation of Clr2, so far it has only been shown in N. crassa that Clr1 controls clr2 expression (Coradetti et al., 2012; Coradetti et al., 2013). A more detailed discussion regarding the Clr1 dependent regulation of clr2 follows in the next section of the discussion. The weaker expression of cre1 compared to the parental strain in T. thermophilus is likely caused by the inability of the clr1 deletion strain to degrade cellulose and thus not releasing glucose which itself acts as an inducer of CreA/1 as shown in A. nidulans and N. crassa (Orejas et al., 1999; Orejas et al., 2001; Tamayo et al., 2008; Sun and Glass, 2011). Clr1 dependent xlr1 expression as observed in this study (clr1 deletion strain) was also described for N. crassa (Craig et al., 2015), T. thermophilus (Haefner et al., 2017a) and Aspergilli (Raulo et al., 2016) and was accompanied by reduced expression of predicted hemicellulase genes known to be under control of Xyr1. It was earlier proposed that Xyr1 is presumably not involved in cellulose degradation in T. thermophilus (Dos Santos Gomes et al., 2019). However, in this study we observed a very high expression level of xyr1 in the parental strain after spiking with cellulose. This fits well to the observed strong expression of predicted hemicellulase and acetyl esterase genes, whose expression could be regulated by Xyr1 as already shown for predicted xylanase genes in T. thermophilus (Dos Santos Gomes et al., 2019). Hemicellulase expression in T. thermophilus might therefore be coupled with cellulase expression. GaaR/Pdr2 is known to be exclusively involved in pectin degradation and not described so far to be regulated via ClrA/1 in filamentous fungi (Alazi et al., 2016; Niu et al., 2017). As the T. thermophilus clr1 deletion strain expresses less of the ortholog of GaaR/Pdr2 and also less of predicted pectin lyase genes compared to the parental strain, we suggest that cellulase and pectinase genes are co-regulated by Clr1 similar to hemicellulose gene expression (see above). The importance of HacA/1 for balancing protein secretion during the lignocellulolytic response was already earlier described for filamentous fungi (Huberman et al., 2016) and might also be the case for T. thermophilus. A weaker expression of the HacA/1 ortholog is in good agreement with the observed lower secretion in the clr1 deletion strain, meaning that the unfolded protein response is less needed when compared to the parental strain where high expression of CAZYs and thus a high protein secretion load occurs. McmA/1 is known to positively control cellulase expression presumably via interaction with ClrB/2 in A. nidulans, but has no impact on cellulase production in Talaromyces cellulolyticus (Yamakawa et al., 2013; Tani et al., 2014; Fujii et al., 2015). Due to the high constitutive expression of mcmA/1 and its transcriptional dependency of clr1 expression, a similar function compared to Clr1, or even a transcriptional regulation of mcmA/1 via Clr1, might be possible to allow fine tuning of cellulase expression in T. thermophilus. Finally, the gene predicted to encode the ortholog of N. crassa Stk12 is much more highly expressed in the clr1 deletion strain when compared to the parental strain. The function of Stk12 could be similar as reported for N. crassa, where the deletion of stk12 resulted in a 7-fold higher cellulase production compared to the wildtype (Lin et al., 2019).
The role of Clr2 besides Clr1 in T. thermophilus
The phenotypic and transcriptomic consequences for T. thermophilus when deleted for clr2 were very similar compared to the clr1 deletion strain, with the exception that the clr2 deletion strain is still able to grow on cellobiose. An importance of Clr2 for growth on cellulose was already observed in N. crassa (Coradetti et al., 2012). Furthermore, T. thermophilus was shown to have a reduced ability to secrete proteins when deleted for clr2 (Haefner et al., 2017b). This fits to the finding that the DNA-binding domain of Clr2 in T. thermophilus was recently shown to be important for the response to cellulose (Zhang et al., 2022). Our transcriptomic data uncovered why cellobiose can still be utilized as a carbon source after the deletion of clr2: the predicted ß-glucosidase gene MYCTH_115968, the highest expressed predicted ß-glucosidase gene in the parental strain, is still expressed in the Δclr2 strain although at a low level. The importance and high level expression of this ß-glucosidase during cellulose degradation was also shown by previous transcriptomic analysis experiments. Here it was also shown that this ß-glucosidase has the highest expression levels after cellulose induction similar to our observations (Qin et al., 2022). Due to such residual expression of some predicted cellulase, hemicellulase, pectinase, and esterase genes like MYCTH_115968 in the Δclr2 strain (which is not the case in the Δclr1 strain), we speculate that i) Clr1 is important for a basal expression of these lignocellulolytic enzymes to ensure their expression as scouting enzymes and that ii) the main lignocellulolytic response might become two-step triggered via Clr1-dependent expression of clr2. Future studies which will analyse clr1, clr2 double deletion strains can affectively assess this hypothesis. Another remarkable difference between the Δclr1 and Δclr2 strains is expression of genes encoding for the orthologs of McmA/1, Stk12, and Xyr1. The genes encoding McmA/1 as well as Stk12 are regulated by Clr1 in T. thermophilus but likely not by Clr2 since similar expression levels were observed in the clr2 deletion strain when compared to the parental strain. Based on these observations and published literature (see previous section) we speculate that Clr1 and McmA/1 could have overlapping functions in T. thermophilus and could potentially regulate each other’s gene expression to enable fine tuning of cellulase expression. As, however, the expression trend of mcmA/1 and stk12 behaves contrary in the clr1 deletion strain, they could have opposing functions. These two hypotheses are worth studying further. Finally, expression of xyr1 in the Δclr2 strain is also very different compared to its expression in the Δclr1 strain. Xyr1 expression is absent in the clr1 deletion strain but detectable in the clr2 deletion strain, implying that Clr1 could be directly or indirectly the main regulator of xyr1 expression.
The role of Clr4 besides Clr1 and Clr2 in T. thermophilus
This study suggests that besides Clr1 and Clr2, Clr4 is also of importance for cellulase expression in T. thermophilus. A considerable number of predicted cellulase, hemicellulase, pectinase, and esterase genes that become upregulated in the parental strain upon the shift to cellulose (especially the highest expressed ones) display a much higher expression in the Δclr4 deletion strain. This is accompanied by upregulation of genes predicted to encode transcription factors (e.g., clr2, gaaR/pdr2, hacA/1, and xyr1). We propose that the higher expression of these regulators and CAZYs in the clr4 mutant is presumably because of the much higher expression of clr2. In agreement, it was recently shown that Clr4 is able to bind to clr2 promotor sequences in T. thermophilus and N. crassa (Liu et al., 2019). Interestingly, expression trends of the orthologs of Stk12 and McmA/1 are similar in the clr1 and clr4 deletion strains but not when compared to the parental strain. Therefore, it could be conceivable that a direct or indirect interaction between Clr1 and Clr4, besides the possibility of an independent trigger by the single transcription factors, could potentially regulate the expression of stk12 and mcmA/1. Future experiments could unravel whether Clr1 and Clr4 could potentially co-coordinate carbon-catabolite repression and fine-tuning of lignocellulolytic enzyme expression via these regulators in T. thermophilus. In addition, further deletion experiments are necessary to clarify whether the orthologs of McmA/1 and Stk12 are inducers or repressors of cellulase expression. Due to the constitutive expression of the clr4 gene, we furthermore propose that Clr4 could, similar to Clr1, require an inducer to become activated as a transcription factor. Intriguingly, upregulation of genes predicted to encode transcription factors (e.g., clr2, gaaR/pdr2, hacA/1, and xyr1) and lignocellulolytic enzymes in the clr4 deletion strain could either suggest that Clr4 acts as a repressor, i.e., as a transcriptional brake, of this lignocellulolytic network and/or as an activator of other genes encoding hydrolytic enzymes that enter the secretory pathway and block it otherwise for secretion of lignocellulolytic enzymes. Notably, the data obtained for the Δclr4 deletion strain in this study deviate from data published earlier for T. thermophilus and N. crassa obtained from shake flask cultures (Liu et al., 2019). There, protein band patterns observed in SDS-PAGE analyses differed considerably from the reference strain used. Also, much less secreted proteins were observed in the deletion strain when cultivated on cellulose, and clr2 and xyr1 showed reduced expression. We assume that this is because of the different experimental setup and sampling times used. As the transcriptional response to changing carbon sources is a very fast and dynamic one, usually followed by homeostatic feedback loop mechanisms generally inherent to all biological systems, it will become an important question for future experiments to dissect the time-dependent responses of T. thermophilus to cellulose.
Conclusion
This study uncovered that cellulase gene expression is tightly coupled with hemicellulase, pectinase, and esterase gene expression in T. thermophilus when cultivated on cellulose. The transcription factors Clr1 and Clr2 are the main regulators of these CAZYs, and presumably perform this function by co-regulating other transcriptional factors including Xyr1, GaaR/Pdr2, Stk12 and McmA/1 to name but a few. The data suggest that Clr1 ensures basal expression of cellulases irrespective of the presence of cellulose and that clr2 expression requires Clr1. When T. thermophilus becomes confronted with cellulose as main carbon source, Clr1 initiates the main lignocellulolytic response via Clr2. Finally, the results of this study suggest that Clr4 acts as a repressor of cellulase expression presumably via regulation of clr2 expression.
Data availability statement
The datasets presented in this study can be found in online repositories. The names of the repository/repositories and accession number(s) can be found in the article/Supplementary Material.
Author contributions
BS: Writing–original draft, Writing–review and editing. TS: Writing–review and editing. SS: Writing–review and editing. SH: Writing–review and editing. VM: Writing–review and editing, Writing–original draft.
Funding
The author(s) declare financial support was received for the research, authorship, and/or publication of this article.
Acknowledgments
We thank BASF SE (Ludwigshafen) for funding the PhD project of BS (Siebecker, 2020). Jonas Karsten for generating strain JK2.8 and Min Jin Kwon for generation of the background strain and the establishment of molecular biological methods used in this study. Open access funding was enabled and organized by Projekt DEAL.
Conflict of interest
SS and SH were employed by BASF SE.
The remaining authors declare that the research was conducted in the absence of any commercial or financial relationships that could be construed as a potential conflict of interest.
The authors declare that this study received funding from BASF SE. The funder had the following involvement in the study: review of this article.
Publisher’s note
All claims expressed in this article are solely those of the authors and do not necessarily represent those of their affiliated organizations, or those of the publisher, the editors and the reviewers. Any product that may be evaluated in this article, or claim that may be made by its manufacturer, is not guaranteed or endorsed by the publisher.
Supplementary material
The Supplementary Material for this article can be found online at: https://www.frontiersin.org/articles/10.3389/fbioe.2023.1279146/full#supplementary-material
SUPPLEMENTARY MATERIAL S1 | clr1, clr2, and clr4 deletion and marker removal.
SUPPLEMENTARY MATERIAL S2 | Bioreactor cultivations (clr1 and clr4 deletion strains).
SUPPLEMENTARY MATERIAL S3 | Secreted protein profiles of all four strains.
SUPPLEMENTARY MATERIAL S4 | PCA and quantitative real-time PCR.
SUPPLEMENTARY MATERIAL S5 | Candidate genes important for cellulose adaptation.
SUPPLEMENTARY MATERIAL S6 | Venn diagrams.
SUPPLEMENTARY MATERIAL S7 | GO term enrichment analysis.
SUPPLEMENTARY MATERIAL S8 | List of CAZYs and expression values.
SUPPLEMENTARY MATERIAL S9 | Differentially expressed CAZY categories.
SUPPLEMENTARY MATERIAL S10 | List of transcription factors and expression values.
SUPPLEMENTARY MATERIAL S11 | Oligonucleotides used in this study.
SUPPLEMENTARY MATERIAL S12 | Plasmids used in this study.
SUPPLEMENTARY MATERIAL S13 | Raw counts, normalized counts, DE values all genes.
References
Alazi, E., Niu, J., Kowalczyk, J. E., Peng, M., Aguilar Pontes, M. V., Van Kan, J. A. L., et al. (2016). The transcriptional activator GaaR of Aspergillus niger is required for release and utilization of d-galacturonic acid from pectin. FEBS Lett. 590, 1804–1815. doi:10.1002/1873-3468.12211
Andrews, S. (2010). FastQC: A quality control tool for high throughput sequence data. Available online at: http://www.bioinformatics.babraham.ac.uk/projects/fastqc/tle.
Arentshorst, M., Ram, A. F. J., and Meyer, V. (2012). Using non-homologous end-joining-deficient strains for functional gene analyses in filamentous fungi. Methods Mol. Biol. 835, 133–150. doi:10.1007/978-1-61779-501-5_9
Benjamini, Y., and Hochberg, Y. (1995). Controlling the false discovery rate: A practical and powerful approach to multiple testing. J. R. Stat. Soc. Ser. B 57, 289–300. doi:10.1111/j.2517-6161.1995.tb02031.x
Benocci, T., Aguilar-Pontes, M. V., Zhou, M., Seiboth, B., and De Vries, R. P. (2017). Regulators of plant biomass degradation in ascomycetous fungi. Biotechnol. Biofuels 10, 152. doi:10.1186/s13068-017-0841-x
Berezina, O. V., Herlet, J., Rykov, S. V., Kornberger, P., Zavyalov, A., Kozlov, D., et al. (2017). Thermostable multifunctional GH74 xyloglucanase from Myceliophthora thermophila: high-level expression in Pichia pastoris and characterization of the recombinant protein. Appl. Microbiol. Biotechnol. 101, 5653–5666. doi:10.1007/s00253-017-8297-2
Berka, R. M., Grigoriev, I. V., Otillar, R., Salamov, A., Grimwood, J., Reid, I., et al. (2011). Comparative genomic analysis of the thermophilic biomass-degrading fungi Myceliophthora thermophila and Thielavia terrestris. Nat. Biotechnol. 29, 922–927. doi:10.1038/nbt.1976
Blumer-Schuette, S. E., Brown, S. D., Sander, K. B., Bayer, E. A., Kataeva, I., Zurawski, J. V., et al. (2014). Thermophilic lignocellulose deconstruction. FEMS Microbiol. Rev. 38, 393–448. doi:10.1111/1574-6976.12044
Bushnell, B. (2014). BBTools software package. Available at: https://jgi.doe.gov/data-and-tools/bbtools/.
Cherubini, F. (2010). The biorefinery concept: using biomass instead of oil for producing energy and chemicals. Energy Convers. Manag. 51, 1412–1421. doi:10.1016/j.enconman.2010.01.015
Coradetti, S. T., Craig, J. P., Xiong, Y., Shock, T., Tian, C., and Glass, N. L. (2012). Conserved and essential transcription factors for cellulase gene expression in ascomycete fungi. Proc. Natl. Acad. Sci. U. S. A. 109, 7397–7402. doi:10.1073/pnas.1200785109
Coradetti, S. T., Xiong, Y., and Glass, N. L. (2013). Analysis of a conserved cellulase transcriptional regulator reveals inducer-independent production of cellulolytic enzymes in Neurospora crassa. Microbiologyopen 2, 595–609. doi:10.1002/mbo3.94
Craig, J. P., Coradetti, S. T., Starr, T. L., and Louise Glass, N. (2015). Direct target network of the Neurospora crassa plant cell wall deconstruction regulators Clr1, Clr2, and Xlr1. MBio 6, e01452–e01415. doi:10.1128/mBio.01452-15
Critchlow, S. E., and Jackson, S. P. (1998). DNA end-joining: from yeast to man. Trends biochem. Sci. 23, 394–398. doi:10.1016/S0968-0004(98)01284-5
Dobin, A., Davis, C. A., Schlesinger, F., Drenkow, J., Zaleski, C., Jha, S., et al. (2013). Star: ultrafast universal RNA-seq aligner. Bioinformatics 29, 15–21. doi:10.1093/bioinformatics/bts635
Dos Santos Gomes, A. C., Falkoski, D., Battaglia, E., Peng, M., Nicolau de Almeida, M., Coconi Linares, N., et al. (2019). Myceliophthora thermophila Xyr1 is predominantly involved in xylan degradation and xylose catabolism. Biotechnol. Biofuels 12, 220. doi:10.1186/s13068-019-1556-y
Fujii, T., Inoue, H., and Ishikawa, K. (2015). Decreased cellulase and xylanase production in the fungus Talaromyces cellulolyticus by disruption of tacA and tctA genes, encoding putative zinc finger transcriptional factors. Appl. Biochem. Biotechnol. 175, 3218–3229. doi:10.1007/s12010-015-1497-2
Green, M., and Sambrook, J. (2012). Molecular cloning: A laboratory manual. 4th Edition, Vol. II. New York: Cold Spring Harbor Laboratory Press.
Haefner, S., Thywissen, A., Hartmann, H., and Boehmer, N. (2017a). Method of producing proteins in filamentous fungi with decreased Clr1 activity. Patent number: WO2017093451A1. Available at: https://patents.google.com/patent/WO2017093451A1/en (Accessed July 29, 2020).
Haefner, S., Thywissen, A., Hartmann, H., and Boehmer, N. (2017b). Method of producing proteins in filamentous fungi with decreased Clr2 activity. Patent number:WO2017093450A1. Available at: https://patents.google.com/patent/WO2017093450A1/en26 (Accessed July 29, 2020).
Huang, D. W., Sherman, B. T., and Lempicki, R. A. (2009a). Bioinformatics enrichment tools: paths toward the comprehensive functional analysis of large gene lists. Nucleic Acids Res. 37, 1–13. doi:10.1093/nar/gkn923
Huang, D. W., Sherman, B. T., and Lempicki, R. A. (2009b). Systematic and integrative analysis of large gene lists using DAVID bioinformatics resources. Nat. Protoc. 4, 44–57. doi:10.1038/nprot.2008.211
Huberman, L. B., Liu, J., Qin, L., and Glass, N. L. (2016). Regulation of the lignocellulolytic response in filamentous fungi. Fungal Biol. Rev. 30, 101–111. doi:10.1016/j.fbr.2016.06.001
Huuskonen, A. (2020). Development of the filamentous fungus Myceliophthora thermophila C1 into a next-generation therapeutic protein production system Presentation ECFG Rome. Available at: https://www.dyadic.com/wp-content/uploads/2020/02/VTT-AHuuskonen-Rome-2-19-2020.pdf.
Karnaouri, A. C., Topakas, E., Antonopoulou, I., and Christakopoulos, P. (2014). Genomic insights into the fungal lignocellulolytic system of Myceliophthora thermophila. Front. Microbiol. 5, 281. doi:10.3389/fmicb.2014.00281
Kelly, J. M., and Hynes, M. J. (1985). Transformation of Aspergillus niger by the amdS gene of Aspergillus nidulans. EMBO J. 4, 475–479. doi:10.1002/j.1460-2075.1985.tb03653.x
Konwar, L. J., Mikkola, J. P., Bordoloi, N., Saikia, R., Chutia, R. S., and Kataki, R. (2018). Sidestreams from bioenergy and biorefinery complexes as a resource for circular bioeconomy. Waste Biorefiniery Potential Perspect., 85–125. doi:10.1016/B978-0-444-63992-9.00003-3
Kwon, M. J., Schütze, T., Spohner, S., Haefner, S., and Meyer, V. (2019). Practical guidance for the implementation of the CRISPR genome editing tool in filamentous fungi. Fungal Biol. Biotechnol. 6, 15. doi:10.1186/s40694-019-0079-4
Lange, L. (2017). Fungal enzymes and yeasts for conversion of plant biomass to bioenergy and high-value products. Microbiol. Spectr. 5, 7. doi:10.1128/microbiolspec.funk-0007-2016
Lin, L., Wang, S., Li, X., He, Q., Philipp Benz, J., and Tian, C. (2019). Stk12 acts as a transcriptional brake to control the expression of cellulase-encoding genes in Neurospora crassa. PLoS Genet. 15, e1008510. doi:10.1371/journal.pgen.1008510
Liu, Q., Li, J., Gao, R., Li, J., Ma, G., and Tian, C. (2019). Clr4, a novel conserved transcription factor for cellulase gene expression in ascomycete fungi. Mol. Microbiol. 111, 373–394. doi:10.1111/mmi.14160
Love, M. I., Huber, W., and Anders, S. (2014). Moderated estimation of fold change and dispersion for RNA-seq data with DESeq2. Genome Biol. 15, 550. doi:10.1186/s13059-014-0550-8
Meyer, V., Basenko, E. Y., Benz, J. P., Braus, G. H., Caddick, M. X., Csukai, M., et al. (2020). Growing a circular economy with fungal biotechnology: A white paper. Fungal Biol. Biotechnol. 7, 5. doi:10.1186/s40694-020-00095-z
Nielsen, M. L., Albertsen, L., Lettier, G., Nielsen, J. B., and Mortensen, U. H. (2006). Efficient PCR-based gene targeting with a recyclable marker for Aspergillus nidulans. Fungal Genet. Biol. 43, 54–64. doi:10.1016/j.fgb.2005.09.005
Niu, J., Alazi, E., Reid, I. D., Arentshorst, M., Punt, P. J., Visser, J., et al. (2017). An evolutionarily conserved transcriptional activator-repressor module controls expression of genes for D-Galacturonic acid utilization in Aspergillus niger. Genetics 205, 169–183. doi:10.1534/genetics.116.194050
Ogawa, M., Kobayashi, T., and Koyama, Y. (2013). ManR, a transcriptional regulator of the β-mannan utilization system, controls the cellulose utilization system in Aspergillus oryzae. Biosci. Biotechnol. Biochem. 77, 426–429. doi:10.1271/bbb.120795
Orejas, M., MacCabe, A. P., Pérez González, J. A., Kumar, S., and Ramón, D. (1999). Carbon catabolite repression of the Aspergillus nidulans xlnA gene. Mol. Microbiol. 31, 177–184. doi:10.1046/j.1365-2958.1999.01157.x
Orejas, M., MacCabe, A. P., Pérez-González, J. A., Kumar, S., and Ramón, D. (2001). The wide-domain carbon catabolite repressor CreA indirectly controls expression of the Aspergillus nidulans xlnB gene, encoding the acidic endo-β-(1,4)-xylanase X24. J. Bacteriol. 183, 1517–1523. doi:10.1128/JB.183.5.1517-1523.2001
Paege, N., Jung, S., Schäpe, P., Müller-Hagen, D., Ouedraogo, J. P., Heiderich, C., et al. (2016). A transcriptome meta-analysis proposes novel biological roles for the antifungal protein AnAfp in Aspergillus niger. PLoS One 11, e0165755. doi:10.1371/journal.pone.0165755
Ponnusamy, V. K., Nguyen, D. D., Dharmaraja, J., Shobana, S., Banu, J. R., Saratale, R. G., et al. (2018). A review on lignin structure, pretreatments, fermentation reactions and biorefinery potential. Bioresour. Technol. 271, 462–472. doi:10.1016/j.biortech.2018.09.070
Qin, X., Zou, J., Yang, K., Li, J., Wang, X., Tu, T., et al. (2022). Deciphering the efficient cellulose degradation by the thermophilic fungus Myceliophthora thermophila focused on the synergistic action of glycoside hydrolases and lytic polysaccharide monooxygenases. Bioresour. Technol. 364, 128027. doi:10.1016/J.BIORTECH.2022.128027
Quan, J., and Tian, J. (2011). Circular polymerase extension cloning for high-throughput cloning of complex and combinatorial DNA libraries. Nat. Protoc. 6, 242–251. doi:10.1038/nprot.2010.181
Raulo, R., Kokolski, M., and Archer, D. B. (2016). The roles of the zinc finger transcription factors XlnR, ClrA and ClrB in the breakdown of lignocellulose by Aspergillus niger. Amb. Express 6, 5–12. doi:10.1186/s13568-016-0177-0
Siebecker, B. (2020). Characterization and optimization of Thermothelomyces thermophilus as fungal production host. Dissertation. Berlin (Germany): Technical University of Berlin.
Sun, J., and Glass, N. L. (2011). Identification of the Cre1 cellulolytic regulon in Neurospora crassa. PLoS One 6, e25654. doi:10.1371/journal.pone.0025654
Tamayo, E. N., Villanueva, A., Hasper, A. A., Graaff, L. H. D., Ramón, D., and Orejas, M. (2008). CreA mediates repression of the regulatory gene xlnR which controls the production of xylanolytic enzymes in Aspergillus nidulans. Fungal Genet. Biol. 45, 984–993. doi:10.1016/j.fgb.2008.03.002
Tani, S., Kawaguchi, T., and Kobayashi, T. (2014). Complex regulation of hydrolytic enzyme genes for cellulosic biomass degradation in filamentous fungi. Appl. Microbiol. Biotechnol. 98, 4829–4837. doi:10.1007/s00253-014-5707-6
Viikari, L., Alapuranen, M., Puranen, T., Vehmaanperä, J., and Siika-Aho, M. (2007). Thermostable enzymes in lignocellulose hydrolysis. Adv. Biochem. Eng. Biotechnol. 108, 121–145. doi:10.1007/10_2007_065
Visser, H., Joosten, V., Punt, P. J., Gusakov, A. V., Olson, P. T., Joosten, R., et al. (2011). Development of a mature fungal technology and production platform for industrial enzymes based on a Myceliophthora thermophila isolate, previously known as Chrysosporium lucknowense C1. Ind. Biotechnol. 7, 214–223. doi:10.1089/ind.2011.7.214
Yamakawa, Y., Endo, Y., Li, N., Yoshizawa, M., Aoyama, M., Watanabe, A., et al. (2013). Regulation of cellulolytic genes by McmA, the SRF-MADS box protein in Aspergillus nidulans. Biochem. Biophys. Res. Commun. 431, 777–782. doi:10.1016/j.bbrc.2013.01.031
Yao, G., Li, Z., Gao, L., Wu, R., Kan, Q., Liu, G., et al. (2015). Redesigning the regulatory pathway to enhance cellulase production in Penicillium oxalicum David Wilson. Biotechnol. Biofuels 8, 71. doi:10.1186/s13068-015-0253-8
Zhang, C., Li, N., Rao, L., Li, J., Liu, Q., and Tian, C. (2022). Development of an efficient C-to-T base-editing system and its application to cellulase transcription factor precise engineering in thermophilic fungus Myceliophthora thermophila. Microbiol. Spectr. 10, e0232121. doi:10.1128/spectrum.02321-21
Keywords: Thermothelomyces thermophilus, Myceliophthora thermophila, cellulases, lignocellulolytic enzymes, transcription factors, transcriptomics, gene regulation, Clr
Citation: Siebecker B, Schütze T, Spohner S, Haefner S and Meyer V (2023) Transcriptomic insights into the roles of the transcription factors Clr1, Clr2 and Clr4 in lignocellulose degradation of the thermophilic fungal platform Thermothelomyces thermophilus. Front. Bioeng. Biotechnol. 11:1279146. doi: 10.3389/fbioe.2023.1279146
Received: 17 August 2023; Accepted: 21 September 2023;
Published: 06 October 2023.
Edited by:
Yunzi Hu, Chinese Academy of Sciences (CAS), ChinaReviewed by:
Shuji Tani, Osaka Metropolitan University, JapanMao Peng, Westerdijk Fungal Biodiversity Institute, Netherlands
Copyright © 2023 Siebecker, Schütze, Spohner, Haefner and Meyer. This is an open-access article distributed under the terms of the Creative Commons Attribution License (CC BY). The use, distribution or reproduction in other forums is permitted, provided the original author(s) and the copyright owner(s) are credited and that the original publication in this journal is cited, in accordance with accepted academic practice. No use, distribution or reproduction is permitted which does not comply with these terms.
*Correspondence: Benedikt Siebecker, YmVuZWRpa3Quc2llYmVja2VyQHdlYi5kZQ==; Vera Meyer, dmVyYS5tZXllckB0dS1iZXJsaW4uZGU=
†ORCID: Benedikt Siebecker, orcid.org/0000-0002-6866-2559; Tabea Schütze, orcid.org/0000-0001-7630-3794; Sebastian Spohner, orcid.org/0000-0001-5671-9370; Vera Meyer, orcid.org/0000-0002-2298-2258
 Benedikt Siebecker
 Tabea Schütze1†
 Vera Meyer