 Alejandro Avilan Garzon
 Bruno Ebel
 Cédric Paris3
 Samuel Schneider
 Eric Olmos
- 1Université de Lorraine, CNRS, LRGP, Nancy, France
- 2Ypso-Facto, Nancy, France
- 3Laboratoire d’Ingénierie des Biomolécules, LIBio, Université de Lorraine, Nancy, France
Monoclonal antibodies (mAbs) are complex therapeutic proteins commonly produced by Chinese Hamster Ovary cell culture. Cells are cultivated using a chemically defined medium containing essential nutrients like glucose, amino acids, vitamins, etc., that cells use to grow and produce the target protein among other by-products. Various studies have focused on both extracellular and intracellular culture dynamics, measuring the concentration of various metabolites in the culture medium and inside the cell, but in the vast majority of cases these studies have excluded the intracellular concentration profile of the antibody. To better understand the complexity of the culture process, and the intracellular and extracellular dynamics of the antibody production, the present study focuses on both the extracellular and intracellular biochemical dynamics. A quenching and a lysis protocol were used to obtain the intracellular and the extracellular concentration profiles for the main substrates, metabolites, and mAb during a standard batch culture. The results revealed that three amino acids (glutamine, asparagine, and cystine) were limiting substrates as they were completely depleted almost simultaneously from the culture medium. Intracellular accumulation of different metabolites during the culture process was demonstrated, as well as a 2-day delay between the onset of the intracellular mAb production and its secretion to the culture medium. Finally, a comparison of mass transfer rates across the cell membrane, intracellular production/consumption rates, and accumulation of metabolites in the cell interior revealed that although the intracellular concentrations of the different metabolites changed during the culture process, the dynamics of these variations were much slower than the other two phenomena.
1 Introduction
Over the last 30 years, the market for therapeutic proteins produced by the biopharmaceutical industry has been growing steadily, with a projected marked value of $389 billion by 2024 (O’Flaherty et al., 2020; Lagassé et al., 2017). Monoclonal antibodies (mAbs) represent a big part of this market, with an expected market size value of $138.6 billion by 2024 and $300 billion by 2025 (Alejandra et al., 2023). These antibodies are glycoproteins of the immunoglobulin (Ig) family, being the IgG (immunoglobulin G) the most abundant antibody class on the therapeutic antibody market (Lai et al., 2021).
Around 70% of therapeutic recombinant proteins are produced using mammalian cells, with the CHO (Chinese Hamster Ovary) cell line being the preferred expression system, especially for mAb production (O’Flaherty et al., 2020; Frenzel et al., 2013). CHO cells, as well as other mammalian cells require a complex culture medium that contains not only all the required nutriments and proteins to support cell growth but also different molecules that will protect the cells from pH variations and hydrodynamic stresses (Li, 2018). Key components of culture media include glucose as the main source of carbon and energy, glutamine as the main source of nitrogen (Neermann and Wagner, 1996), different amino acids to support protein production (Fan et al., 2015), lipids for cell membrane formation and energy storage (Xu et al., 2005), vitamins in low concentrations used as cofactors (Arora, 2013), and inorganic ions and trace elements with diverse roles such as maintaining the pH and osmolarity of the culture medium (Mizrahi and Lazar, 1988).
Regarding the amino acids, they are the precursors in the synthesis of all proteins in the cell. Twelve of them are considered as “essential” because they cannot be synthesized by the cells (arginine, cysteine, histidine, isoleucine, leucine, lysine, methionine, phenylalanine, threonine, tryptophan, tyrosine, and valine) and therefore are normally added to the culture media (Eagle, 1955; Ritacco et al., 2018). The other amino acids, named ‘non-essential’, can be synthesized by the cell from other precursors present in the culture. These amino acids can also be added to the culture medium to avoid depletion (Li, 2018).
CHO cells present an inefficient energy metabolism characterized by high substrate uptake rates (Pereira et al., 2018). The substrate consumption is not only used for biomass or product formation but between 35% and 70% of glucose can be used in the formation of by-products which, in some cases, can be toxic for the cell. For instance, lactate is a waste product produced in cell culture mostly as a result of glucose metabolism but it can also be produced due to glutamine metabolism (Zielke et al., 1980). Lactate production has a negative effect because at high levels it is toxic and inhibits cell growth by lowering the medium pH (Yilmaz et al., 2020). Above 20 mM, lactate is considered toxic for the cells and has a negative effect on the production and glycosylation of proteins (Lao and Toth, 1997).
One of the major concerns in CHO kinetics studies is the metabolic shift from lactate production to lactate consumption throughout the cell culture. Lactate re-consumption could be considered a desirable phenomenon as it reduces lactate levels in the culture media and thus its undesirable effects (Hartley et al., 2018). For now, the exact mechanism by which this shift arises remains unclear. Different possible explanations made so far includes glucose depletion (Altamirano et al., 2006; Altamirano et al., 2004), glutamine depletion (Ghorbaniaghdam et al., 2014), or a combination of both (Zagari et al., 2013), the extracellular lactate concentration (Kyriakopoulos and Kontoravdi, 2014), a pH shift (Liste-Calleja et al., 2015), or the cell oxidative capacity (Luo et al., 2012).
Ammonium (NH4+) is a toxic molecule produced in mammalian cells culture. Ammonium is the product of amino acid metabolism, mainly during the first step of glutaminolysis, when glutamine is converted to glutamate and ammonium ions (Savizi et al., 2021). The inhibitory effect of ammonium accumulation in cell culture media is related to a decrease in available energy in the cell. This is associated with diffusive transport of ammonia through the cell membrane into the abiotic phase, active transport of ammonium through the cell membrane with the help of specific transport proteins, such as Na+/K+-ATPase, and competition between active transport of ammonium and potassium ions (Yilmaz et al., 2020).
In general, kinetic studies of mammalian cell cultures focus on classic substrates and metabolites such as glucose, glutamine, lactate, and ammonium (Kyriakopoulos et al., 2018). However, different studies have shown that it is also important to monitor the concentrations of some amino acids as they may induce changes in metabolism when they reach certain concentration levels in the culture medium. For example, a study about the effect of asparagine and serine limitation in the culture medium in the case of CHO-GS (Glutamine Synthase) cells found that the absence of asparagine causes cell growth arrest (Duarte et al., 2014). They also found that culture growth was also affected by serine depletion, inducing its metabolic synthesis. Another study confirmed the importance of arginine and other amino acids such as leucine in cell growth and IgG productivity (Fan et al., 2015). They found that the specific amino acid consumption rates are highly dependent on their corresponding abundance in the desired antibody sequence. A different study focused on valine revealed that additions of this amino acid during fed-batch culture reduced ammonia concentration in the culture media, mitigating its negative impact on CHO cell growth (Savizi et al., 2022).
Moreover, other studies have also focused on the intracellular CHO metabolites revealing interesting information such as that cells’ metabolic profile during a perfusion culture, depends on the steady state cell density achieved (Karst et al., 2017), or that peak cell growth is related to a highly glycolytic metabolic state and peak mAb production correspond to a highly oxidative metabolism Templeton et al. (2013). This suggests that intracellular metabolites screening could bring important information that may not be obtained by measuring only extracellular concentrations and that could be used, for example, to improve cell culture kinetic model development. For instance, the concept of accumulation of metabolites inside the cell has been applied recently in the development of kinetic models to predict cell growth and mAb production during fed-batch cell cultures (Ben Yahia et al., 2021).
Focusing on the extracellular concentrations for model development is enough for macroscopic kinetic models that exclude all or most of the details of the intracellular metabolism, linking products to extracellular substrate concentrations, which makes them simple to use and facilitates the determination of model parameters (Ben Yahia et al., 2015; Hagrot et al., 2019). However, the lack of detail of the intracellular dynamics makes accurate predictions difficult when culture conditions are significantly modified (Kyriakopoulos et al., 2018). In contrast, microscopic kinetic models consider the cell metabolism which makes them more biologically relevant but increases model complexity and the associated number of model parameters, thus increasing the need of data required to regress the model parameters (Ben Yahia et al., 2015; Galleguillos et al., 2017; Nolan and Lee, 2011). To overcome the high amount of parameters in microscopic models, some approaches like Flux Balance Analysis (FBA) transform the intracellular metabolites mass balances into an optimization problem, under the hypothesis of a steady state inside the cell (Kyriakopoulos et al., 2018; Orth et al., 2010).
Thus, coupling the screening of extracellular and intracellular metabolites could lead to a better understanding of the complex process of cell culture and the development of more accurate kinetic models. However, measuring both extracellular and intracellular concentrations would require more significant analytical work, making kinetic studies a more time-consuming process. Various studies have included both extracellular and intracellular metabolite screening to understand the lactate metabolic shift (Luo et al., 2012), to design feeding strategies to enhance IgG production (Sellick et al., 2011), or in fluxomic studies to assess the increase in NADPH availability on increased IgG productivity in CHO cells (Wijaya et al., 2021). However, although these studies included various extracellular and intracellular metabolites, they did not include an intracellular IgG concentration profile, which to the best of our knowledge has limited references in the literature (Zhang et al., 2020). In addition, the aforementioned studies do not focus on comparing the rate of accumulation of metabolites inside the cell with the intracellular and extracellular reaction rates during a mAb-producing CHO culture. It would therefore be interesting to compare these phenomena and check whether they are comparable in magnitude or whether one of them predominates over the others. This would indicate whether or not increasing the analytical effort and focusing on both extracellular and intracellular dynamics has a real added value for process modelling and understanding. This comparison would also challenge the hypothesis of a steady state within the cell, as formulated in flux balance analysis.
Thus the aim of the present work is to obtain and compare the extracellular and intracellular kinetic profiles of the IgG, as well as the profiles of the main substrates and metabolites during a CHO batch cell culture, using a quenching and lysis protocol for the measure of the intracellular concentrations. Secondly, the measured concentrations were used to calculate the extracellular and intracellular consumption and production rates of the considered species. Finally, these rates were compared to determine if the accumulation of species inside the cell is significant compared to the transfer across cell membrane and the intracellular reaction rates. This comparison was made using an adaptation of the Thiele modulus used for chemical engineering reactions. While the experiments presented here were conducted in batch culture, the results provide valuable information for designing better feeding strategies in more industrially relevant culture operation modes, such as fed-batch cultures.
2 Materials and methods
2.1 CHO cells culture
A genetically modified DG44 CHO cell line (CHO M250-9) producing human anti-Rhesus D IgG, was used in this study. The culture medium employed during this work was a serum and protein-free medium mixture consisting of a 1:1 ratio of HyClone™ ActiPro™ (Cytiva, United States) and CD-CHO (Fisher Scientific, United States) supplemented with 4 mM L-glutamine (Sigma Aldrich, United States), and 1% Antibiotic Antimycotic Solution (100
2.2 Sampling and quenching
After the preculture, a total of 11 parallel Erlenmeyer’s flasks were simultaneously seeded at about
2.3 Cell lysis-metabolite extraction
2.3.1 Main substrates, metabolites and amino acids extraction
For cell lysis, cell pellets from each centrifugation tube were thawed and resuspended in 1 mL of ice-cold phosphate buffer (10 mM, pH 6.8) and sonicated for 4 min on ice. The solution was then frozen at −80°C for 5 min and then thawed during another sonication process. This procedure was repeated until obtaining three complete freezing/thawing cycles. Samples were centrifugated at 16,233 g for 5 min at 4°C. The supernatants were filtered using 0.22 µm PES-Syringe Filters (Dutscher) and stored at −80°C until analysis.
2.3.2 IgG extraction
For IgG intracellular concentrations, a different lysis protocol was used due to the relatively fragile nature of the protein. Cell pellets were thawed and a volume of RIPA™ buffer (Thermo Scientific) was added to obtain a concentration of
2.4 Growth and principal metabolites analysis
Viable cell density (VCD), viability, and average diameter of cells were measured daily for each Erlenmeyer’s flask using the Vi-CELL™ cell counter (Beckman Coulter, United States) based on trypan blue dye exclusion of the viable cells. Extracellular and intracellular concentrations of glucose, lactate, glutamine, ammonium ions, IgG, and the lactate dehydrogenase (LDH) (only extracellular) were measured daily for one Erlenmeyer’s flask per day using an automated multiparametric analyzer Gallery™ (Thermo Fisher Scientific, United States). The experiments were performed a total of 3 times (E1, E2, E3) using cells from a different cryotube of the same cell bank each time.
2.5 Amino acids analysis
Quantitative analysis of extracellular and intracellular amino acids was realized on a UHPLC-MS system (ThermoFisher Scientific, San Jose, CA, United States) consisting in a quaternary solvent delivery pump connected to a photodiode array detector (PDA) and a LTQXL mass spectrometer equipped with an atmospheric pressure ionization interface operating in electrospray positive mode (ESI+).
Two microliters of sample diluted in water were injected on a C18 column (150
Mass spectrometry conditions were as follows: spray voltage was set at 4.5 kV; source gases were set (in arbitrary units/min) for sheath gas, auxiliary gas and sweep gas at 30, 10 and 5, respectively; capillary temperature was set at 300°C; capillary voltage at 5 V; tube lens, split lens and front lens voltages at 45 V, −46 V and −9.5 V, respectively. Ion optics parameters were optimized by automatic tuning using a standard solution of glycine at 0.1 g/L infused in mobile phase (A:B, 1:1) at a flow rate of 5 μL/min. Full scan MS spectra (70–300 m/z) were performed on a LTQ analyzer (Linear Trap Quadrupole). Raw data were processed using the XCALIBUR 2.1 software.
The twenty proteinogenic amino acids (except cysteine replaced by cystine due to the non-reducing conditions implemented) were quantified in extracts thanks to external calibration curves obtained after injection of five standard amino acid solutions from 0.01 to 0.05 mM (these calibration points being injected both at the beginning and at the end of the analytical batch).
As explained above, the experiments were performed in triplicate. However, concerning the intracellular and extracellular concentrations of amino acids obtained by HPLC-MS, the results obtained for the replicate E2 were obviously aberrant and were therefore discarded.
2.6 Estimation of intracellular concentrations
For the intracellular concentrations, the collected samples were analyzed using different methods as explained before. The obtained concentrations were then used to calculate the intracellular concentrations (
2.7 Determination of growth, death, extracellular consumption and production rates
Cell growth rate (µ), death rate (µd) (both in units of h-1), the specific consumption rate (qs), and specific production rate (qp) (both in units of mmol cell-1 h-1 or g cell-1 h-1), were calculated from the experimental extracellular data using Equations 1–4.
Where
The derivatives of the extracellular experimental data were calculated using different smoothing methods. For day 1 and day 10, the concentration derivatives were calculated using a central difference. For days 2 and 9 a Savitzky-Golay quadratic filter with a window of five was used whereas a window of seven was used for days 3–8. The extracellular concentration derivatives were then divided by the corresponding VCD of the day. For all of the rates, only data from days 1–10 was used.
2.8 Determination of intracellular reaction rates
To determine whether the transfer of species across the cell membrane or the intracellular reaction is the limiting step of the culture process, the intracellular reaction rates for the measured substrates, metabolites, and product were calculated. For that, the changes in the extracellular concentrations (C) were linked to the fluxes across the cell membrane as shown in Equation 5.
Where Fin and Fout are the inlet and outlet fluxes from the cell respectively (in units of g cell-1 h-1 or mmol cell-1 h-1).
As for the intracellular concentrations, the accumulation or loss of species inside the cell during the culture is due to the mass transfer across the cell membrane as well as the production or consumption reaction for each species, as presented in Equation 6.
Where
Using both Equations 5 and 6, as well as the experimental intracellular and extracellular concentrations, the intracellular reaction rates can be determined.
Since it is a reaction rate,
Finally, to compare the intracellular reaction rates with the mass transfer across the cell membrane, the following relation was established, inspired by the Thiele modulus used in chemical engineering reactions to relate diffusion and reaction rates:
If the calculated Thiele modulus is small, the mass transfer rate across the cell membrane is higher than the intracellular reaction rate, and therefore, the accumulation of the species in the cell interior may take place till a critical value that depends on the metabolite considered. On the contrary, if the faster phenomenon is the reaction inside the cell, the Thiele modulus will be high meaning there will not be accumulation of metabolites inside the cell. If the rates of the two phenomena are comparable, the Thiele modulus will be close to 1. This implies that
3 Results and discussion
To study both the extracellular and intracellular dynamics of the IgG production and its link to the different substrates and metabolites present in the culture medium, CHO cell cultures were performed in 11 shaken flasks. These parallel cultures were assumed to behave the same in order to use one of them each day to measure the intracellular and extracellular concentrations of the different substrates, metabolites, and products. Only the viable cell density and the cell viability were measured daily in each of the remaining flasks to verify the culture behavior and the assumption made. Figure 1 shows the experimental VCD and cell viability, as well as the calculated growth rate (Equation 1) for the three repetitions of the performed experiments (E1, E2, and E3). The presented data and the error bars represent the average results and the standard deviation from the measured data from all flasks each day for each repetition. The cultures were performed until day 11 but only data up to day 10 were post-processed; therefore, from this point on, only data from day 0–10 will be presented. The results presented in Figure 1 show that all three replicates remained similar, but most importantly the small error bars in the VCD profiles suggest that the variability remained low and very acceptable within the parallel cultures.

Figure 1. Experimental results of viable cell density (a), cell viability (b), calculated apparent growth rate (c), and death rate (d) for experiments E1 (▪), E2 (▲) and E3 (•). Bullets, squares, and triangles represent experimental data or a calculated rate. Error bars represent the standard deviation of the parallel cultures for each repetition.
3.1 Cell growth kinetics
Concerning the viable cell density profile and the apparent growth rate, they remain similar for the three experiments as seen in Figures 1a,c. Cells from each culture reached on day 7, a maximal cell density of
3.2 Extracellular concentrations, consumption and production rates
3.2.1 Main extracellular substrates and metabolites
Figures 2, 3 respectively show the average extracellular concentration kinetics and consumption/production rates for some of the main substrates and metabolites from the three experiments performed. Extracellular glucose (Figure 2a) and glutamine (Figure 2b) were fully consumed after 200 and 150 h of culture respectively, with a maximal consumption rate of
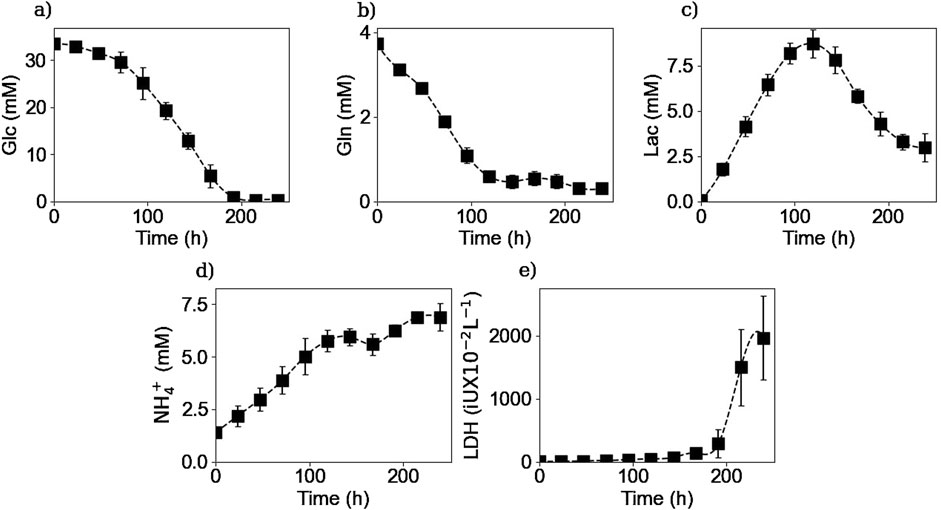
Figure 2. Experimental extracellular concentrations of glucose (a), glutamine (b), lactate (c), ammonium (d), and LDH (e). Squares represent the average of the measured concentrations from the three repetitions (E1, E2, and E3).
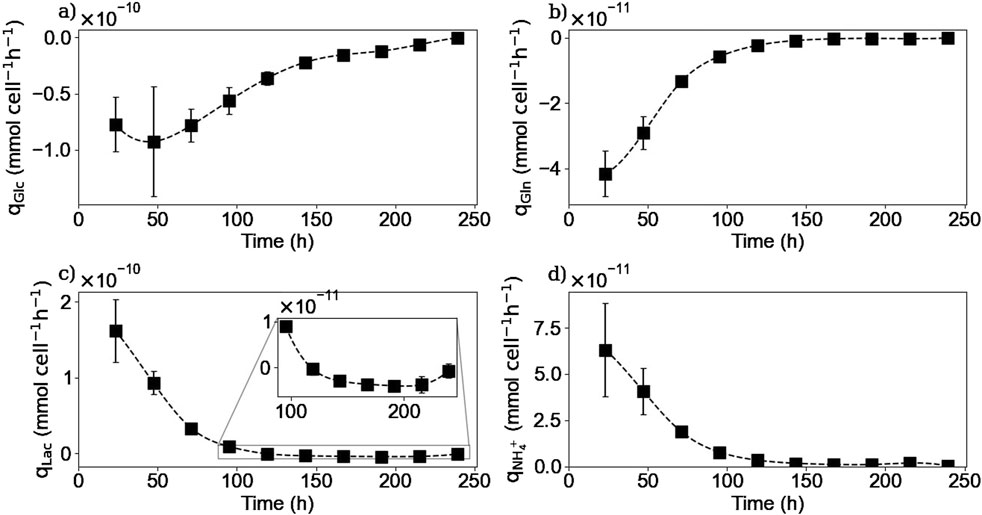
Figure 3. Calculated extracellular specific rates for glucose (a), glutamine (b), lactate (c), and ammonium (d). Squares represent the average of the calculated rates from the three repetitions (E1, E2, and E3).
Lactate concentration in the culture medium (Figure 2c) increases as the result of glucose metabolism during the first 120 h of the culture, reaching a maximal concentration of 8.6 mM which is far from the toxic lactate concentration of 20 mM reported by Lao et Toth (Lao and Toth, 1997). Afterwards, a shift in lactate production to its consumption is observed during the rest of the culture. This change in lactate metabolism has been previously reported in the literature citing different factors like pH or substrate concentration as possible explanations for this shift, but no consensus has yet been reached (Hartley et al., 2018). During the culture cells presented a maximum lactate production rate of
Extracellular NH4+ (Figure 2d) was produced as expected throughout the culture, with a maximum production rate of
Regarding the LDH concentrations, Figure 2e shows that the enzyme concentration increased exponentially after 200 h of culture, consistent with the onset of the decline phase after glucose depletion. This increase in concentration can be linked to an increase in the number of dead cells, since LDH is a non-excreted enzyme so its accumulation in the culture medium is due to the rupture of the cell membrane (Goergen et al., 1993). The LDH measurements were performed to obtain the number of lysed cells as they cannot be measured by the counting method of the Vi-CELL™ cell counter.
3.2.2 Extracellular IgG
Figure 4 shows the extracellular IgG concentration profile and the calculated specific IgG production rate. The antibody extracellular concentration profile (Figure 4a) showed that cells started the IgG secretion after 3 days of culture and reached a plateau of 0.4 g/L after 200 h of culture, with a maximum production rate of
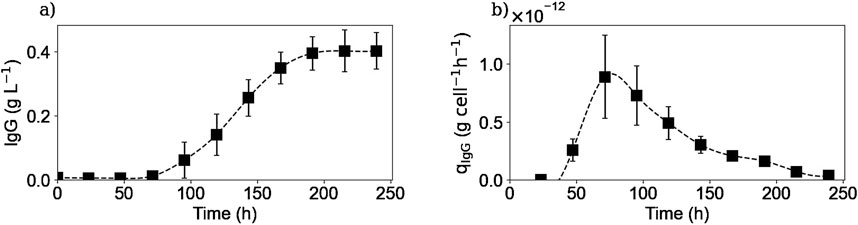
Figure 4. Experimental extracellular IgG concentration (a) and calculated extracellular specific IgG production rate (b). Squares represent the average of the experimental concentrations and the calculated rates from the three repetitions (E1, E2, and E3).
3.2.3 Extracellular amino acids
Extracellular amino acid quantification was made using an HPLC-MS method. Figures 5, 6 show the experimental concentrations and the calculated specific consumption or production rates respectively, for selected amino acids. The whole 20 amino acids’ extracellular concentrations kinetics can be found in the Supplementary Material.
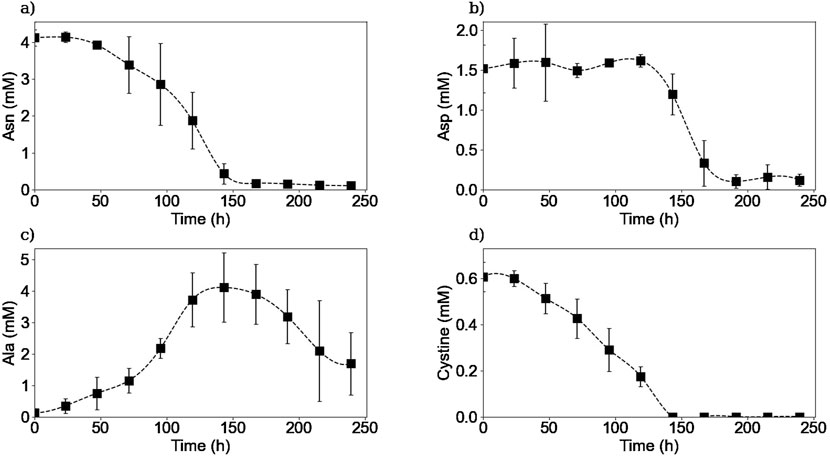
Figure 5. Experimental extracellular concentrations of asparagine (a), aspartic acid (b), alanine (c), and cystine (d). Squares represent the average of the measured concentrations from two repetitions (E1, and E3).
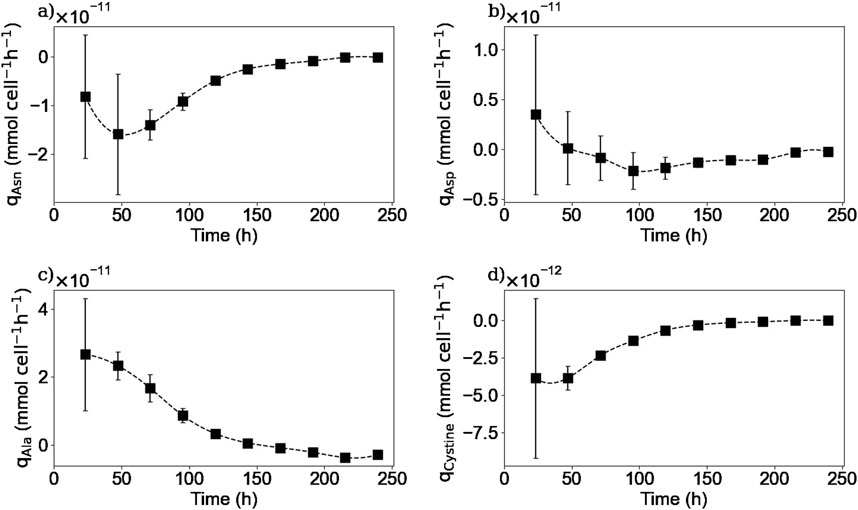
Figure 6. Calculated extracellular specific rates for asparagine (a), aspartic acid (b), alanine (c), cystine (d). Squares represent the average from two repetitions (E1, and E3).
As it is shown in Figures 5a, 6a, extracellular asparagine is consumed in the first part of the culture with a maximum specific uptake rate of
The extracellular concentration of aspartic acid (Figure 5b) remains mostly constant during the first part of the culture and rapidly decreases after 120 h of culture until being almost depleted by 200 h at the end of the stationary phase, in accordance with previous studies (Carinhas et al., 2013). The aspartic acid consumption started when asparagine concentration was halved. One hypothesis to explain this behaviour is that the production of aspartic acid from asparagine consumption was initially sufficient to meet the cells’ needs, and that as soon as the asparagine concentration decreased, the cells began to consume aspartic acid from the culture medium to meet their needs. In other words, this means that asparagine seemed to be preferentially biologically converted to aspartic acid rather than directly take aspartic acid from the culture medium. Another hypothesis could be that cells have a “storage pool” of aspartic acid internally that they use during the first part of the culture. Further investigation is needed in order to confirm this observation. For instance, using radioactive tracers that label the asparagine in the culture medium could be used to determine whether the cell converts asparagine to aspartic acid internally or wheter the aspartic acid used comes from another source.
The extracellular concentration profile of alanine is presented in Figure 5c. As expected for a non-essential amino acid in mammalian cell culture, it is produced in the first part of the culture, reaching a maximum concentration of 4.1 mM at 150 h of culture, with a maximum specific production rate of
Extracellular cystine was measured instead of cysteine due to the spontaneous oxidation of cysteine in aqueous solutions and the non-reducing conditions implemented in the HPLC-MS method. Figure 5d shows that extracellular cystine behaves similarly to other amino acids such as asparagine and glutamine, as it is completely depleted after 150 h of culture. Interestingly, these three substrates were depleted from the media at the same time suggesting that these amino acids are limiting substrates in batch cultures. Cysteine depletion at the beginning of the stationary phase has been reported previously (Sellick et al., 2015). Regarding the other amino acids, as shown in the Supplementary Material, no other amino acids were depleted from the culture medium, but amino acids such as serine, tyrosine, glutamate, tryptophane, and histidine reached minimum levels by the end of the culture, which could also act as limiting substrates. Further experiments should be carried out to determine the effect of these minimum concentrations of the different amino acids on the cell culture.
3.3 Intracellular concentrations, consumption and production rates
To test the effectiveness of the cell lysis protocol, a cell count using the Vi-CELL™ cell counter was performed in a cell culture sample before and after the protocol application. The results confirmed that the sonication/refrigeration cycles were able to lyse all the cells in the sample so that the measured metabolite concentration correctly corresponded to the combined content of all cells. An image of the cells before and after the lysis protocol can be found in the Supplementary Material.
3.3.1 Main intracellular substrates and metabolites
Figure 7 shows the intracellular concentrations of selected metabolites. For glucose, glutamine, and NH4+ measurements, the concentrations obtained were within the limit of detection of the method because the samples were highly diluted, and therefore no definitive conclusions could be drawn. For glutamine as for the other amino acids, the intracellular concentrations were also measured by HPLC-MS, which has a higher sensitivity. Figure 7a shows that intracellular glutamine concentration starts increasing in the first 2 days of the culture. Then, it decreases and after 200 h, no more glutamine is detected inside the cell. It is interesting to note that even after 150 h of culture when there was no more extracellular glutamine, there was still some glutamine left inside the cell. The cells could use this glutamine accumulation to prolong their metabolic activity for a few more hours of culture.
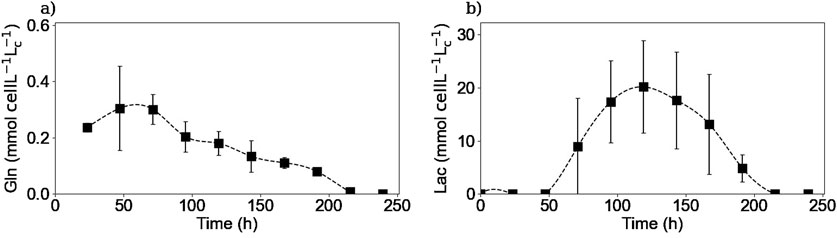
Figure 7. Experimental intracellular concentrations of glutamine (a), and lactate (b). Glutamine concentrations were measured via HPLC-MS. Lactate concentrations were obtained using the Gallery™ equipment. Squares represent the average of the measured concentrations from experiments E1 and E3 for glutamine and for the three repetitions (E1, E2, and E3) for lactate.
Figure 7b shows that intracellular lactate began to accumulate until it reached a maximum between 100 and 120 h and then decreased during the remainder of the culture. This coincided with the time when the lactate metabolic shift occurred and continued until no more lactate was measured inside the cell, although extracellular lactate was available for consumption.
3.3.2 Intracellular IgG
Figure 8 shows the concentrations obtained using the second lysis protocol for the intracellular IgG concentration. A new culture was carried out for this test (E4), using the same culture conditions and obtaining the same extracellular profiles as in the previous experiments (data not shown). As it can be seen, the intracellular IgG concentration increased at the beginning of the culture, reaching a plateau between 100 and 150 h of culture and, finally decreased until reaching a value of 0 after 200 h of culture. The shape of this intracellular concentration profile is similar to that published in the Supplementary Material of another study (Zhang et al., 2020). When compared to the extracellular IgG profile (Figure 4a), it is interesting to see that the extracellular concentration started to increase almost 48 h after the intracellular concentration did, meaning that there is a 2-day delay between the two profiles. This difference could be due to several factors, for example, the cell may need to accumulate a certain amount of antibodies before excreting them, or the antibodies measured inside the cell may not be fully formed and matured, and therefore need more time to complete the process before being excreted. Further investigation is here needed to validate these preliminary hypotheses. Moreover, this difference between extracellular and intracellular concentration profiles may provide clues to improve models for controlling and optimizing monoclonal antibody production processes. In fact, focusing only on the extracellular concentration would not take into account that intracellular production has already been completed days before.
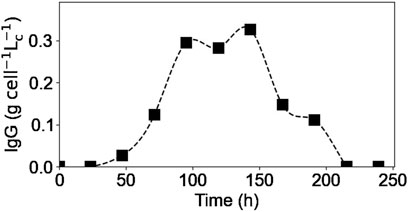
Figure 8. Experimental intracellular IgG concentrations. Squares represent the measured concentrations from experiment E4.
In addition, the end of the intracellular IgG plateau matches the moment when different amino acids (i.e., glutamine, asparagine, cystine) were fully depleted from the culture medium meaning that cells’ antibody production was limited to an intracellular amino acids stock. Therefore, the decrease in the intracellular IgG concentration corresponds to a lower intracellular production rate compared to the IgG secretion rate. This could explain why the extracellular IgG concentration continued to increase, at a much slower rate, even after some of the amino acids were no longer present in the culture media and reached a plateau after 200 h of culture, when there were no more antibody inside the cells. This concept of accumulation of metabolites inside the cell to account for the product synthesis, even if a substrate has been depleted from the culture medium, has been previously reported (Ben Yahia et al., 2021), and is thus demonstrated in the present study. To improve the IgG production rate, it would be thus interesting to study the intracellular IgG concentration profile during a fed-batch culture; this would allow to verify whether the addition of the depleted amino acids would modify the concentration plateau obtained, reaching a higher intracellular concentration or prolonging it.
The intracellular lactate and IgG concentration profiles appeared to be very similar. However, based on the data obtained, it was not possible to suggest a possible biological connection between them.
3.3.3 Intracellular amino acids
Due to the small sample volume collected for day 0, it was not possible to measure the intracellular amino acid concentrations that day; therefore only data from days 1–10 are presented. The full 20 amino acid intracellular concentration kinetics can be found in the Supplementary Material.
Figure 9 shows the experimental intracellular concentrations for asparagine, aspartic acid, alanine, and cystine. Intracellular asparagine concentration profile is shown in Figure 9a. As it can be seen, the asparagine intracellular concentration increased during the first 3 days, and then, during the rest of the culture, the intracellular concentration decreased. This increase in concentration during the early exponential phase and decrease during the exponential and decline phases has been previously reported in different studies (Templeton et al., 2013; Vodopivec et al., 2019; Dean and Reddy, 2013).
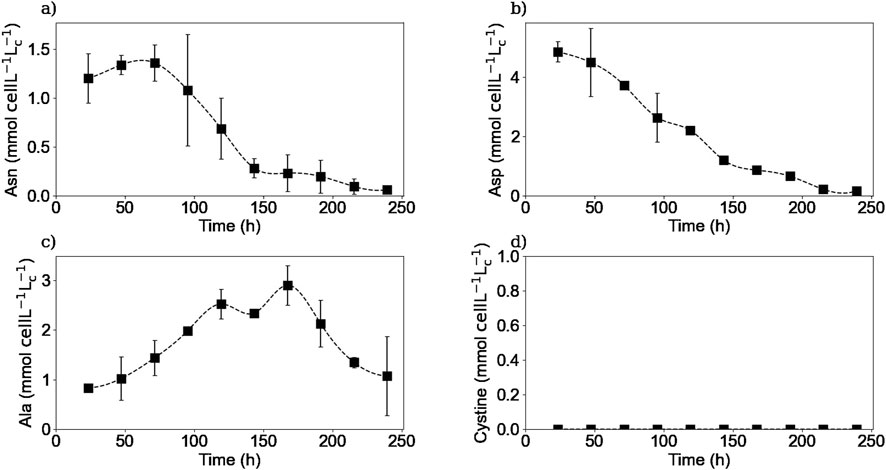
Figure 9. Experimental intracellular concentrations of asparagine (a), aspartic acid (b), alanine (c), and cystine (d). Squares represent the average of the measured concentrations from two repetitions (E1 and E3).
Figure 9b shows aspartic acid intracellular concentration profile. As it can be seen, the aspartic acid is consumed in the cell interior during all the stages of the culture. The decrease in intracellular aspartic acid concentration during the decline phase has been reported in another study (Vodopivec et al., 2019). This continuous decrease in the intracellular concentration confirms that aspartic acid was constantly being metabolized even though the extracellular aspartic acid concentration remained fairly constant during the first part of the culture.
Moreover, during the exponential phase, the intracellular alanine concentration increased as a result of its synthesis in the cell interior (Figure 9c) (Coulet et al., 2022). Then, during the decline phase, the intracellular alanine was consumed following the alanine metabolic switch, leading to the decrease of the extracellular alanine concentration. Concerning intracellular cystine concentrations, Figure 9d shows that, at least with the presented experimental protocol and analytical methods, there was no accumulation of cystine, in the form of molecular cystine, in the cell interior. As explained before, cystine was measured instead of cysteine due to the spontaneous oxidation of cysteine in aqueous solutions and the non-reducing conditions implemented in the HPLC-MS method. The equipment’s detection limit for cystine was 0.01 mM.
These data on the intracellular concentration of amino acids could be complemented in a future study by measurements of intracellular enzymes, possibly linking the profiles obtained to mechanisms of allosteric enzyme regulation (O’Brien et al., 2020; Dean and Reddy, 2013).
3.3.4 Intracellular reaction rates
Using both the extracellular and intracellular concentrations, the intracellular reaction rates for different species were calculated using Equation 7. Due to the uncertainty of the glucose and ammonium concentration results inside the cell, the reaction rates were not calculated for these two species. Also, because intracellular concentrations were not measured on day 0 for HPLC-MS analysis, the reaction rates of the amino acids were calculated from day 2.
Figures 10, 11 show the intracellular reaction rates for selected species. The reaction rates for all of the twenty amino acids are given in the Supplementary Material. The reaction rates were calculated as production rates therefore if the rate was positive, the metabolite was produced and if it was negative, it was consumed. As it can be seen in Figures 10a, 11a, the intracellular reaction rates for glutamine and asparagine, two of the amino acids consumed, were maximum on day 2 for glutamine and between days 2 and 3 for asparagine, and then decreased as the intracellular concentration of both species also decreased. In the case of aspartic acid, the maximal reaction rate was on day 4 (Figure 11b). The larger errors observed between days 2 and 4 were due to slightly different values of aspartic acid concentrations between these two times. These errors were amplified by the derivative post-processing of the data.
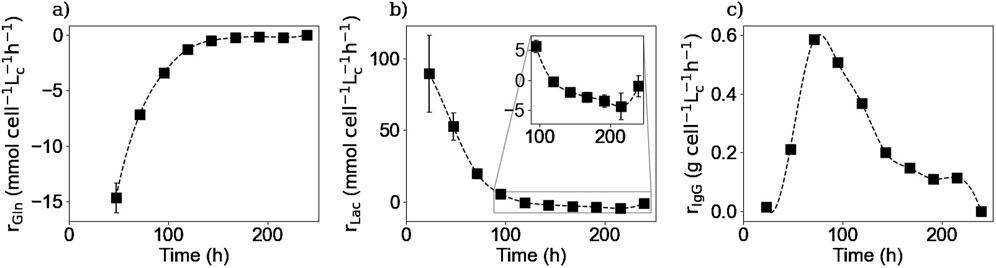
Figure 10. Calculated intracellular reaction rates for glutamine (a), lactate (b), and IgG (c). Squares represent the average of the calculated reaction rates from repetitions E1 and E3 for glutamine, E1, E2 and E3 for lactate and E4 for the IgG.
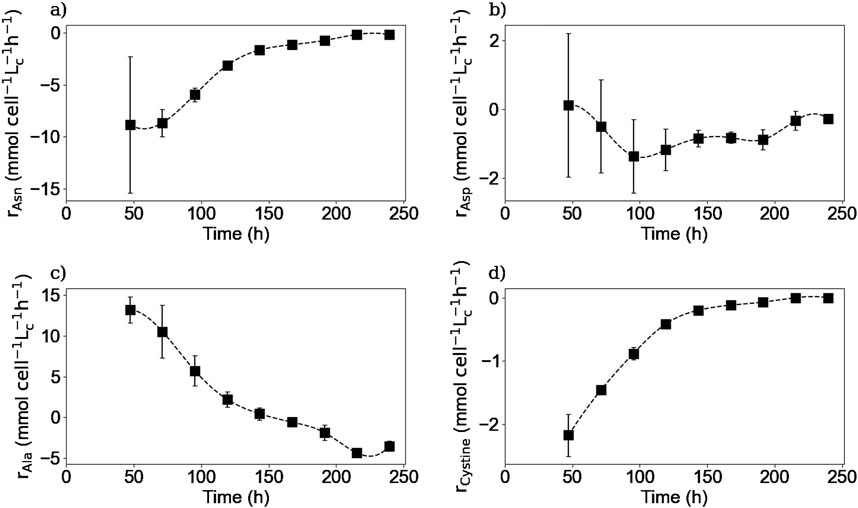
Figure 11. Calculated intracellular reaction rates for asparagine (a), aspartic acid (b), alanine (c), and cystine (d). Squares represent the average of the calculated reaction rates from repetitions E1 and E3.
Intracellular reaction rates for lactate and alanine are presented in Figures 10b, 11c. Both molecules were produced at the beginning of the culture and presented a maximum production rate on day 1 for lactate and day 2 for alanine. Then, as explained before, both metabolites had a metabolic switch in the last part of the culture, and therefore, the calculated intracellular reaction rates became negative during the same period. In the case of cystine, the calculated intracellular reaction rates profile perfectly matched the specific consumption rate profile (Figure 11d); the concentrations obtained inside the cell were indeed close to zero, indicating there was no accumuation of this amino acid in this form inside the cell. Concerning the intracellular reaction rates of IgG, its maximal intracellular production rate was obtained during day 3 and then decreased during the rest of the culture (Figure 10c).
For lactate, IgG, asparagine, aspartic acid, and cystine, the days on which the maximum intracellular reaction rates were obtained, coincided with the days on which the specific consumption or production rates for these molecules were calculated. These results are particularly interesting for the IgG kinetics, because even with the 2-day delay between the intracellular and extracellular antibody concentrations, the peaks of both rates matched, suggesting that the intracellular concentrations are negligible compared to both rates. In the case of alanine and glutamine, the maximum specific production and consumption rates, were obtained on day 1. However, since the intracellular reaction rates could not be calculated on day 1, it was not possible to verify whether the peaks corresponded to the same day.
Finally, the measured extracellular and intracellular concentrations as well as the calculated rates were used to compare the intracellular and extracellular dynamics. To that end, the mass transfer across the cell membrane was compared with the intracellular reaction rates for each substrate, metabolite, and product, using the adaptation of the Thiele modulus presented in Equation 8. A value very close to one was obtained for all the species during the whole culture, meaning that both phenomena are comparable. Therefore, although variations in intracellular metabolite concentrations were observed experimentally, the dynamics of these variations were largely slower than the mass transfer across the cell membrane or than intracellular reaction kinetics. These results are in agreement with the hypothesis of a pseudo-steady state inside the cell made in some culture modeling approaches such as the FBA. This does not mean that the intracellular concentrations do not change during the culture duration but that, these changes can be neglected on a short time scale compared to the changes in extracellular concentrations. Furthermore, this pseudo-steady state implies that the extracellular and intracellular dynamics do not have the same time scale, as the changes inside the cells occurs much quicker than the changes in the extracellular environment and therefore, focusing only on extracellular dynamics would overlook all the intracellular dynamics and all the information it can provide to model development and understanding of the culture process.
4 Conclusion
The present study focused on the intracellular and extracellular dynamics during a mAb-producing CHO batch culture. Concerning the extracellular metabolites concentration, it was shown that different amino acids like glutamine, asparagine, and cystine were completely depleted from the culture media at the same time, when the culture entered the stationary phase, and cell growth stopped, suggesting that those amino acids are limiting substrates during batch cultures for the used cell line.
As for the intracellular concentrations, different metabolites were measured and their intracellular concentration profiles were obtained. It was confirmed that the concentrations of the different metabolites inside the cell do not remain constant, but change during the culture. Cells seem to keep a storage of metabolites, such as amino acids (e.g., glutamine and asparagine), for their use, allowing the cells to continue their metabolic activity for some time after these metabolites have been completely depleted from the culture medium. Extracellular metabolites that underwent a metabolic switch from production to consumption, such as lactate and alanine, also reflected this change in the intracellular concentration profiles. In the case of the intracellular IgG concentration, it was found that there was a 2-day delay between intracellular antibody production and its secretion to the culture medium. This finding may provide clues to improve models for controlling and optimizing monoclonal antibody production processes, as focusing only on the extracellular concentration would not take into account that intracellular production has already been completed days before.
The profiles of extracellular and intracellular concentrations showed that, although the concentrations inside the cell do not remain constant, compared to the mass transfer rate across the membrane and the reaction rate inside the cell, the rate of intracellular accumulation is negligible, confirming a pseudo-steady state inside the cell during a short time period, and thus validating the assumptions made in modeling approaches such as the FBA. Finally, it was shown that focusing on both the extracellular and intracellular dynamics could improve process understanding and kinetic model development as both dynamics bring important information about different phenomena that occur at different time scales.
Data availability statement
The raw data supporting the conclusions of this article will be made available by the authors, without undue reservation.
Author contributions
AA: Conceptualization, Formal Analysis, Investigation, Methodology, Validation, Visualization, Writing – original draft, Writing – review and editing. BE: Supervision, Writing – review and editing. CP: Formal Analysis, Methodology, Writing – review and editing. SS: Methodology, Validation, Writing – review and editing. DP: Funding acquisition, Project administration, Supervision, Writing – review and editing. EO: Funding acquisition, Project administration, Supervision, Writing – review and editing.
Funding
The author(s) declare that financial support was received for the research and/or publication of this article. This work was funded by the Association Nationale de la Recherche et de la Technologie (ANRT), grant number 2021/0533.
Acknowledgments
The authors would like to thank the PASM platform for the use of the LTQ LC-MS system (Plateau d’Analyse Structurale et Métabolomique - SF4242 EFABA, F-54505 Vandoeuvre-lès-Nancy, France).
Conflict of interest
Authors AA and DP were employed by company Ypso-Facto. The remaining authors declare that the research was conducted in the absence of any commercial or financial relationships that could be construed as a potential conflict of interest.
Generative AI statement
The author(s) declare that no Generative AI was used in the creation of this manuscript.
Publisher’s note
All claims expressed in this article are solely those of the authors and do not necessarily represent those of their affiliated organizations, or those of the publisher, the editors and the reviewers. Any product that may be evaluated in this article, or claim that may be made by its manufacturer, is not guaranteed or endorsed by the publisher.
Supplementary material
The Supplementary Material for this article can be found online at: https://www.frontiersin.org/articles/10.3389/fbioe.2025.1546105/full#supplementary-material
References
Alejandra, W.-P., Miriam Irene, J.-P., Fabio Antonio, G.-S., Patricia, R.-G. R., Elizabeth, T.-A., Aleman-Aguilar, J. P., et al. (2023). Production of monoclonal antibodies for therapeutic purposes: a review. Int. Immunopharmacol. 120, 110376. doi:10.1016/j.intimp.2023.110376
Altamirano, C., Illanes, A., Becerra, S., Cairó, J., and Gòdia, F. (2006). Considerations on the lactate consumption by CHO cells in the presence of galactose. J. Biotechnol. 125, 547–556. doi:10.1016/j.jbiotec.2006.03.023
Altamirano, C., Paredes, C., Illanes, A., Cairó, J., and Gòdia, F. (2004). Strategies for fed-batch cultivation of t-PA producing CHO cells: substitution of glucose and glutamine and rational design of culture medium. J. Biotechnol. 110, 171–179. doi:10.1016/j.jbiotec.2004.02.004
Ben Yahia, B., Malphettes, L., and Heinzle, E. (2015). Macroscopic modeling of mammalian cell growth and metabolism. Appl. Microbiol. Biotechnol. 99, 7009–7024. doi:10.1007/s00253-015-6743-6
Ben Yahia, B., Malphettes, L., and Heinzle, E. (2021). Predictive macroscopic modeling of cell growth, metabolism and monoclonal antibody production: case study of a CHO fed-batch production. Metab. Eng. 66, 204–216. doi:10.1016/j.ymben.2021.04.004
Carinhas, N., Duarte, T. M., Barreiro, L. C., Carrondo, M. J. T., Alves, P. M., and Teixeira, A. P. (2013). Metabolic signatures of GS-CHO cell clones associated with butyrate treatment and culture phase transition. Biotechnol. Bioeng. 110, 3244–3257. doi:10.1002/bit.24983
Coulet, M., Kepp, O., Kroemer, G., and Basmaciogullari, S. (2022). Metabolic profiling of CHO cells during the production of biotherapeutics. Cells 11, 1929. doi:10.3390/cells11121929
Dean, J., and Reddy, P. (2013). Metabolic analysis of antibody producing CHO cells in fed-batch production. Biotechnol. Bioeng. 110, 1735–1747. doi:10.1002/bit.24826
Duarte, T., Carinhas, N., Barreiro, L., Carrondo, M. T., Alves, P., and Teixeira, A. (2014). enMetabolic responses of CHO cells to limitation of key amino acids: key Metabolic Features of CHO Cells. Biotechnol. Bioeng. 111, 2095–2106. doi:10.1002/bit.25266
Eagle, H. (1955). engThe specific amino acid requirements of a mammalian cell (strain L) in tissue culture. J. Biol. Chem. 214, 839–852. doi:10.1016/s0021-9258(18)70932-0
Fan, Y., Jimenez Del Val, I., Müller, C., Wagtberg, S. J., Rasmussen, S. K., Kontoravdi, C., et al. (2015). enAmino acid and glucose metabolism in fed-batch CHO cell culture affects antibody production and glycosylation: process-Dependent IgG Glycosylation. Biotechnol. Bioeng. 112, 521–535. doi:10.1002/bit.25450
Frenzel, A., Hust, M., and Schirrmann, T. (2013). Expression of recombinant antibodies. Front. Immunol. 4, 217. doi:10.3389/fimmu.2013.00217
Galleguillos, S., Ruckerbauer, D., Gerstl, M., Borth, N., Hanscho, M., and Zanghellini, J. (2017). enWhat can mathematical modelling say about CHO metabolism and protein glycosylation? Comput. Struct. Biotechnol. J. 15, 212–221. doi:10.1016/j.csbj.2017.01.005
Ghorbaniaghdam, A., Chen, J., Henry, O., and Jolicoeur, M. (2014). Analyzing clonal variation of monoclonal antibody-producing CHO cell lines using an in silico metabolomic platform. PLoS ONE 9, e90832. doi:10.1371/journal.pone.0090832
Goergen, J. L., Marc, A., and Engasser, J. M. (1993). Determination of cell lysis and death kinetics in continuous hybridoma cultures from the measurement of lactate dehydrogenase release. Cytotechnology 11, 189–195. doi:10.1007/BF00749869
Hagrot, E., Oddsdóttir, H. A., Mäkinen, M., Forsgren, A., and Chotteau, V. (2019). Novel column generation-based optimization approach for poly-pathway kinetic model applied to CHO cell culture. Metab. Eng. Commun. 8, e00083. doi:10.1016/j.mec.2018.e00083
Hartley, F., Walker, T., Chung, V., and Morten, K. (2018). Mechanisms driving the lactate switch in Chinese hamster ovary cells. Biotechnol. Bioeng. 115, 1890–1903. doi:10.1002/bit.26603
Karst, D. J., Steinhoff, R. F., Kopp, M. R. G., Serra, E., Soos, M., Zenobi, R., et al. (2017). Intracellular CHO cell metabolite profiling reveals steady-state dependent metabolic fingerprints in perfusion culture. Biotechnol. Progr 33, 879–890. doi:10.1002/btpr.2421
Kronthaler, J., Gstraunthaler, G., and Heel, C. (2012). Optimizing high-throughput metabolomic biomarker screening: a study of quenching solutions to freeze intracellular metabolism in CHO cells. OMICS J. Integr. Biol. 16, 90–97. doi:10.1089/omi.2011.0048
Kyriakopoulos, S., Ang, K., Lakshmanan, M., Huang, Z., Yoon, S., Gunawan, R., et al. (2018). Kinetic modeling of mammalian cell culture bioprocessing: the quest to advance biomanufacturing. Biotechnol. J. 13, 1700229. doi:10.1002/biot.201700229
Kyriakopoulos, S., and Kontoravdi, C. (2014). enA framework for the systematic design of fed-batch strategies in mammalian cell culture: quantitative Design of Feeds for Cell Culture. Biotechnol. Bioeng. 111, 2466–2476. doi:10.1002/bit.25319
Lagassé, H. D., Alexaki, A., Simhadri, V. L., Katagiri, N. H., Jankowski, W., Sauna, Z. E., et al. (2017). Recent advances in (therapeutic protein) drug development. F1000Research 6, 113. doi:10.12688/f1000research.9970.1
Lai, P.-K., Ghag, G., Yu, Y., Juan, V., Fayadat-Dilman, L., and Trout, B. L. (2021). Differences in human IgG1 and IgG4 S228P monoclonal antibodies viscosity and self-interactions: experimental assessment and computational predictions of domain interactions. mAbs 13, 1991256. doi:10.1080/19420862.2021.1991256
Lao, M.-S., and Toth, D. (1997). Effects of ammonium and lactate on growth and metabolism of a recombinant Chinese hamster ovary cell culture. Biotechnol. Prog. 13, 688–691. doi:10.1021/bp9602360
Li, M. (2018). “FrenchApproche méthodologique innovante pour le suivi en ligne de procédés de production d’anticorps par cellules animales: apport des techniques spectroscopiques in situ à la stratégie PAT,” in Université de Lorraine. France: Nancy. Ph.D. thesis.
Liste-Calleja, L., Lecina, M., Lopez-Repullo, J., Albiol, J., Solà, C., and Cairó, J. (2015). Lactate and glucose concomitant consumption as a self-regulated pH detoxification mechanism in HEK293 cell cultures. Appl. Microbiol. Biotechnol. 99, 9951–9960. doi:10.1007/s00253-015-6855-z
Luo, J., Vijayasankaran, N., Autsen, J., Santuray, R., Hudson, T., Amanullah, A., et al. (2012). Comparative metabolite analysis to understand lactate metabolism shift in Chinese hamster ovary cell culture process. Biotechnol. Bioeng. 109, 146–156. doi:10.1002/bit.23291
Mizrahi, A., and Lazar, A. (1988). Media for cultivation of animal cells: an overview. Cytotechnology 1, 199–214. doi:10.1007/BF00145023
Neermann, J., and Wagner, R. (1996). Comparative analysis of glucose and glutamine metabolism in transformed mammalian cell lines, insect and primary liver cells. J. Cell. Physiol. 166, 152–169. doi:10.1002/(sici)1097-4652(199601)166:1<152::aid-jcp18>3.3.co;2-c
Nolan, R., and Lee, K. (2011). Dynamic model of CHO cell metabolism. Metab. Eng. 13, 108–124. doi:10.1016/j.ymben.2010.09.003
O’Brien, C. M., Mulukutla, B. C., Mashek, D. G., and Hu, W.-S. (2020). Regulation of metabolic homeostasis in cell culture bioprocesses. Trends Biotechnol. 38, 1113–1127. doi:10.1016/j.tibtech.2020.02.005
O’Flaherty, R., Bergin, A., Flampouri, E., Mota, L. M., Obaidi, I., Quigley, A., et al. (2020). Mammalian cell culture for production of recombinant proteins: a review of the critical steps in their biomanufacturing. Biotechnol. Adv. 43, 107552. doi:10.1016/j.biotechadv.2020.107552
Orth, J., Thiele, I., and Palsson, B. (2010). enWhat is flux balance analysis? Nat. Biotechnol. 28, 245–248. doi:10.1038/nbt.1614
Pereira, S., Kildegaard, H., and Andersen, M. (2018). Impact of CHO metabolism on cell growth and protein production: an overview of toxic and inhibiting metabolites and nutrients. Biotechnol. J. 13, 1700499. doi:10.1002/biot.201700499
Ritacco, F. V., Wu, Y., and Khetan, A. (2018). Cell culture media for recombinant protein expression in Chinese hamster ovary (CHO) cells: history, key components, and optimization strategies. Biotechnol. Prog. 34, 1407–1426. doi:10.1002/btpr.2706
Savizi, I. P., Motamedian, E., E. Lewis, N., Jimenez del Val, I., and Shojaosadati, S. (2021). An integrated modular framework for modeling the effect of ammonium on the sialylation process of monoclonal antibodies produced by CHO cells. Biotechnol. J. 16, 2100019. doi:10.1002/biot.202100019
Savizi, I. S. P., Maghsoudi, N., Motamedian, E., Lewis, N. E., and Shojaosadati, S. (2022). Valine feeding reduces ammonia production through rearrangement of metabolic fluxes in central carbon metabolism of CHO cells. Appl. Microbiol. Biotechnol. 106, 1113–1126. doi:10.1007/s00253-021-11755-4
Sellick, C. A., Croxford, A. S., Maqsood, A. R., Stephens, G., Westerhoff, H. V., Goodacre, R., et al. (2011). Metabolite profiling of recombinant CHO cells: designing tailored feeding regimes that enhance recombinant antibody production. Biotechnol. Bioeng. 108, 3025–3031. doi:10.1002/bit.23269
Sellick, C. A., Croxford, A. S., Maqsood, A. R., Stephens, G. M., Westerhoff, H. V., Goodacre, R., et al. (2015). Metabolite profiling of CHO cells: molecular reflections of bioprocessing effectiveness. Biotechnol. J. 10, 1434–1445. doi:10.1002/biot.201400664
Templeton, N., Dean, J., Reddy, P., and Young, J. D. (2013). Peak antibody production is associated with increased oxidative metabolism in an industrially relevant fed-batch CHO cell culture. Biotechnol. Bioeng. 110, 2013–2024. doi:10.1002/bit.24858
Vodopivec, M., Lah, L., Narat, M., and Curk, T. (2019). Metabolomic profiling of CHO fed-batch growth phases at 10, 100, and 1,000 L. Biotechnol. Bioeng. 116, 2720–2729. doi:10.1002/bit.27087
Wijaya, A. W., Verhagen, N., Teleki, A., and Takors, R. (2021). enCompartment-specific 13 C metabolic flux analysis reveals boosted NADPH availability coinciding with increased cell-specific productivity for IgG1 producing CHO cells after MTA treatment. Eng. Life Sci. 21, 832–847. doi:10.1002/elsc.202100057
Xu, F., Rychnovsky, S. D., Belani, J. D., Hobbs, H. H., Cohen, J. C., and Rawson, R. B. (2005). Dual roles for cholesterol in mammalian cells. Proc. Natl. Acad. Sci. U. S. A. 102, 14551–14556. doi:10.1073/pnas.0503590102
Yilmaz, D., Parulekar, S. J., and Cinar, A. (2020). A dynamic EFM-based model for antibody producing cell lines and model based evaluation of fed-batch processes. Biochem. Eng. J. 156, 107494. doi:10.1016/j.bej.2020.107494
Zagari, F., Jordan, M., Stettler, M., Broly, H., and Wurm, F. (2013). Lactate metabolism shift in CHO cell culture: the role of mitochondrial oxidative activity. New Biotechnol. 30, 238–245. doi:10.1016/j.nbt.2012.05.021
Zamorano, F., Wouwer, A., and Bastin, G. (2010). A detailed metabolic flux analysis of an underdetermined network of CHO cells. J. Biotechnol. 150, 497–508. doi:10.1016/j.jbiotec.2010.09.944
Zavala-Ortiz, D. A., Denner, A., Aguilar-Uscanga, M. G., Marc, A., Ebel, B., and Guedon, E. (2022). Comparison of partial least square, artificial neural network, and support vector regressions for real-time monitoring of CHO cell culture processes using in situ near-infrared spectroscopy. Biotech. Bioeng. 119, 535–549. doi:10.1002/bit.27997
Zhang, W., Liu, X., Tang, H., Zhang, X., Zhou, Y., Fan, L., et al. (2020). Investigation into the impact of tyrosine on the product formation and quality attributes of mAbs in rCHO cell cultures. Appl. Microbiol. Biotechnol. 104, 6953–6966. doi:10.1007/s00253-020-10744-3
Keywords: CHO cells, mAb, amino acids, intracellular concentrations, extracellular concentrations
Citation: Avilan Garzon A, Ebel B, Paris C, Schneider S, Pfister D and Olmos E (2025) mAb production kinetics in CHO batch culture: exploring extracellular and intracellular dynamics. Front. Bioeng. Biotechnol. 13:1546105. doi: 10.3389/fbioe.2025.1546105
Received: 16 December 2024; Accepted: 08 May 2025;
Published: 21 May 2025.
Edited by:
Zhen Fang, Jiangsu University, ChinaReviewed by:
Ezhaveni Sathiyamoorthi, Yeungnam University, Republic of KoreaThomas Wucherpfennig, Boehringer Ingelheim, Germany
Copyright © 2025 Avilan Garzon, Ebel, Paris, Schneider, Pfister and Olmos. This is an open-access article distributed under the terms of the Creative Commons Attribution License (CC BY). The use, distribution or reproduction in other forums is permitted, provided the original author(s) and the copyright owner(s) are credited and that the original publication in this journal is cited, in accordance with accepted academic practice. No use, distribution or reproduction is permitted which does not comply with these terms.
*Correspondence: Eric Olmos, ZXJpYy5vbG1vc0B1bml2LWxvcnJhaW5lLmZy