 Mengqiang Hu1,2,3†
 Ming Yang3,4†Zhihao Ding1,2Shu Chen5Xiaoyu Qi6Chuanzhi Zhu1,2Yining Zhang5
 Chao Yang6*
 Yuanming Luo7*
- 1State Key Laboratory of Transvascular Implantation Devices, Hangzhou, China
- 2Department of Technology, Boea Wisdom (Hangzhou) Network Technology Co., Ltd., Hangzhou, China
- 3Department of Radiology, Union Hospital, Tongji Medical College, Huazhong University of Science and Technology, Wuhan, China
- 4Hubei Province Key Laboratory of Molecular Imaging, Wuhan, China
- 5Department of Cardiovascular Surgery, Union Hospital, Tongji Medical College, Huazhong University of Science and Technology, Wuhan, China
- 6Department of Vascular Surgery, Union Hospital Tongji Medical College, Huazhong University of Science and Technology, Wuhan, China
- 7Department of Mechanical Engineering, The University of Iowa, Iowa, IA, United States
Hemodynamic predictions using computational fluid dynamics (CFD) simulations can provide valuable guidance assessing aortic disease risks. However, their reliability is hindered by the lack of patient-specific boundary conditions, particularly measured flow rates. This study addresses this knowledge gap by introducing a method for estimating flow division in aortic branches. The geometry of the lesional aorta was first repaired to obtain a near-healthy reference geometry. An iterative CFD simulation was then employed to estimate the flow division in the branches of the diseased aorta. Specifically, empirical boundary conditions from healthy individuals were used to predict the outlet pressures of reference geometry, which were subsequently converted into resistance models. These resistance models were then assigned to the outlets of the diseased aorta to predict the inlet pressure. The discrepancy between the predicted and target inlet pressures was iteratively minimized by adjusting the inlet pressure of the reference model until convergence was achieved. The final flow division in the branches of the diseased aorta was then obtained. The performance of the proposed method was investigated in three patients with aortic dissection or aneurysm. The proposed method predicted lower flow rates in branches with severe stenosis, which was more consistent with physiological expectations. Furthermore, the predicted blood pressure differed significantly from that obtained using the traditional method and was closer to the target values. The proposed method provides a practical solution for specifying boundary conditions in hemodynamic studies when clinically measured flow rates are unavailable.
1 Introduction
Cardiovascular diseases pose a significant threat to human health (Mensah et al., 2019). Among these, the aortic-related diseases, such as aortic aneurysm and aortic dissection (Sterpetti et al., 2024), usually causes a high mortality rate since the aorta serves as a crucial bridge supplying blood from the heart to the rest of the body. Hemodynamic investigation based on CFD can provide more integrated guidance for disease management in patients with aortic diseases (Tse et al., 2011; Bianchi et al., 2017; Hu et al., 2025).
Accurate hemodynamic predictions using CFD depend on patient-specific aortic geometry and boundary conditions (Taylor and Figueroa, 2009; Youssefi et al., 2018; Armour et al., 2022). Advances in medical imaging technology have enabled precise acquisition of patient-specific aortic geometry. Even minor branches of the aorta have been successfully reconstructed in hemodynamic studies (Stokes et al., 2023b). As for patient-specific boundary conditions, advanced technologies like 4D Flow MRI can capture multi-dimensional blood velocity (Azarine et al., 2019). However, their application is typically limited to large academic centers rather than routine clinical use (Menon et al., 2024). Idealized or simplified boundary conditions, such as constant pressure, empirical pulsatile pressure, empirical flowrate, Murray-law, and 0D lumped parameter model for outflow strategy, have been widely used (Dillon-Murphy et al., 2016; Zambrano et al., 2016; Peng et al., 2019; Zhang et al., 2023). The Windkessel model, a type of lumped parameter model, is particularly popular because it can not only achieve specific downstream flow division, but also reproduce the patient’s blood pressure at the ascending aorta inlet (Stergiopulos et al., 1999b).
The Windkessel model analogized the target vascular system to an electric circuit. For aortic hemodynamics investigations, downstream arteries, arterioles, and capillaries are typically simplified into a lumped parameter model. This model is then coupled with the 3D aortic geometry to conduct multi-scale simulations. In the electric circuit analogy, commonly used components include resistors to model blood’s viscous resistance, capacitors to model vessel wall compliance, and inductors to model blood inertia. The commonly used three-element Windkessel model comprises a characteristic impedance Rc for resistance in large arteries, a peripheral impedance Rp for resistance in distal vessels, and a capacitance C in parallel with Rp for the total compliance of the arterial tree (Westerhof et al., 1971).
To reproduce the ascending aorta inlet pressure and downstream branch flow division, parameters of the three-element Windkessel model should theoretically be estimated using patient-specific data. Tuning strategies for these parameters can be divided into manual “trial and error” tunning (Stergiopulos et al., 1999a; Chung, 2005; Les et al., 2010) and automatic iterative optimization tunning (Toorop et al., 1987; Spilker and Taylor, 2010; Ismail et al., 2013; Alimohammadi et al., 2014; Pant et al., 2014; Xiao et al., 2014; Bonfanti et al., 2019; Arthurs et al., 2020; Li and Mao, 2023). In manual methods, resistance is estimated based on the mean blood pressure and flow rate, while capacitance is determined using methods such as the pulse pressure method (Stergiopulos et al., 1999a), the decay time method (Laskey et al., 1990), or the area method (Liu et al., 1986). In iterative optimization methods, the objective functions are typically formulated to minimize the difference between the calculated and target inlet pressure and/or downstream flow rate. Li and Mao (Li and Mao, 2023) proposed a fast approach to obtain the parameters using a pattern search algorithm and an only-once steady-state CFD simulation; notably, the flow resistance of the 3D aortic geometry was considered in the optimization process.
The flow division in downstream branches is an essential input in the tuning process of the parameters. Unfortunately, patient-specific flow rates are usually unavailable in clinic settings. As a result, empirical flow division is widely used. Tricarico et al. (2023) proposed a method to approximate the parameters of the three-element Windkessel model. They first calculated population-averaged, artery-specific normalized parameters according to the patient-specific flow rate and pressure waveforms measured in a patient cohort. These parameters were then integrated with brachial pressure values and mean flow rates, estimated from arterial diameter, to determine the resistance and capacitance for new patients. However, representative population-averaged data relies heavily on a large patient cohort and estimating mean flow rates based on arterial diameter encounters challenges related to accuracy and variability, especially in patients with vessel lesions. In Alimohammadi et al.’s study (Alimohammadi et al., 2014), an initial steady-state CFD simulation with zero-pressure outlets was conducted to determine a flow division, which was then used to estimate the parameters of the Windkessel model using a data assimilation technique. However, using a zero-pressure outlet for predictions deviates significantly from physiological reality and results in a flow division that differs from actual values (Chnafa et al., 2018).
Aortic diseases often involve abnormal dilation or stenosis of vessels, altering downstream flow division and potentially causing severe complications such as visceral or lower limb malperfusion. For hemodynamic investigations, using empirical flow division from healthy subjects will undoubtedly yield inaccurate results. Bonfanti et al. (2019) conducted multi-scale simulations for hemodynamic analysis of three complex type-B aortic dissection (TBAD) cases, one of which involved left renal malperfusion, as evidenced by contrast-enhanced CT scans. They wisely reduced blood flow rate to the left kidney by 29% in the empirical flow division to align with the patient’s condition. However, obtaining quantitative evidence of malperfusion in other branch arteries remains challenging due to the lack of reference for contrast.
Therefore, developing a method to estimate the flow division in branches of the diseased aorta is crucial. In this study, we propose an approach to achieve this goal and facilitate the parameter estimation process of the Windkessel model. First, the geometry of the diseased aorta was repaired based on established principles to obtain a near-healthy reference geometry. Then, an iterative CFD-based framework was designed to estimate the flow division by performing simulations on both the reference and lesional geometries. Specifically, empirical boundary conditions from healthy individuals were applied to the reference geometry to conduct CFD simulations to predict the outlet pressures. These outlet pressures were subsequently converted into resistance models and incorporated into the lesional model, where additional CFD simulations were conducted to predict the inlet pressure. The discrepancy between the predicted and target inlet pressures of the diseased aorta was iteratively minimized by adjusting the inlet pressure of the reference model until convergence was achieved. At convergence, the physiological state of the lesional model was considered to best approximate the patient’s actual condition, and the resulting flow division was deemed physiologically relevant. The performance of the proposed method was evaluated through its application to three patients with aortic dissection or aneurysm.
2 Materials and methods
2.1 Patient information
Three patients (56–68–69-year-old, 1 female and 2 males) with aortic diseases from the Union Hospital, Tongji Medical College, Huazhong University of Science and Technology were included in this study. In addition to abdominal aneurysm or dissection, two patients (Patients 1 and 2) exhibited arterial stenosis at the origins of certain visceral arteries due to atherosclerosis or calcification. The third patient (Patient 3) presented with a focal narrowing of the descending aorta caused by aortic dissection. Patient details are summarized in Table 1, and more detailed anatomical measurements are available in the Supplementary Material.
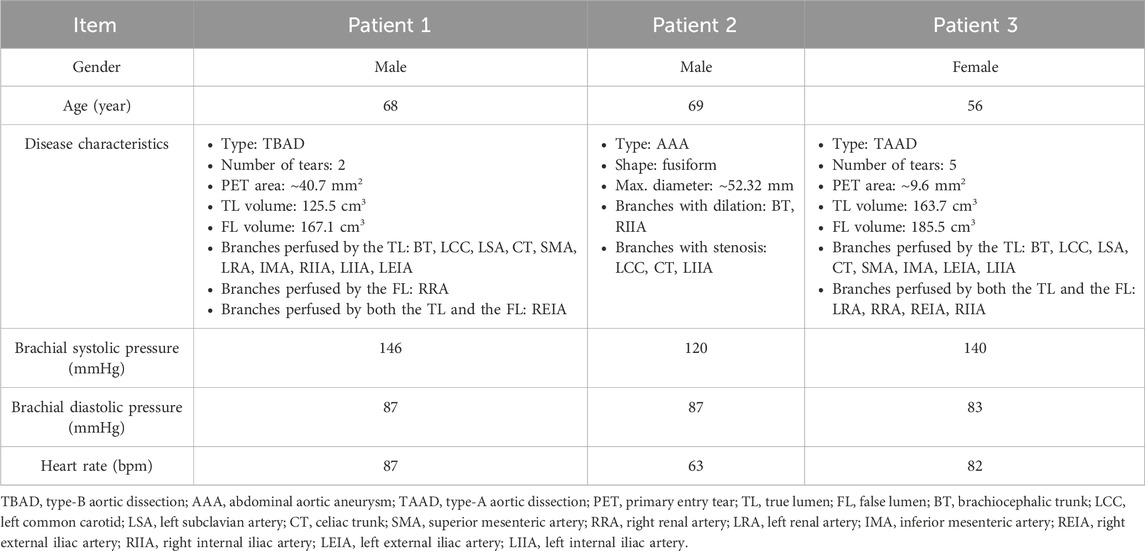
Table 1. Patient information.
The study protocol was approved by the institutional review board of Union Hospital, Tongji Medical College, Huazhong University of Science and Technology. Since the data involved in this study is retrospective, the requirement for informed consent was waived and anonymized data was used.
2.2 Clinical data
Computed tomography angiography (CTA) sequences of three patients were acquired using a 3rd generation Dual-Source CT scanner (SOMATOM Force; Siemens AG, Erlangen, Germany; 100 kV, 250 mA s, rotation time: 0.25 s, field of view (FOV): 250 mm, slice thickness: 0.5 mm, reconstruction kernel: Bv40, contrast agent: Iomeron 400; Bracco, Milan, Italy) with in-plane resolution of 0.5 mm and inter-slice distance of 0.5 mm for the reconstruction of the aorta, as shown in Supplementary Figure S1. Pre-treatment brachial blood pressure and heart rate were also measured and are summarized in Table 1.
2.3 Segmentation
The aorta geometries were reconstructed from CTA images using the image-processing software DetecModeling (Boea Wisdom, Hangzhou, China) (Ding et al., 2024). The reconstructed aorta, starting from the ascending aorta and extending to the internal and external iliac arteries, was cut and patched to form the inlet and outlet boundaries of the computational domain.
2.4 Geometry repair
To obtain a patient-specific healthy aortic model, the lesional aorta was manually repaired to generate a near-healthy reference geometry. To ensure the validity of the geometric repair, all modifications were independently performed by two experienced technicians under the guidance of a radiologist and a vascular surgeon. In cases of disagreement, a senior technician provided the final judgment.
The repair process of the diseased aorta is illustrated in Figure 1. Since the CTA scans of the diseased aorta were obtained relatively soon after the onset of the disease, its overall structure remained largely unaffected (Li et al., 2023; Wen et al., 2023). Therefore, the original vascular framework was preserved during the repair process. Furthermore, as the arterial disease had minimal impact on the location and geometry of bifurcation points (Ford et al., 2009), their anatomical structures were retained in the reference model. For cases of aortic dissection, the intimal flap was first filled to merge the true and false lumens. Subsequently, the merged model underwent contraction and smoothing, as the presence of the intimal flap and blood perfusion in the false lumen could contribute to aortic expansion. In cases of abnormal stenosis or dilation, the vessel diameter was adjusted based on the diameter of unaffected segments within the same anatomical region. A comparison between the lesional geometry and the repaired near-healthy reference geometry is provided in Supplementary Figure S2.
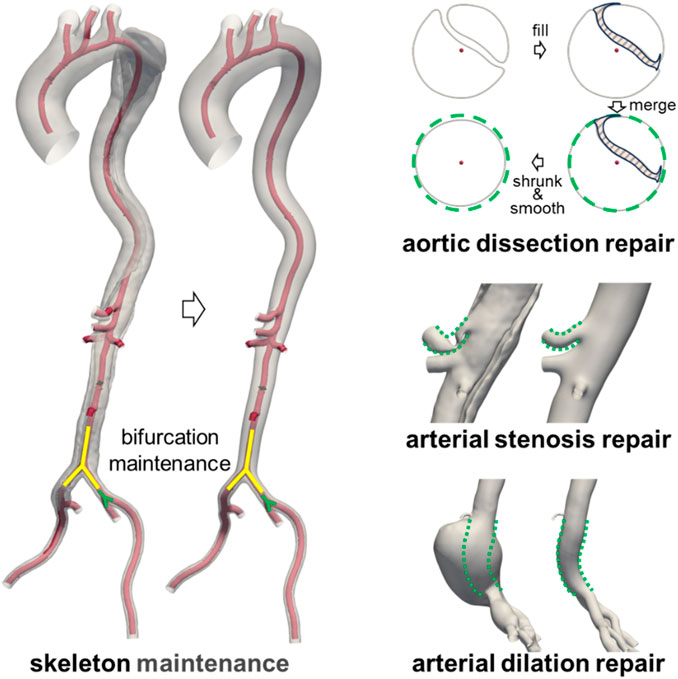
Figure 1. Manual repair of the diseased aortic model.
2.5 Meshing
The spatial discretization of both the lesional and reference geometries was carried out using the mesh tool integrated in DetecFluid (Boea Wisdom, Hangzhou, China). Given the complex morphology of the aorta, tetrahedral elements were employed for meshing. To ensure grid independence, three different grid resolutions were tested (see Supplementary Material), and a suitable configuration was selected for each aortic model. In the final meshes, the number of cell elements ranged from approximately 2.5–4.4 million across all patient-specific models, providing sufficiently fine resolution to capture the hemodynamic features. Detailed mesh statistics are provided in Supplementary Material.
2.6 Estimation of flow division in aortic branches
As illustrated in Figure 2, an iterative framework based on steady-state CFD simulations was developed to estimate the flow division in the downstream branches of diseased aortic models. Steady-state simulations were first conducted on the repaired reference geometry to obtain inlet and outlets pressures. The outlet pressures were subsequently converted into distal resistance models and prescribed at the outlets of the diseased geometry. Subsequently, steady-state simulations were performed on the diseased model to predict the inlet pressure, which was compared against the target value. Based on this discrepancy, the outlet resistances were updated, and the simulations were repeated until convergence was achieved. The boundary conditions employed in each simulation are described in detail below.
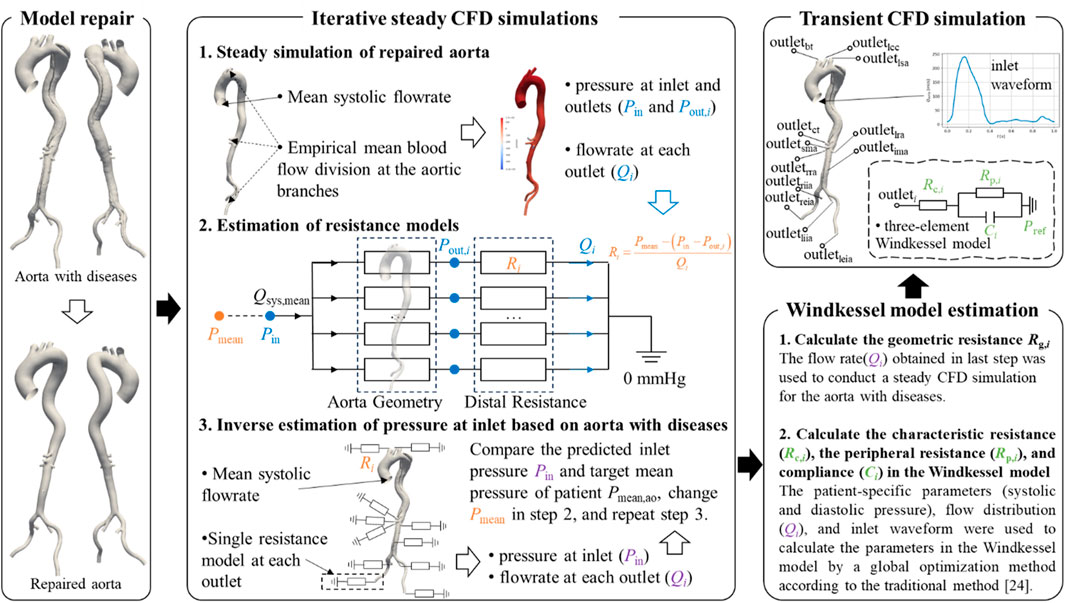
Figure 2. Iterative framework for estimating the flow division in branches of the diseased aorta.
In the steady-state CFD simulation of the reference model, the mean systolic flow rate, derived from empirical flow waveforms presented in Figure 2, was prescribed at the inlet, as this approach has been shown to effective predict mean blood pressure and vascular resistance (Li and Mao, 2023). The downstream flow division was assigned based on widely used measurements from previous studies (Je and Dn, 1994; Moore and Ku, 1994). Specifically, 30% of the cardiac output was allocated to the supra-aortic branches, with further distribution among them proportional to their cross-sectional areas. The celiac trunk received 15.5% of the cardiac output, while the superior mesenteric artery, the left renal artery, and the right renal artery each accounted for 10.5%. If the inferior mesenteric artery was present, it received 0.5% of the cardiac output. The remaining flow was equally divided between the left and right iliac arteries, with 30% directed into the internal iliac artery and 70% into the external iliac artery. Although these flow division values are based on imprecise historical measurements, they remain widely accepted in hemodynamic studies (Bonfanti et al., 2017; Bonfanti et al., 2019). Importantly, this does not affect the validation of the proposed method. More accurate flow division data from healthy individuals could be incorporated into future studies as they become available.
Based on the inlet pressure, outlet pressures, and flow rates predicted by the steady-state CFD simulation of the reference model, along with the empirical mean blood pressure values, the resistance at each outlet in the resistance model can be calculated using Equation 1:
Where
Next, a steady-state CFD simulation was conducted on the diseased aorta. The inlet boundary condition was set as a mass flow rate equal to that of the reference model. At the outlets, the resistance model was imposed, allowing the outlet pressure to vary dynamically with the flow rate. This simulation provided a predicted inlet pressure for the diseased aorta, which was then compared to the target value. Given that only brachial blood pressure was available for each patient, an empirical formula was used to estimate the mean pressure at the aortic inlet, as presented in Equations 2–4 (Stokes et al., 2021):
Where
The threshold for the discrepancy between the predicted and target inlet pressures was set at 1%. If the difference exceeded this threshold, the empirical mean pressure in Equation 1 was adjusted, and the steady-state CFD simulation of the diseased model was repeated. The iteration continued until discrepancy fell below 1%, at which point convergence was achieved. At this stage, the outlet resistance model was deemed representative of the patient’s physiological condition, and the predicted flow division in the aortic branches was considered a more patient-specific estimation.
2.7 CFD simulation for hemodynamic analysis
Transient CFD simulations were performed for each diseased aorta to analyze its hemodynamic characteristics. The inlet boundary condition was prescribed using a flow rate waveform (Figure 2) from the literature (Gallo et al., 2016), scaled according to patient-specific physiological data, and imposed with a plug flow profile. At the outlets, the three-element Windkessel was implemented, with its parameters estimated using the fast approach proposed by Li and Mao (Li and Mao, 2023). In the estimation process, the previously predicted patient-specific flow division in the aortic branches was used.
Additionally, to compare and assess the performance of the proposed method, a traditional scheme based on empirical flow division from healthy individuals (Bonfanti et al., 2017; 2019), specifically, the outlet flow rate used in step 1 in Figure 2, was also employed for Windkessel parameter estimation. In the following text, the results obtained using the previously predicted flow rate are labeled as the “proposed method”, while the results from the traditional scheme are labeled as the “traditional method”.
All CFD simulations were conducted by the software DetecFluid (Boea Wisdom, Hangzhou, China). It is a highly efficient GPU-based software for solving the equations of continuity and momentum conservation using a finite-volume methodology (Liu et al., 2025). Blood was assumed to be an incompressible Newtonian fluid with a density of 1,060 kg m-3 and a dynamic viscosity of 0.0035 Pa s. The vessel wall was defined as rigid with a no-slip boundary condition. Given the relatively high blood velocity and potential turbulence in the aorta, the standard k - ε model (Moukalled et al., 2016) was employed due to its numerical stability and its demonstrated applicability in aortic hemodynamics (Long Ko et al., 2017; Etli et al., 2021; Hohri et al., 2021). The standard wall function was used to resolve the viscous sublayer. A second-order scheme was used for spatial discretization and a first-order implicit scheme for temporal integration. The SIMPLE algorithm (Moukalled et al., 2016) was used to couple pressure and velocity equations. The converged residuals for all variables were 10–4. Additionally, for the transient CFD simulation, the cardiac cycle was divided into 1,000 time-steps. The transient simulation was performed over five cardiac cycles, and the analysis was conducted based on the data from the final cycle.
2.8 Flow analysis
Several metrics related to blood pressure, flow patterns, and wall shear stress were used to characterize the aortic hemodynamics. For temporal statistical metrics, every tenth timestep from the final cycle was used.
2.8.1 Blood pressure
Intravascular pressure is believed to play a significant role in the progression of cardiovascular diseases. For instance, elevated static pressure has been linked to the formation and rupture of aneurysms (Suzuki et al., 2016; Jiang et al., 2019; Huang et al., 2020; Yi et al., 2023). In this study, the distribution of static pressure was analyzed across ten sections of the aortic trunk. Additionally, the transmural pressure (TMP = PTL–PFL, where PTL and PFL are the pressure in the TL and FL, respectively) across the intimal flap was calculated and analyzed for Patients 1 and 3.
2.8.2 Flow pattern
The flow divisions at branch outlets were calculated and compared. Moreover, the velocity and helicity distributions across the same ten sections were illustrated. The helicity was quantified using the local normalized helicity (LNH) (Gallo et al., 2012), as shown in Equation 5.
Where v is the velocity vector, m·s−1.
2.8.3 Wall shear stress (WSS) related metrics
WSS-related metrics have been shown to be associated with the progression of aortic diseases (Boyd et al., 2016; Xu et al., 2018). Four commonly used metrics including time averaged WSS (TAWSS), oscillatory shear index (OSI), relative residence time (RRT), and aneurysm formation indicator (AFI) were selected and calculated by Equations 6–9.
Where T is the cardiac cycle,
3 Results
3.1 Flow division in aortic branches
Figure 3 illustrates the flow division in aortic branches predicted by the traditional and proposed methods. The specific flow rate values for each branch are provided in Supplementary Table S3. A strong correlation was observed between the two methods in predicting aortic branch flow division (Patient 1: r = 0.865, Patient 2: r = 0.973, Patient 3: r = 0.991). However, noticeable differences were found in certain branches, particularly those with severe stenosis, such as the celiac trunk in Patients 1 and 2. The proposed method predicted lower flow rates in these arteries, which is considered more physiologically realistic, resembling the “steal” phenomenon observed in patients with artery occlusions that redistribute blood flow to meet metabolic demands (Yamashiro et al., 2002; Hatzidakis et al., 2015). The Bland-Altman plot further indicates that the differences in predicted flow fractions for some branches approach or exceed the 95% limits of agreement.
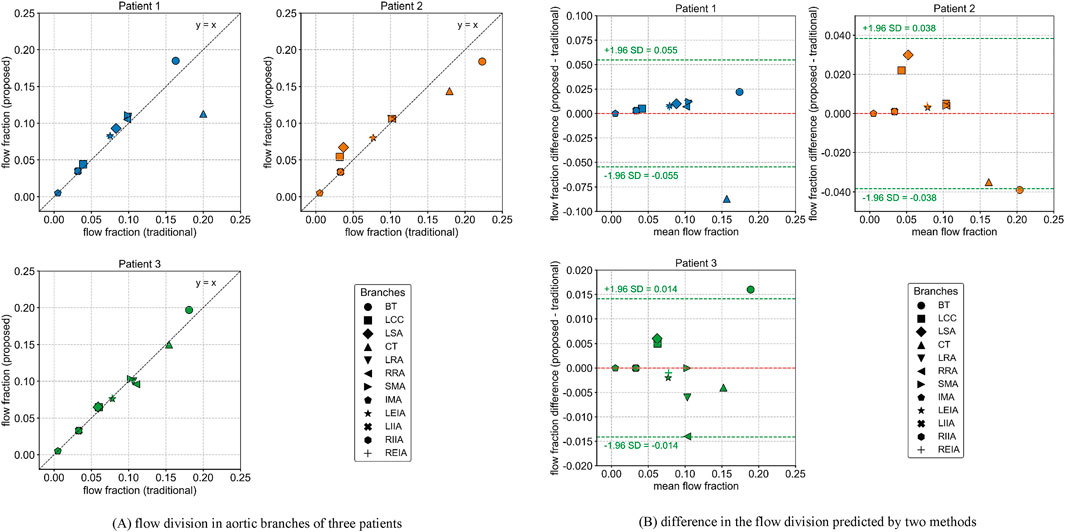
Figure 3. Flow division in aortic branches predicted by the traditional and proposed methods. (A) flow division in aortic branches of three patients (B) difference in the flow division predicted by two methods.
3.2 Estimated parameters of the windkessel models
The total resistance RWK and compliance C of the Windkessel models estimated by the traditional and proposed methods differed, as shown in Figure 4. These variations in parameters are related to the severity of the lesions and the differences in target flow rates in each branch. In the proposed method, the flow rate in the stenotic branches decreased and was redistributed to other branches. As a result, the total resistance of most Windkessel models in Patients 1 and 2 decreased, while the resistance of severely stenotic branches, such as the celiac trunk, increased. The variation in capacitance values of the Windkessel model was more complex, as it was influenced by both the pressure changes due to flow rate variations and volume changes associated with vascular lesions. Among all branches, the greatest change in capacitance occurred in the right renal artery of Patient 3, where it decreased from 0.577 mL mmHg-1 in the traditional method to 0.022 mL mmHg-1 in the proposed method.
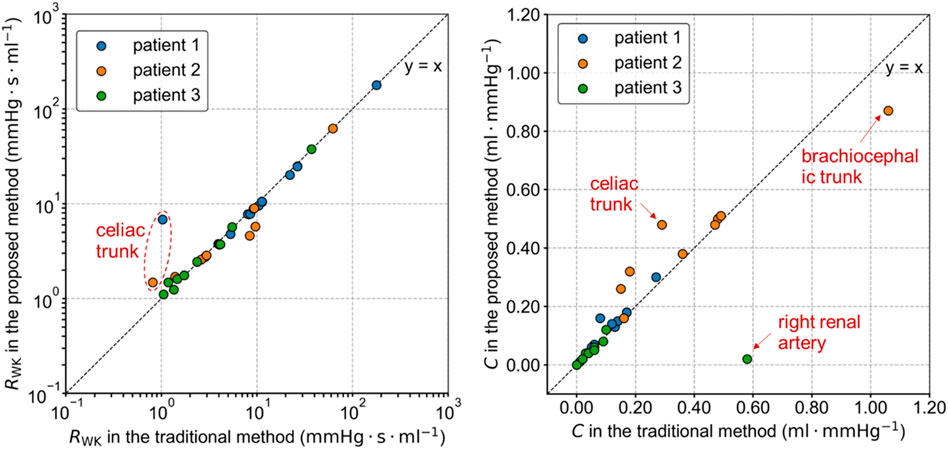
Figure 4. Parameters of the Windkessel model estimated by the traditional and proposed methods.
3.3 Blood pressure
The inlet pressures of the diseased aorta in Patient 1, predicted by the traditional and proposed methods, are compared and shown in Figure 5. The predicted inlet pressures differed from the measured aortic systolic and diastolic pressures. The proposed method performed better in reproducing the inlet blood pressure. In contrast, the traditional method assigned flow rates typical of healthy conditions to the stenotic branches, resulting in non-physiological pressure losses that influenced the simulation outcomes. The predicted systolic and diastolic pressures for Patients 2 and 3 are summarized in Supplementary Table S3. For Patient 3, the predicted inlet pressure from both methods significantly differed from the actual values. This discrepancy may be related to the limitations of the tuning strategy used in Windkessel models (Li and Mao, 2023).
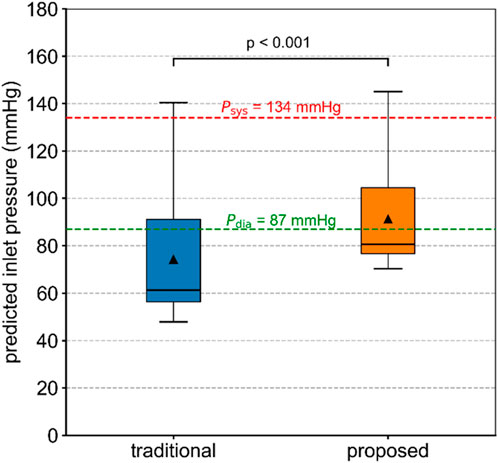
Figure 5. Inlet pressure of the diseased aorta in Patient 1, predicted by the traditional and proposed methods. The Wilcoxon signed-rank test was used to compare the difference.
The blood pressure distributions on the selected planes in Patient 1 at five time points are shown in Figure 6. The values predicted by the proposed method were higher than those predicted by the traditional method, and the distribution patterns were similar. Additionally, the blood pressure variations over time during the cardiac cycle were comparable. Similar trends were observed in Patients 2 and 3, as shown in Supplementary Figures S3,S4.
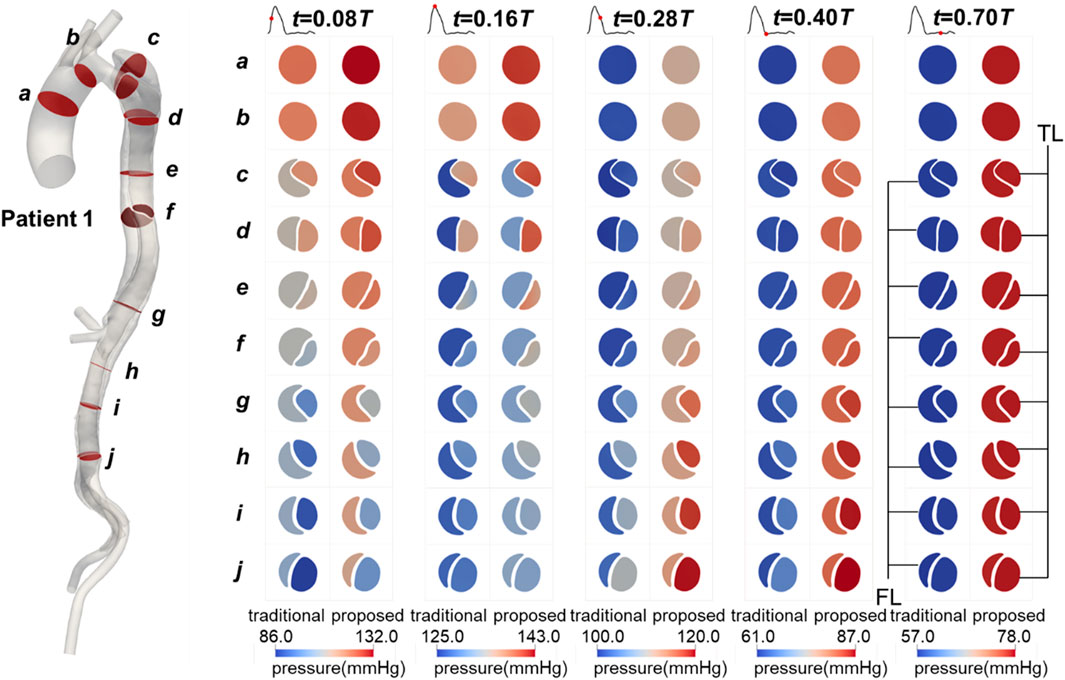
Figure 6. Contours of blood pressure on the selected planes in Patient 1 at mid-systolic acceleration, peak systole, mid-systolic deceleration, early diastole, and mid-diastole.
The TMP values for Patients 1 and 3, calculated by both methods, are shown in Figure 7. The values predicted by the proposed method differed from those predicted by the traditional method, with the traditional method generally overestimating the absolute TMP values. The difference was more pronounced and significant (p < 0.01) in Patient 3, primarily due to two severe stenoses in the true lumen of the descending aorta, located around planes d and g. These stenoses had a broader impact, leading to the observed discrepancies. Both methods predicted the same balance points where TMP equaled zero: for Patient 1, this balance point was between planes e and f, and for Patient 3, it was near plane h. The maximum difference in TMP values predicted by the two methods exceeded 5 mmHg, occurring near the iliac bifurcation in Patient 1, around plane j.
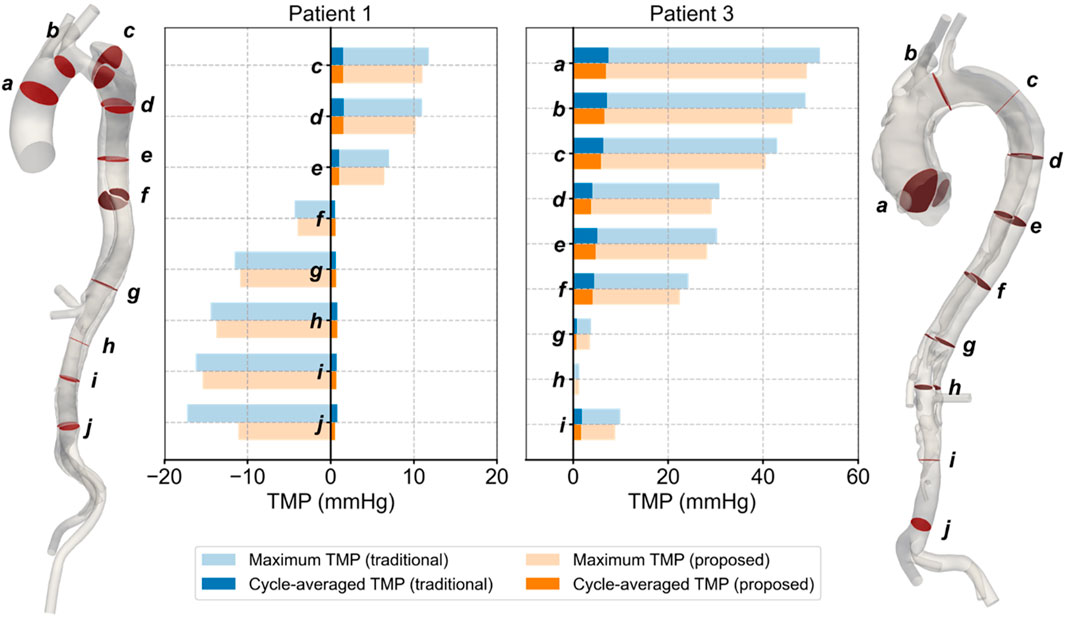
Figure 7. Spatial and temporal distributions of transmural pressure on the selected planes in Patients 1 and 3.
3.4 Flow patterns
The flow patterns in the aorta of Patient 1 are presented here. Results for Patients 2 and 3 can also be found in the Supplementary Material. Figure 8 illustrates the flow patterns in Patient 1 at five representative time points, and Figure 9 shows the velocity distribution on the selected planes. Unlike the blood pressure distributions, the velocity distributions predicted by the two methods were similar. Aorta tears cause a significant reduction in the cross-sectional area of the TL, but most of the blood still flows into the TL (86.5% in the proposed method and 88.4% in the traditional method), resulting in a high blood velocity in the TL. For branches supplied by both TL and FL, there was a slight but not significant change in the proportion of source. In the REIA, the proportion of blood flow from the TL increased from 85.4% in the traditional method to 87.4% in the proposed method.
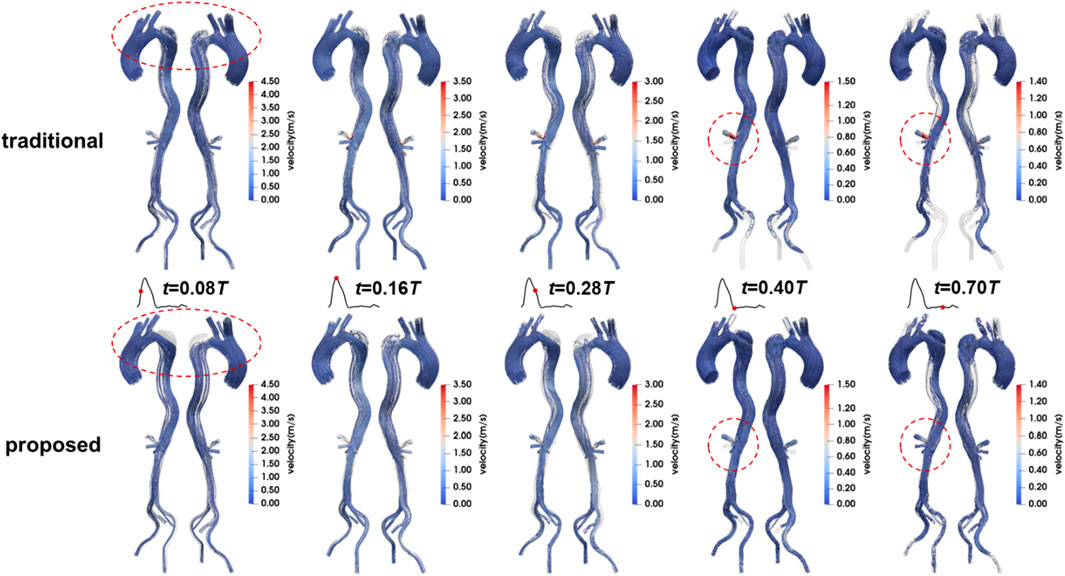
Figure 8. Velocity streamlines in Patient 1 at mid-systolic acceleration, peak systole, mid-systolic deceleration, early diastole, and mid-diastole.
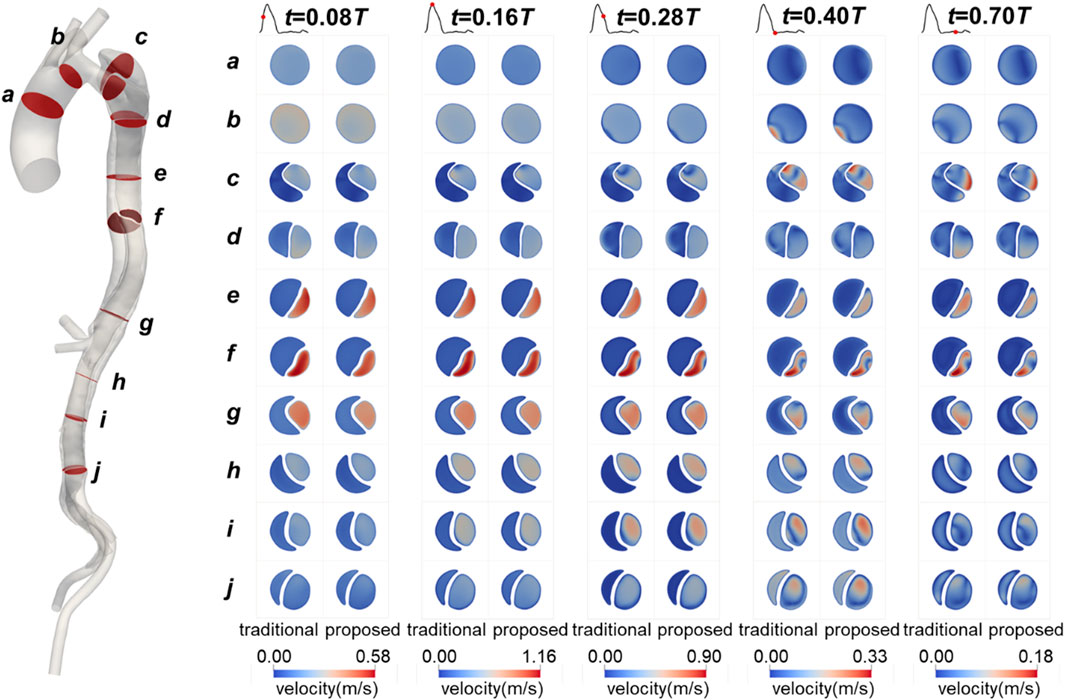
Figure 9. Contours of velocity on the selected planes in Patient 1 at mid-systolic acceleration, peak systole, mid-systolic deceleration, early diastole, and mid-diastole.
Like velocity, the distributions of LNH predicted by the two methods are similar. To maintain conciseness, these distributions are not shown here and can be found in the Supplementary Material. We calculated the difference in LNH by subtracting the values predicted by the traditional method from those predicted by the proposed method, as shown in Figure 10. The differences in LNH were scattered sporadically throughout the aorta, with more pronounced variations observed in the FL, which has a relatively large volume. From a temporal perspective, the differences were more pronounced during mid-systolic acceleration and the diastole phase compared to other times. This may be linked to the strong transition flow occurring between systole and diastole (Liu et al., 2012; Poelma et al., 2015).
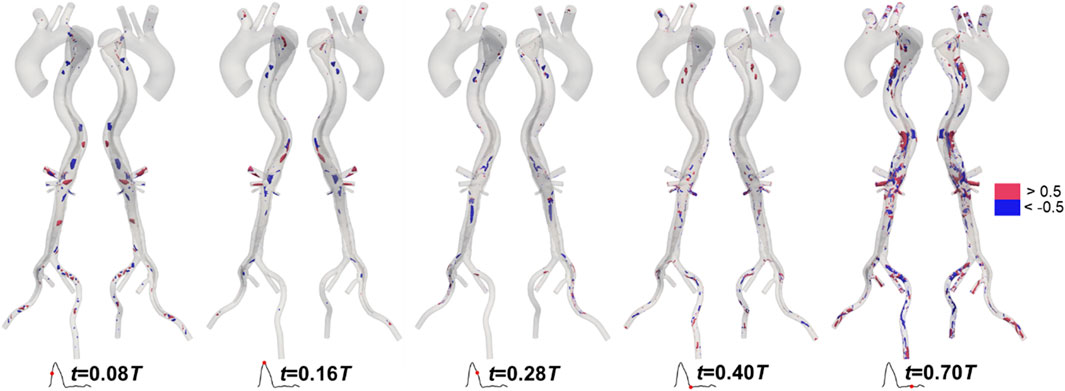
Figure 10. Differences in local normalized helicity in Patient 1 at mid-systolic acceleration, peak systole, mid-systolic deceleration, early diastole, and mid-diastole.
3.5 WSS-related hemodynamics
The distributions of WSS-related metrics in Patient 1 are shown in Figure 11, with those for Patients 2 and 3 available in the Supplementary Material. The distributions predicted by the two methods were similar, especially for the metrics based on cycle-averaged data such as TAWSS, OSI, and RRT. This is understandable, as these indicators are derived from wall shear stress, which is determined by the velocity gradient near the vessel wall. As previously mentioned, the velocity distributions along the aorta trunk predicted by the two methods were comparable. In the TL, high blood velocity resulted in high and unidirectional WSS, characterized by higher TAWSS, lower OSI and RRT, and more uniform AFI. In contrast, the FL exhibited low and oscillating WSS, with lower TAWSS, higher OSI and RRT, and more varied AFI, due to the larger volume and lower flow rate.
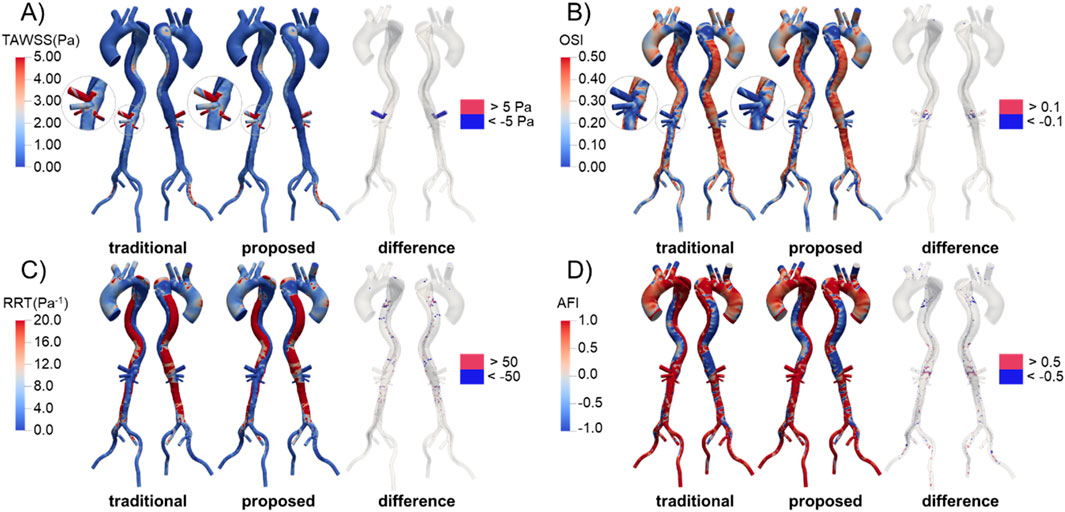
Figure 11. Distribution and difference of WSS-related metrics in Patient 1 predicted by the traditional and proposed methods. (A) TAWSS; (B) OSI; (C) RRT; (D) AFI.
We calculated the difference in these metrics by subtracting the values predicted by the traditional method from those predicted by the proposed method, as shown in Figure 11. In the celiac trunk, the TAWSS predicted by the proposed method was relatively lower due to the reduced flow rate. Differences in OSI were observed in areas near the visceral branches, where flow patterns were complex, while differences in RRT were scattered sporadically throughout the FL. For AFI, significant differences were widely distributed throughout the aorta, especially in the FL.
4 Discussion
4.1 Comparison with zero-pressure simulations
More realistic predictions of blood flow distribution enable more precise identification of malperfusion syndrome in patients. This represents a significant advancement over past studies that used simulations with zero-pressure outlets to assess the risk of malperfusion. Cheng et al. (2013) utilized transient simulations with zero-pressure outlets to analyze the hemodynamic characteristics of four patients with acute TBAD, two of whom developed complications of malperfusion. They suggested that higher flow rate into the FL might be related to malperfusion syndrome. However, their models did not include downstream branch arteries. Furthermore, a high flow rate into the FL does not necessarily result in malperfusion, as a patent FL can still supply blood to the distal arteries (Bonfanti et al., 2019). Alimohammadi et al. (2014) developed a patient-specific simulation tool for aortic dissection, in which the downstream flow division was first determined using a steady-state CFD simulation with zero-pressure outlets to tune the Windkessel model parameters for multi-scale simulations. Their results showed that 39.4% of the inlet flow went through the BT, leaving only 45.0% for the descending aorta, which contributed to lower limb and/or vital organ malperfusion. However, simulations using zero-pressure outlets likely overestimate the risk of malperfusion in downstream branches because the flow division was directly determined by the geometric resistance in the reconstructed aorta model. For comparison, we conducted simulations with zero-pressure outlets for Patient 1, following the methodologies of Cheng et al. (2013) and Alimohammadi et al. (2014). Table 2 illustrates the flow rate in branches predicted by these simulations. The “0Pa_Windkessel_target” values represent the flow division predicted by the steady-state simulation with zero-pressure outlets. The “0Pa_Windkessel” values denote the flow rates predicted by the multi-scale simulation with Windkessel models, whose parameters were estimated using the flow division in “0Pa_Windkessel_target”. The “0Pa_Transient” values show the flow division predicted by the transient simulation with zero-pressure outlets. It is evident that the flow distributions predicted by these simulations are similar, with approximately 48% of the inlet flow passing through the BT, similar to Alimohammadi et al.‘s study (Alimohammadi et al., 2014). The flow rates in the three branches on the arch were much higher than those in distal branches, which is clearly inconsistent with the physiological condition.
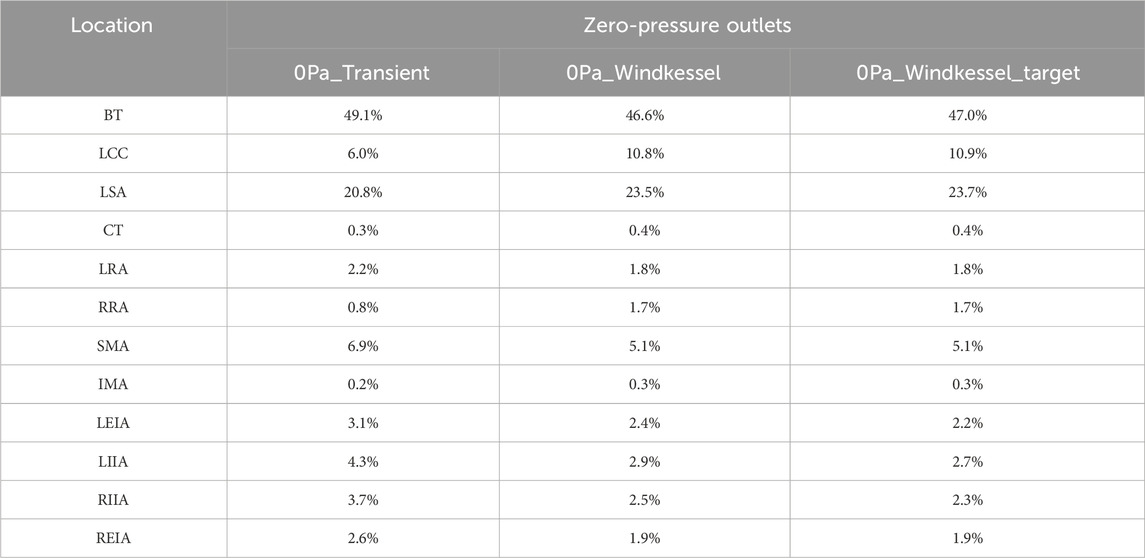
Table 2. Flow division predicted by simulations with zero-pressure outlets.
Furthermore, more accurate predictions of blood pressure and WSS-related metrics allow for a more precise evaluation of aortic diseases progression risks, including the obstruction of the TL (Bonfanti et al., 2019; Xu et al., 2021), the evolution of the FL (Chen et al., 2013; Xu et al., 2018), the dilation and rupture of aneurysms (Teng et al., 2022), and the formation of luminal thrombosis (Naim et al., 2016).
4.2 Impact of manual model repair
As introduced before, the proposed method involves manual repair of the diseased aorta model, which can introduce additional errors. Given that the level of smoothing in model reconstruction significantly impacts hemodynamic predictions (Paritala et al., 2023), we conducted a preliminary investigation into the effect of the smoothing factor on the results. Specifically, the repaired aorta of Patient 1 was smoothed to varying degrees, and the flow division in branches was recalculated using the proposed method. The results, presented in Table 3, indicate that smoothed models yielded more consistent flow rates with the proposed method and deviated significantly from the flow division predicted by the traditional method. Future work should focus on developing automated model repair techniques to strengthen the robustness of the proposed method. Ford et al. (2009) developed an objective and automated technique for digitally repairing arteries with saccular aneurysmal lesions. However, for more complex aortic conditions, such as fusiform aneurysms or aortic dissection, efficient automated repair algorithms remain unavailable.
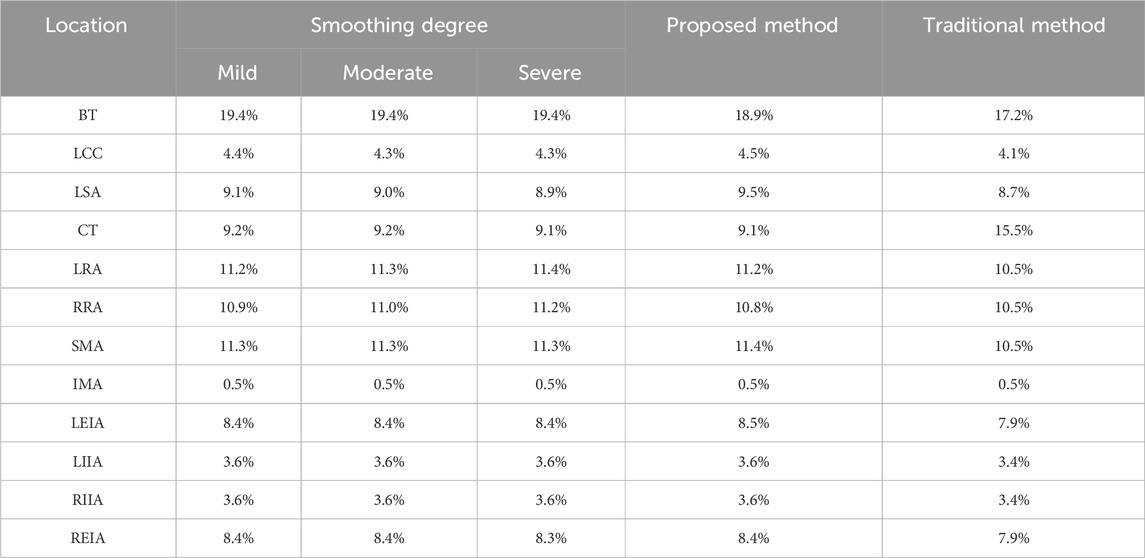
Table 3. Target flow rates predicted by steady-state simulations for various repaired geometries.
4.3 Limitations and future perspectives
There are several limitations in this study. First, while we showed that the proposed method could reproduce inlet blood pressure closer to the physiological data of patients, some persistent differences remained. These discrepancies arose because the Windkessel model parameters were estimated by a steady-state simulation with mean systolic blood flowrate at the inlet. This strategy is more effective for healthy aortas, where geometric resistances of branches vary similarly under different inflow rates. However, in stenotic branches of diseased aortas, the variation in resistance with inflow rate differs significantly from that of vessels with normal diameters, leading to less satisfactory predictions. In Li and Mao’s study (Li and Mao, 2023), the difference between the reproduced inlet pressure and physiological data also increased after the artificial narrowing of a branch. In addition, estimating Windkessel parameters from steady-state simulations has an inherent drawback: arterial compliance is neglected. As a result, the predicted inlet pressure (
In addition, several common assumptions and simplifications in CFD simulations, such as the rigid vessel wall, empirical inflow waveform combined with a plug flow profile, and Reynolds-averaged turbulence models, may reduce accuracy. Previous studies have shown that assuming a rigid wall tends to overestimate flow velocity and wall shear stress (Ene et al., 2014; Bonfanti et al., 2018). Compared with healthy aorta, neglecting wall compliance in diseased aortas with local stenoses, as considered in this study, may introduce larger errors. On the one hand, wall deformation can substantially alter the local resistance at the stenotic site and thereby affect flow distribution; on the other hand, in some pathologies, such as aortic dissection, intimal flap motion may cause dynamic obstruction (Kim et al., 2023), leading to significant changes in hemodynamics. Simplifications in the inlet boundary condition, particularly the use of a plug profile, have also been shown to compromise the accuracy of wall hemodynamic predictions in the ascending aorta (Stokes et al., 2023a). Moreover, the Reynolds-averaged turbulence model adopted in this study (the standard k - ε model) may not adequately capture the transition between laminar and turbulent flow. Performing large-eddy simulations with finer meshes would enable the resolution of smaller-scale vortical structures and yield more accurate wall hemodynamic characteristics (Manchester et al., 2022; Cheng et al., 2025). Nevertheless, while these assumptions and simplifications may limit the absolute accuracy of the simulations, they do not undermine the demonstration that the proposed approach outperforms the traditional one.
Finally, the actual flow rate in a patient’s aortic branches is also regulated by the sympathetic nervous and endocrine systems (Leito-Rocha et al., 2012), which were not explicitly considered in this study. The sympathetic nervous system is known to regulate blood pressure by controlling peripheral resistance and cardiac output (Luo, 2003). In this study, different inlet pressures were assigned to the repaired and diseased aorta, implying that the effect of the sympathetic nervous system was, to some extent, implicitly considered. If physiological parameters such as blood pressure and cardiac output in the healthy state were available, the proposed method could be further refined. Additionally, future studies should validate the accuracy of the proposed method using clinically measured flow data, for example, obtained by four-dimensional flow magnetic resonance imaging (4D-Flow MRI), two-dimensional phase-contrast magnetic resonance imaging (2D PC-MRI), or Doppler ultrasound.
5 Conclusion
In summary, a novel framework has been developed to determine the flow division in aortic branches of patients with aortic diseases. This framework includes manual repair of diseased geometry and iterative steady-state CFD simulations to predict the target flow division for the lesional model. The predicted flow division is then used to estimate Windkessel model parameters for multi-scale simulations.
Applications in three patients demonstrated that the proposed method predicted a significant reduction in blood flow in stenotic branches, aligning more closely with physiological expectations. Furthermore, the method improved accuracy in reproducing blood pressure. Some differences in other hemodynamic metrics were observed between the two methods. Further studies are needed to validate the proposed method by comparing predicted aortic hemodynamic with clinically measured values.
Data availability statement
The original contributions presented in the study are included in the article/Supplementary Material, further inquiries can be directed to the corresponding authors.
Ethics statement
The studies involving humans were approved by the institutional review board of Union Hospital, Tongji Medical College, Huazhong University of Science and Technology. The studies were conducted in accordance with the local legislation and institutional requirements. The ethics committee/institutional review board waived the requirement of written informed consent for participation from the participants or the participants’ legal guardians/next of kin because the data involved in this study is retrospective and anonymized data was used.
Author contributions
MH: Formal Analysis, Methodology, Conceptualization, Writing – original draft, Investigation. MY: Methodology, Writing – original draft, Investigation, Formal Analysis. ZD: Formal Analysis, Methodology, Writing – review and editing, Investigation. SC: Writing – review and editing, Funding acquisition, Resources. XQ: Resources, Writing – review and editing. CZ: Writing – review and editing. YZ: Writing – review and editing. CY: Writing – review and editing, Funding acquisition, Methodology. YL: Supervision, Writing – review and editing, Methodology, Project administration, Funding acquisition.
Funding
The authors declare that financial support was received for the research and/or publication of this article. SC was supported by the Nature Science Foundation of Hubei Province (No.2023AFB1042), and the Interdisci-plinary Program of Wuhan National High Magnetic Field Center, Huazhong University of Science and Technology (No. WHMFC202102). CY and XQ were supported by the Key Research and Development Program of Hubei Province (No. 2022BCA024).
Conflict of interest
Authors MH, ZD, and CZ were employed by Boea Wisdom (Hangzhou) Network Technology Co., Ltd.
The remaining authors declare that the research was conducted in the absence of any commercial or financial relationships that could be construed as a potential conflict of interest.
Generative AI statement
The authors declare that no Generative AI was used in the creation of this manuscript.
Any alternative text (alt text) provided alongside figures in this article has been generated by Frontiers with the support of artificial intelligence and reasonable efforts have been made to ensure accuracy, including review by the authors wherever possible. If you identify any issues, please contact us.
Publisher’s note
All claims expressed in this article are solely those of the authors and do not necessarily represent those of their affiliated organizations, or those of the publisher, the editors and the reviewers. Any product that may be evaluated in this article, or claim that may be made by its manufacturer, is not guaranteed or endorsed by the publisher.
Supplementary material
The Supplementary Material for this article can be found online at: https://www.frontiersin.org/articles/10.3389/fbioe.2025.1640687/full#supplementary-material
References
Alimohammadi, M., Agu, O., Balabani, S., and Díaz-Zuccarini, V. (2014). Development of a patient-specific simulation tool to analyse aortic dissections: assessment of mixed patient-specific flow and pressure boundary conditions. Med. Eng. Phys. 36, 275–284. doi:10.1016/j.medengphy.2013.11.003
Armour, C. H., Guo, B., Saitta, S., Pirola, S., Liu, Y., Dong, Z., et al. (2022). Evaluation and verification of patient-specific modelling of type B aortic dissection. Comput. Biol. Med. 140, 105053. doi:10.1016/j.compbiomed.2021.105053
Arthurs, C. J., Xiao, N., Moireau, P., Schaeffter, T., and Figueroa, C. A. (2020). A flexible framework for sequential estimation of model parameters in computational hemodynamics. Adv. Model. Simul. Eng. Sci. 7, 48. doi:10.1186/s40323-020-00186-x
Azarine, A., Garçon, P., Stansal, A., Canepa, N., Angelopoulos, G., Silvera, S., et al. (2019). Four-dimensional flow MRI: principles and cardiovascular applications. RadioGraphics 39, 632–648. doi:10.1148/rg.2019180091
Bianchi, D., Monaldo, E., Gizzi, A., Marino, M., Filippi, S., and Vairo, G. (2017). A FSI computational framework for vascular physiopathology: a novel flow-tissue multiscale strategy. Med. Eng. Phys. 47, 25–37. doi:10.1016/j.medengphy.2017.06.028
Bonfanti, M., Balabani, S., Greenwood, J. P., Puppala, S., Homer-Vanniasinkam, S., and Díaz-Zuccarini, V. (2017). Computational tools for clinical support: a multi-scale compliant model for haemodynamic simulations in an aortic dissection based on multi-modal imaging data. J. R. Soc. Interface 14, 20170632. doi:10.1098/rsif.2017.0632
Bonfanti, M., Balabani, S., Alimohammadi, M., Agu, O., Homer-Vanniasinkam, S., and Díaz-Zuccarini, V. (2018). A simplified method to account for wall motion in patient-specific blood flow simulations of aortic dissection: Comparison with fluid-structure interaction. Med. Eng. Phys. 58, 72–79. doi:10.1016/j.medengphy.2018.04.014
Bonfanti, M., Franzetti, G., Maritati, G., Homer-Vanniasinkam, S., Balabani, S., and Díaz-Zuccarini, V. (2019). Patient-specific haemodynamic simulations of complex aortic dissections informed by commonly available clinical datasets. Med. Eng. Phys. 71, 45–55. doi:10.1016/j.medengphy.2019.06.012
Boyd, A. J., Kuhn, D. C. S., Lozowy, R. J., and Kulbisky, G. P. (2016). Low wall shear stress predominates at sites of abdominal aortic aneurysm rupture. J. Vasc. Surg. 63, 1613–1619. doi:10.1016/j.jvs.2015.01.040
Chen, D., Müller-Eschner, M., Kotelis, D., Böckler, D., Ventikos, Y., and von Tengg-Kobligk, H. (2013). A longitudinal study of Type-B aortic dissection and endovascular repair scenarios: computational analyses. Med. Eng. Phys. 35, 1321–1330. doi:10.1016/j.medengphy.2013.02.006
Cheng, Z., Riga, C., Chan, J., Hamady, M., Wood, N. B., Cheshire, N. J. W., et al. (2013). Initial findings and potential applicability of computational simulation of the aorta in acute type B dissection. J. Vasc. Surg. 57, 35S–43S. doi:10.1016/j.jvs.2012.07.061
Cheng, K., Akhtar, S., Lee, K. Y., and Lee, S.-W. (2025). Characteristics of transition to turbulence in a healthy thoracic aorta using large eddy simulation. Sci. Rep. 15, 3236. doi:10.1038/s41598-025-86983-z
Chnafa, C., Brina, O., Pereira, V. M., and Steinman, D. A. (2018). Better than nothing: a rational approach for minimizing the impact of outflow strategy on cerebrovascular simulations. AJNR Am. J. Neuroradiol. 39, 337–343. doi:10.3174/ajnr.A5484
Chung, J. (2005). New computational modeling and fluid mechanical approaches to vascular assistance. New Jersey, United States: Rutgers The State University of New Jersey - New Brunswick and University of Medicine and Dentistry of New Jersey. Available online at: https://www.proquest.com/dissertations-theses/new-computational-modeling-fluid-mechanical/docview/305374023/se-2?accountid=26785.
Dillon-Murphy, D., Noorani, A., Nordsletten, D., and Figueroa, C. A. (2016). Multi-modality image-based computational analysis of haemodynamics in aortic dissection. Biomech. Model Mechanobiol. 15, 857–876. doi:10.1007/s10237-015-0729-2
Ding, Z., Liu, Q., Luo, H., Yang, M., Zhang, Y., Wang, S., et al. (2024). A preoperative planning procedure of septal myectomy for hypertrophic obstructive cardiomyopathy using image-based computational fluid dynamics simulations and shape optimization. Sci. Rep. 14, 24617. doi:10.1038/s41598-024-74091-3
Ene, F., Delassus, P., and Morris, L. (2014). The influence of computational assumptions on analysing abdominal aortic aneurysm haemodynamics. Proc. Inst. Mech. Eng. H. 228, 768–780. doi:10.1177/0954411914546122
Etli, M., Canbolat, G., Karahan, O., and Koru, M. (2021). Numerical investigation of patient-specific thoracic aortic aneurysms and comparison with normal subject via computational fluid dynamics (CFD). Med. Biol. Eng. Comput. 59, 71–84. doi:10.1007/s11517-020-02287-6
Ford, M. D., Hoi, Y., Piccinelli, M., Antiga, L., and Steinman, D. A. (2009). An objective approach to digital removal of saccular aneurysms: technique and applications. Br. J. Radiol. 82 (Spec No 1), S55–S61. doi:10.1259/bjr/67593727
Gallo, D., Steinman, D. A., Bijari, P. B., and Morbiducci, U. (2012). Helical flow in carotid bifurcation as surrogate marker of exposure to disturbed shear. J. Biomechanics 45, 2398–2404. doi:10.1016/j.jbiomech.2012.07.007
Gallo, D., Lefieux, A., Morganti, S., Veneziani, A., Reali, A., Auricchio, F., et al. (2016). A patient-specific follow up study of the impact of thoracic endovascular repair (TEVAR) on aortic anatomy and on post-operative hemodynamics. Comput. Fluids 141, 54–61. doi:10.1016/j.compfluid.2016.04.025
Hatzidakis, A., Krokidis, M., Androulakakis, Z., and Rossi, M. (2015). Percutaneous stenting of a dissected superior mesenteric artery in a patient with previous surgical repair of stanford type A aortic dissection. Hippokratia 19, 270–273.
Hohri, Y., Numata, S., Itatani, K., Kanda, K., Yamazaki, S., Inoue, T., et al. (2021). Prediction for future occurrence of type A aortic dissection using computational fluid dynamics. Eur. J. Cardiothorac. Surg. 60, 384–391. doi:10.1093/ejcts/ezab094
Hu, M., Chen, B., and Luo, Y. (2025). Computational fluid dynamics modelling of hemodynamics in aortic aneurysm and dissection: a review. Front. Bioeng. Biotechnol. 13, 1556091. doi:10.3389/fbioe.2025.1556091
Huang, Z., Zeng, M., Tao, W. G., Zeng, F. Y., Chen, C. Q., Zhang, L. B., et al. (2020). A hemodynamic mechanism correlating with the initiation of MCA bifurcation aneurysms. AJNR Am. J. Neuroradiol. 41, 1217–1224. doi:10.3174/ajnr.A6615
Ismail, M., Wall, W. A., and Gee, M. W. (2013). Adjoint-based inverse analysis of windkessel parameters for patient-specific vascular models. J. Comput. Phys. 244, 113–130. doi:10.1016/j.jcp.2012.10.028
Je, M., and Dn, K. (1994). Pulsatile velocity measurements in a model of the human abdominal aorta under simulated exercise and postprandial conditions. J. biomechanical Eng. 116, 107–111. doi:10.1115/1.2895692
Jiang, P., Liu, Q., Wu, J., Chen, X., Li, M., Li, Z., et al. (2019). Hemodynamic characteristics associated with thinner regions of intracranial aneurysm wall. J. Clin. Neurosci. 67, 185–190. doi:10.1016/j.jocn.2019.06.024
Kim, T., van Bakel, P. A. J., Nama, N., Burris, N., Patel, H. J., Williams, D. M., et al. (2023). A computational study of dynamic obstruction in type B aortic dissection. J. Biomech. Eng. 145, 031008. doi:10.1115/1.4056355
Laskey, W. K., Parker, H. G., Ferrari, V. A., Kussmaul, W. G., and Noordergraaf, A. (1990). Estimation of total systemic arterial compliance in humans. J. Appl. Physiology 69, 112–119. doi:10.1152/jappl.1990.69.1.112
Leito-Rocha, A., Beatriz, J., and Diniz, C. (2012). Adenosinergic system in the mesenteric vessels. In: D. Gaze, editor. The cardiovascular system - Physiology, diagnostics and clinical implications. Closter: InTech. doi:10.5772/38534
Les, A. S., Shadden, S. C., Figueroa, C. A., Park, J. M., Tedesco, M. M., Herfkens, R. J., et al. (2010). Quantification of hemodynamics in abdominal aortic aneurysms during rest and exercise using magnetic resonance imaging and computational fluid dynamics. Ann. Biomed. Eng. 38, 1288–1313. doi:10.1007/s10439-010-9949-x
Li, Z., and Mao, W. (2023). A fast approach to estimating windkessel model parameters for patient-specific multi-scale CFD simulations of aortic flow. Comput. Fluids 259, 105894. doi:10.1016/j.compfluid.2023.105894
Li, D., Wang, J., Zeng, W., Zeng, X., Liu, Z., Cao, H., et al. (2023). The loss of helical flow in the thoracic aorta might be an identifying marker for the risk of acute type B aortic dissection. Comput. Methods Programs Biomed. 230, 107331. doi:10.1016/j.cmpb.2022.107331
Liu, Z., Brin, K. P., and Yin, F. C. (1986). Estimation of total arterial compliance: an improved method and evaluation of current methods. Am J Physiol 251, H588, H600. doi:10.1152/ajpheart.1986.251.3.H588
Liu, J. L., Qian, Y., Itatani, K., Miyakoshi, T., Murakami, A., Ono, M., et al. (2012). An approach of computational hemodynamics for cardiovascular flow simulation. Proceedings of the ASME-JSME-KSME 2011 Joint Fluids Engineering Conference. ASME-JSME-KSME 2011 Joint Fluids Engineering Conference: Volume 1, Symposia - Parts A, B, C, and D, 1449–1456. doi:10.1115/AJK2011-03057
Liu, Y., Li, W., Ding, Z., Tang, Z., Luo, Y., and Hu, J. (2025). Long-term longitudinal computational study of a Marfan syndrome patient after hybrid repair of aortic arch dissection with parallel stent-grafts. Int. J. Numer. Methods Biomed. Eng. 41, e70018. doi:10.1002/cnm.70018
Long Ko, J. K., Liu, R. W., Ma, D., Shi, L., Ho Yu, S. C., and Wang, D. (2017). Pulsatile hemodynamics in patient-specific thoracic aortic dissection models constructed from computed tomography angiography. J. Xray Sci. Technol. 25, 233–245. doi:10.3233/XST-17256
Luo, M. (2003). Alterations of sympathetic neuroeffector mechanisms and the underlying local modulatory mechenisms associated with mesenteric arteries and veins in deoxycorticosterone acetate (DOCA)-salt hypertensive rats. East Lansing, MI: Michigan State University. doi:10.25335/5XSR-C087
Manchester, E. L., Pirola, S., Salmasi, M. Y., O’Regan, D. P., Athanasiou, T., and Xu, X. Y. (2022). Evaluation of computational methodologies for accurate prediction of wall shear stress and turbulence parameters in a patient-specific aorta. Front. Bioeng. Biotechnol. 10, 836611. doi:10.3389/fbioe.2022.836611
Mantha, A., Karmonik, C., Benndorf, G., Strother, C., and Metcalfe, R. (2006). Hemodynamics in a cerebral artery before and after the formation of an aneurysm. AJNR Am. J. Neuroradiol. 27, 1113–1118.
Menon, K., Hu, Z., and Marsden, A. L. (2024). Cardiovascular fluid dynamics: a journey through our circulation. Flow 4, E7. doi:10.1017/flo.2024.5
Mensah, G. A., Roth, G. A., and Fuster, V. (2019). The global burden of cardiovascular diseases and risk factors: 2020 and beyond. J. Am. Coll. Cardiol. 74, 2529–2532. doi:10.1016/j.jacc.2019.10.009
Moore, J. E., and Ku, D. N. (1994). Pulsatile velocity measurements in a model of the human abdominal aorta under resting conditions. J. Biomechanical Eng. 116, 337–346. doi:10.1115/1.2895740
Moukalled, F., Mangani, L., and Darwish, M. (2016). The finite volume method in computational fluid dynamics: an advanced introduction with OpenFOAM® and Matlab. Cham: Springer International Publishing. doi:10.1007/978-3-319-16874-6
Naim, W. N. W. A., Ganesan, P. B., Sun, Z., Liew, Y. M., Qian, Y., Lee, C.-J., et al. (2016). Prediction of thrombus formation using vortical structures presentation in stanford type B aortic dissection: a preliminary study using CFD approach. Appl. Math. Model. 40, 3115–3127. doi:10.1016/j.apm.2015.09.096
Pant, S., Fabrèges, B., Gerbeau, J., and Vignon-Clementel, I. E. (2014). A methodological paradigm for patient-specific multi-scale CFD simulations: from clinical measurements to parameter estimates for individual analysis. Numer. Methods Biomed. Eng. 30, 1614–1648. doi:10.1002/cnm.2692
Paritala, P. K., Anbananthan, H., Hautaniemi, J., Smith, M., George, A., Allenby, M., et al. (2023). Reproducibility of the computational fluid dynamic analysis of a cerebral aneurysm monitored over a decade. Sci. Rep. 13, 219. doi:10.1038/s41598-022-27354-w
Peng, L., Qiu, Y., Yang, Z., Yuan, D., Dai, C., Li, D., et al. (2019). Patient-specific computational hemodynamic analysis for interrupted aortic arch in an adult: implications for aortic dissection initiation. Sci. Rep. 9, 8600. doi:10.1038/s41598-019-45097-z
Poelma, C., Watton, P. N., and Ventikos, Y. (2015). Transitional flow in aneurysms and the computation of haemodynamic parameters. J. R. Soc. Interface 12, 20141394. doi:10.1098/rsif.2014.1394
Spilker, R. L., and Taylor, C. A. (2010). Tuning multidomain hemodynamic simulations to match physiological measurements. Ann. Biomed. Eng. 38, 2635–2648. doi:10.1007/s10439-010-0011-9
Stergiopulos, N., Segers, P., and Westerhof, N. (1999a). Use of pulse pressure method for estimating total arterial compliance in vivo. Am. J. Physiology Heart Circulatory Physiology 276, H424–H428. doi:10.1152/ajpheart.1999.276.2.H424
Stergiopulos, N., Westerhof, B. E., and Westerhof, N. (1999b). Total arterial inertance as the fourth element of the windkessel model. Am. J. Physiology-Heart Circulatory Physiology 276, H81–H88. doi:10.1152/ajpheart.1999.276.1.H81
Sterpetti, A. V., Gabriele, R., Sapienza, P., Marzo, L. D., and Borrelli, V. (2024). Mortality and burden related with aortic aneurysms and dissections. The importance of information and education. Curr. Problems Cardiol. 49, 102384. doi:10.1016/j.cpcardiol.2024.102384
Stokes, C., Bonfanti, M., Li, Z., Xiong, J., Chen, D., Balabani, S., et al. (2021). A novel MRI-based data fusion methodology for efficient, personalised, compliant simulations of aortic haemodynamics. J. Biomechanics 129, 110793. doi:10.1016/j.jbiomech.2021.110793
Stokes, C., Ahmed, D., Lind, N., Haupt, F., Becker, D., Hamilton, J., et al. (2023a). Aneurysmal growth in type-B aortic dissection: assessing the impact of patient-specific inlet conditions on key haemodynamic indices. J. R. Soc. Interface 20, 20230281. doi:10.1098/rsif.2023.0281
Stokes, C., Haupt, F., Becker, D., Muthurangu, V., von Tengg-Kobligk, H., Balabani, S., et al. (2023b). The influence of minor aortic branches in patient-specific flow simulations of Type-B aortic dissection. Ann. Biomed. Eng. 51, 1627–1644. doi:10.1007/s10439-023-03175-4
Suzuki, T., Takao, H., Suzuki, T., Kambayashi, Y., Watanabe, M., Sakamoto, H., et al. (2016). Determining the presence of thin-walled regions at high-pressure areas in unruptured cerebral aneurysms by using computational fluid dynamics. Neurosurgery 79, 589–595. doi:10.1227/NEU.0000000000001232
Taylor, C. A., and Figueroa, C. A. (2009). Patient-specific modeling of cardiovascular mechanics. Annu. Rev. Biomed. Eng. 11, 109–134. doi:10.1146/annurev.bioeng.10.061807.160521
Teng, B., Zhou, Z., Zhao, Y., and Wang, Z. (2022). Combined curvature and wall shear stress analysis of abdominal aortic aneurysm: an analysis of rupture risk factors. Cardiovasc Interv. Radiol. 45, 752–760. doi:10.1007/s00270-022-03140-z
Toorop, G. P., Westerhof, N., and Elzinga, G. (1987). Beat-to-beat estimation of peripheral resistance and arterial compliance during pressure transients. Am. J. Physiology-Heart Circulatory Physiology 252, H1275–H1283. doi:10.1152/ajpheart.1987.252.6.H1275
Tricarico, R., Berceli, S. A., Tran-Son-Tay, R., and He, Y. (2023). Non-invasive estimation of the parameters of a three-element windkessel model of aortic arch arteries in patients undergoing thoracic endovascular aortic repair. Front. Bioeng. Biotechnol. 11, 1127855. doi:10.3389/fbioe.2023.1127855
Tse, K. M., Chiu, P., Lee, H. P., and Ho, P. (2011). Investigation of hemodynamics in the development of dissecting aneurysm within patient-specific dissecting aneurismal aortas using computational fluid dynamics (CFD) simulations. J. Biomechanics 44, 827–836. doi:10.1016/j.jbiomech.2010.12.014
Wen, J., Huang, H., Su, Z., Jiang, L., Gao, Q., Chen, X., et al. (2023). Predicting the risk of type B aortic dissection using hemodynamic parameters in aortic arches: a comparative study between healthy and repaired aortas. Comput. Methods Programs Biomed. 230, 107326. doi:10.1016/j.cmpb.2022.107326
Westerhof, N., Elzinga, G., and Sipkema, P. (1971). An artificial arterial system for pumping hearts. J. Appl. Physiology 31, 776–781. doi:10.1152/jappl.1971.31.5.776
Xiao, N., Alastruey, J., and Alberto Figueroa, C. (2014). A systematic comparison between 1-D and 3-D hemodynamics in compliant arterial models. Int. J. Numer. Methods Biomed. Eng. 30, 204–231. doi:10.1002/cnm.2598
Xu, H., Piccinelli, M., Leshnower, B. G., Lefieux, A., Taylor, W. R., and Veneziani, A. (2018). Coupled morphological-hemodynamic computational analysis of type B aortic dissection: a longitudinal study. Ann. Biomed. Eng. 46, 927–939. doi:10.1007/s10439-018-2012-z
Xu, H., Xiong, J., Han, X., Mei, Y., Shi, Y., Wang, D., et al. (2021). Computed tomography-based hemodynamic index for aortic dissection. J. Thorac. Cardiovasc. Surg. 162, e165–e176. doi:10.1016/j.jtcvs.2020.02.034
Yamashiro, S., Kuniyoshi, Y., Miyagi, K., Shiumoji, M., Uezu, T., Arakaki, K., et al. (2002). Successful management in the case of mesenteric ischemia complicated with acute type a dissection, Ann. Thorac. Cardiovasc. Surg. 8, 231–235.
Yi, H., Yang, Z., Bramlage, L., and Ludwig, B. (2023). Pathophysiology of intracranial aneurysms in monozygotic twins: a rare case study from hemodynamic perspectives. Comput. Biol. Med. 163, 107198. doi:10.1016/j.compbiomed.2023.107198
Youssefi, P., Gomez, A., Arthurs, C., Sharma, R., Jahangiri, M., and Alberto Figueroa, C. (2018). Impact of patient-specific inflow velocity profile on hemodynamics of the thoracic aorta. J. Biomech. Eng. 140, 011002. doi:10.1115/1.4037857
Zambrano, B. A., Gharahi, H., Lim, C., Jaberi, F. A., Choi, J., Lee, W., et al. (2016). Association of intraluminal thrombus, hemodynamic forces, and abdominal aortic aneurysm expansion using longitudinal CT images. Ann. Biomed. Eng. 44, 1502–1514. doi:10.1007/s10439-015-1461-x
Keywords: hemodynamics, windkessel model, aortic diseases, CFD, boudary condition
Citation: Hu M, Yang M, Ding Z, Chen S, Qi X, Zhu C, Zhang Y, Yang C and Luo Y (2025) Estimating flow division in aortic branches of diseased aorta: a method for boundary condition specification in CFD analysis. Front. Bioeng. Biotechnol. 13:1640687. doi: 10.3389/fbioe.2025.1640687
Received: 04 June 2025; Accepted: 30 October 2025;
Published: 13 November 2025.
Edited by:
Leonid Goubergrits, Charité - Universitätsmedizin Berlin, GermanyReviewed by:
Omid Amili, University of Toledo, United StatesAlin Totorean, Politehnica University Timisoara, Romania
Copyright © 2025 Hu, Yang, Ding, Chen, Qi, Zhu, Zhang, Yang and Luo. This is an open-access article distributed under the terms of the Creative Commons Attribution License (CC BY). The use, distribution or reproduction in other forums is permitted, provided the original author(s) and the copyright owner(s) are credited and that the original publication in this journal is cited, in accordance with accepted academic practice. No use, distribution or reproduction is permitted which does not comply with these terms.
*Correspondence: Chao Yang, eWNoYW9AaHVzdC5lZHUuY24=; Yuanming Luo, eXVhbm1sdW9AdWlvd2EuZWR1
†These authors have contributed equally to this work