 Zerihun G. Workineh
 Estefano Muñoz-Moya
 Carlos Ruiz Wills
 Dimitrios Lialios2
 Jérôme Noailly
- 1BCN MedTech, Department of Engineering, Universitat Pompeu Fabra, Barcelona, Spain
- 2Department of Computer Applications in Science and Engineering (CASE), Barcelona Supercomputing Center, Barcelona, Spain
Introduction: Intervertebral disc (IVD) degeneration is a primary contributor to low back pain, with nutritional stress due to the IVD’s avascularity recognized as a key factor. Solute transport within the disc relies predominantly on diffusion, which is governed by tissue morphology and mechanical deformation. However, the interplay between disc geometry, poro-mechanical strain, diffusion, and degeneration remains incompletely characterized. Previous specimen-specific models have captured inter-subject variability in metabolite transport, but the isolated effects of disc height and degeneration-dependent material composition have not been systematically assessed. Moreover, although strain-dependent diffusion coefficients are commonly modeled as porosity functions, the role of intra-element diffusivity gradients
Methods: The present study focuses on poro-mechanical finite element (FE) models of three patient-personalized L4-L5 lumbar IVD geometries, representing varying heights categorized as thin, medium, and tall IVDs. Three days of physiological mechanical load cycles, comprising 8 hours of rest and 16 hours of activity, were simulated, under both ’healthy’ (Pfirrmann grade 1) and degenerated (Pfirrmann grade 3) tissue conditions.
Results: Simulation outcomes demonstrated that a one-third reduction in disc height (relative to medium height) led to
Discussion: These findings underscore the predominant influence of disc geometry and matrix composition on IVD metabolic homeostasis, suggesting limited relevance of the
1 Introduction
The intervertebral disc (IVD) is the largest avascular structure in the human body (Ross Bournemouth, 1931; Humzah and Soames, 1988; Shapiro and Risbud, 2016), contributing significantly to spinal flexibility, load resistance, and distribution along the vertebral column (Humzah and Soames, 1988; Coventry et al., 1945; Newell et al., 2017). It comprises three primary local regions: the nucleus pulposus (NP), annulus fibrosus (AF), and cartilaginous endplates (CEP) (Urban et al., 2000; Ghosh, 2019; Crump et al., 2023). Each region exhibits unique structural, biochemical, and mechanical properties, essential for the disc’s function.
The NP is a gelatinous core predominantly composed of water (approximately 80% by volume), proteoglycans (PGs), and collagen type II (Iatridis et al., 1996; Nedresky et al., 2023; Antoniou et al., 1996; Roughley, 2004). PGs attract and retain water through their negatively charged glycosaminoglycan side chains, which allows the NP to sustain high swelling pressures (Urban and McMullin, 1988). This hydration facilitates the generation of hydrostatic pressure under axial loading, enabling the disc to resist compressive loads and maintain disc height (Urban et al., 2000; McMorran and Gregory, 2021; Molladavoodi et al., 2020). Between the NP and AF lies the transition zone (TZ), a region with mixed characteristics that blends the high PG content of the NP with the increasing collagen content of the AF (Sher et al., 2017). This zone provides a biomechanical and biochemical gradient that contributes to load transfer and helps distribute stress across the NP–AF boundary. The AF surrounds the NP and consists of approximately 15–25 concentric lamellae composed primarily of collagen type I fibers, embedded in a fibrocartilaginous matrix. These fibers are organized in an angle-ply configuration, with alternating fiber orientations in adjacent lamellae, allowing the AF to withstand tensile, shear, and torsional stresses. This structural organization enables the AF to provide mechanical stability, transmit loads, and constrain NP expansion during spinal motion (Ghosh, 2019; McMorran and Gregory, 2021; Molladavoodi et al., 2020; Aladin et al., 2010). The CEP is a thin layer of hyaline cartilage situated at the interface between the IVD and the adjacent vertebral bodies. It serves multiple functions: it anchors the disc to the vertebrae, protects the NP and inner AF from direct mechanical loading, and acts as the primary gateway for nutrient and waste exchange via diffusion from the vertebral capillary beds. Due to the avascular nature of the IVD, the CEP plays a pivotal role in regulating solute transport into the disc (Crump et al., 2023; Wong et al., 2019; Malandrino et al., 2014a; Wu et al., 2021; Buchweitz et al., 2024).
Given the IVD’s avascularity, nutrient transport occurs primarily through diffusion (Katz et al., 1986; Ranganathan et al., 2009; Urban et al., 1977), with the CEP acting as the main conduit for solutes such as oxygen and glucose. These nutrients are essential to sustain disc cell metabolism, and their deficiency has been linked to disc degeneration (Holm et al., 1981; Ishihara and Urban, 1999; Zhu et al., 2012; Bartels et al., 1998; Huang et al., 2014; Jünger et al., 2009; Bibby and Urban, 2004). Inadequate removal of metabolic byproducts, such as lactate, contributes to acidosis and promotes catabolic signaling pathways, thereby exacerbating degeneration (Horner, 2001; Urban, 2002; Bibby and Urban, 2004; Sivan et al., 2014).
While experimental studies have significantly advanced our understanding of IVD physiology and biomechanics, computational modeling has become an indispensable complementary tool. Experimental approaches are often constrained in terms of spatial resolution, repeatability, and the ability to investigate long-term effects or systematically vary patient-personalized (PP) geometries and loading regimes. Computational simulations allow for the controlled exploration of complex biomechanical and biochemical interactions that are difficult to isolate in laboratory settings (Clouthier et al., 2015; Alini et al., 2008; Howard and Masuda, 2006). Finite element (FE) models, in particular, allow for the integration of poromechanical behavior, anisotropic structural features, metabolic reactions, and physiologically relevant mechanical loads (Malandrino et al., 2015a; Gu et al., 2014; Wills et al., 2016; Muñoz-Moya et al., 2024; Lialios et al., 2025). Prior FE studies have examined key parameters influencing nutrient transport, including diffusion path length (Malandrino et al., 2015b), mechanical deformation (Malandrino et al., 2011), solute boundary conditions (Malandrino et al., 2014b), ultrastructural organization (Jackson et al., 2012), osmotic pressurization (Malandrino et al., 2011), and compositional degeneration (Wills et al., 2016; Ruiz Wills et al., 2018).
Organ morphology is now recognized as a critical determinant of nutrient transport efficiency in the IVD. Numerous experimental and computational studies have demonstrated that geometry, particularly disc height and shape, influences diffusion paths and deformation-induced alterations in porosity (Horner, 2001; Urban et al., 1977; Zhu et al., 2012; Jackson et al., 2011; Muñoz-Moya et al., 2024). Tall discs tend to experience nutrient deficiencies due to increased diffusion distances and elevated compressive strain (Malandrino et al., 2015b; Zhu et al., 2012; Muñoz-Moya et al., 2024), contributing to spatial heterogeneity in solute distribution and metabolic stress.
Despite this understanding, a comprehensive investigation of the combined effect of varying degeneration-dependent parameters in composition-dependent constitutive models, along with varying PP IVD geometries, remains pending. Previous computational modeling has either simplified material models for PP geometries or applied advanced constitutive models to generic disc geometries (Malandrino et al., 2014b; Malandrino et al., 2015b; Wills et al., 2016). Furthermore, earlier studies have often lacked systematic, region-specific quantification of solute concentrations across local zones, varying tissue conditions, and physiologically relevant mechanical loading cycles. In addition, the potential influence of strain-induced diffusivity gradients, represented by
As we hypothesize that IVD morphology contributes to the risk of initiating or accelerating IVD degeneration, we investigate the interplays among disc morphology, local cell nutrition, nutrition-related cell viability, and degeneration-associated tissue properties. We further develop a new formulation, compatible with state-of-the-art FE solvers that lack multiphysics coupling capabilities, to explore possible biases depending on whether solute transport and mechanical couplings ignore the emergence of strain-induced diffusivity gradients
2 Materials and methods
Poro-mechanical Finite Element (FE) models of three different patient-personalized (PP) L4-L5 lumbar IVD models with middle heights of 9 mm (thin), 12 mm (medium), and 16 mm (tall) were considered (Table 1). These three models were selected because they met the degeneration grade threshold (
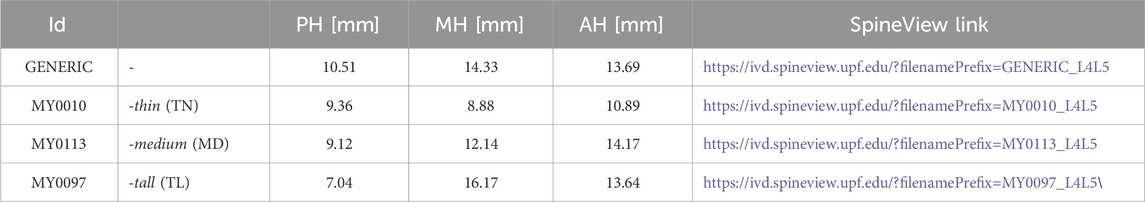
Table 1. Patient-Personalized L4-L5 IVD models, obtained through a morphing process (Muñoz-Moya et al., 2023; Muñoz-Moya et al., 2024), with different morphological factors. Posterior height: PH; Middle height: MH; Anterior height: AH.
As the IVD model geometries (Figure 1A) were chosen based on mid-height (MH), care was taken to avoid geometries of discs with Pfirrmann degeneration grades higher than grade III. Mechanical models for each morphology (Figures 1B,C) were coupled with a reactive oxygen, glucose, and lactate transport model, and with a corresponding cell viability model (Figure 1D). All simulations were performed using ABAQUS 2023 (Simulia, Providence, RI, United States). The initial nutrient fields of the three models were taken from our Generic model (Table 1) after 3-simulated days of nutrient transport, when it was seen that the metabolic field reached the steady state (Malandrino et al., 2014a; Malandrino et al., 2014b). In this way, all the models begin with the same concentrations in a healthy state, allowing for easy comparison across morphology and material properties.
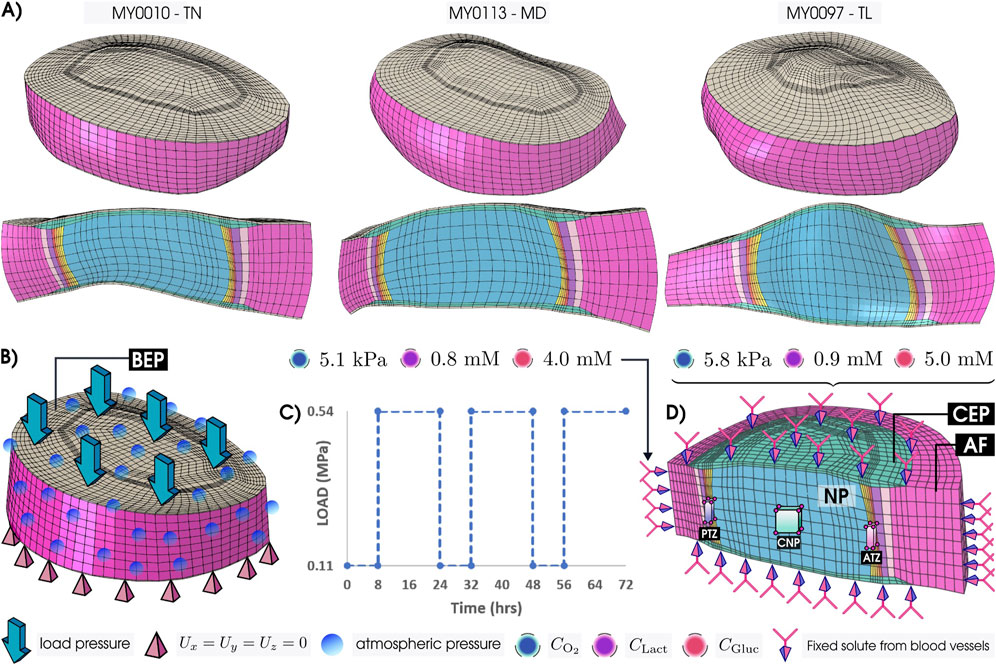
Figure 1. (A) Patient-Personalized L4-L5 lumbar IVD models—Thin (TN), Medium (MD), and Tall (TL)—and their sagittal views. (B) IVD model under compressive mechanical load on the bony endplate (BEP). (C) Mechanical loading variation with time for three consecutive days. (D) Coupled nutrient transport and cell viability model with the fixed solute concentrations—oxygen
The selection of target locations—posterior transition zone (PTZ), center of the nucleus pulposus (CNP), and anterior transition zone (ATZ)—aimed to capture solute distribution across spatially distinct regions of the IVD. This choice enables comparison of transport behavior along the antero-posterior axis. Among these, the ATZ has been specifically identified as prone to early degeneration, as shown by clinical imaging in Sher et al. (2017), making it particularly relevant for degeneration-focused analysis. To ensure consistency with previous regional assessments, we selected 27 nodes from eight elements per region, following Muñoz-Moya et al. (2024) (Figure 1), supported by a common mesh structure in all geometrical models, i.e., same mesh topology. The results presented in the manuscript reflect average values across these selected nodes. Additionally, to broaden the assessment beyond PTZ, CNP, and ATZ, we extended the analysis to circumferential paths along the outer surfaces of the NP and transition zone. This approach enables the identification of nutrient-depleted regions and the assessment of how far such areas extend both radially and tangentially across the disc.
The geometrical bounds of the transition zone were determined based on both computational and structural considerations. Initially, this region was introduced in our FE model to ensure mesh convergence and mitigate the fluid flow oscillations generated by weak discontinuities at the interface between the NP and the AF elements (Ruiz et al., 2013). The transition zone, as implemented in our model, thus emerged as a necessary computational feature to maintain numerical stability. However, this region, which had emerged from a need for numerical stabilization, ultimately resulted in a sound definition of a local tissue region, as several studies using quantitative MRI, synchrotron imaging, and compositional analyses had demonstrated the presence of a structurally distinct transition zone between the NP and AF (Bruehlmann et al., 2002; Marchand and Ahmed, 1990; Disney et al., 2022).
The sequential numerical scheme employed by Malandrino et al. (2011), Malandrino et al. (2014b) has been adopted in this study. This implementation integrates a poro-mechanical model with transport FE models, capturing the complex interplay of metabolic reactions within the intervertebral disc. Each solute transport model leverages the deformation history from the poro-mechanical model to dynamically update concentration gradients over time. At each time step, the transport models are solved sequentially, incorporating a cell viability model that adjusts cell density and, in turn, modulates solute consumption and production. For a more detailed illustration of this framework, please refer to the schematic diagram presented in Supplementary Section S1 (Numerical Implementation) of the Supplementary Information.
2.1 Constitutive modeling of the IVD
2.1.1 Mechanical model
The constitutive models of the NP, AF, and CEP tissues combined the poro-mechanical interactions among: a hyperelastic porous matrix; intra- and extra-fibrillar interstitial fluid; a Donnan osmotic pressure; viscoelastic collagen fibers (Wills et al., 2016; Schroeder et al., 2007; Cortes et al., 2014). The total stress tensor (Equation 1),
where,
where
Where,
with
where
Key Pfirrmann grade-dependent parameter values for ‘healthy’ state, corresponding to Pfirrmann grade I (GR1), and a degenerated state, corresponding to Pfirrmann grade III (GR3), includes initial water content, shear modulus, fixed charge density, collagen content, and others, are adopted from the references Wills et al. (2016); Barthelemy et al. (2016) and are detailed in Table 2 for all tissues considered.
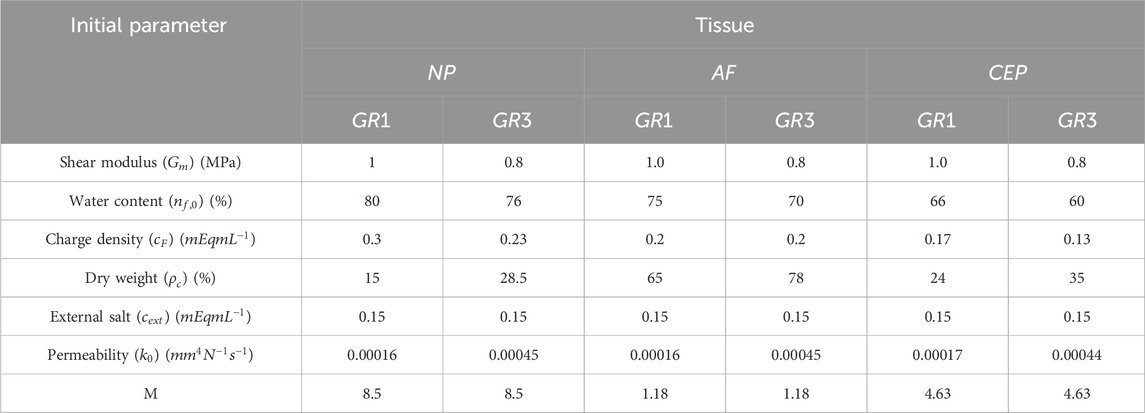
Table 2. Summary of key parameters employed in the simulation for GR1 and GR3 material properties across all three tissue types (Wills et al., 2016; Ruiz Wills et al., 2018; Malandrino et al., 2011; Barthelemy et al., 2016).
2.1.2 Solute transport model
Reactive solute transport model, which is coupled to tissue deformation and osmosis, has been modelled by a reaction-diffusion equation as:
with,
where,
Equation 10 highlights that reactive diffusion of a solute depends not only on its diffusivity but also on the gradient of diffusivity. This contrasts with previous implementations in ABAQUS, where heat transfer elements were employed to simulate diffusive transport (Ferguson et al., 2004; Galbusera et al., 2013; Malandrino et al., 2011; Malandrino et al., 2014b; Malandrino et al., 2014a; Malandrino et al., 2015b). As noted earlier, the heat transfer elements typically utilized in solvers like ABAQUS lack built-in capabilities to calculate the spatial derivatives of strain-dependent diffusivity. Consequently,
The derivation of the spatial gradient of the effective diffusivity
The three free water diffusivity values
Substituting Equation 13 into Equation 12, Equation 14 is obtained:
Considering the gradient (Equation 15) in the current configuration,
The second mixed partial derivative of the shape functions (Equation 16) requires the pull-back of contravariant indices to express it in terms of the current
The second derivative of the shape functions (Equation 17) with respect to the reference coordinates is computed via the chain rule as:
The mapping from the isoparametric
We can compute the second derivatives (Equation 19) entirely in reference coordinates:
Here,
The metabolic reaction term
and
Here,
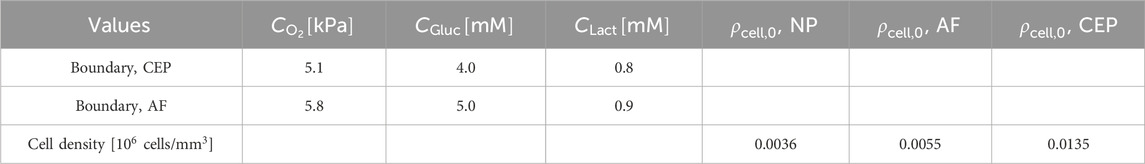
Table 3. Boundary concentration values (graphically represented in Figure 1) and initial cell densities
2.1.3 Cell viability
The rates of consumption-sink (
Where
where
2.2 Model verification
To verify our cell viability model (Equation 23) coupled with our diffusion-reaction model (Equation 10), a diffusion chamber was simulated following experimental tests on bovine nucleus cell viability (Horner, 2001). A 26 mm width diffusion chamber filled with cells embedded in 1% agarose gel was modeled. Diffusivities of oxygen, glucose, and lactate in water were modified to account for gel porosity of
2.3 Data analysis
2.3.1 Effect of diffusivity gradient
To evaluate the influence of a spatial gradient in diffusivity
where
2.3.2 Spatio-temporal distribution of solutes under varying material properties
The spatial distribution and temporal evolution of solute concentrations were analyzed using a set of quantitative approaches designed to assess the effects of material property variation. Specifically, the analysis considered two distinct sets of material properties representing different disc conditions: a healthy disc modeled as Pfirrmann grade I (GR1), and a degenerated disc modeled as Pfirrmann grade III (GR3). To characterize regional solute dynamics, we first examined spatial and temporal variations over a 72-h simulation period across three locally distinct regions. In each region, solute concentrations were averaged over 27 nodes sampled from eight mesh elements to maintain consistent spatial resolution across all models (Figure 1). To isolate the influence of tissue degeneration, the relative change in solute concentration between GR3 and GR1 conditions was quantified as:
where
While most degeneration studies focus on central or posterior disc regions (Muñoz-Moya et al., 2024), the lateral circumference of the disc has been comparatively underexplored. To assess this area, we extended our analysis by slicing the disc in a mid-transverse plane
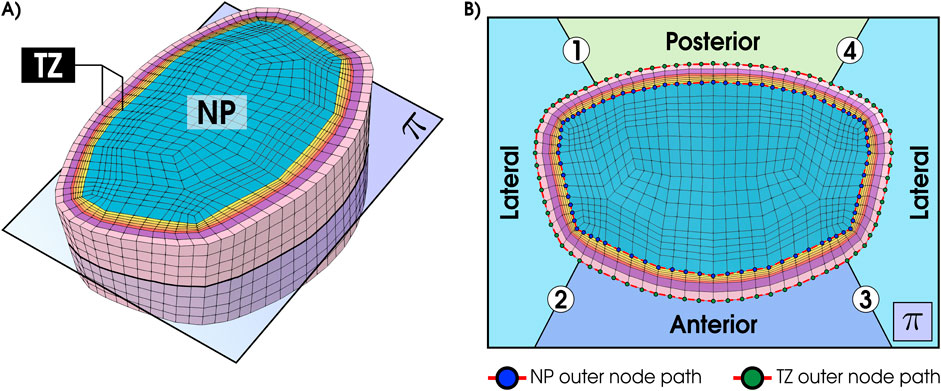
Figure 2. (A) Mid-transverse plane
2.3.3 Effect of mid-height (MH)
The influence of IVD height variations on solute concentrations, was analyzed through direct comparison of solute concentrations across different morphologies (Table 1) under specific material properties. To quantitatively assess the influence of mid-height, we computed the relative deviation of solute concentrations from the mean value across the three IVD geometries using the following expression:
where
3 Results
3.1 Metabolic transport-cell viability verification: diffusion chamber simulation
The heatmap of cell viability (Figure 3a) within the diffusion chamber model reveals the spatial drop of cell viability, from the culture medium boundaries, to the center of the chamber. Notably, the temporal series of the spatial cell viability profiles, after 3 (Figure 3b) and 11 days (Figure 3c) of simulated diffusion, matched well the experimental results, especially at 4 million cells per
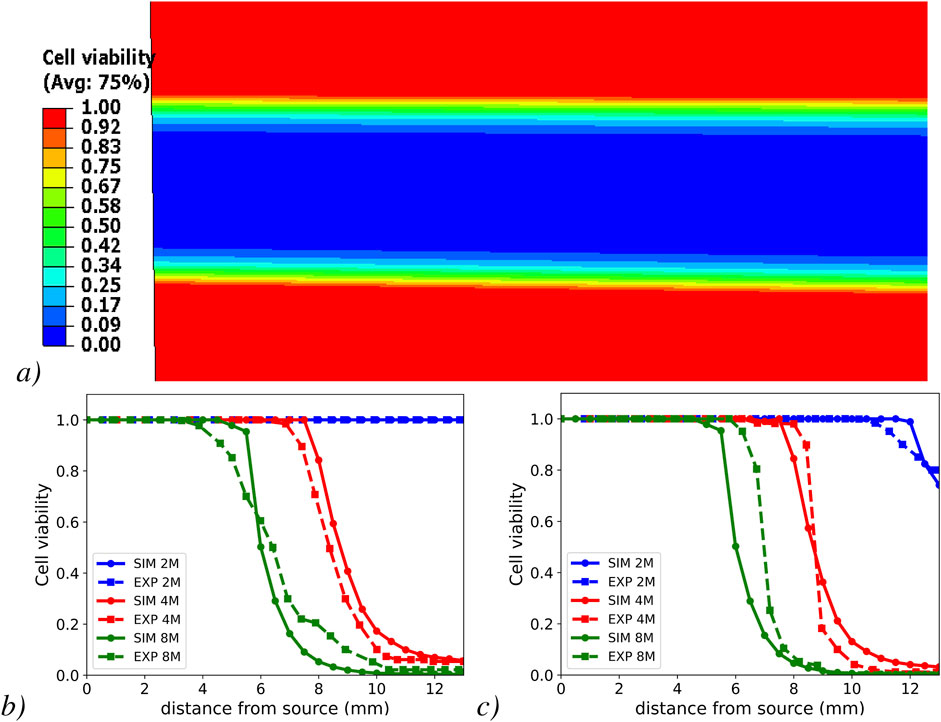
Figure 3. Cell viability heat map within the model diffusion chamber (a) and cell viability profiles in the simulated half-slice of the diffusion-chamber and their comparison with experimental results (Horner, 2001) at different cell densities. Numerical results from FEM simulation (SIM) and experiment (EXP) after day 3 (b) and after day 11 (c).
3.2 Effect of diffusivity gradient
Figure 4 displays the effect of
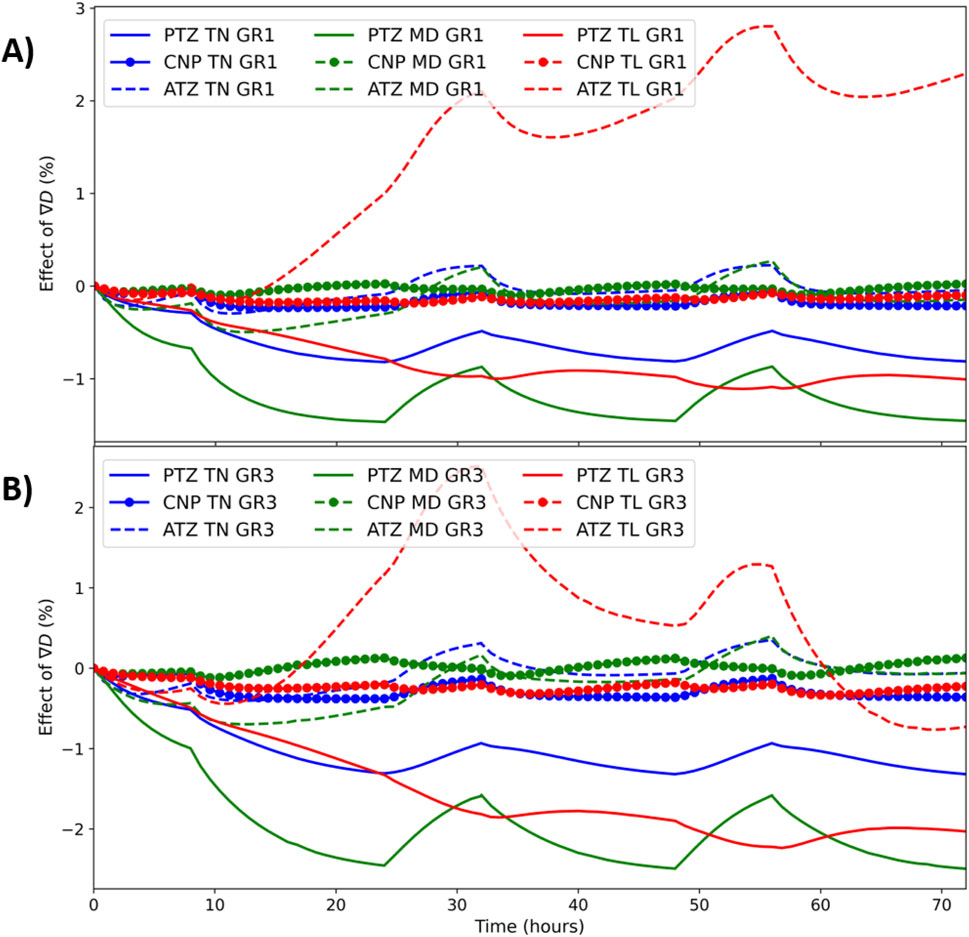
Figure 4. Time dependent effect of
3.3 Spatio-temporal distribution of solutes under varying material properties
Figure 5 presents glucose concentration heatmaps after 72 h of simulation across three IVD models (TN, MD, TL) and two tissue material property sets (GR1 and GR3). While simulations were performed both with and without
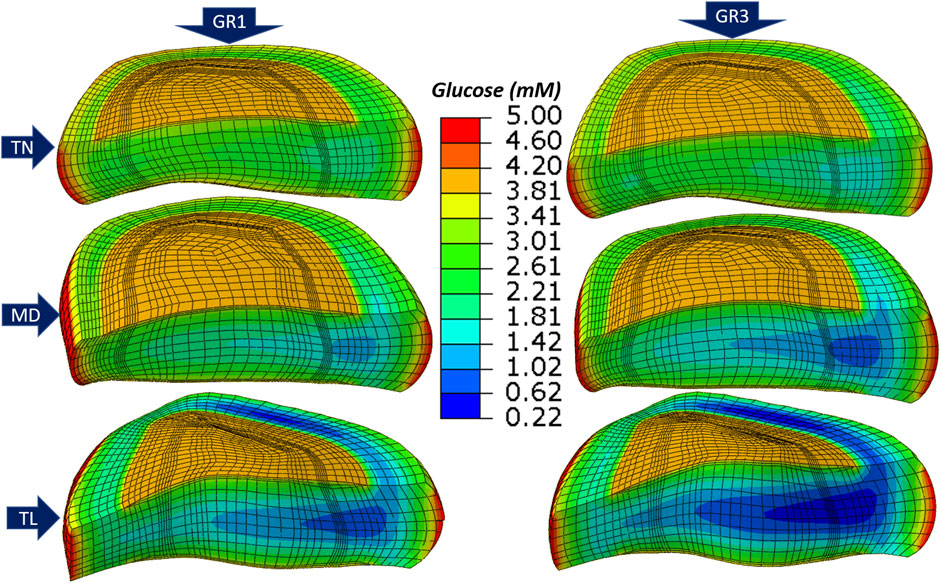
Figure 5. Glucose concentration for thin (
Across all geometries, the TL model consistently showed the lowest glucose and oxygen concentrations and the highest lactate levels. Regionally, the anterior transition zone (ATZ) exhibited the most severe nutrient depletion and metabolite accumulation, followed by the central nucleus pulposus (CNP) and the posterior transition zone (PTZ). This spatial distribution pattern held across both material conditions. Transitioning from GR1 to GR3 led to a further decrease in oxygen and glucose concentrations and an increase in lactate levels in all regions and geometries (Figure 5). Additional results for oxygen and lactate distributions are provided in Supplementary Figures S2, S3.
Figure 6 illustrates the time-dependent variations in glucose concentration for TN (A), MD (B), and TL (C) models at all regions (first column), as well as the influence of material properties (Equation 25) across the TN (D), MD (E), and TL (F) IVD models. Consistent with the spatial patterns observed in Figure 5, glucose levels progressively decline over time from the PTZ to the ATZ region, from GR1 to GR3 material conditions, and from TN to TL geometries (Figure 6, first column). Similar temporal and spatial trends were observed for oxygen concentrations, whereas lactate levels showed the opposite behavior, with greater accumulation in the ATZ region, under GR3 conditions, and in the TL model (Supplementary Figures S4, S5, first column). These temporal profiles were generated over a 72-h simulation period that incorporated a diurnal mechanical loading pattern, 8 h of rest and 16 h of activity, per day, repeated over three full cycles.
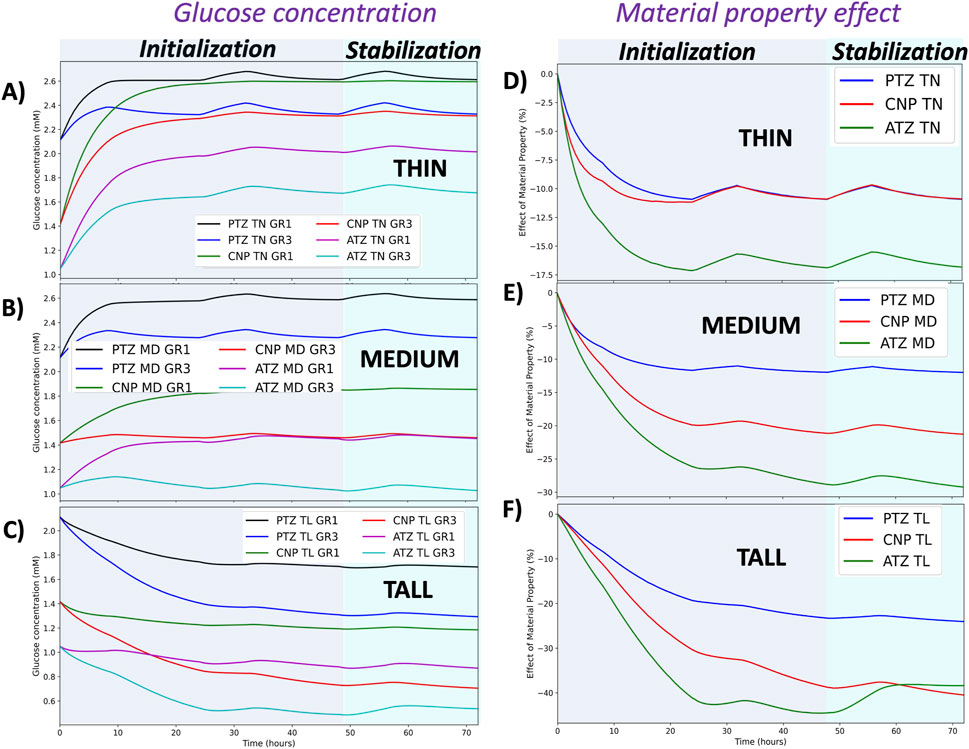
Figure 6. Glucose concentration profiles and impact of material properties over time. The left column (A–C) presents glucose concentrations in all regions and tissue material conditions for the TN (A), MD (B), and TL (C) models under GR1 and GR3 conditions. The right column (D–F) illustrates the relative effect of material properties (%) on glucose concentration in TN (D), MD (E), and TL (F) models across the three regions of interest (PTZ, CNP and ATZ). The background shading distinguishes simulation phases: the gray region represents the initialization phase (first two simulated days), and the light green region corresponds to the stabilization phase (final third day), during which results are considered more physiologically representative.
Figure 6 shows the dynamic steady-state of the three models on the third day for the glucose concentration (Figures 6A–C) and material properties (Figures 6D–F) effects, as previously shown in our prior work Malandrino et al. (2014a), Malandrino et al. (2014b). The thin and medium IVD models exhibited a marked increase in glucose and oxygen levels when compared with the initial healthy nutrient field obtained from the generic model, accompanied by a decrease in lactate concentration. In contrast, the tall disc model exhibited a sharp decline in glucose and oxygen levels in comparison with the initial healthy state, accompanied by a concurrent increase in lactate during the same period.
Despite the alternating loading pattern, temporal fluctuations in solute concentrations remained relatively small. Mild, region- and model-specific changes were observed: in the PTZ of the TN and MD models, oxygen and glucose concentrations increased slightly during rest periods, while lactate levels declined modestly. In contrast, fluctuations were minimal in the CNP and ATZ, where transport limitations and local tissue compaction are more pronounced. Across all cases, the influence of daily loading variation on solute levels remained below 5%.
The influence of material properties on glucose concentration is both model- and region-specific, with the largest relative change observed in the TL model and ATZ region, followed by the MD and TN models, and the CNP and PTZ regions, respectively (see Figure 6, second column and Table 4). Similar trends were observed for the effect of material properties on oxygen concentration, whereas lactate exhibited an inverse response. These results are detailed in Supplementary Figures S4 (second column) and S5 (second column).
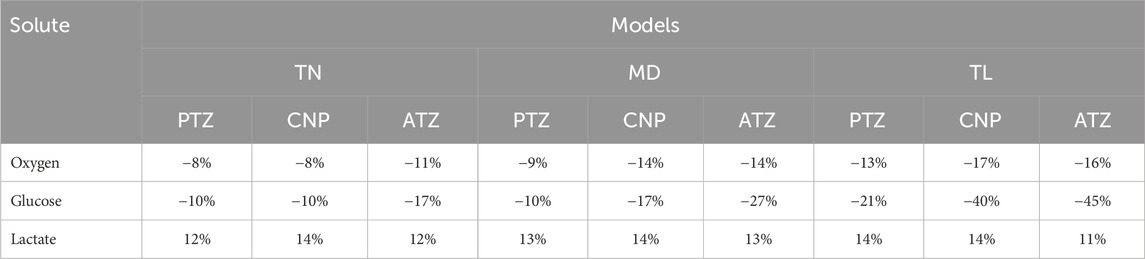
Table 4. Maximum percentage change in oxygen, glucose, and lactate concentrations due to a transition from GR1 to GR3 material properties, across all local regions and IVD models.
The impact of material property changes on solute concentrations is summarized in Table 4, based on the relative difference formula described in Equation 25. The table presents the maximum percentage change in oxygen, glucose, and lactate concentrations resulting from a shift in material properties from GR1 to GR3 across all regions (PTZ, CNP, ATZ) and IVD models (TN, MD, TL).
Figure 7 presents glucose concentrations along the circumferential mid-transverse paths (Figures 7A,B) of the outer surface of the nucleus pulposus (NP-path) and the transition zone (TZ-path) for the TL model under the GR3 condition. According to this figure (Figure 7C), the depletion of glucose in the TL model under GR3 material conditions is not localized solely to the anterior segment (2
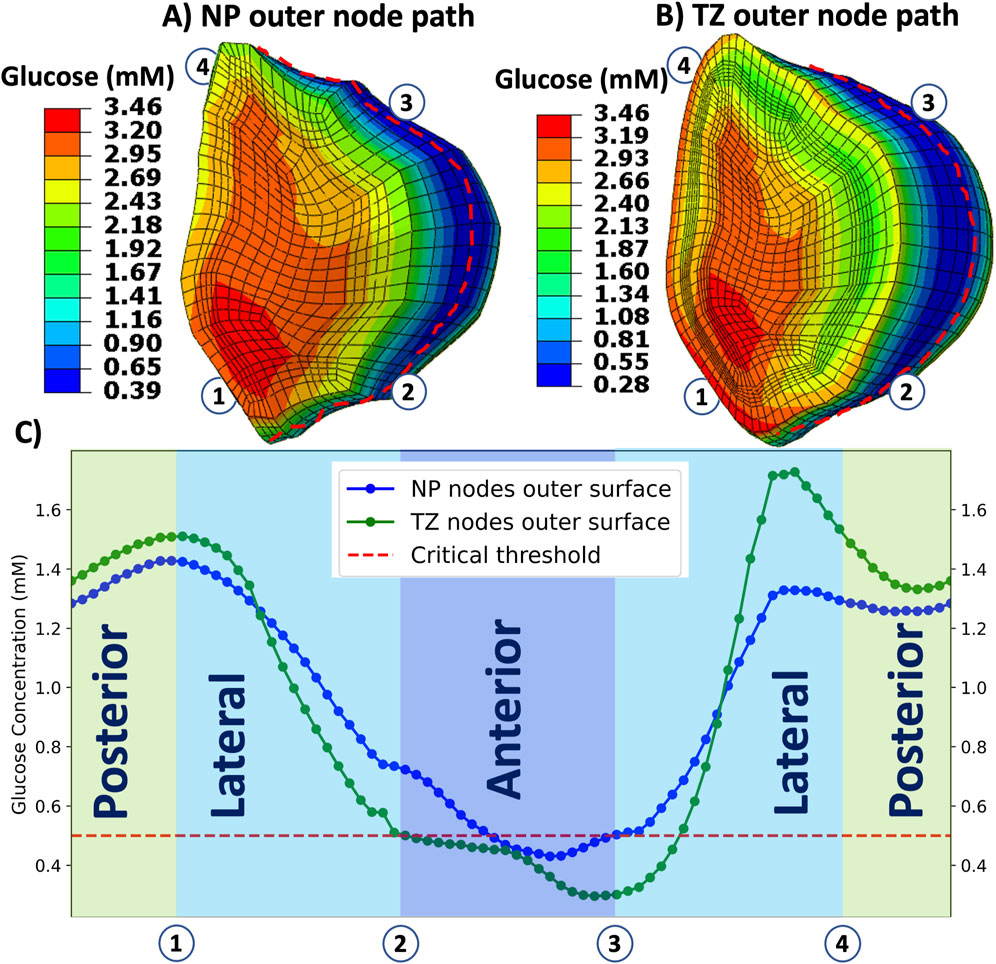
Figure 7. Illustrates distribution of glucose concentration over the outer surfaces of nucleus pulposus (A) and transition zone (B) and along the circumferential path (C) for tall (TL) IVD model under GR3 material property. Red broken curves in (A) and (B) represent the circumferential paths from where the data are collected. The horizontal dashed red line in (C) indicates the threshold value of glucose (0.5 mM), where below this line are nutritionally stressed regions in the nucleus pulposus and transition zone regions. Regions are divided into four segments: Lateral-1 (1
3.4 Effect of mid-height (MH)
Figure 8 presents an analysis of the minimum concentrations of oxygen and glucose, as well as the maximum concentration of lactate (A), and the linear dependence of these solute concentrations on disc height (B). As shown in Figure 8A, oxygen and glucose concentrations decrease progressively from left to right across each region, corresponding to a transition from TN to TL models (low to high mid-height). Conversely, lactate concentration increases along the same direction. This trend aligns with the variation in disc mid-height across the models, suggesting a linear relationship between solute concentration and disc height. This observation is further substantiated in Figure 8B, where solute concentrations are plotted directly against the mid-height of each model. Although based on only three data points, the linear trends reinforce the hypothesis that disc height is a primary determinant of solute availability within each local region.
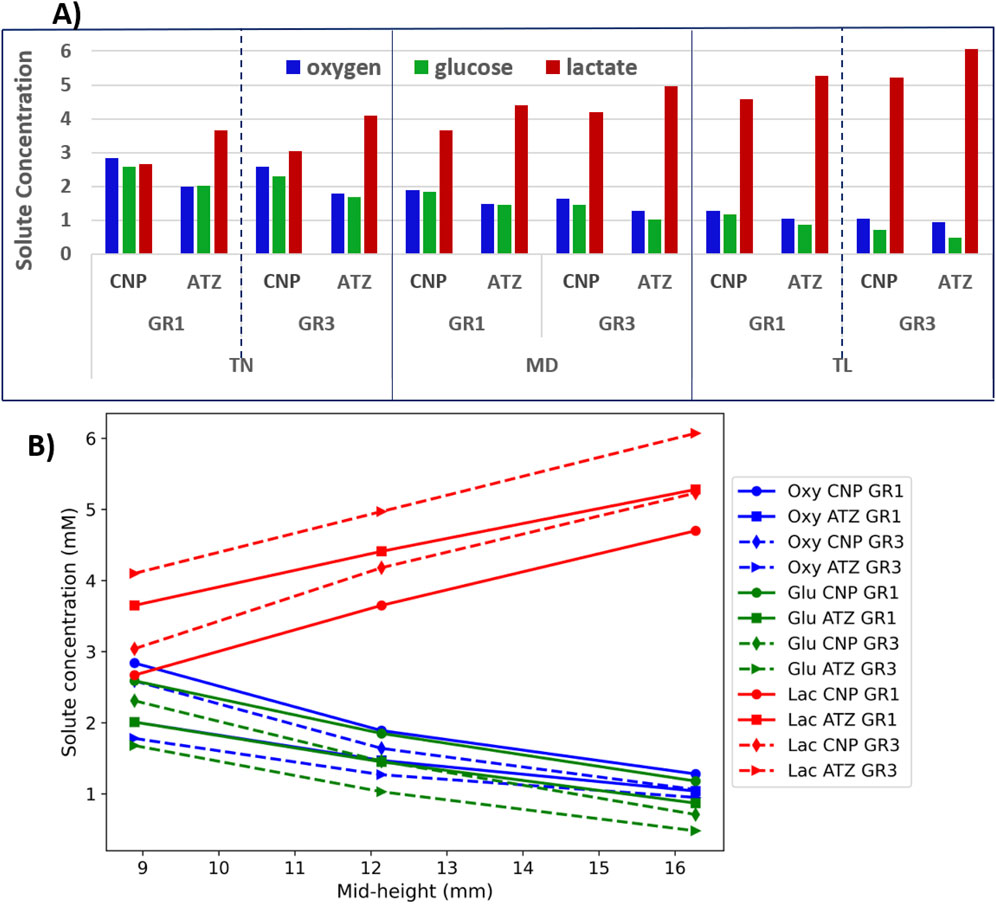
Figure 8. (A) Minimum concentrations of oxygen and glucose, and maximum concentrations of lactate; (B) Solute concentration as the function of disc mid-height.
Figure 9 provides a semi-quantitative illustration of how variations in disc height influence solute concentrations across regions and material conditions (Equation 26). The analysis reveals that the TN and TL models exhibit the most significant deviations from the mean, whereas the MD model shows minimal deviation, reflecting its central position in the height spectrum. The TN model shows positive deviations in oxygen and glucose concentrations, indicating elevated levels relative to the average across all geometries. In contrast, lactate exhibits negative deviations in this model. As one moves toward the TL geometry, the pattern reverses: oxygen and glucose show negative deviations, while lactate concentrations rise above the average. To complement this, Table 5 summarizes the percentage deviations (Equation 26) in oxygen, glucose, and lactate concentrations from the average across the three model geometries, specifically for TN and TL discs under both GR1 and GR3 material properties.
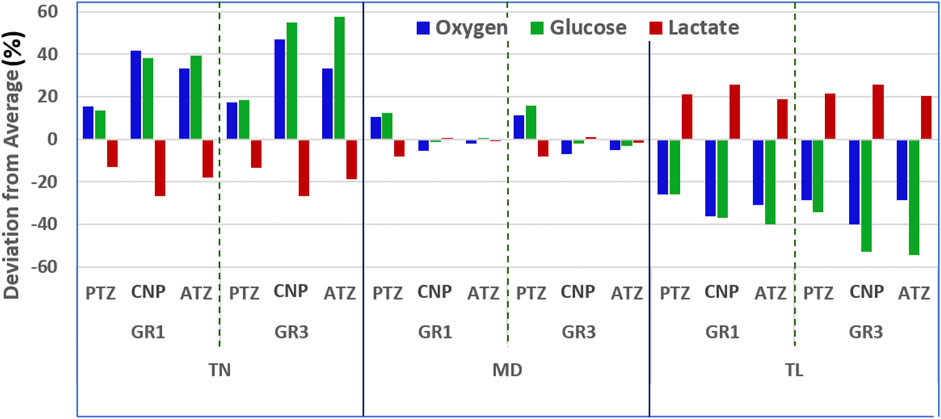
Figure 9. Maximum relative deviations (Equation 26) in oxygen, glucose, and lactate concentrations due to variations in disc mid-height, under GR1 and GR3 material properties after three simulated days.
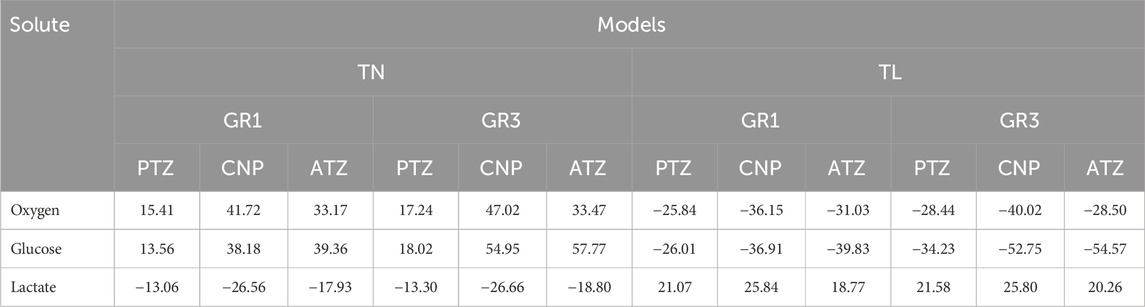
Table 5. Deviation from average (Equation 26) solute concentrations (%) under GR1 and GR3 conditions in TN and TL models across different disc regions.
As presented in Table 5, a 26% reduction in disc height relative to the reference medium (MD) model led to elevated nutrient availability and diminished lactate accumulation. Under GR3 conditions, the maximum regional deviations were observed for oxygen (47.02% at CNP), glucose (57.77% at ATZ), and lactate (−26.66% at CNP). A similar, albeit less pronounced, pattern was noted under GR1 conditions, with peak deviations of 41.72% for oxygen (CNP), 39.36% for glucose (ATZ), and −26.56% for lactate (CNP) (see Table 5). Conversely, the TL model, representing a 34% increase in mid-height, exhibited marked reductions in oxygen and glucose concentrations alongside increased lactate accumulation. Under GR3 conditions, oxygen and glucose levels deviated by −40.02% (CNP) and −54.57% (ATZ), respectively, while lactate levels rose by 25.80% (CNP). This trend persisted under GR1 conditions, with deviations of −36.15% for oxygen (CNP), −39.83% for glucose (ATZ), and 25.84% for lactate (ATZ) (see Table 5).
A consistent regional pattern emerged across all simulations: the center of the nucleus pulposus (CNP) exhibited the most pronounced changes in oxygen and lactate concentrations, regardless of whether mid-height was increased or decreased. In contrast, the anterior transition zone (ATZ) consistently demonstrated the highest deviations in glucose levels.
3.5 Cell viability
Simulation results indicate that cell viability is influenced by a combination of factors, including disc mid-height, tissue material properties, and the local region of interest. In both TN and MD discs, as well as in TL discs with healthy material properties (GR1), cell viability remained at 100% throughout the 3-day simulation period across all examined regions.
In contrast, under degenerated material conditions (GR3), the TL model exhibited reduced cell viability in the ATZ region. Cell death initiated as early as the first day of simulation. Figure 10A presents a heat map of cell viability after three simulated days, while Figure 10B illustrates the temporal evolution of viability in the ATZ region of the TL model under GR3 conditions. By the end of the 3-day simulation, cell survival in the ATZ region reached 72% when assuming a uniform diffusion coefficient
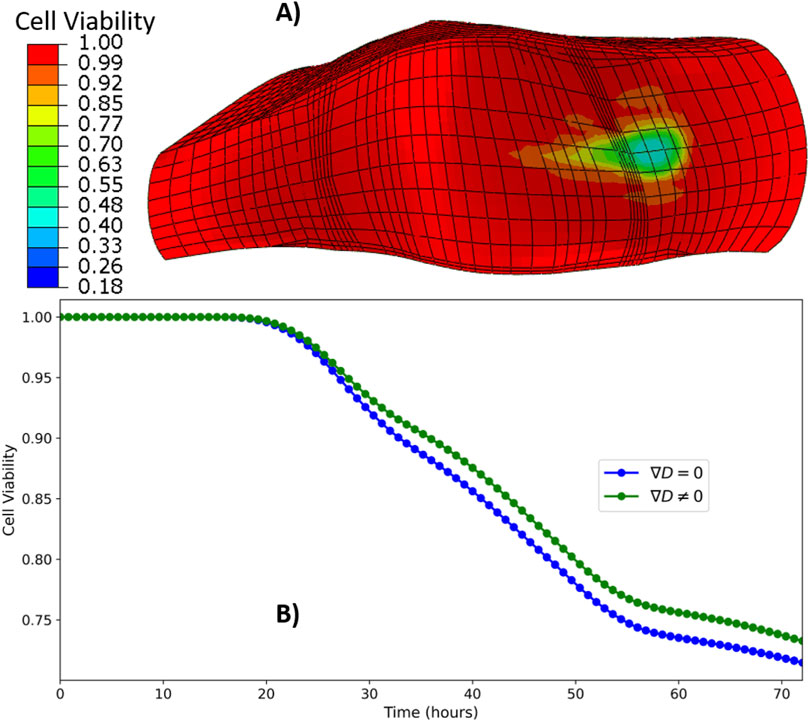
Figure 10. Heat map of cell viability at the end of three simulated days (A), time evolution of cell viability in the ATZ region (B) of TL model under GR3 material property.
4 Discussion
This study utilized a poromechanics-metabolic transport-cell viability coupling model, implemented via the Finite Element Method, to investigate the intricate dynamics of nutrient transport in patient-personalized (PP) L4-L5 lumbar IVD models (Muñoz-Moya et al., 2024). By focusing on the distribution of oxygen, glucose, and lactate across varying disc geometries (TN, MD,TL) under both healthy (GR1) and degenerated (GR3) material conditions, we aimed to investigate the multifaceted interactions between structural, mechanical, and metabolic factors. The findings provided valuable information about the roles of disc morphology, physiological loading, and tissue material properties in shaping the metabolic micro-environment and local cellular viability in the IVD.
4.1 Model validation and biological relevance
The capacity of the reactive transport model to predict nutritional stress and corresponding cell viability, based on phenomenological sets of equations for IVD cell metabolism, was successfully validated against the independent experimental data reported by Horner (2001). Validation covered the spatio-temporal effects of diffusion-reaction transport of oxygen, glucose, and lactate, in a porous medium, for 2 cell densities that cover the cell populations in the disc tissues. The good degree of accuracy, particularly at
4.2 Spatio-temporal distribution of solutes under varying material properties
Simulation results revealed that solute distribution within the IVD is highly dependent on spatial location, time, and tissue material properties across all examined models (see Figures 5, 6; Supplementary Figures S2, S3, S4, S5; Table 4). Spatially, the ATZ of the TL model consistently exhibited the most unfavorable solute conditions, characterized by the lowest glucose and oxygen concentrations and the highest lactate accumulation. In contrast, the PTZ maintained more favorable solute profiles in all geometries, likely due to shorter diffusion distances and reduced mechanical compression.
The transient discrepancies observed in solute dynamics during the early phase of simulation, particularly the sharp increase in glucose and oxygen and drop in lactate in thinner discs (TN and MD), versus the opposite trend in the taller disc (TL), are attributed to differences in geometry relative to the reference disc used for initialization. Specifically, the initial solute concentrations for the patient-personalized models were derived from the endpoint of a 72-h transport simulation conducted on a generic disc model with a mid-height of 14.33 mm (Table 1) under identical boundary and meshing conditions. This initialization approach introduced a morphology-dependent bias at the start of the simulations: discs thinner than the generic reference exhibited shorter diffusion distances, which facilitated a rapid influx of nutrients and clearance of waste products, leading to the observed early rise in glucose and oxygen and decline in lactate (see Figure 6; Supplementary Figures S4, S5). In contrast, the taller disc, with a longer diffusion path relative to the generic model, showed an initial drop in nutrient levels and accumulation of lactate. Importantly, these transient differences that shall not be considered for the comparative analysis of the different disc morphologies diminished over time, with all models eventually reaching a dynamic steady state under diurnal loading.
Although solute concentrations evolved over the 72-h simulation period, the impact of diurnal mechanical loading remained limited. Minor increases in glucose and oxygen during rest phases and corresponding reductions in lactate were confined to the PTZ of TN and MD models (see Figure 6; Supplementary Figures S4, S5). In contrast, the central NP and anterior transition zones exhibited negligible mechanical loading dependent fluctuations. Semi-quantitatively, daily mechanical loading induced changes of less than 5% in solute levels across all conditions. These findings suggest that, under physiological conditions, structural and compositional features of the disc exert a more dominant influence on solute transport than short-term mechanical fluctuations.
This observation is consistent with several prior studies indicating that while mechanical loading can cause transient fluid movements, its overall influence on solute transport in the IVD is relatively limited compared to the dominant role of passive diffusion, particularly for small solutes such as glucose, oxygen, and lactate. Ferguson et al. (2004) demonstrated through poroelastic modeling that although fluid velocities rise during loading–unloading cycles, the resulting convective transport is minimal and insufficient to substantially enhance the delivery of small solutes within the dense extracellular matrix. Katz et al. (1986) similarly concluded from experimental analysis that diffusion remains the principal mode of solute movement due to the avascular nature and low permeability of IVD tissues, especially in the nucleus pulposus (NP). Urban et al. (1982) found that fluid flow induced by mechanical compression only marginally influences nutrient movement, and primarily near the periphery of the disc, with negligible effects in the central NP. Supporting this, Boubriak et al. (2013) reported that diurnal hydration changes can lead to transient shifts in solute availability but emphasized that the disc’s internal structure and compositional features are the dominant determinants of transport. Malandrino et al. (2014b) used a 3D finite element model to show that, under physiological diurnal loading, solute fluctuations in the central disc remained small and confined to peripheral regions, reinforcing the limited role of dynamic loading on small solute distribution. Their follow-up study (Malandrino et al., 2015b) further demonstrated that disc geometry, particularly disc height, exerts a stronger influence on nutrient gradients and predicted cell viability than loading patterns. Finally, Soukane et al. (2007) confirmed through multiphasic transport simulations that tissue parameters such as porosity and fixed charge density, rather than mechanical inputs, primarily govern the distribution of oxygen, glucose, and lactate. Collectively, these findings support our conclusion that, under physiological conditions, solute distribution in the IVD is primarily driven by structural and material properties rather than daily variations in mechanical load. Consequently, optimizing metabolic support in the IVD requires focusing on tissue morphology, health, and composition rather than relying on mechanical modulation.
Importantly, the extent to which the simulated changes in material properties impaired the metabolic transport was strongly modulated by disc geometry. In thinner disc, with less strain-induced stiffening and shorter diffusion distances, experienced relatively moderate impact on concentration changes (see Figure 6D; Supplementary Figures S4D, S5D). On the other hand, the impact on glucose concentrations in TL discs was substantial (see Figure 6F; Supplementary Figures S4F, S5F). These predictions are consistent with previous computational findings that link degeneration-induced stiffening to reduced porosity and solute transport (Malandrino et al., 2011; Galbusera et al., 2013; Malandrino et al., 2014b). The resulting environment, characterized by oxygen and glucose depletion and lactate accumulation, creates an acidic and catabolically active milieu that might impair matrix synthesis and accelerate degeneration, according to previous IVD extracellular matrix turnover model and simulations by Gu et al. (2014).
To investigate regions beyond the selected ones (PTZ, CNP, ATZ), solute distributions were mapped along circumferential paths on the NP and TZ outer surfaces as shown in Figure 7. These results revealed that glucose deficiency is not confined to anterior regions but also extends into the anterolateral regions. In the TL degenerated model, glucose concentrations fell below the viability threshold along approximately 20% of the nucleus pulposus circumference and 35% of the transition zone circumference, while posterior regions consistently maintained levels above the critical threshold (Figure 7). This broader spread of nutritional stress indicates that metabolic risk in tall degenerated discs is not strictly confined to one anatomical quadrant but may affect a wider portion of the disc regions, possibly due to asymmetric strain and diffusion barriers.
4.3 Effect of mid-height
Disc morphology emerged as a critical determinant of solute transport under mechanical loading. Consistent with previous studies (Magnier et al., 2009; Malandrino et al., 2015b; Malandrino et al., 2014b; Zhu et al., 2012; Jackson et al., 2011), our model revealed an inverse relationship between disc mid-height and the concentrations of oxygen and glucose, while lactate levels increased with height. These linear trends (Figure 8B) emphasize the role of diffusion distance in modulating nutrient and metabolite distribution.
Thinner discs exhibited more favorable nutrient profiles due to shorter diffusion paths and possibly higher water content, likely resulting from reduced local volumetric strain. In contrast, taller discs experienced lower oxygen and glucose concentrations and greater lactate buildup, conditions unfavorable for cellular homeostasis. This was likely attributed to increased diffusion distance, strain-induced tissue compaction, and radial NP expansion, which collectively hinder solute transport.
These geometric effects are further mediated by the mechanical behavior of the annulus fibrosus (AF), which resists radial expansion of the NP. As a result, localized compaction near the NP–AF boundary, especially in taller discs, reduces water content and impairs solute exchange in the adjacent transition zones (O’Connell et al., 2012; Iatridis et al., 1998; Sher et al., 2017). Such strain-driven porosity changes amplify spatial heterogeneity in nutrient distributions, a phenomenon consistently observed in previous studies (Jackson et al., 2011; Malandrino et al., 2014b; Zhu et al., 2012).
Our results align with those of Malandrino et al. (2015b), who demonstrated that disc geometry can critically affect nutrient availability (see Figures 8A, 9). In particular, tall discs with mid-heights comparable to our TL configuration exhibited nutrient levels falling below viability thresholds. This effect was most pronounced in the anterior transition zone (ATZ), where limited permeability and higher metabolic demands converge (Sher et al., 2017).
Similarly, Motaghinasab et al. (2014) highlighted the size dependence of solute penetration in systemically delivered drugs, reporting that larger discs exhibit extended diffusion times and reduced permeability due to tissue consolidation. Additional study (Schmidt et al., 2016) confirms that increased disc height also influences mechanical strain patterns, which in turn modulate matrix porosity and interstitial fluid flow. These interactions restrict nutrient supply while promoting metabolic waste accumulation, increasing the risk of cell death and disc degeneration.
The medium-sized disc (MD) represented a physiologically favorable balance, exhibiting solute concentrations close to the overall average (Figure 9). Simulations showed that reducing disc mid-height by approximately one-third relative to MD increased oxygen and glucose concentrations by over 30% and decreased lactate levels by at least 20% in both the CNP and ATZ. Conversely, increasing mid-height by the same proportion resulted in over 30% reductions in oxygen and glucose, along with comparable increases in lactate accumulation. These effects were observed under both GR1 and GR3 material properties, with stiffer (GR3) tissue exacerbating transport limitations. Together, these results demonstrate that deviations from intermediate disc geometry significantly alter the metabolic microenvironment and may elevate the risk of degeneration, especially through GR3-level tissue changes.
Beyond global disc height, regional morphology, particularly antero-posterior asymmetry, also influenced nutrient transport (see Supplementary Figure S6). Discs with identical mid-heights but differing anterior and posterior heights showed clear differences in solute distribution, especially in the ATZ. These differences stem from localized deformation patterns that affect porosity and thus transport, consistent with findings in Muñoz-Moya et al. (2024). Taller regions, often anterior, are subject to greater axial strains under follower loads (Schmidt et al., 2007), due to geometric nonlinearity and strain-dependent stiffening. This leads to local tissue consolidation, increased NP expansion, and reduced permeability in the adjacent transition zone.
These results show how regional disc morphology intricately shapes transport dynamics within the IVD. They suggest that local structural variations should be accounted for when assessing disc health. Studies have also shown a positive correlation between body height and disc height, with taller individuals generally having taller intervertebral discs (Salamon et al., 2017). The present study suggests that taller individuals may face a higher risk of metabolic imbalances. This could potentially contribute to disc degeneration.
4.4 Cell viability
The findings demonstrated the relationships among disc geometry, material properties, and nutrient transport in maintaining cell viability within intervertebral discs. For thin and medium-sized discs, with both GR1 and GR3 material properties, as well as the tall IVD with GR1 material properties, nutrient diffusion was sufficient to sustain 100% cell viability. This is observed across all considered regions of the IVD over 3-day cycles of mechanical loading. This outcome differs from the results of Malandrino et al. (2015b), who also reported cell death in the center of the NP of their tallest (15.2 mm) IVD model, even with healthy material properties. Arguably, the authors did not have a composition-based formulation of the disc tissue beyond the AF fibres, and they did not consider strain-dependent osmotic pressurization but a constant osmotic pressure, which might not be as helpful to retain the extrafibrillar water under mechanical loads. Such interpretation is consistent with the findings by Muñoz-Moya et al. (2024), where mid disc height stood for a top morphological feature that affects the control of extrafibrillar water in the center of the NP, with a tissue constitutive model similar to the one used here. Overall, the present results emphasize the importance of maintaining material composition to support adequate nutrient supply and waste removal through diffusive transport.
However, the challenges posed by degeneration became evident in tall IVDs with mildly compromised material properties (GR3). In these cases, the ATZ regions were particularly susceptible to nutrient deficits, with significant cell death observed as early as in the first day of simulation (Figure 10). This is in line with the reports related to the effect of disc size and material property on cell survival (Malandrino et al., 2015b; Gu et al., 2014). As stated in the result section, including
While the study offers a structured understanding of how these factors affect nutrient availability and cellular viability, some limitations are acknowledged. The model’s assumptions of uniform tissue properties, such as initial water content, cell density, and fixed charge density, as well as the exclusion of factors like inflammatory cytokines and structural protein-degrading enzymes, which are key features of degenerated IVD, may reduce its ability to capture localized variations or simulate long-term degenerative effects. Additionally, the simulations were limited to IVD models with minimal wedging, where the mid-height adequately represents the overall geometry. Incorporating greater local variability, as recently done in mechanical simulations by Muñoz-Moya et al. (2024), would enrich the interpretation of spatial transport dynamics. However, such integration remains computationally expensive under the current framework, where a 3-day simulation of an IVD model requires over 288 h on high-performance computing infrastructure. Future studies, by coupling the current finite element models with existing systems biology models of IVD cell activity (Baumgartner et al., 2021; Tseranidou et al., 2025), should address these gaps, allowing for dynamic descriptions of biochemical factors and their spatial heterogeneity.
5 Conclusion
This study presented a comprehensive evaluation of how IVD morphology, tissue composition, and mechanical deformation interact to regulate nutrient transport and cellular viability. By leveraging poro-mechanical finite element models of three PP L4-L5 IVD geometries, we systematically quantified the influence of disc mid-height, degeneration-dependent tissue properties, and strain-induced diffusivity gradients
The results demonstrated that disc morphology and tissue material properties are the principal regulators of solute availability. Thinner and medium-sized discs consistently exhibited favorable metabolic profiles, with oxygen and glucose levels maintained above critical thresholds and reduced lactate accumulation. In contrast, taller discs, particularly those with degenerated material properties (GR3), showed marked declines in oxygen and glucose concentrations, exceeding
The role of degeneration was further underscored by the strong modulation of solute profiles by tissue material properties. Stiffer, less hydrated tissues (GR3) exhibited up to
Although physiological loading cycles induced minor temporal variations in solute concentrations, slightly improving nutrient levels during rest and reducing them during activity, their relative effect remained below 5% across all regions and models. Likewise, inclusion of the
Taken together, these findings highlight the biomechanical and structural parameters that most critically shape nutrient availability and cellular health in a spatially and solute-specific manner. In particular, disc mid-height and tissue degeneration emerged as key drivers of metabolic imbalance with potential risk factors for region-specific disc degeneration. From a translational standpoint, this work supports the development of personalized IVD models incorporating PP geometry and material characteristics as a basis for improved diagnostic biomarkers of IVD morphology that can contribute to the assessment of the risk of degeneration or incremental degeneration of lumbar IVDs.
Data availability statement
The original contributions presented in the study are included in the article/Supplementary Material, further inquiries can be directed to the corresponding author.
Author contributions
ZW: Conceptualization, Data curation, Formal Analysis, Funding acquisition, Investigation, Methodology, Resources, Software, Validation, Visualization, Writing – original draft, Writing – review and editing. EM-M: Conceptualization, Data curation, Formal Analysis, Investigation, Methodology, Resources, Software, Validation, Visualization, Writing – original draft, Writing – review and editing. CR: Conceptualization, Formal Analysis, Methodology, Resources, Software, Visualization, Writing – review and editing. DL: Conceptualization, Methodology, Writing – review and editing. JN: Conceptualization, Data curation, Formal Analysis, Funding acquisition, Investigation, Methodology, Project administration, Resources, Software, Supervision, Validation, Visualization, Writing – review and editing.
Funding
The author(s) declare that financial support was received for the research and/or publication of this article. The authors wish to express their sincere gratitude to the Direcció General de Recerca de la Generalitat de Catalunya for funding this research through the Beatriu de Pinós 2020 fellowship agreement (2020 BP 00282). This research has also been funded by the European Union (ERC grant O-Health, ERC-2021-CoG-O-Health-101044828). Views and opinions expressed are however those of the author(s) only and do not necessarily reflect those of the European Union or the European Research Council Executive Agency. Neither the European Union nor the granting authority can be held responsible for them.
Conflict of interest
The authors declare that the research was conducted in the absence of any commercial or financial relationships that could be construed as a potential conflict of interest.
Generative AI statement
The author(s) declare that no Generative AI was used in the creation of this manuscript.
Publisher’s note
All claims expressed in this article are solely those of the authors and do not necessarily represent those of their affiliated organizations, or those of the publisher, the editors and the reviewers. Any product that may be evaluated in this article, or claim that may be made by its manufacturer, is not guaranteed or endorsed by the publisher.
Supplementary material
The Supplementary Material for this article can be found online at: https://www.frontiersin.org/articles/10.3389/fbioe.2025.1651786/full#supplementary-material
Footnotes
1The repository of 169 PP FE models of the IVD created for the scientific community (Muñoz-Moya et al., 2024) is available in (Muñoz-Moya et al., 2023), accessible through our online user interface SpineView: https://ivd.spineview.upf.edu/.
References
Aladin, D. M., Cheung, K. M., Ngan, A. H., Chan, D., Leung, V. Y., Lim, C. T., et al. (2010). Nanostructure of collagen fibrils in human nucleus pulposus and its correlation with macroscale tissue mechanics. J. Orthop. Res. 28, 497–502. doi:10.1002/jor.21010
Alini, M., Eisenstein, S. M., Ito, K., Little, C., Kettler, A. A., Masuda, K., et al. (2008). Are animal models useful for studying human disc disorders/degeneration? Eur. Spine J. 17, 2–19. doi:10.1007/s00586-007-0414-y
Antoniou, J., Steffen, T., Nelson, F., Winterbottom, N., Hollander, A. P., Poole, R. A., et al. (1996). The human lumbar intervertebral disc: evidence for changes in the biosynthesis and denaturation of the extracellular matrix with growth, maturation, ageing, and degeneration. J. Clin. Investigation 98, 996–1003. doi:10.1172/jci118884
Bartels, E. M., Fairbank, J. C., Winlove, C. P., and Urban, J. P. (1998). Oxygen and lactate concentrations measured in vivo in the intervertebral discs of patients with scoliosis and back pain. Spine 23, 1–7. doi:10.1097/00007632-199801010-00001
Barthelemy, V. M. P., Van Rijsbergen, M. M., Wilson, W., Huyghe, J. M., Van Rietbergen, B., and Ito, K. (2016). A computational spinal motion segment model incorporating a matrix composition-based model of the intervertebral disc. J. Mech. Behav. Biomed. Mater. 54, 194–204. doi:10.1016/j.jmbbm.2015.09.028
Baumgartner, L., Sadowska, A., Tío, L., González Ballester, M. A., Wuertz-Kozak, K., and Noailly, J. (2021). Evidence-based network modelling to simulate nucleus pulposus multicellular activity in different nutritional and pro-inflammatory environments. Front. Bioeng. Biotechnol. 9, 734258. doi:10.3389/fbioe.2021.734258
Bibby, S. R. S., and Urban, J. P. G. (2004). Effect of nutrient deprivation on the viability of intervertebral disc cells. Eur. Spine J. 13, 695–701. doi:10.1007/s00586-003-0616-x
Bibby, S. R., Fairbank, J. C., Urban, M. R., and Urban, J. P. G. (2002). Cell viability in scoliotic discs in relation to disc deformity and nutrient levels. Spine 27, 2220–2227. doi:10.1097/00007632-200210150-00007
Bibby, S. R., Jones, D. A., Ripley, R. M., and Urban, J. P. (2005). Metabolism of the intervertebral disc: effects of low levels of oxygen, glucose, and ph on rates of energy metabolism of Bovine nucleus pulposus cells. Spine 30, 487–496. doi:10.1097/01.brs.0000154619.38122.47
Boubriak, O. A., Watson, N., Sivan, S. S., Stubbens, N., and Urban, J. P. (2013). Factors regulating viable cell density in the intervertebral disc: blood supply in relation to disc height. J. Anat. 222, 341–348. doi:10.1111/joa.12022
Bruehlmann, S. B., Rattner, B. J., Matyas, R. J., and Duncan, A. (2002). Regional variations in the cellular matrix of the annulus fibrosus of the intervertebral disc. J. Anat. 201, 159–171. doi:10.1046/j.1469-7580.2002.00080.x
Buchweitz, N., Sun, Y., Porto, S. C., Kelley, J., Niu, Y., Wang, S., et al. (2024). Regional structure-function relationships of lumbar cartilage endplates. J. Biomechanics 169, 112131. doi:10.1016/j.jbiomech.2024.112131
Castro-Mateos, I., Pozo, J. M., Eltes, P. E., Rio, L. D., Lazary, A., and Frangi, A. F. (2014). 3d segmentation of annulus fibrosus and nucleus pulposus from t2-weighted magnetic resonance images. Phys. Med. Biol. 59, 7847–7864. doi:10.1088/0031-9155/59/24/7847
Clouthier, A. L., Hosseini, H. S., Maquer, G., and Zysset, P. K. (2015). Finite element analysis predicts experimental failure patterns in vertebral bodies loaded via intervertebral discs up to large deformation. Med. Eng. and Phys. 37, 599–604. doi:10.1016/j.medengphy.2015.03.007
Cortes, D. H., Jacobs, N. T., DeLucca, J. F., and Elliott, D. M. (2014). Elastic, permeability and swelling properties of human intervertebral disc tissues: a benchmark for tissue engineering. J. Biomechanics 47, 2088–2094. doi:10.1016/j.jbiomech.2013.12.021
Coventry, M. B., Ghormley, R. K., and Kernohan, J. W. (1945). The intervertebral disc: its microscopic anatomy and pathology: part i. anatomy, development, and physiology. JBJS 27, 105–112. Available online at: https://journals.lww.com/jbjsjournal/abstract/1945/27010/THE_INTERVERTEBRAL_DISC___ITS_MICROSCOPIC_ANATOMY.11.aspx.
Crump, K. B., Alminnawi, A., Bermudez-Lekerika, P., Compte, R., Gualdi, F., McSweeney, T., et al. (2023). Cartilaginous endplates: a comprehensive review on a neglected structure in intervertebral disc research. JOR spine 6, e1294. doi:10.1002/jsp2.1294
Disney, C., Mo, J., Eckersley, A., Bodey, A., Hoyland, J., Sherratt, M., et al. (2022). Regional variations in discrete collagen fibre mechanics within intact intervertebral disc resolved using synchrotron computed tomography and digital volume correlation. Acta Biomater. 138, 361–374. doi:10.1016/j.actbio.2021.10.012
Ferguson, S. J., Ito, K., and Nolte, L.-P. (2004). Fluid flow and convective transport of solutes within the intervertebral disc. J. Biomechanics 37, 213–221. doi:10.1016/s0021-9290(03)00250-1
Galbusera, F., Mietsch, A., Schmidt, H., Wilke, H.-J., and Neidlinger-Wilke, C. (2013). Effect of intervertebral disc degeneration on disc cell viability: a numerical investigation. Comput. Methods Biomechanics Biomed. Eng. 16, 328–337. doi:10.1080/10255842.2011.619184
Gu, W., Zhu, Q., Gao, X., and Brown, M. D. (2014). Simulation of the progression of intervertebral disc degeneration due to decreased nutritional supply. Spine 39, E1411–E1417. doi:10.1097/brs.0000000000000560
Hirose, O. (2021). A bayesian formulation of coherent point drift. IEEE Trans. Pattern Analysis Mach. Intell. 43, 2269–2286. doi:10.1109/tpami.2020.2971687
Holm, S., Maroudas, A., Urban, J., Selstam, G., and Nachemson, A. (1981). Nutrition of the intervertebral disc: solute transport and metabolism. Connect. Tissue Res. 8, 101–119. doi:10.3109/03008208109152130
Horner, H. A. (2001). Effect of nutrient supply on the viability of cells from the nucleus pulposus of the intervertebral disc. Spine 266, 2543–2549. doi:10.1097/00007632-200112010-00006
Howard, S., and Masuda, K. (2006). Relevance of in vitro and in vivo models for intervertebral disc degeneration. JBJS 88, 88–94. doi:10.2106/00004623-200604002-00018
Huang, Y.-C., Urban, J. P., and Luk, K. D. (2014). Intervertebral disc regeneration: do nutrients lead the way? Nat. Rev. Rheumatol. 10, 561–566. doi:10.1038/nrrheum.2014.91
Humzah, M. D., and Soames, R. W. (1988). Human intervertebral disc: structure and function. Anatomical Rec. 220, 337–356. doi:10.1002/ar.1092200402
Huyghe, J. M., Van Loon, R., and Baaijens, F. (2004). Fluid-solid mixtures and electrochemomechanics: the simplicity of lagrangian mixture theory. Comput. and Appl. Math. 23, 235–258. doi:10.1590/s1807-03022004000200008
Iatridis, J. C., Weidenbaum, M., Setton, L. A., and Mow, V. C. (1996). Is the nucleus pulposus a solid or a fluid? Mechanical behaviors of the nucleus pulposus of the human intervertebral disc. Spine 21, 1174–1184. doi:10.1097/00007632-199605150-00009
Iatridis, J. C., Setton, L. A., Foster, R. J., Rawlins, B. A., Weidenbaum, M., and Mow, V. C. (1998). Degeneration affects the anisotropic and nonlinear behaviors of human anulus fibrosus in compression. J. biomechanics 31, 535–544. doi:10.1016/s0021-9290(98)00046-3
Ishihara, H., and Urban, J. P. (1999). Effects of low oxygen concentrations and metabolic inhibitors on proteoglycan and protein synthesis rates in the intervertebral disc. J. Orthop. Res. 17, 829–835. doi:10.1002/jor.1100170607
Jackson, A. R., Huang, C.-Y. C., Brown, M. D., and Yong Gu, W. (2011). 3d finite element analysis of nutrient distributions and cell viability in the intervertebral disc: effects of deformation and degeneration. J. Biomechanical Eng. 133, 091006. doi:10.1115/1.4004944
Jackson, A. R., Yuan, T.-Y., Huang, C.-Y., Brown, M. D., and Gu, W. Y. (2012). Nutrient transport in human annulus fibrosus is affected by compressive strain and anisotropy. Ann. Biomed. Eng. 40, 2551–2558. doi:10.1007/s10439-012-0606-4
Jünger, S., Gantenbein-Ritter, B., Lezuo, P., Alini, M., Ferguson, S. J., and Ito, K. (2009). Effect of limited nutrition on in situ intervertebral disc cells under simulated-physiological loading. Spine 34, 1264–1271. doi:10.1097/brs.0b013e3181a0193d
Katz, M. M., Hargens, A. R., and Garfin, S. R. (1986). Intervertebral disc nutrition: diffusion versus convection. Clin. Orthop. Relat. Res. 210, 243–245. doi:10.1097/00003086-198609000-00035
Lialios, D., Eguzkitza, B., Houzeaux, G., Casoni, E., Baumgartner, L., Noailly, J., et al. (2025). A porohyperelastic scheme targeted at high-performance computing frameworks for the simulation of the intervertebral disc. Comput. Methods Programs Biomed. 259, 108493. doi:10.1016/j.cmpb.2024.108493
Mackie, J. S., Meares, P., and Rideal, E. K. (1955a). The diffusion of electrolytes in a cation-exchange resin membrane i. theoretical. Proc. R. Soc. Lond. Ser. A. Math. Phys. Sci. 232, 498–509. doi:10.1098/rspa.1955.0234
Mackie, J. S., Meares, P., and Rideal, E. K. (1955b). The diffusion of electrolytes in a cation-exchange resin membrane. ii. experimental. Proc. R. Soc. Lond. Ser. A. Math. Phys. Sci. 232, 510–518. doi:10.1098/rspa.1955.0235
Magnier, C., Boiron, O., Wendling-Mansuy, S., Chabrand, P., and Deplano, V. (2009). Nutrient distribution and metabolism in the intervertebral disc in the unloaded state: a parametric study. J. Biomechanics 42, 100–108. doi:10.1016/j.jbiomech.2008.10.034
Malandrino, A., Noailly, J., and Lacroix, D. (2011). The effect of sustained compression on oxygen metabolic transport in the intervertebral disc decreases with degenerative changes. PLoS Comput. Biol. 7, e1002112. doi:10.1371/journal.pcbi.1002112
Malandrino, A., Lacroix, D., Hellmich, C., Ito, K., Ferguson, S. J., and Noailly, J. (2014a). The role of endplate poromechanical properties on the nutrient availability in the intervertebral disc. Osteoarthr. Cartil. 22, 1053–1060. doi:10.1016/j.joca.2014.05.005
Malandrino, A., Noailly, J., and Lacroix, D. (2014b). Numerical exploration of the combined effect of nutrient supply, tissue condition and deformation in the intervertebral disc. J. Biomechanics 47, 1520–1525. doi:10.1016/j.jbiomech.2014.02.004
Malandrino, A., Jackson, A. R., Huyghe, J. M., and Noailly, J. (2015a). Poroelastic modeling of the intervertebral disc: a path toward integrated studies of tissue biophysics and organ degeneration. MRS Bull. 40, 324–332. doi:10.1557/mrs.2015.68
Malandrino, A., Pozo, J. M., Castro-Mateos, I., Frangi, A. F., van Rijsbergen, M. M., Ito, K., et al. (2015b). On the relative relevance of subject-specific geometries and degeneration-specific mechanical properties for the study of cell death in human intervertebral disk models. Front. Bioeng. Biotechnol. 3 (5), 5. doi:10.3389/fbioe.2015.00005
Marchand, F., and Ahmed, A. M. (1990). Investigation of the laminate structure of lumbar disc anulus fibrosus. Spine 15, 402–410. doi:10.1097/00007632-199005000-00011
McMorran, J. G., and Gregory, D. E. (2021). The influence of axial compression on the cellular and mechanical function of spinal tissues; emphasis on the nucleus pulposus and annulus fibrosus: a review. J. Biomechanical Eng. 143, 050802. doi:10.1115/1.4049749
Molladavoodi, S., McMorran, J., and Gregory, D. (2020). Mechanobiology of annulus fibrosus and nucleus pulposus cells in intervertebral discs. Cell Tissue Res. 379, 429–444. doi:10.1007/s00441-019-03136-1
Motaghinasab, S., Shirazi-Adl, A., Parnianpour, M., and Urban, J. P. G. (2014). Disc size markedly influences concentration profiles of intravenously administered solutes in the intervertebral disc: a computational study on glucosamine as a model solute. Eur. Spine J. 23, 715–723. doi:10.1007/s00586-013-3142-5
Muñoz-Moya, E., Rasouligandomani, M., Ruiz Wills, C., Chemorion, F., Piella, G., and Noailly, J. (2023). Repository of ivd patient-specific fe models. doi:10.5281/zenodo.8325042
Muñoz-Moya, E., Rasouligandomani, M., Ruiz Wills, C., Chemorion, F. K., Piella, G., and Noailly, J. (2024). Unveiling interactions between intervertebral disc morphologies and mechanical behavior through personalized finite element modeling. Front. Bioeng. Biotechnol. 12, 1384599. doi:10.3389/fbioe.2024.1384599
Nedresky, D., Reddy, V., and Singh, G. (2023). “Anatomy, back, nucleus pulposus,” in StatPearls (StatPearls Publishing).
Newell, N., Little, J. P., Christou, A., Adams, M. A., Adam, C., and Masouros, S. (2017). Biomechanics of the human intervertebral disc: a review of testing techniques and results. J. Mech. Behav. Biomed. Mater. 69, 420–434. doi:10.1016/j.jmbbm.2017.01.037
Noailly, J., Wilke, H.-J., Planell, J. A., and Lacroix, D. (2007). How does the geometry affect the internal biomechanics of a lumbar spine bi-segment finite element model? Consequences on the validation process. J. biomechanics 40, 2414–2425. doi:10.1016/j.jbiomech.2006.11.021
Noailly, J., Planell, J. A., and Lacroix, D. (2011). On the collagen criss-cross angles in the annuli fibrosi of lumbar spine finite element models. Biomechanics Model. Mechanobiol. 10, 203–219. doi:10.1007/s10237-010-0227-5
O’Connell, G. D., Sen, S., and Elliott, D. M. (2012). Human annulus fibrosus material properties from biaxial testing and constitutive modeling are altered with degeneration. Biomechanics Model. Mechanobiol. 11, 493–503. doi:10.1007/s10237-011-0328-9
Ranganathan, D., Brian, J., Donal, S., Cox, E., and Gowland, P. (2009). What influence does sustained mechanical load have on diffusion in the human intervertebral disc? An in vivo study using serial postconstrast magnetic resonance imaging. Spine 34, 2324–2337. doi:10.1097/brs.0b013e3181b4df92
Ross Bournemouth, N. S. (1931). The intervertebral discs. Br. J. Surg. 18, 358–375. doi:10.1002/bjs.1800187103
Roughley, P. (2004). The structure and function of cartilage proteoglycans. Eur. Cells Mater. 8, 29–37. doi:10.22203/ecm.v012a11
Ruiz, C., Noailly, J., and Lacroix, D. (2013). Material property discontinuities in intervertebral disc porohyperelastic finite element models generate numerical instabilities due to volumetric strain variations. J. Mech. Behav. Biomed. Mater. 26, 1–10. doi:10.1016/j.jmbbm.2013.05.012
Ruiz Wills, C., Foata, B., González Ballester, M. Á., Karppinen, J., and Noailly, J. (2018). Theoretical explorations generate new hypotheses about the role of the cartilage endplate in early intervertebral disk degeneration. Front. physiology 9, 1210. doi:10.3389/fphys.2018.01210
Salamon, N., Van Langenhove, C., and Verstraete, K. (2017). “Height of lumbar disc and vertebral body: what is the relation with body mass index, subcutaneous fat thickness, body weight, length and age?,” in 2017 European Congress of Radiology (ECR 2017), Vienna, Austria, March 1 to 5, 2017.
Schmidt, H., Kettler, A., Heuer, F., Simon, U., Claes, L., and Wilke, H.-J. (2007). Intradiscal pressure, shear strain, and fiber strain in the intervertebral disc under combined loading. Spine 32, 748–755. doi:10.1097/01.brs.0000259059.90430.c2
Schmidt, H., Reitmaier, S., Graichen, F., and Shirazi-Adl, A. (2016). Review of the fluid flow within intervertebral discs-how could in vitro measurements replicate in vivo?vivo? J. Biomechanics 49, 3133–3146. doi:10.1016/j.jbiomech.2016.09.007
Schroeder, Y., Sivan, S., Wilson, W., Merkher, Y., Huyghe, J. M., Maroudas, A., et al. (2007). Are disc pressure, stress, and osmolarity affected by intra-and extrafibrillar fluid exchange? J. Orthop. Res. 25, 1317–1324. doi:10.1002/jor.20443
Schroeder, Y., Elliott, D. M., Wilson, W., Baaijens, F., and Huyghe, J. M. (2008). Experimental and model determination of human intervertebral disc osmoviscoelasticity. J. Orthop. Res. 26, 1141–1146. doi:10.1002/jor.20632
Sher, I., Daly, C., Oehme, D. A., Chandra, R. V., Ghosh, P., Sher, M., et al. (2017). Could the transitional zone be the key to predicting degenerative disc disease? Spine J. 17, S198. doi:10.1016/j.spinee.2017.08.051
Sivan, S. S., Hayes, A. J., Wachtel, E., Caterson, B., Merkher, Y., Maroudas, A., et al. (2014). Biochemical composition and turnover of the extracellular matrix of the normal and degenerate intervertebral disc. Eur. Spine J. 23, 344–353. doi:10.1007/s00586-013-2767-8
Soukane, D. M., Shirazi-Adl, A., and Urban, J. (2007). Computation of coupled diffusion of oxygen, glucose and lactic acid in an intervertebral disc. J. biomechanics 40, 2645–2654. doi:10.1016/j.jbiomech.2007.01.003
Tseranidou, S., Segarra-Queralt, M., Chemorion, F. K., Le Maitre, C. L., Piñero, J., and Noailly, J. (2025). Nucleus pulposus cell network modelling in the intervertebral disc. npj Syst. Biol. Appl. 11, 13. doi:10.1038/s41540-024-00479-6
Urban, J. P. G. (2002). The role of the physicochemical environment in determining disc cell behaviour. Biochem. Soc. Trans. 30, 858–863. doi:10.1042/bst0300858
Urban, J., and McMullin, J. (1988). Swelling pressure of the intervertebral disc: influence of proteoglycan and collagen contents. Biorheology 25, 233–244. doi:10.3233/bir-1985-22205
Urban, J., Holm, S., Maroudas, A., and Nachemson, A. (1977). Nutrition of the intervertebral disk. An In vivo study of solute transport. Clin. Orthop. Relat. Res. 129, 101–114. doi:10.1097/00003086-197711000-00012
Urban, J., Holm, S., Maroudas, A., and Nachemson, A. (1982). Nutrition of the intervertebral disc: effect of fluid flow on solute transport. Clin. Orthop. Relat. Res. 170, 296–302. doi:10.1097/00003086-198210000-00039
Urban, J. P. G., Roberts, S., and Ralphs, J. R. (2000). The nucleus of the intervertebral disc from development to degeneration. Am. Zoologist 40, 53–061. doi:10.1093/icb/40.1.53
Wills, C. R., Malandrino, A., Van Rijsbergen, M., Lacroix, D., Ito, K., and Noailly, J. (2016). Simulating the sensitivity of cell nutritive environment to composition changes within the intervertebral disc. J. Mech. Phys. Solids 90, 108–123. doi:10.1016/j.jmps.2016.02.003
Wilson, W., Donkelaar, C. C. V., and Huyghe, J. M. (2005). A comparison between mechano-electrochemical and biphasic swelling theories for soft hydrated tissues. J. Biomech. Eng. 127, 158–165. doi:10.1115/1.1835361
Wong, J., Sampson, S. L., Bell-Briones, H., Ouyang, A., Lazar, A. A., Lotz, J. C., et al. (2019). Nutrient supply and nucleus pulposus cell function: effects of the transport properties of the cartilage endplate and potential implications for intradiscal biologic therapy. Osteoarthr. Cartil. 27, 956–964. doi:10.1016/j.joca.2019.01.013
Wu, Y., Loaiza, J., Banerji, R., Blouin, O., and Morgan, E. (2021). Structure-function relationships of the human vertebral endplate. JOR Spine 4, e1170. doi:10.1002/jsp2.1170
Keywords: intervertebral disc, disc morphology, nutrient diffusion, disc material property, cell viability, patient-specific, patient-personalized, finite element
Citation: Workineh ZG, Muñoz-Moya E, Ruiz Wills C, Lialios D and Noailly J (2025) Influence of disc height and strain-dependent solute diffusivity on metabolic transport in patient-personalized intervertebral disc models. Front. Bioeng. Biotechnol. 13:1651786. doi: 10.3389/fbioe.2025.1651786
Received: 22 June 2025; Accepted: 25 July 2025;
Published: 05 September 2025.
Edited by:
Weiyong Gu, University of Miami, United StatesReviewed by:
Yongren Wu, Clemson University, United StatesQiaoqiao Zhu, Nanjing University of Aeronautics and Astronautics, China
Copyright © 2025 Workineh, Muñoz-Moya, Ruiz Wills, Lialios and Noailly. This is an open-access article distributed under the terms of the Creative Commons Attribution License (CC BY). The use, distribution or reproduction in other forums is permitted, provided the original author(s) and the copyright owner(s) are credited and that the original publication in this journal is cited, in accordance with accepted academic practice. No use, distribution or reproduction is permitted which does not comply with these terms.
*Correspondence: Zerihun G. Workineh, emVyaWh1bmdldGFodW4ud29ya2luZWhAdXBmLmVkdQ==; Estefano Muñoz-Moya, ZXN0ZWZhbm8ubXVub3pAdXBmLmVkdQ==
†These authors have contributed equally to this work and share first authorship