 Ana Cristina Gonçalves1,2,3,4
 Raquel Alves1,2,3,4
 Inês Baldeiras5,6
 Joana Jorge1,2,3,4
 Bárbara Marques1,7Artur Paiva2,3,8
 Bárbara Oliveiros5Emília Cortesão1,2,3,4,7José Manuel Nascimento Costa2,3,9
 Ana Bela Sarmento-Ribeiro1,2,3,4,7*
- 1University of Coimbra, Laboratory of Oncobiology and Hematology and University Clinic of Hematology, Faculty of Medicine (FMUC), Coimbra, Portugal
- 2University of Coimbra, Group of Environment, Genetics and Oncobiology (CIMAGO) – Institute for Clinical and Biomedical Research (iCBR), FMUC, Coimbra, Portugal
- 3University of Coimbra, Center for Innovative Biomedicine and Biotechnology (CIBB), Coimbra, Portugal
- 4Clinical Academic Center of Coimbra (CACC), Coimbra, Portugal
- 5University of Coimbra, FMUC, Coimbra, Portugal
- 6University of Coimbra, Center for Neuroscience and Cell Biology, Coimbra, Portugal
- 7Clinical Hematology Department, Centro Hospitalar e Universitário de Coimbra (CHUC), Coimbra, Portugal
- 8Centro Hospitalar e Universitário de Coimbra (CHUC), Unidade de Gestão Operacional em Citometria, Coimbra, Portugal
- 9University of Coimbra, University Clinic of Oncology, FMUC, Coimbra, Portugal
Oxidative stress has been implicated in the development of several types of cancer, including myelodysplastic syndromes (MDS), as well as in the resistance to treatment. In this work, we assessed the potential of oxidative stress parameters to predict the response to erythropoiesis-stimulating agents (ESAs) in lower-risk MDS patients. To this end, we analyzed the systemic levels of reactive species (peroxides and NO), antioxidant defenses (uric acid, vitamin E, vitamin A, GSH, GSSG, TAS, as well as GPX and GR activities], and oxidative damage (8-OH-dG and MDA) in 66 MDS patients, from those 44 have been treated with ESA. We also calculated the peroxides/TAS and NO/TAS ratios and analyzed the gene expression of levels of the redox regulators, NFE2L2 and KEAP1. We found that patients that respond to ESA treatment showed lower levels of plasma peroxides (p < 0.001), cellular GSH (p < 0.001), and cellular GR activity (p = 0.001) when compared to patients who did not respond to ESA treatment. ESA responders also showed lower levels of peroxides/TAS ratio (p < 0.001) and higher levels of the expression of the NFE2L2 gene (p = 0.001) than those that did not respond to ESA treatment. The levels of plasmatic peroxides shown to be the most accurate biomarker of ESA response, with good sensitivity (80%) and specificity (100%) and is an independent biomarker associated with therapy response. Overall, the present study demonstrated a correlation between oxidative stress levels and the response to ESA treatment in lower-risk MDS patients, with the plasmatic peroxides levels a good predictive biomarker of drug (ESA) response.
Introduction
Myelodysplastic syndromes (MDS) are clonal hematological malignancies that comprises several subtypes with different biological and clinical presentations. These diseases are frequently characterized by inefficient hematopoiesis, dysplasia in one or more myeloid cell lineages, variable degrees and number of cytopenias, and increased risk of progression to acute myeloid leukemia (AML) (Jhanwar, 2015; Cazzola, 2020). MDS blood show typical morphological features such as dysplasia, differentiation arrest, defective cellular functions, and genomic instability. The peripheral cytopenias frequently observed in these patients are a consequence of the ineffective hematopoiesis and could involve all myeloid lineages (Mufti, 2004). One of the MDS paradoxes is the coexistence of peripheral cytopenias with hyperplastic bone marrow. The MDS clones exhibit increased proliferation, however, this proliferation is rapidly balanced by increased apoptosis, namely in low risk MDS subtypes. Recently, precursors conditions of MDS, such as clonal hematopoiesis of indeterminate potential (CHIP) and clonal cytopenia of undetermined significance (CCUS), has been identified (Cazzola, 2020) that allow an earlier diagnosis and could modify the MDS approach.
The presence of cytopenia and dysplasia, in at least one hematologic cell line, are essential for MDS diagnosis (Cazzola, 2020). On the other hand, the risk of death from cytopenias complications or evolution to AML is highly variable in MDS patients. The Revised International Prognostic Scoring System (IPSS-R) is the most frequently used prognostic system and is based on a small number of features with independent prognostic value, including chromosomal abnormalities, bone marrow blasts, hemoglobin level, platelet count and absolute neutrophil count. These features are routinely available in all clinical centers and allow the classification of MDS patients in five risk subgroups (very low risk, low risk; intermediate, high risk, and very high risk) with different probabilities of AML progression and survival (Garcia-Manero, 2010; Adès et al., 2014; Cazzola, 2020). In clinical practice, clinicians usually distinguish patients in lower-risk MDS (IPSS-R risk score ≤ 3.5) and in higher-risk MDS (IPSS-R risk score > 3.5), and lower-risk MDS account for about two-thirds of all MDS cases (Komrokji et al., 2011; Cazzola, 2020). In lower-risk MDS patients with symptomatic anemia the first-line treatment option is erythropoiesis-stimulating agents (ESAs), namely recombinant human erythropoietins (rHuEPOs), alone or combined with granulocyte colony-stimulating factor (G-CSF), which could prevent or delay transfusion dependency and improve quality of life. However, these treatments are only recommended for patients with serum erythropoietin (sEPO) levels below 500 U/L, and the most reliable predictor of a response is a sEPO lower than 200 U/L, while a high transfusion requirement predicts treatment failure (Cazzola, 2020; Park et al., 2020). However, in clinical practice, a sEPO cutoff level of 200 U/L is more indicative of response (Park et al., 2020). New biomarkers and scoring systems should be investigated to improve response and/or to predict resistance to ESA therapy.
Reactive oxygen species (ROS) are relevant players in hematological malignancies development, progression, and therapy resistance (Sardina et al., 2012; Sarmento-Ribeiro et al., 2012; Gonçalves et al., 2015). These free radical molecules show both beneficial and deleterious consequences (Ghaffari, 2008; Imbesi et al., 2013). When ROS levels overcome the cellular antioxidant defenses, oxidative stress is established as result of an imbalance in redox homeostasis (Ghaffari, 2008; Sardina et al., 2012). Several signaling pathways such as proliferation, differentiation, and apoptosis are regulated by intracellular ROS levels (Imbesi et al., 2013; Hasselbalch et al., 2014). Blood cells from MDS patients show increased levels of ROS and decreased concentration of GSH (Ghoti et al., 2007; Gonçalves et al., 2015). Furthermore, the disruption of redox homeostasis is a crucial factor in drug resistance development, which is an important factor in the failure of anticancer (Liu et al., 2016). During erythroid differentiation, erythroblasts are exposed to an oxidative environment and ROS are produced in response to EPO (Zhao et al., 2016; Beneduce et al., 2019). These ROS could act as second messengers by modulating intracellular signaling kinases including JAK2, LYN, and FYN (Beneduce et al., 2019). Beneduce et al. (2019) found that in the absence of FYN kinase, the efficiency of the EPO signal is decreased and an increase in ROS production is observed (Beneduce et al., 2019). However, the dynamics of oxidative status during erythropoiesis and erythroid differentiation in response to EPO are still unclear. Additionally, the nuclear factor erythroid 2-related factor 2 (NRF2), a major cellular redox modulator, plays a crucial role in preventing cancer cells from cytotoxicity induced by chemotherapy, contributing to drug resistance and therapeutic failure. In higher-risk MDS patients, NRF2 expression showed a significant prognostic value for overall survival being associated with cytarabine resistance (Lin et al., 2019). In this context, we investigate the potential of oxidative stress parameters as predictive biomarkers of response to ESA treatment in MDS patients.
Materials and Methods
Study Population
This study enrolled 66 MDS patients at diagnosis from October 2012 to March 2014. MDS patients were diagnosed according to the World Health Organization 2016 classification of myeloid neoplasms (Arber et al., 2016) in the following subtypes: MDS with single lineage dysplasia (MDS-SLD), MDS with multilineage dysplasia (MDS-MD), MDS with ring sideroblasts (MDS-RS), and MDS with excess blasts (MDS-EB). Patients were stratified according to IPSS-R in lower risk and higher-risk patients (Cazzola, 2020). Biodemographic (age and gender) and clinical data, when available, were obtained from medical records.
The Ethics Committee of the Faculty of Medicine of the University of Coimbra (Coimbra, Portugal) approved the research procedures, and the study was conducted following the Declaration of Helsinki. Before enrollment, participants provided their informed consent for participation. The international ethical guidelines of confidentiality, anonymity of personal data, and abandonment option, in case of expressed, will were be followed.
Sample Preparation
Peripheral blood samples were collected at diagnosis, after fasting, into sodium heparin tubes. Samples were immediately centrifuged; plasma and red blood cells (with a concentration of hemoglobin adjusted at 100 g/l) were stored frozen at -20°C until analysis, as previously described (Baldeiras et al., 2010). Some oxidative stress parameters were normalized to total plasma cholesterol.
Uric Acid Determinations
Plasmatic levels of uric acid were determined by a colorimetric method (Barham and Trinder, 1972) based on the reduction of uric acid by the uricase enzyme. In this reaction, hydrogen peroxide is released and forms a chromogenic compound evaluated spectrophotometrically at 550 nm.
Vitamin A and E Measurements
The plasmatic levels of vitamins A (vit A) and E (vit E) were assessed in lipid extracts obtained from plasma samples and quantified by high-performance liquid chromatography (HPLC) using an analytic column spherisorb ODS1-5 μm (250 mm × 4.6 mm), eluted at 2.5 ml/min with a water solution of methanol (90%), at 45°C, and detected in a spectrophotometer (Gilson) at 340 nm (for vit A) or 295 nm (for vit E). The erythrocytic vitamin E content was extracted in n-hexane and quantified by reverse-phase HPLC (Vatassery et al., 1978; De Leenheer et al., 1979), using an analytic column spherisorb S10w (250 mm × 4.6 mm), eluted at 1.5 ml/min with n-hexane modified with 0.9% of methanol, and detected by spectrophotometry at 287 nm (Gilson).
Oxidized and Reduced Glutathione Quantification
The erythrocytic reduced glutathione (GSH) and oxidized glutathione (GSSG) were also evaluated by HPLC with fluorimetric detection (excitation at 385 nm, and emission at 515 nm), using the Immunodiagnostik kit (Immunodiagnostik AG, Bensheim, Germany), as described by the manufacturer.
Antioxidant Enzymes Activity Determination
The glutathione peroxidase (GPX) activity in red blood cells was evaluated by spectrophotometry using an indirect determination method and tert-butyl hydroperoxide as substrate (Paglia and Valentine, 1967). The GSSG formation was examined through the quantification of reduced nicotinamide adenine dinucleotide phosphate (NADPH) oxidation at 340 nm in a thermostated spectrophotometer UVIKON 933 UV/Visible. The activity of glutathione reductase (GR) in red blood cells was evaluated by spectrophotometry at 340 nm (Goldberg and Spooner, 1983), using GSSG as a substrate, and monitoring its reduction to GSH through the assessment of NADPH oxidation at 37°C in a spectrophotometer UVIKON 933 UV/Visible.
Plasmatic Peroxide Quantification
The plasmatic levels of peroxides were quantified using the kit Thermo Scientific Pierce Quantitative Peroxide Assay Kit – lipid-compatible formulation (Life Technologies), according to the manufacturer, in a SynergyTM multi-mode microplate reader (BioTek Instruments).
Total Antioxidant Status Evaluation
The plasmatic total antioxidant status (TAS) was assessed by a chromogenic method (Randox Laboratories) based on the plasma capacity to inhibit the formation of the ABTS+ radical cation (2,2′-azino-di-[3-etilbenzotiazolin sulfonate]), and detected at 600 nm as described by the manufacturer.
Lipid Peroxidation Measurements
The plasmatic and erythrocytic lipid peroxidation were assessed by the formation of thiobarbituric acid (TBA) adducts of malondialdehyde (MDA), separated by HPLC (Gilson), and quantified fluorimetrically using the ClinRep complete kit (RECIPE), as described by the manufacturer. Briefly, 100 μl blank, standard, controls, and patients’ samples were first derivatized at 100°C for 60 min in a glass light-protected vial. After cooling, samples were neutralized, precipitated, and centrifuged at 10,000 g for 5 min. Finally, 20 μl of the supernatants were injected into the HPLC and the MDA adducts were determined fluorimetrically (excitation at 515 nm, and emission at 553 nm; FP-2020/2025, Jasco, Tokyo, Japan).
Plasmatic Nitric Oxide Quantification
The plasmatic levels of nitric oxide (NO) were determined by a photometric method (Roche Diagnostics GmbH) based on the detection of its oxidation products, nitrite and nitrate (Titheradge, 1998). First, the nitrate present in the ultra-filtrated plasma was reduced to nitrite, which then reacted with sulphanilamide and N-(1-naphthyl)-ethylenediamine dihydrochloride to give a red-violet diazo dye, detected by spectrophotometry at 550 nm.
Plasmatic 8-Hydroxy-2-Deoxyguanosine (8-OHdG) Quantification
The plasmatic levels of 8-OHdG were measured using a competitive quantitative ELISA Kit (8-hydroxy-2-deoxyguanosine ELISA Kit, Abcam), according to manufacturer instructions, in a SynergyTM multi-mode microplate reader (Gonçalves et al., 2017).
NFE2L2 and KEAP1 Genes Expression Analysis
Total RNA was isolated from peripheral blood samples obtained from MDS patients using the Quick-RNATM MiniPrep (Zymo Research), according to the manufacturer’s instructions. Real-time quantitative PCR (qPCR) studies were performed to quantify the NFE2L2 and KEAP1 genes (normalized to HPRT gene). After extraction, total RNA was reverse transcribed into cDNA with SuperScriptTM III Reverse Transcriptase kit (Invitrogen, Life Technologies) using a 1:1 mix of random hexamers and oligo-dTs. Then, NFE2L2, KEAP1, and HPRT genes were amplified in duplicate using SsoFastTM EvaGreen® Supermixe (BioRad) in an IQ5 Real-Time PCR System (BioRad). To assess the reaction efficiency, standard curves were created for all studied genes using a serially diluted control sample. For each experiment was included a no template control (NTC) as the negative control. The specificity of qPCR reactions was confirmed using the melting curve analysis. The relative expression of the target genes was analyzed using the 2ΔCt formula.
Statistical Analysis
Statistical analysis was performed using SPSS version 26.0, and graphics were constructed through GraphPad Prism version 6.0. Continuous variables were expressed as mean ± SEM (standard error of the mean), unless otherwise specified, and categorical variables as numbers and percentages. To account for changes in plasma lipid content, vitamin A and E were expressed in relation to cholesterol because lipids affect the concentration of these vitamins. All statistical analyses were two-sided, and a p < 0.05 was considered statistically significant. Normality was assessed by the Kolmogorov-Smirnov test. For normally distributed continuous variables, the Student’s t-test was performed to assess the statistical significance of the difference between means of ESA responders and non-responders. When continuous variables did not show normal distribution, the Mann-Whitney U was used. Logistic regression, adjusted to age and gender, was performed to establish the factors that were associated with ESA response. Factors that showed a significant association in the univariate analysis were included in the multivariate logistic regression to determine the associated independent variables. The calibration of logistic models was assessed by the Hosmer-Lemeshow goodness-of-the-fit test. Results from logistic analysis were expressed as adjusted odds ratios (OR) with the corresponding 95% confidence interval (CI). In this analysis, the OR corresponds to a 1-unit increase in the explanatory variable. Finally, receiver operating characteristic (ROC) curves were performed to evaluate the accuracy of significant parameters as ESA therapy response biomarker. The area under the curve (AUC) was calculated as a measurement of the accuracy of the test, and an optimal cut-off point was determined as the value of the parameter that maximized the sum of specificity and sensitivity (Youden’s J Index).
Results
Biodemographic and Clinical Characteristics of MDS Patients
The present study enrolled 66 patients diagnosed with MDS [median age of 74 years (range 22–89), 60.1% (n = 40) females and 39.9% (n = 26) males]. Table 1 show the biodemographical and clinical characteristics of MDS participants. MDS patients were diagnosed according to WHO classification (2016). Nine (13.6%) were diagnosed with MDS-SLD, 10 (15.2%) with MDS-RS, 40 (60.6%) with MDS-MD, and seven (10.6%) with MDS-EB. The IPSS-R prognostic score was lower in 38 (57.6%) patients, higher in 13 (19.7%), and not reported in 15 (22.7%). In fifteen MDS patients cytogenetic abnormalities were detected, having 37 patients good cytogenetic, 11 intermediate, and two poor. MDS patients had been transfused with a median of 24 U/l of sEPO, ranging from 4 to 494 U/l. From these patients, 44 (66.7%) received ESA-treatment as supportive care, and 20 (45.5%) did not respond to treatment. All patients that received ESA-treatment had sEPO levels below 500 U/l (median of 35 U/l, ranging from 4 to 494 U/l).
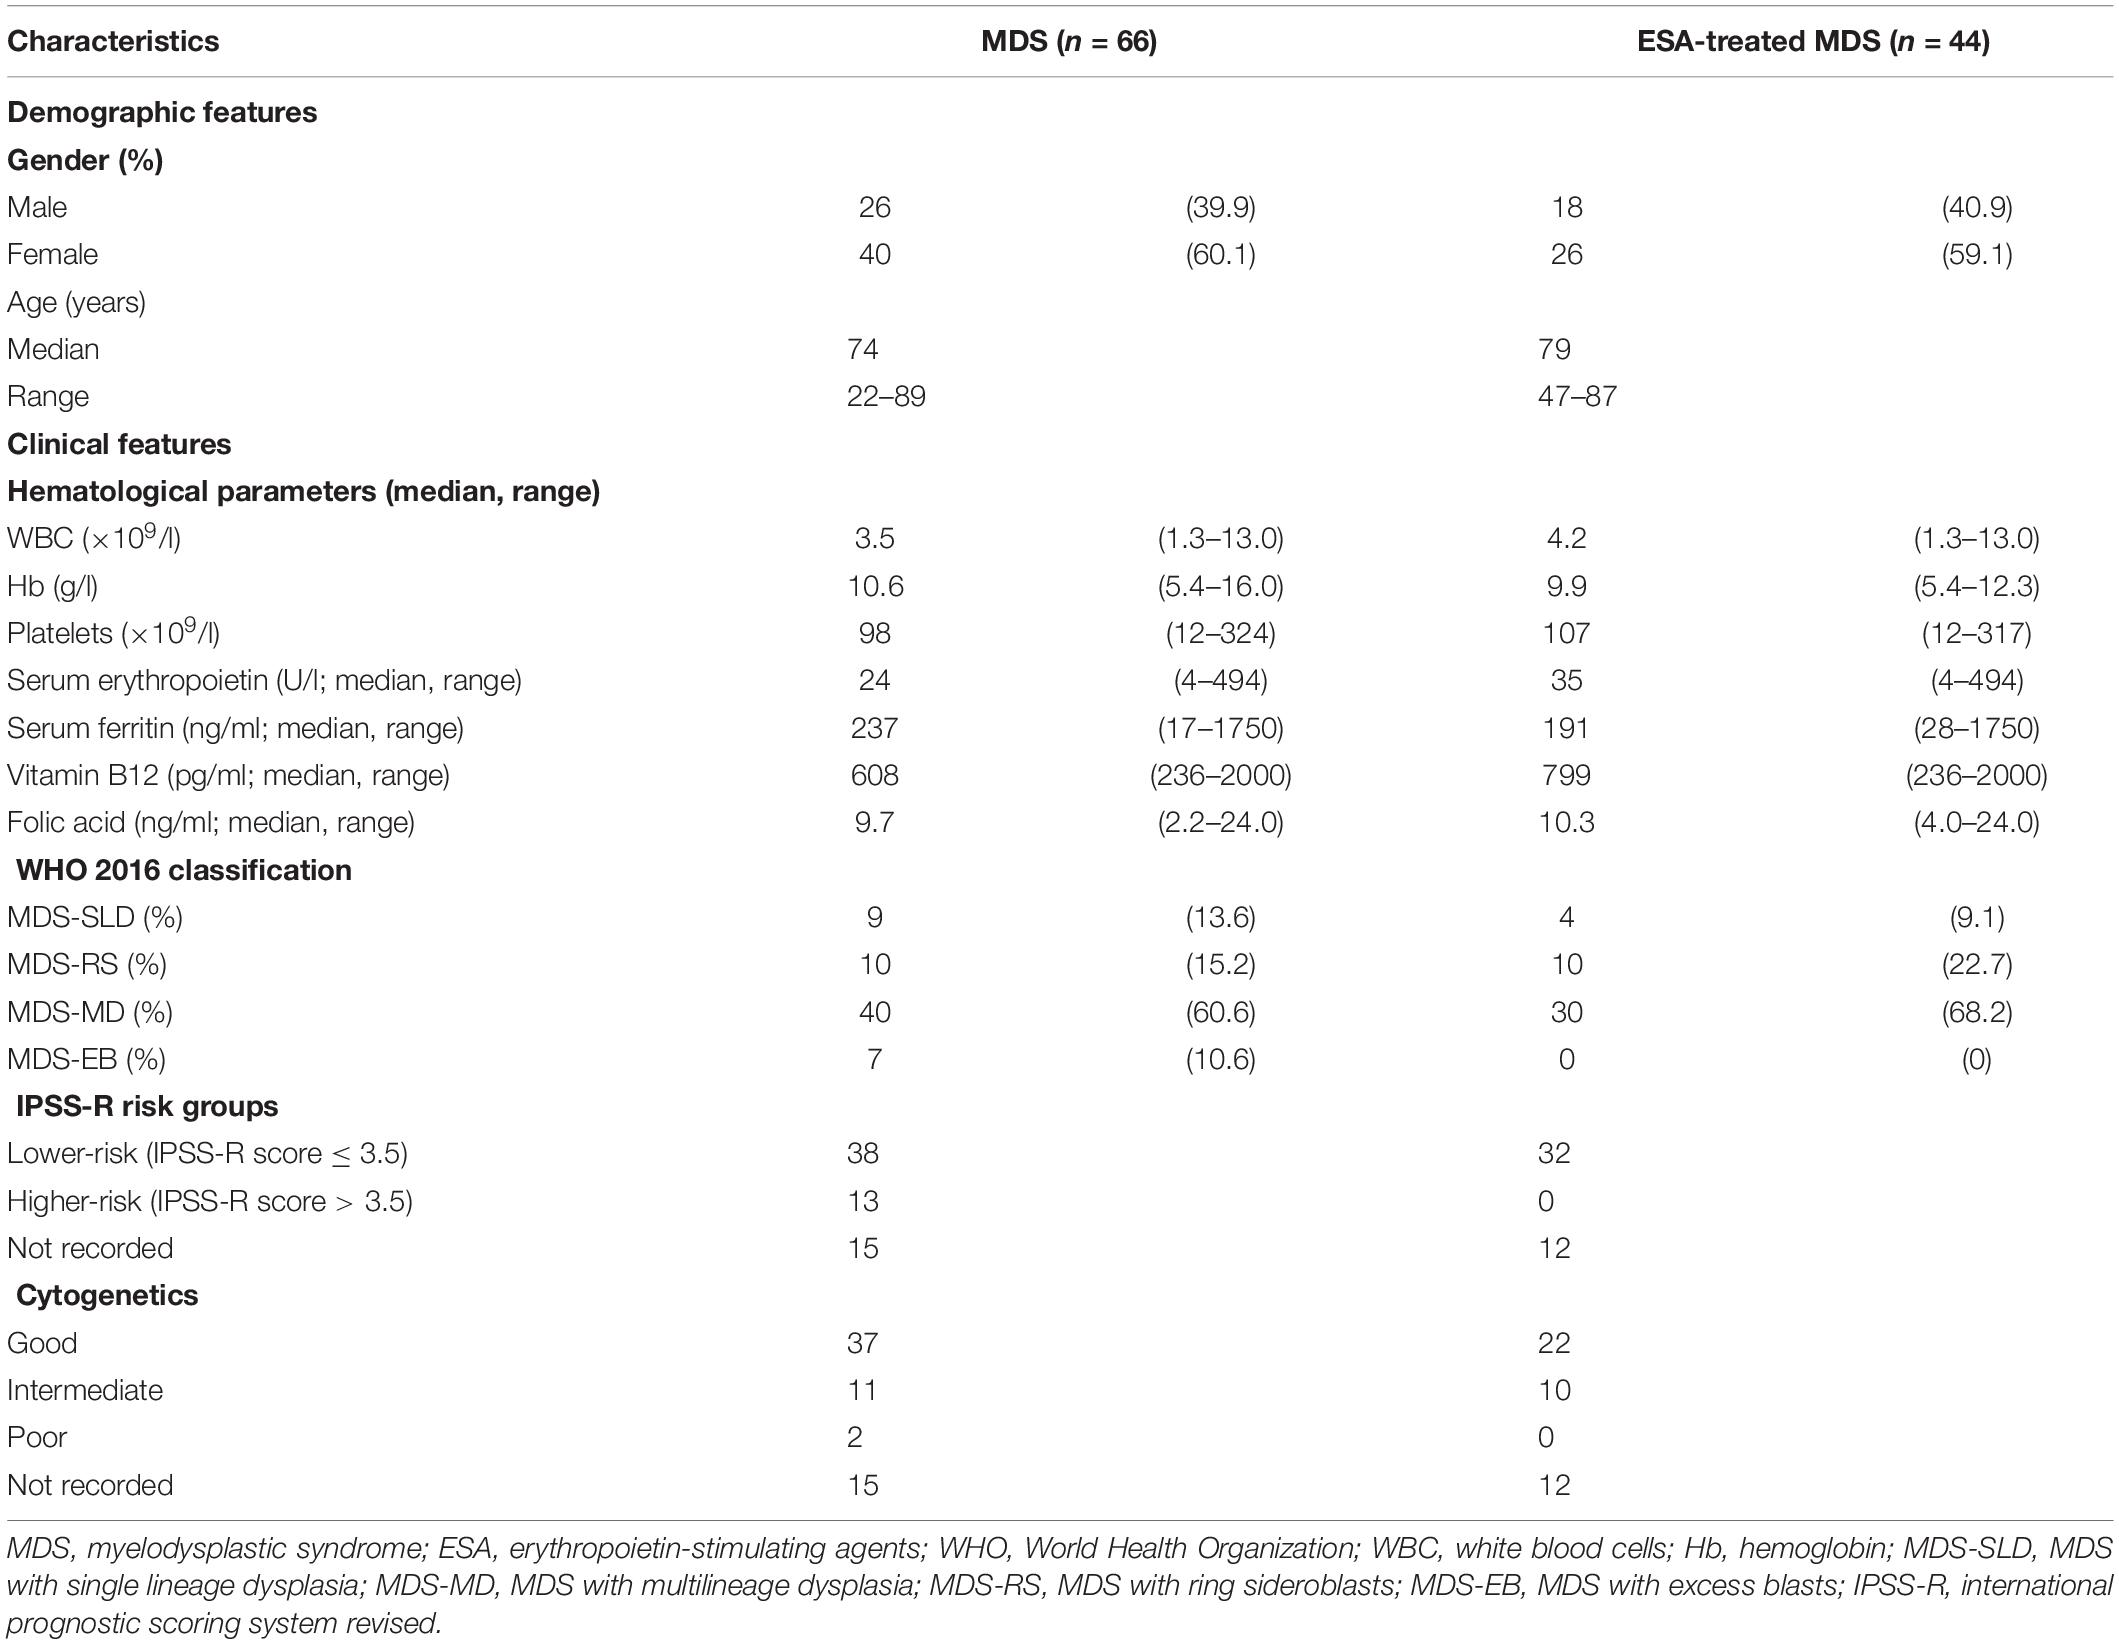
Table 1. Biodemographic and clinical characteristics of MDS patients.
Oxidative Stress Levels in ESA-Treated Patients
To investigate the involvement of oxidative stress in the response to ESA-treatment, the plasmatic levels of reactive oxygen/nitrogen species (peroxides and NO), non-enzymatic antioxidant defenses [uric acid, vitamin E (plasmatic and erythrocytic), vitamin A, GSH, GSSG, TAS], enzymatic defenses (erythrocyte GPX and GR activities), and the levels of macromolecules oxidative damage [8-OH-dG and MDA (plasmatic and erythrocytic)] were compared between patients that responded and did not respond to ESA treatment (Figure 1 and Table 2). The peroxides/TAS and NO/TAS ratios were calculated to analyze the oxidative stress status of MDS patients. Moreover, we analyzed the expression of NFE2L2 gene, that encode the transcription factor NRF2 (a redox regulator), and its negative regulator, the KEAP1 gene.
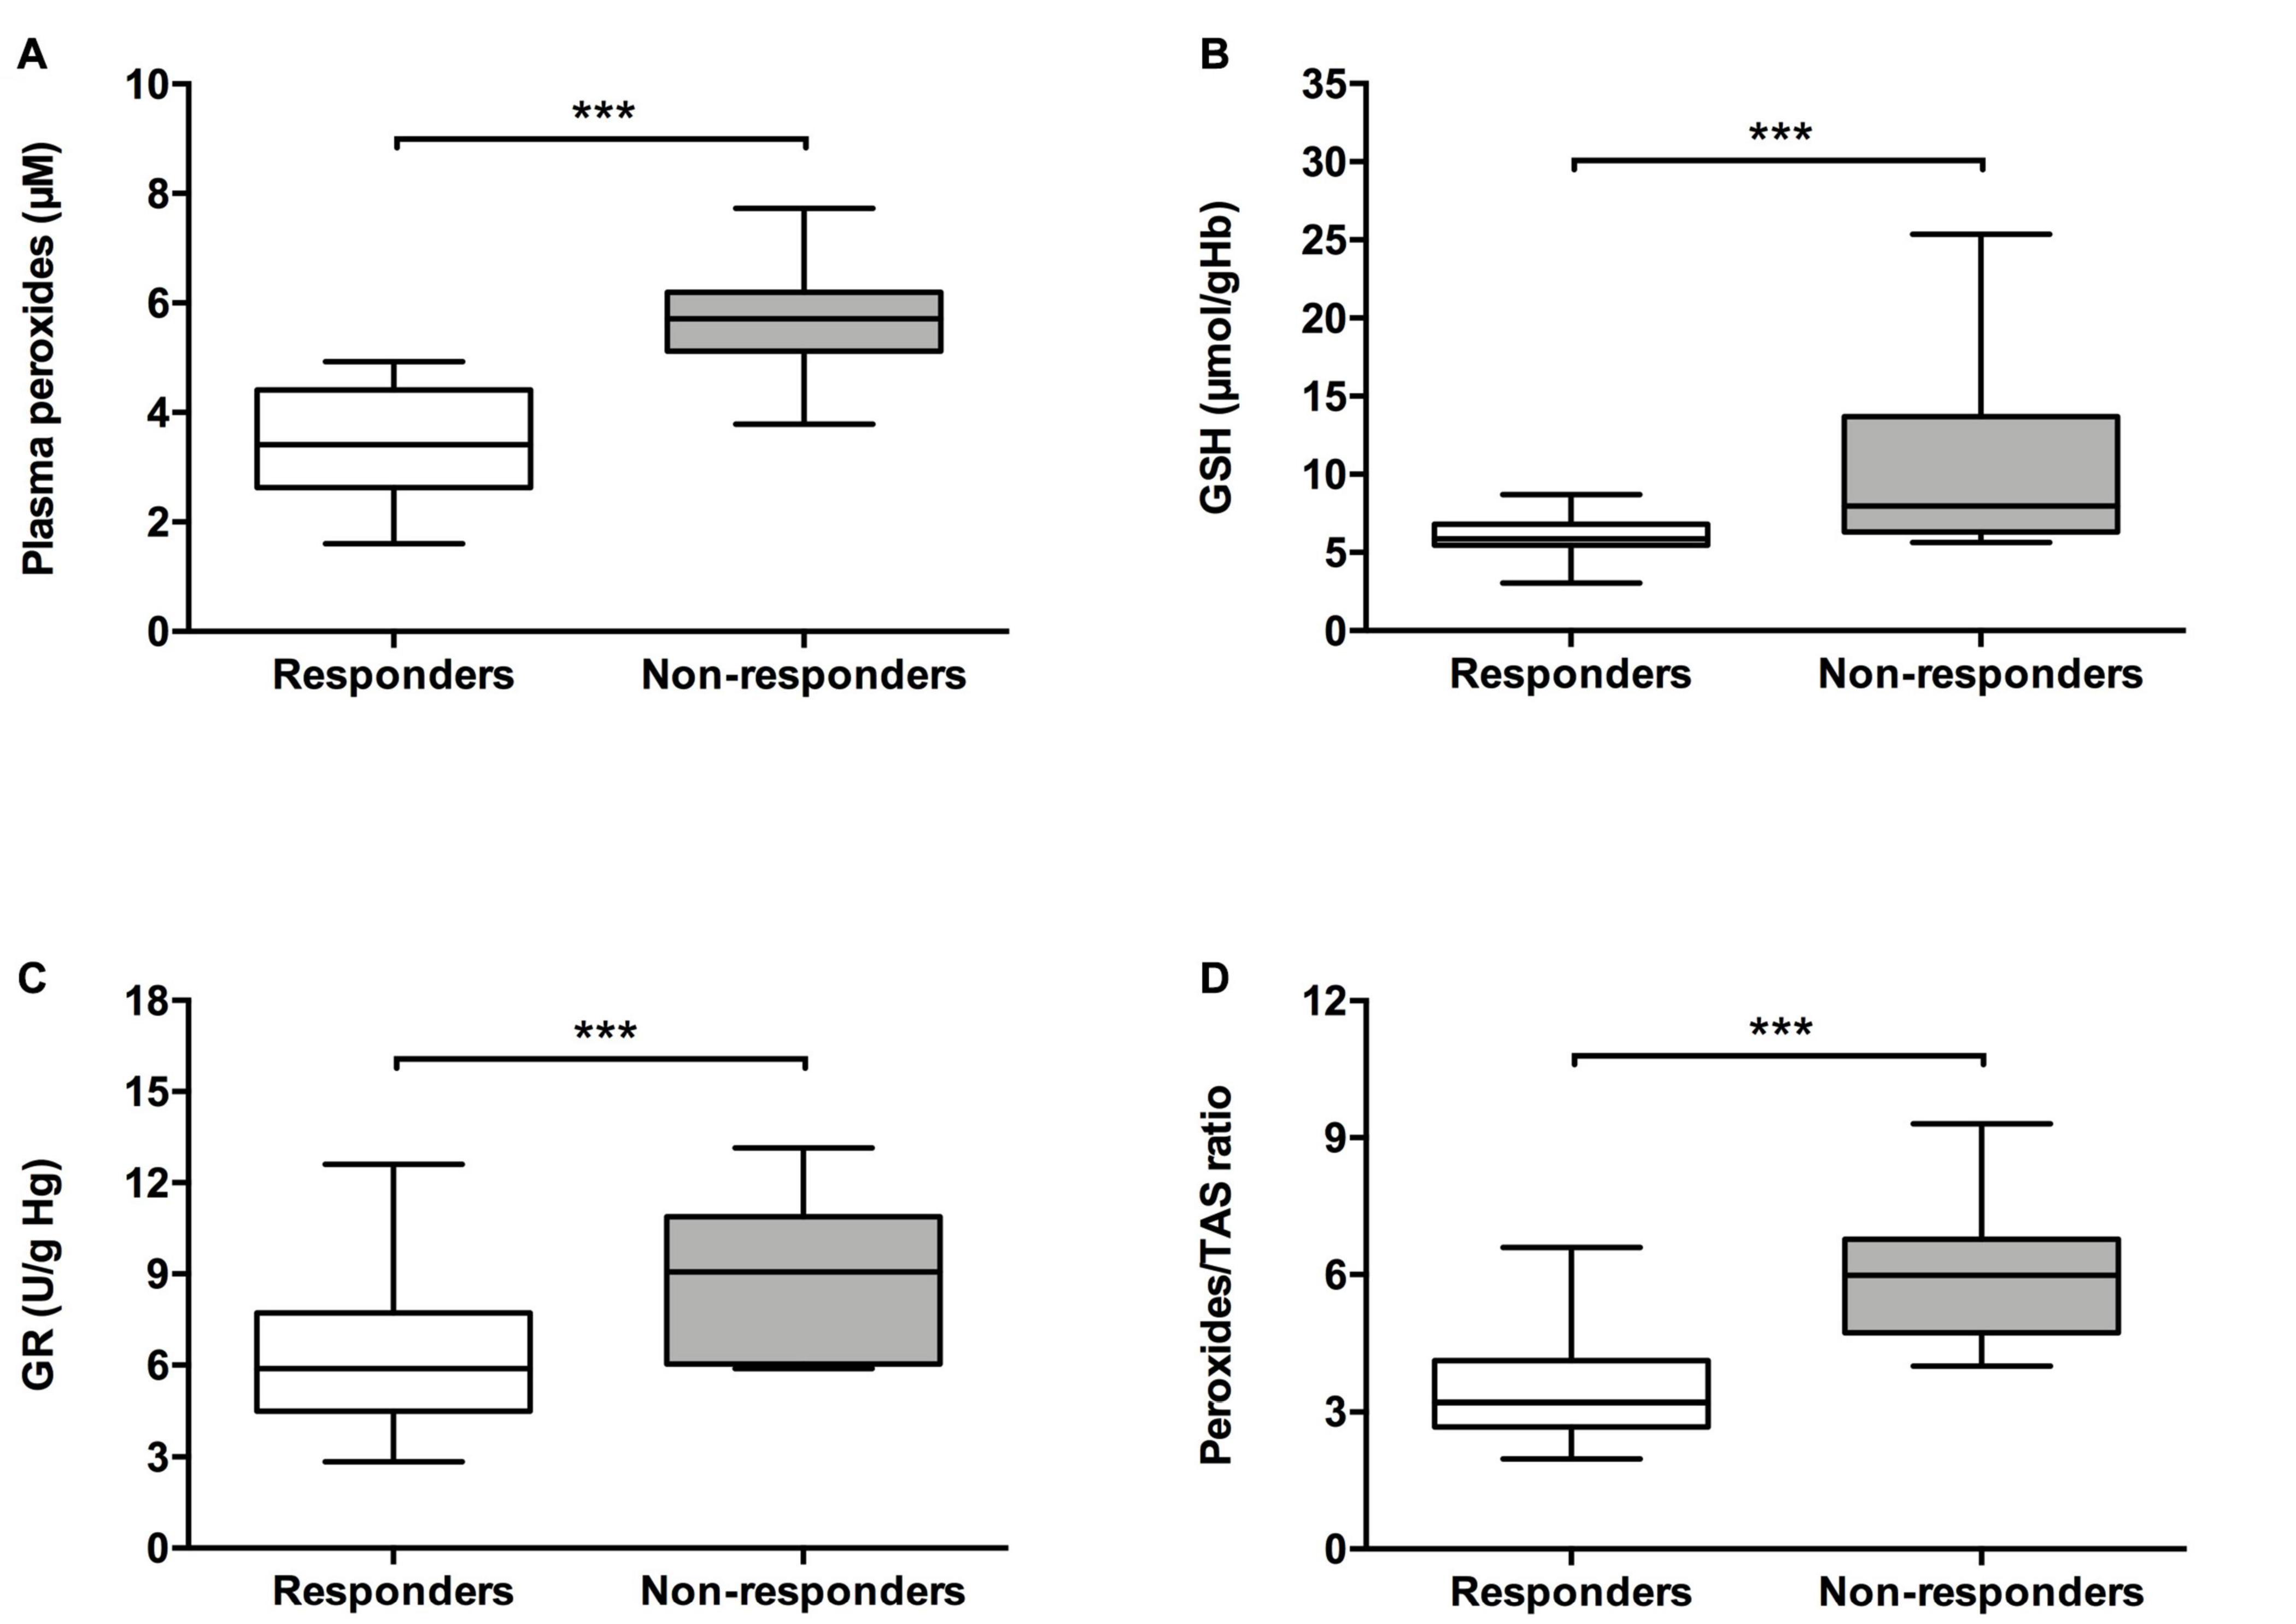
Figure 1. Analysis of oxidative stress parameters in patients with myelodysplastic syndrome according to their response to ESA treatment. The following oxidative stress levels are represented: (A) plasmatic peroxides, (B) erythrocyte reduced glutathione (GSH), (C) erythrocyte glutathione reductase (GR), and (D) peroxides/total antioxidant status (TAS) ratio. ***p ≤ 0.001.
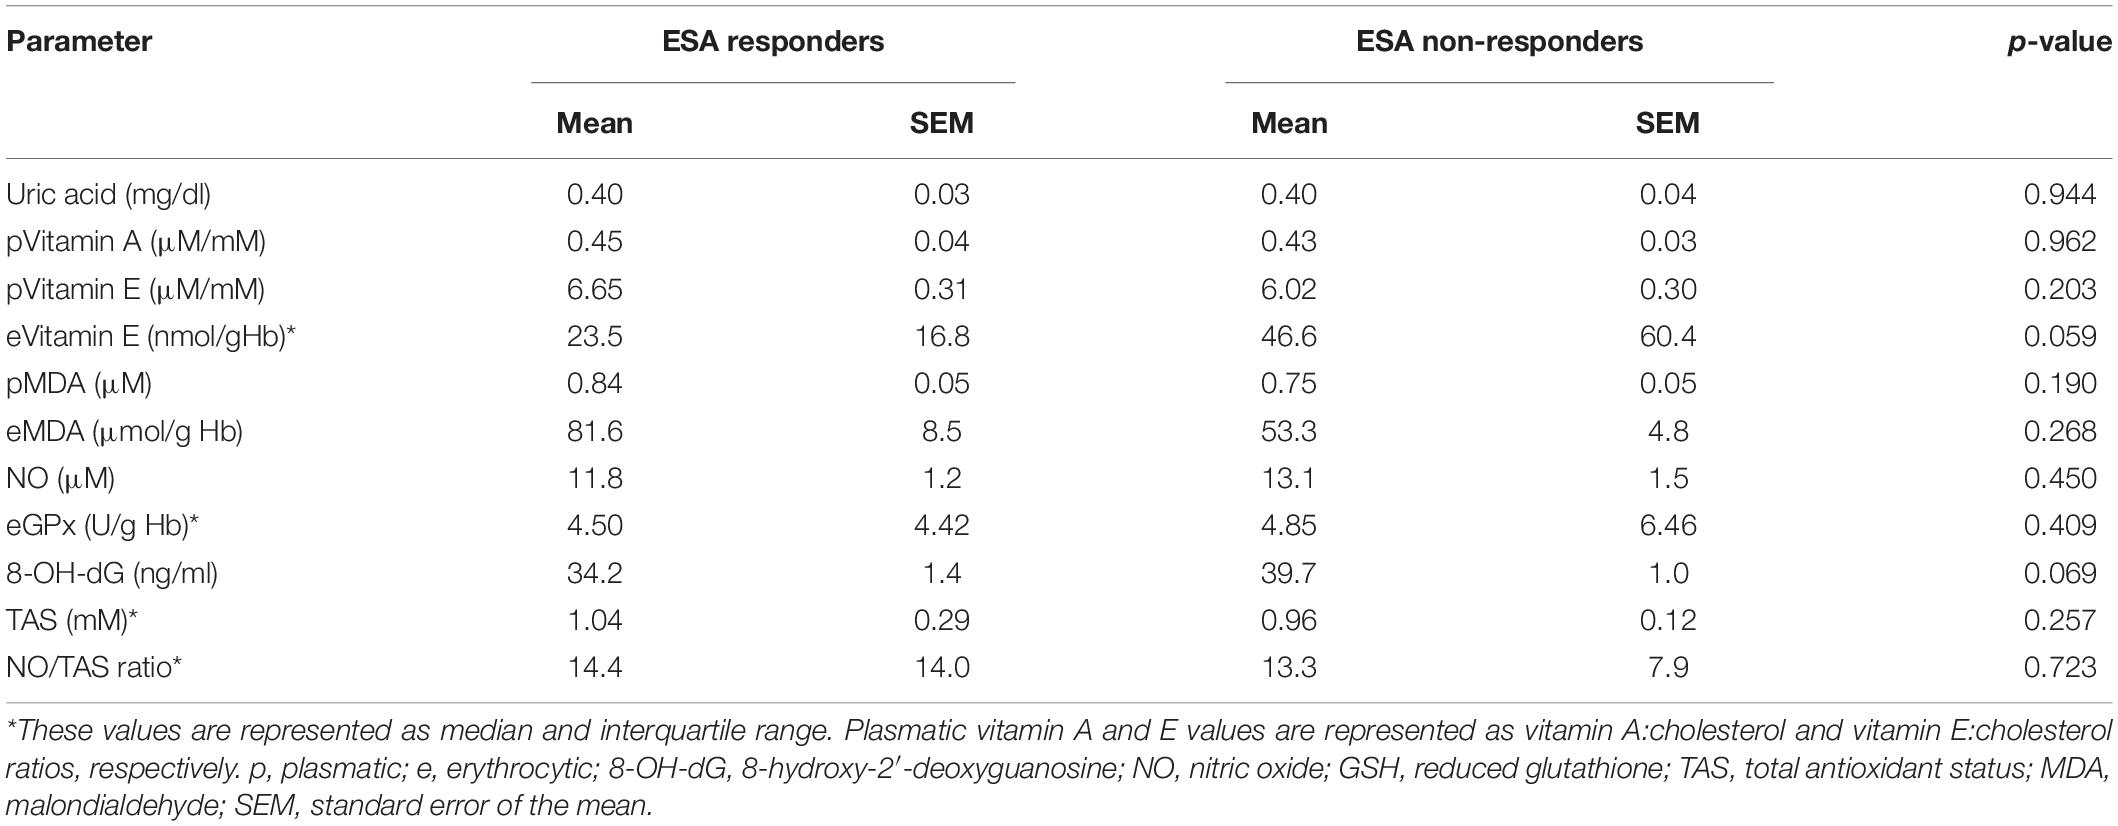
Table 2. Analysis of oxidative stress parameters in patients with myelodysplastic syndrome according to ESA response treatment.
As shown in Figure 1, patients that respond to ESA treatment showed lower levels of plasma peroxides (3.48 ± 0.21 μM; p < 0.001), cellular GSH [median (Med): 5.93, interquartile range (IqR): 1.39 μmol/g Hb; p < 0.001], and cellular GR activity (Med: 5.89, IqR: 3.39 U/g Hb; p = 0.001) in comparison to patients who did not respond to ESA treatment (peroxides: 5.65 ± 0.21 μM; GSH: Med: 7.99, IqR: 7.39 U/g Hb; GR: Med: 9.06, IqR: 4.83 U/g Hb). ESA responders also showed lower levels of peroxides/TAS ratio (3.60 ± 0.24, p < 0.001) compared to those without response (6.17 ± 0.38 μM). Moreover, MDS patients that respond to ESA treatment showed higher expression levels of the NFE2L2 gene (Med: 4.544, IqR: 6.150; p = 0.001) than those that did not respond to ESA treatment (Med: 1.945, IqR: 2.590; Figure 2). No differences were observed between MDS subtypes.
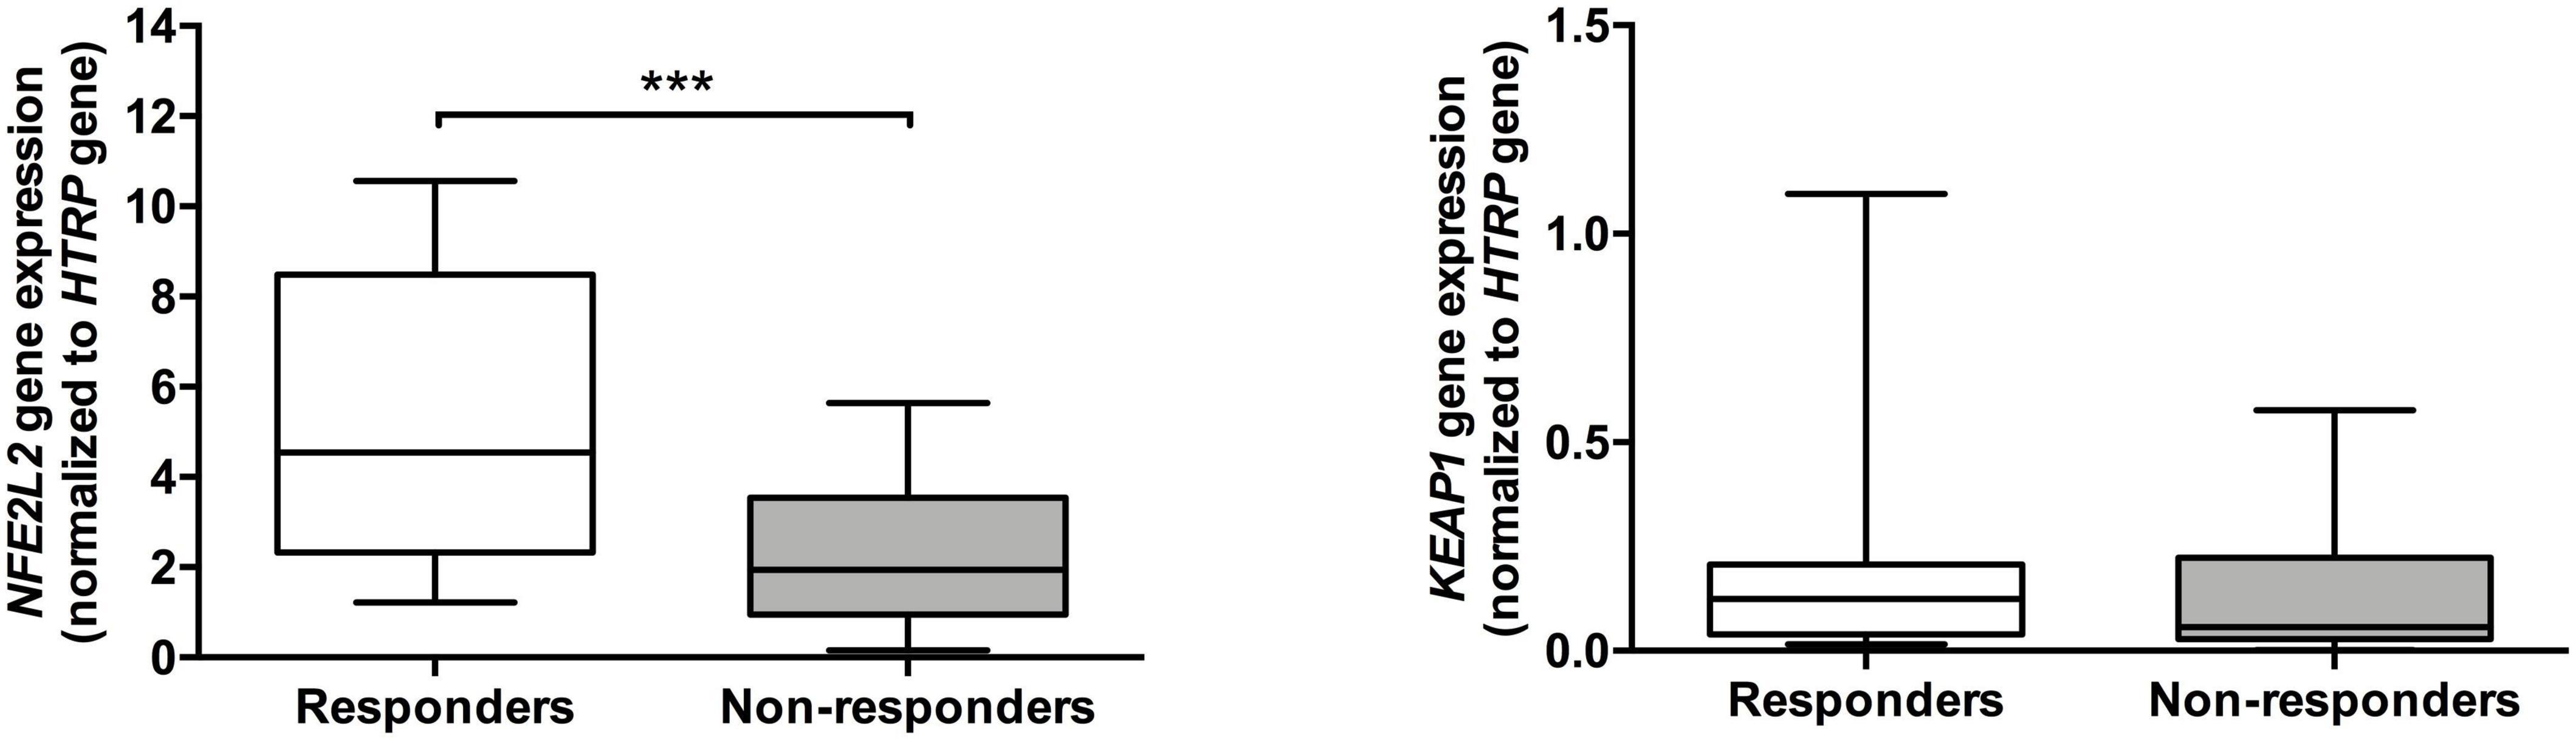
Figure 2. Expression of NFE2L2 and KEAP1 genes in patients with myelodysplastic syndrome according to their response to ESA treatment. The RNA expression for NFE2L2 and KEAP1 genes were normalized to the HPRT gene (endogenous control). ***p ≤ 0.001.
Oxidative Stress Levels as Predictive Biomarker of ESA Treatment Response
The association between oxidative stress parameters and ESA response was analyzed through logistic regression (Table 3). The levels of plasmatic peroxides, the peroxides/TAS ratio, the cellular GSH and GR activity were significantly associated with ESA treatment in the univariate analysis. In the multivariate analysis, peroxides were significantly associated with ESA non-response [Odds ratio (OR): 0.111; 95% confidence interval (CI): sensitivity: 92%; specificity: 90%; positive predictive value (PPV): 96%; negative predictive value (NPV): 80%; p = 0.007]. We did not find any association between sEPO levels and the response to ESA treatment.
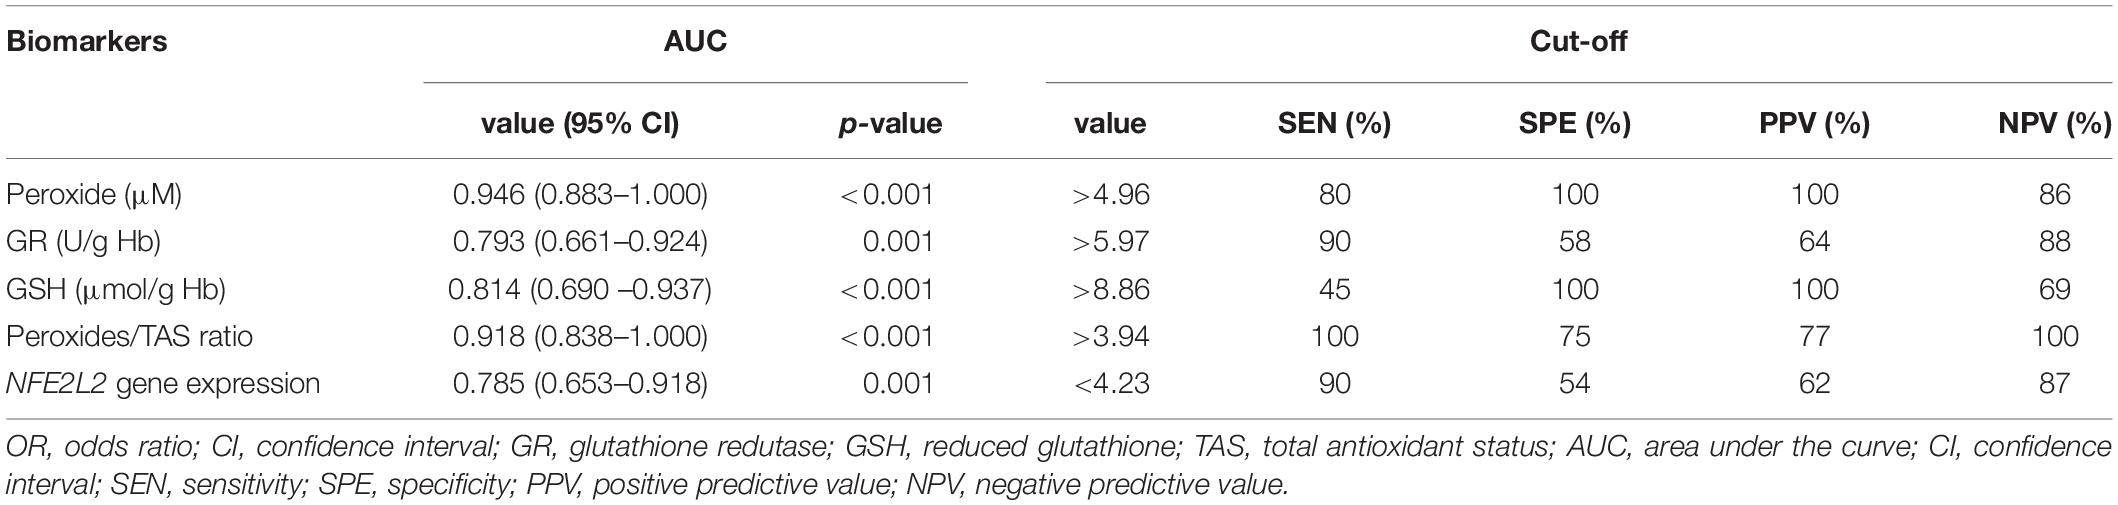
Table 3. Significant oxidative stress parameters as ESA response biomarker in myelodysplastic syndrome.
The potential of oxidative stress parameters as predictive biomarkers of response to ESA treatment was assessed by ROC curves (Table 4 and Figure 3). The plasmatic peroxides levels and the peroxides/TAS ratio were the most accurate biomarker for ESA response, with an area under the curve (AUC) of 0.946 [95% CI: 0.883–1.000; p < 0.001] and 0.918 (95% CI: 0.838–1.000; p < 0.001), respectively. The peroxides levels higher than 4.96 μM (sensitivity: 80%; specificity: 100%; PPV: 100%; NPV: 86%) and the peroxides/TAS ratio higher than 3.94 (sensitivity: 100%; specificity: 75%; PPV: 77%; NPV: 100%) were defined as the optimal cut-off values for identify ESA non-responder MDS patients. The GR activity, the GSH levels and the NFE2L2 gene expression also showed potential as ESA response biomarkers. Despite its lower potential, the GSH erythrocytes levels (AUC = 0.814; 95% IC: 0.690–0.937; p < 0.001) show to be also good biomarkers of ESA response. The best GSH cut-off values were 8.86 μmol/g Hb (sensitivity: 45%; specificity: 100%; PPV: 100%; NPV: 69%). The GR activity (AUC: 0.793; 95% CI: 0.661–0.924; p = 0.001; sensitivity: 90%; specificity: 58%; PPV: 64%; NPV: 88%) and the NFE2L2 gene expression levels (AUC: 0.785; 95% CI: 0.653–0.918; p = 0.001; sensitivity: 90%; specificity: 55%; PPV: 62%; NPV: 87%) were considered the biomarkers with lower potential to predict ESA response.
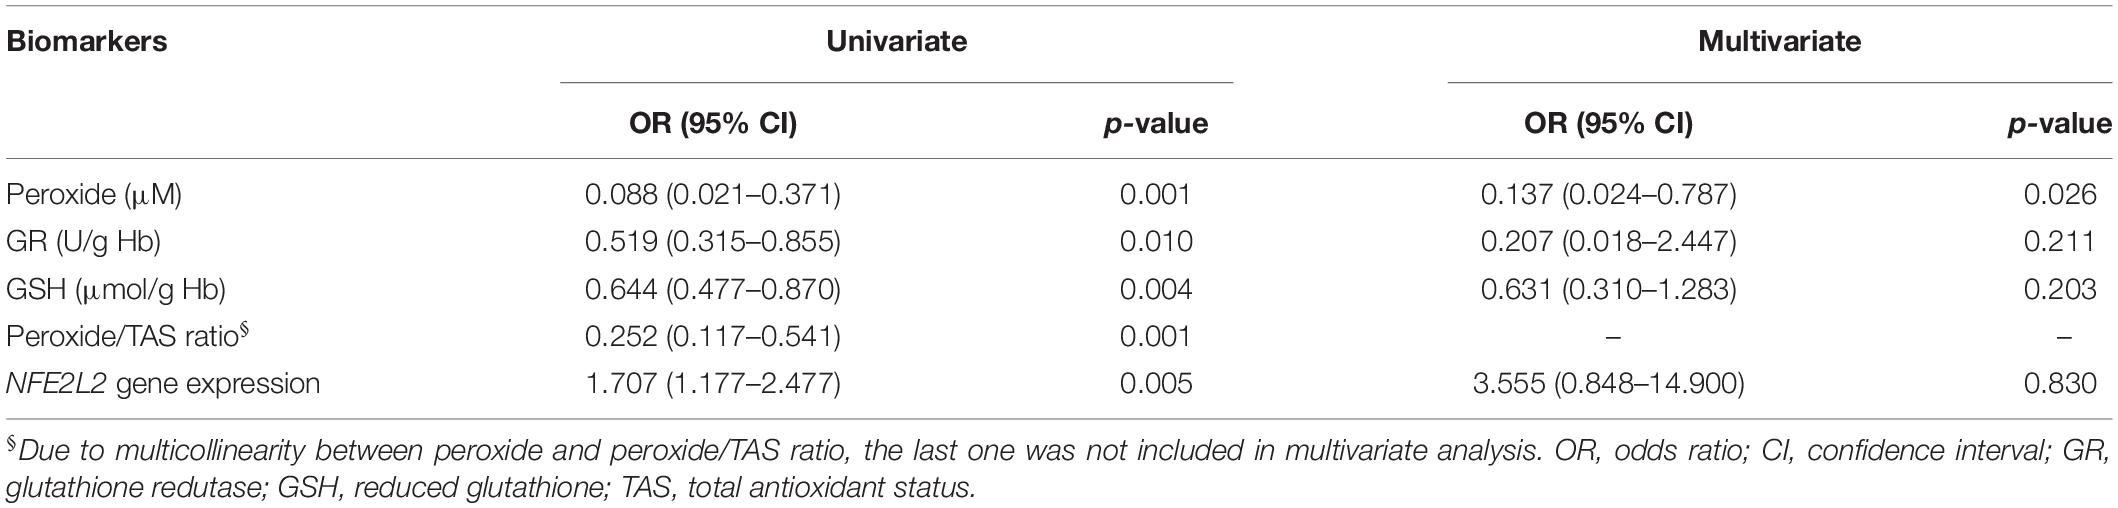
Table 4. Predictive potential of oxidative stress parameters as biomarkers of ESA response.
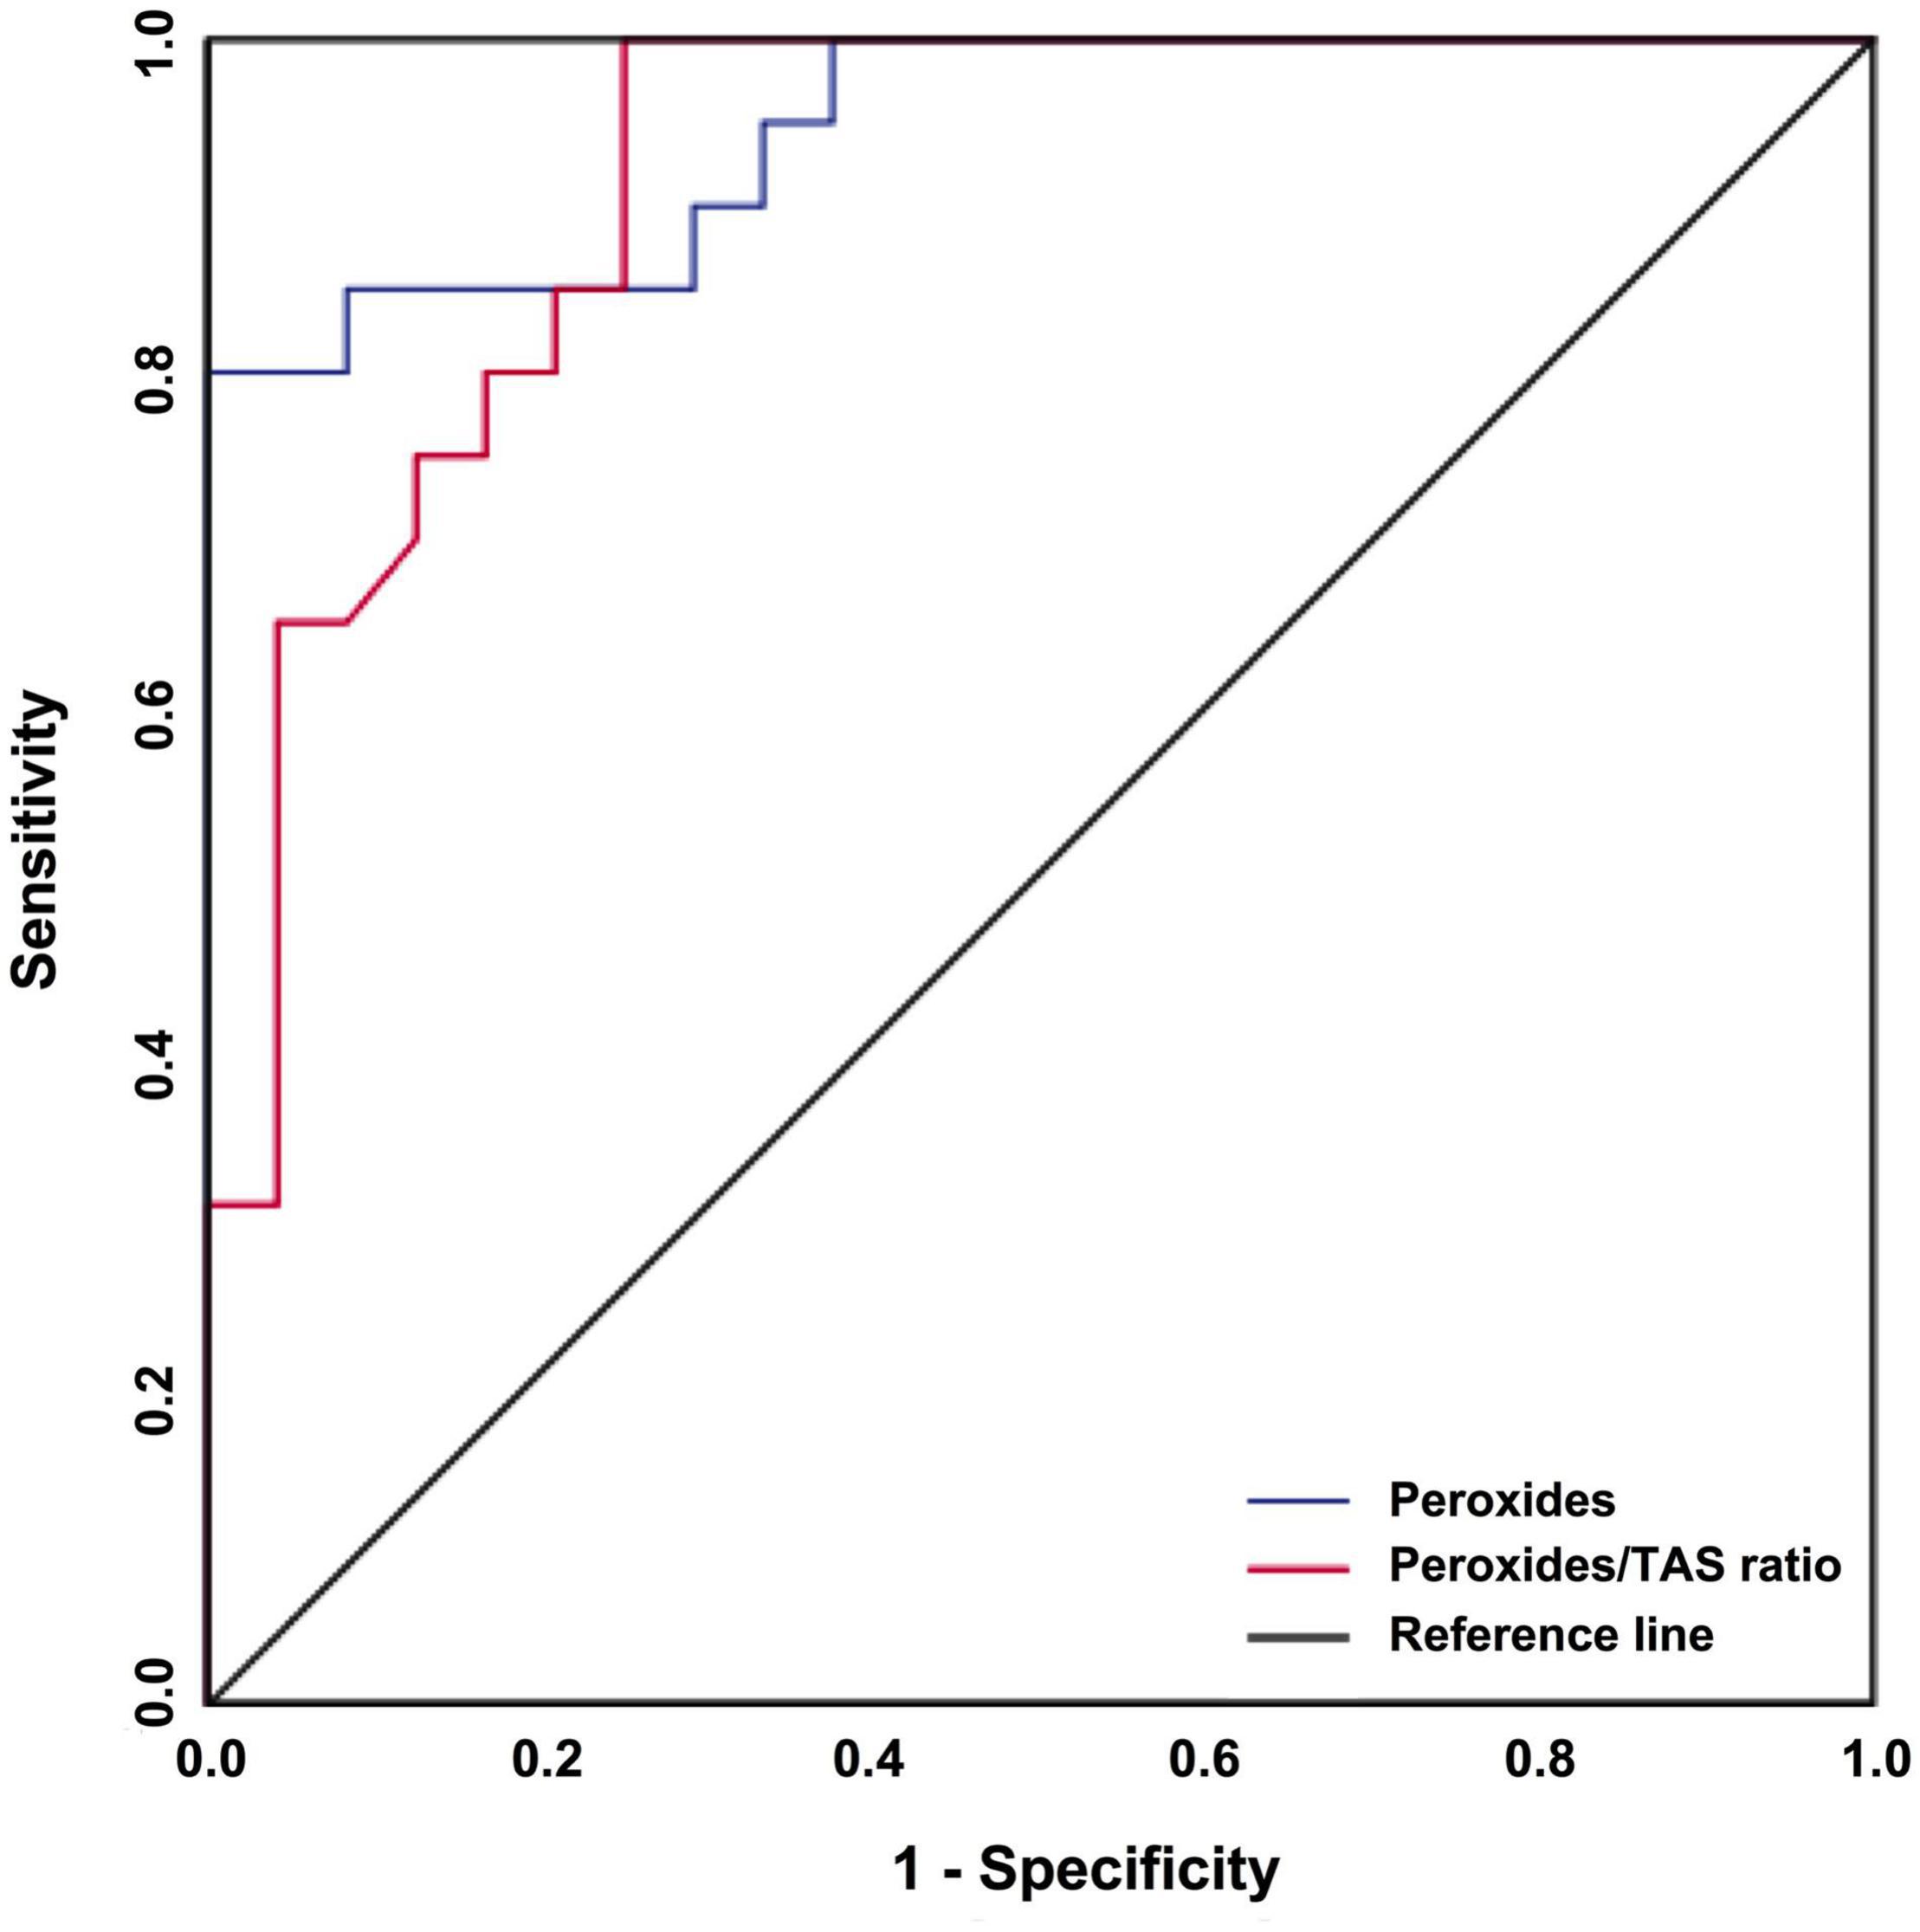
Figure 3. The predictive value of peroxides and peroxides/TAS ratio regarding ESA treatment responses in MDS patients. A ROC curve analysis for peroxides and peroxides/TAS ratio was performed to assess its potential as a biomarker of ESA treatment response.
Discussion
The current study aimed to understand better the mechanisms of resistance to ESA therapy and the influence of oxidative stress in treatment response in lower-risk MDS patients. We found that patients who respond to ESA treatment have lower levels of plasma peroxides, cellular GSH, cellular GR activity, peroxides/TAS ratio, and higher levels of NFE2L2 gene expression in comparison to patients who did not respond to ESA treatment. These parameters are good biomarkers of therapy response, with peroxides levels being the best and accurate biomarker of ESA response. To the best of our knowledge, only one study analyzed the association between oxidative stress and ESA response. In this study, Khalil et al. (2016) found that patients with an end-stage renal disease with lower erythrocyte superoxide dismutase and higher MDA levels show poor response to ESA treatment (Khalil et al., 2016). Here we found that response to ESA treatment is associated with a decrease in peroxides levels and peroxides/TAS ratio and a decrease in GSH levels and GR activity. Although we observed an increase in these antioxidant defenses on non-responders. Globally these patients presented a oxidative stress state that is in accordance with other studies that show that oxidative stress is associated with drug resistance in cancer (Pour Khavari et al., 2018; Maurya et al., 2021). ROS is known for its ability to induce mutations and promote cancer cell growth and anticancer drug resistance. The oxidative stress in cancer cells has been shown to correlate with the aggressiveness of tumors and poor survival of patients with cancer (Trachootham et al., 2009). Oxidative stress is exceptionally important to erythropoiesis and is involved in proliferation, survival, and differentiation of erythroid cell progenitors in response to EPO binding to erythropoietin receptor, and can also induce cell death by apoptosis (Ghaffari, 2008). Since oxidative stress has deleterious effects on erythroid progenitor cells, the increase in oxidative stress ratio and peroxides could induce erythrocytes apoptosis/inefficient erythropoiesis and, therefore, justify the non-responder phenotype observed in this study. Additionally, the transcription factor NRF2 is considered a prognostic biomarker in cancer, with very high levels associated with poor response to anticancer drugs (Frijhoff et al., 2015). However, we found that MDS patients that did not respond to ESA treatment have lower levels of NFE2L2, the gene that encode the NRF2 transcription factor. This result is in agreement with the higher levels of peroxides and oxidative stress ratio observed in these patients. Furthermore, we previously found that oxidative stress parameters and the Δψmit are diagnostic biomarkers and survival predictors for MDS, with GSH levels providing the most accurate and reliable indicator of MDS diagnosis and survival (Gonçalves et al., 2015). Additionally, in another study we found that GSH levels correlate with the relapse and survival of acute lymphoblastic leukemia patients (Sarmento-Ribeiro et al., 2012).
Several studies have examined factors, in lower-risk MDS patients, that could be used to predict response to ESA treatment and to shape treatments more efficiently. One of the most studied factors in response to ESAs associated with or without G-CSF is the sEPO levels, and numerous studies have reported correlations between sEPO and therapy response. The majority of these studies used a sEPO cutoff of 100 U/L, with response rates ranging from 50 to 93% for patients with sEPO < 100 U/L versus 12–58% for patients with sEPO > 100 U/L (Park et al., 2020). In the present study we did not find any association between sEPO and ESA response, but the response rates were 58% for patients with sEPO < 100 U/L and 38% for patients with sEPO > 100 U/L. However, in a previous study including 102 MDS patients, we found that sEPO is a predictive factor for response to therapy with subcutaneous EPO (Cortesão et al., 2015). Several other factors have also been studied including absolute neutrophil count (Stasi et al., 2005), cytopenia levels (Molteni et al., 2013), hemoglobin levels (Stasi et al., 2005; Santini et al., 2013; Houston et al., 2017), platelet count (Stasi et al., 2005; Santini et al., 2013), age (Stasi et al., 2005; Houston et al., 2017), gender (Stasi et al., 2005; Houston et al., 2017), burst-forming unit-erythroid levels (Frisan et al., 2010), bone marrow blasts (Stasi et al., 2005; Frisan et al., 2010; Santini et al., 2013), IPSS status (Stasi et al., 2005; Frisan et al., 2010; Santini et al., 2013), p-ERK1/2 levels (Frisan et al., 2010), serum TNF-alpha (Stasi et al., 2005), somatic mutations (Kosmider et al., 2016), among others.
This work has some limitations that must be taken into account. We recruited almost all patients newly diagnosed with MDS during recruitment time, but we were only able to study a relatively small cohort of patients, especially those treated with ESA. The oxidative stress parameters were only analyzed in peripheral blood samples (plasma, total leucocytes, and/or erythrocytes). Although MDS is a clonal stem cell disorder, the same studies must be repeated in erythroid precursor cells obtained from bone marrow samples. However, this fact may also be one of the work strengths, since peripheral blood is a more accessible and less invasive biological sample.
In conclusion, the present report demonstrated a correlation between oxidative stress levels and the response to ESA treatment in lower-risk MDS patients. We found that peroxides levels and peroxides/TAS ratio are good and accurate peripheral biomarkers that predict patients that will not respond to ESA therapy.
Data Availability Statement
The raw data supporting the conclusions of this article will be made available on request to the corresponding author.
Ethics Statement
The studies involving human participants were reviewed and approved by Ethics Committee of the Faculty of Medicine of the University of Coimbra Azinhaga de Santa Comba, Coimbra, Portugal. The patients/participants provided their written informed consent to participate in this study.
Author Contributions
AG and AS-R conceived the study. AG, RA, IB, AP, and JJ performed the experiments. EC and BM recruited and collected patient data. AG and BO analyzed and interpreted the data. AG drafted the manuscript. AS-R and JN reviewed and edited the manuscript. All authors read and approved the final manuscript.
Funding
The present work was supported by CIMAGO – Center of Investigation on Environment, Genetics and Oncobiology, Faculty of Medicine, University of Coimbra, Portugal and by National Funds via FCT (Foundation for Science and Technology) through the Strategic Project UID/NEU/04539/2019, COMPETE-FEDER (POCI-01-0145-FEDER-007440), UIDB/04539/2020, and UIDP/04539/2020 (CIBB). FCT supported JJ with a grant (SFRH/BD/145531/2019).
Conflict of Interest
The authors declare that the research was conducted in the absence of any commercial or financial relationships that could be construed as a potential conflict of interest.
References
Arber, D. A., Orazi, A., Hasserjian, R., Thiele, J., Borowitz, M. J., Le Beau, M. M., et al. (2016). The 2016 revision to the World Health Organization classification of myeloid neoplasms and acute leukemia. Blood 127, 2391–2405. doi: 10.1182/blood-2016-03-643544
Baldeiras, I., Santana, I., Proença, M. T., Garrucho, M. H., Pascoal, R., Rodrigues, A., et al. (2010). Oxidative damage and progression to Alzheimer’s disease in patients with mild cognitive impairment. J. Alzheimers Dis. 21, 1165–1177.
Barham, D., and Trinder, P. (1972). An improved colour reagent for the determination of blood glucose by the oxidase system. Analyst 97, 142–145. doi: 10.1039/an9729700142
Beneduce, E., Matte, A., De Falco, L., Mbiandjeu, S., Chiabrando, D., Tolosano, E., et al. (2019). Fyn kinase is a novel modulator of erythropoietin signaling and stress erythropoiesis. Am. J. Hematol. 94, 10–20. doi: 10.1002/ajh.25295
Cortesão, E., Tenreiro, R., Ramos, S., Pereira, M., César, P., Carda, J. P., et al. (2015). Eritropoietina Sérica como Marcador Prognóstico em Síndrome Mielodisplásica [Serum Erythropoietin as Prognostic Marker in Myelodysplastic Syndromes]. Acta Med. Port. 28, 720–725.
De Leenheer, A. P., De Bevere, V. O., and Claeys, A. E. (1979). Measurement of alpha-, beta-, and gamma tocopherol in serum by liquid chromatography. Clin. Chem. 25, 425–428. doi: 10.1093/clinchem/25.3.425
Frijhoff, J., Winyard, P. G., Zarkovic, N., Davies, S. S., Stocker, R., Cheng, D., et al. (2015). Clinical Relevance of Biomarkers of Oxidative Stress. Antioxid. Redox Signal. 23, 1144–1170.
Frisan, E., Pawlikowska, P., Pierre-Eugene, C., Viallon, V., Gibault, L., Park, S., et al. (2010). p-ERK1/2 is a predictive factor of response to erythropoiesis stimulating agents in low/int-1 myelodysplastic syndromes. Haematologica 95, 1964–1968. doi: 10.3324/haematol.2010.024349
Garcia-Manero, G. (2010). Prognosis of myelodysplastic syndromes. Hematology Am. Soc. Hematol. Educ. Program 2010, 330–337. doi: 10.1182/asheducation-2010.1.330
Ghaffari, S. (2008). Oxidative stress in the regulation of normal and neoplastic hematopoiesis. Antioxid. Redox Signal. 10, 1923–1940. doi: 10.1089/ars.2008.2142
Ghoti, H., Amer, J., Winder, A., Rachmilewitz, E., and Fibach, E. (2007). Oxidative stress in red blood cells, platelets and polymorphonuclear leukocytes from patients with myelodysplastic syndrome. Eur. J. Haematol. 79, 463–467. doi: 10.1111/j.1600-0609.2007.00972.x
Goldberg, D., and Spooner, R. (1983). “Glutathione reductase,” in Methods of enzymatic analysis 3rd ed, eds H. Bergmeyer, J. Bergmeyer, and M. Grassl (Weinheim: Verlag Chemie), 258–265.
Gonçalves, A. C., Alves, R., Baldeiras, I., Cortesão, E., Carda, J. P., Branco, C. C., et al. (2017). Genetic variants involved in oxidative stress, base excision repair, DNA methylation, and folate metabolism pathways influence myeloid neoplasias susceptibility and prognosis. Mol. Carcinog. 56, 130–148. doi: 10.1002/mc.22478
Gonçalves, A. C., Cortesão, E., Oliveiros, B., Alves, V., Espadana, A. I., Rito, L., et al. (2015). Oxidative stress and mitochondrial dysfunction play a role in myelodysplastic syndrome development, diagnosis, and prognosis: a pilot study. Free Radic Res. 49, 1081–1094. doi: 10.3109/10715762.2015.1035268
Hasselbalch, H. C., Thomassen, M., Hasselbalch Riley, C., Kjćr, L., Stauffer Larsen, T., Jensen, M. K., et al. (2014). Whole Blood Transcriptional Profiling Reveals Deregulation of Oxidative and Antioxidative Defence Genes in Myelofibrosis and Related Neoplasms. Potential Implications of Downregulation of Nrf2 for Genomic Instability and Disease Progression. PLoS One 9:e112786. doi: 10.1371/journal.pone.0112786
Houston, B. L., Jayakar, J., Wells, R. A., Lenis, M., Zhang, L., Zhu, N., et al. (2017). A predictive model of response to erythropoietin stimulating agents in myelodysplastic syndrome: from the Canadian MDS patient registry. Ann. Hematol. 96, 2025–2029. doi: 10.1007/s00277-017-3137-0
Imbesi, S., Musolino, C., Allegra, A., Saija, A., Morabito, F., Calapai, G., et al. (2013). Oxidative stress in oncohematologic diseases: an update. Expert Rev. Hematol. 6, 317–325. doi: 10.1586/ehm.13.21
Jhanwar, S. C. (2015). Genetic and epigenetic pathways in myelodysplastic syndromes: a brief overview. Adv. Biol. Regul. 58, 28–37. doi: 10.1016/j.jbior.2014.11.002
Khalil, S. K., Amer, H. A., El Behairy, A. M., and Warda, M. (2016). Oxidative stress during erythropoietin hyporesponsiveness anemia at end stage renal disease: molecular and biochemical studies. J. Adv. Res. 7, 348–358. doi: 10.1016/j.jare.2016.02.004
Komrokji, R. S., Sekeres, M. A., and List, A. F. (2011). Management of lower-risk myelodysplastic syndromes: the art and evidence. Curr. Hematol. Malig. Rep. 6, 145–153. doi: 10.1007/s11899-011-0086-x
Kosmider, O., Passet, M., Santini, V., Platzbecker, U., Andrieu, V., Zini, G., et al. (2016). Are somatic mutations predictive of response to erythropoiesis stimulating agents in lower risk myelodysplastic syndromes? Haematologica 2016, e280–e283.
Lin, P., Ren, Y., Yan, X., Luo, Y., Zhang, H., Kesarwani, M., et al. (2019). The high NRF2 expression confers chemotherapy resistance partly through up-regulated DUSP1 in myelodysplastic syndromes. Haematologica 104, 485–496. doi: 10.3324/haematol.2018.197749
Liu, Y., Li, Q., Zhou, L., Xie, N., Nice, E. C., Zhang, H., et al. (2016). Cancer drug resistance: redox resetting renders a way. Oncotarget 7, 42740–42761. doi: 10.18632/oncotarget.8600
Maurya, R. P., Prajapat, M. K., Singh, V. P., Roy, M., Todi, R., Bosak, S., et al. (2021). Serum Malondialdehyde as a Biomarker of Oxidative Stress in Patients with Primary Ocular Carcinoma: impact on Response to Chemotherapy. Clin. Ophthalmol. 15, 871–879. doi: 10.2147/opth.s287747
Molteni, A., Riva, M., Greco, R., Nichelatti, M., Ravano, E., Marbello, L., et al. (2013). Verifying Hellstrom-Lindberg score as predictive tool for response to erythropoietin therapy according to the “International Working Group” criteria, in anemic patients affected by myelodysplastic syndrome: a monocentric experience. Int. J. Hematol. 97, 472–479. doi: 10.1007/s12185-013-1305-0
Mufti, G. J. (2004). Pathobiology, classification, and diagnosis of myelodysplastic syndrome. Res. Clin. Haematol. 17, 543–557. doi: 10.1016/s1521-6926(04)00073-8
Paglia, D. E., and Valentine, W. N. (1967). Studies on the quantitative and qualitative characterization of erythrocyte glutathione peroxidase. J. Lab. Clin. Med. 70, 158–169.
Park, S., Kelaidi, C., Meunier, M., Casadevall, N., Gerds, A. T., and Platzbecker, U. (2020). The prognostic value of serum erythropoietin in patients with lower-risk myelodysplastic syndromes: a review of the literature and expert opinion. Ann. Hematol. 99, 7–19. doi: 10.1007/s00277-019-03799-4
Pour Khavari, A., Liu, Y., He, E., Skog, S., and Haghdoost, S. (2018). Serum 8-Oxo-dG as a Predictor of Sensitivity and Outcome of Radiotherapy and Chemotherapy of Upper Gastrointestinal Tumours. Oxid. Med. Cell. Longev. 2018:4153574. doi: 10.1155/2018/4153574
Santini, V., Schemenau, J., Levis, A., Balleari, E., Sapena, R., Ades, L., et al. (2013). Can the revised IPSS predict response to erythropoietic-stimulating agents in patients with classical IPSS low or intermediate-1 MDS? Blood 122, 2286–2288. doi: 10.1182/blood-2013-07-512442
Sardina, J. L., López-Ruano, G., Sánchez-Sánchez, B., Llanillo, M., and Hernández-Hernández, A. (2012). Reactive oxygen species: are they important for haematopoiesis?. Crit. Rev. Oncol. Hematol. 81, 257–274. doi: 10.1016/j.critrevonc.2011.03.005
Sarmento-Ribeiro, A. B., Proença, M. T., Sousa, I., Pereira, A., Guedes, F., Teixeira, A., et al. (2012). A possible role for oxidation stress in lymphoid leukaemias and therapeutic failure. Leuk. Res. 36, 1041–1048. doi: 10.1016/j.leukres.2012.03.015
Stasi, R., Abruzzese, E., Lanzetta, G., Terzoli, E., and Amadori, S. (2005). Darbepoetin alfa for the treatment of anemic patients with low and intermediate-1-risk myelodysplastic syndromes. Ann. Oncol. 16, 1921–1927. doi: 10.1093/annonc/mdi400
Titheradge, M. A. (1998). The enzymatic measurement of nitrate and nitrite. Methods Mol. Biol. 100, 83–91. doi: 10.1385/1-59259-749-1:83
Trachootham, D., Zhang, W., and Huang, P. (2009). “Oxidative Stress and Drug Resistance in Cancer,” in Drug Resistance in Cancer Cells, eds Z. Siddik and K. Mehta (New York, NY: Springer), doi: 10.1007/978-0-387-89445-4_7
Vatassery, G. T., Maynard, V. R., and Hagen, D. F. (1978). High-performance liquid chromatography of various tocopherols. J. Chromatogr. A. 161, 299–302. doi: 10.1016/s0021-9673(01)85240-7
Keywords: myelodysplastic syndrome, erythropoiesis-stimulating agents, response biomarker, oxidative stress, antioxidant defenses, reactive oxygen species
Citation: Gonçalves AC, Alves R, Baldeiras I, Jorge J, Marques B, Paiva A, Oliveiros B, Cortesão E, Nascimento Costa JM and Sarmento-Ribeiro AB (2021) Oxidative Stress Parameters Can Predict the Response to Erythropoiesis-Stimulating Agents in Myelodysplastic Syndrome Patients. Front. Cell Dev. Biol. 9:701328. doi: 10.3389/fcell.2021.701328
Received: 27 April 2021; Accepted: 13 May 2021;
Published: 07 June 2021.
Edited by:
Milica Pešić, University of Belgrade, SerbiaReviewed by:
Ulrike Resch, Medical University of Vienna, AustriaKarmen Stankov, University of Novi Sad, Serbia
Copyright © 2021 Gonçalves, Alves, Baldeiras, Jorge, Marques, Paiva, Oliveiros, Cortesão, Nascimento Costa and Sarmento-Ribeiro. This is an open-access article distributed under the terms of the Creative Commons Attribution License (CC BY). The use, distribution or reproduction in other forums is permitted, provided the original author(s) and the copyright owner(s) are credited and that the original publication in this journal is cited, in accordance with accepted academic practice. No use, distribution or reproduction is permitted which does not comply with these terms.
*Correspondence: Ana Bela Sarmento-Ribeiro, YWJzYXJtZW50b0BmbWVkLnVjLnB0