 Si Liu
 Xin Lian
- Department of Urology, The First Hospital of Jilin University, Changchun, China
This study focuses on investigating the metabolism-related gene profile and prognosis of clear cell renal cell carcinoma (ccRCC) patients. The research data from the Gene Expression Omnibus database, including GSE40435, GSE53757, and GSE53000, were used to analyze the consistently differentially expressed RNAs (cDERs) by the MetaDE limma package. Gene expression profiling associated with metabolism was downloaded from the GSEA database. The cancer genome atlas (TCGA) dataset of ccRCC (the training set) and RNA sequencing data of E-MTAB-3267 from EBI ArrayExpress database (the validation set) were obtained to construct a prognostic model. A series of bioinformatics analysis, including functional enrichment analysis, Cox regression analysis, and constructing a prognostic score (PS) model, was performed. Further in vitro experiments including cell proliferation assay and flow cytometry were performed to validate our results. We constructed a metabolism-related prognostic model based on 27 DElncRNAs and 126 DEGs. Gene Set Enrichment Analysis revealed that 19 GO terms and 9 KEGG signaling pathways were significantly associated with lipid metabolic pathways. Furthermore, we generated a nomogram illustrating the association between the identified DERs and the tumor recurrence risk in ccRCC. The results from experimental validation showed that lncRNA SNHG20 was significantly upregulated in tumor tissues compared with adjacent tissues. Knockdown of SNHG20 suppressed the proliferation and induced cell cycle G0/G1 arrest, and apoptosis in ccRCC cells. Our study might contribute to a better understanding of metabolic pathways and to the further development of novel therapeutic approaches for ccRCC.
Introduction
Clear cell renal cell carcinoma (ccRCC), accounting for approximately 80–90% of renal cell carcinoma cases, is characterized as high metastasis and relapse rate compared with other subtypes (Ljungberg et al., 2019). Essentially, ccRCC is regarded as a metabolic disease with some main risk factors, including diabetes, obesity, and atherosclerosis (Sudarshan et al., 2013). At present, late diagnosis is a major obstacle for improving ccRCC outcomes, with the fact that a portion of patients already have distant metastasis when diagnosed and developed to metastatic recurrence during the follow-up (Rao et al., 2018; Ghatalia et al., 2019). Therefore, there is an urgent need to identify effective prognostic biomarkers/therapeutic targets associated with metabolism for the prediction and treatment of ccRCC (Verbiest et al., 2018).
With the development of gene chips and high-throughput second-generation sequencing technologies, bioinformatics has been widely applied to analyze, and identify genes associated with the progression of renal cell carcinoma. For example, Wan et al. (2020) used the cancer genome atlas (TCGA) database bioinformatics platform to identify DEGs that eliminated patients with high immune and stromal scores in the ccRCC microenvironment. Xu et al. (2019) used available RNA-sequence data from TCGA and Fudan University Shanghai Cancer Center (FUSCC) to reveal that AQP may act as an oncogene and a promising prognostic marker in ccRCC. In addition, Xiao et al. (2020) obtained 293 DEGs by integrating six datasets from the GEO database and CMap analysis. However, the role of the metabolism-related gene set in ccRCC remains largely unclear.
In the present study, we downloaded RNA sequencing and corresponding clinical information from the GEO, TCGA, and EBI ArrayExpress databases. We first identified consistently differentially expressed RNAs (cDERs) by overlapping the candidates through integrated bioinformatics analysis. Subsequently, we selected a cluster of metabolism-related genes to screen for key genes and biological pathways, and construct a prognosis prediction signature. These analyses might provide rational therapeutics in further studies on ccRCC.
Materials and Methods
Public Datasets
A total of three datasets (GSE40435, GSE53757, and GSE53000) were obtained by searching the keywords ‘‘Homo sapiens’’ and ‘‘clear cell renal carcinoma’’ and following the criteria (sample size not less than 50 and studies with the presence of normal groups as the control) from National Center for Biotechnology Information (NCBI) GEO1 (Clough and Barrett, 2016). A total of 528 ccRCC samples that had both mRNA and lncRNA expression profiling were obtained by mapping the clinical prognosis for each sample from the TCGA data portal,2 which were used as training dataset. This expression profiling of the 53 ccRCC samples with corresponding available clinical information about recurrence and prognosis was downloaded from the EBI ArrayExpress3 databases, and which were used as a validation dataset.
Identification of cDERs
The lncRNAs and mRNAs in the mentioned datasets as above were annotated by using Human Genome Organization (HUGO) Gene Nomenclature Committee (HGNC4) (Parkinson et al., 2005). To eliminate discrepancies, the MetaDE package Version 1.0.5 in R3.4.1 language (Chang et al., 2013) was used to screen the cDERs, including cDElncRNAs and cDEGs between the ccRCC group, and control group in three datasets (GSE40435, GSE53757, and GSE53000) with the cutoff criteria of false discovery rate (FDR) < 0.05. Next, clustering analysis was performed to detect the distinguishing effect of MetaDE on differential expression in different sample groups.
Metabolism-Associated DEGs in ccRCC
The genes correlated with three major substances, namely, amino acids and derivatives, carbohydrates, and lipids, were downloaded from the Gene Set Enrichment Analysis database (GSEA5) (Subramanian et al., 2005). Metabolism-associated DEGs were obtained by comparing cDEGs in the profiles of GSE40435, GSE53757, and GSE53000.
Construction of ceRNA Network
The expression levels of metabolism-associated DEGs and cDElncRNAs were obtained in the TCGA data portal, which were used to calculate the pearson correlation coefficient (PCC) using cor. Test function (Zou et al., 2003) in R3.4.1 language. Based on the absolute value of correlation coefficient > 0.4, the regulation network of metabolism-associated DEGs and cDElncRNAs was plotted by Cytoscape (3.6.1) (Shannon et al., 2003). Subsequently, DAVID online tool version 6.8 (Huang da et al., 2009) was used to perform gene ontology (GO) biological process annotation and kyoto encyclopedia of genes and genomes (KEGG) pathway analyses for DEGs in the co-expression network. All significant GO or KEGG terms based on the threshold of p < 0.05 should be composed of at least two DEGs.
Establishment of the Prognostic Gene Signature
Univariate Cox proportional hazard regression analysis in Survival package (Version2.41–16) (Wang et al., 2016) was conducted to screen the metabolism-associated DEGs and cDElncRNAs in the ceRNA network significantly associated with the prognosis of TCGA-ccRCC cohorts with the threshold of log-rank p-value < 0.05. Then, a multivariate Cox regression analysis was conducted to assess the contribution of metabolism-associated DEGs and cDElncRNAs as independent prognostic factors for patient survival. Next, we applied a L1 penalized lasso estimation-based Cox-proportional hazards (Cox-PH) model (Tibshirani, 1997) in the penalized package (Version 0.9–507) of R3.4.1 (Goeman, 2010) to further screen the optimum prognostic signature cDERs. The optimal lambda was determined according to the maximal cross-validation likelihood run 1,000 times. Subsequently, a linear combination method was adopted to assemble expression level and coefficient of each gene to get a risk score formula: Prognostic score (PS) = ΣβDERs × ExpDERs. Here, βDERs represent the LASSO coefficients of signature cDERs, and ExpDERs represent the expression levels of signature cDERs. The patients in the training dataset were stratified into high-risk (PS > median value) and low-risk (PS < median value) groups based on the median risk score as the cutoff. The Kaplan–Meier survival analysis with log-rank test were also used to compare the survival difference between the above two groups. The time-dependent receiver operating characteristic (ROC) curve was drawn to evaluate the predictive power of this signature. Similarly, the predictive value of the prognostic gene signature was further investigated in the validation dataset.
Identification of Independent Prognostic Parameters of ccRCC
To identify independent prognostic parameters and to validate the independent prognostic value of the gene signature, univariate Cox regression analysis was first performed in the TCGA dataset on the prognostic gene signature and clinicopathological parameters including age, gender, pathologic M, N, T, and PS model status. These parameters with p < 0.05 based on the univariate analysis were further included in the multivariate Cox regression analysis. To further investigate the relationship between independent prognostic factors and risk grouping, we performed risk stratification analysis based on screened prognostic factors in the TCGA dataset for studying the prognosis of target clinical factors in high-risk and low-risk groups.
Building and Validating a Predictive Nomogram
Nomograms are widely applied to predict cancer patients’ prognoses. Here, a composite nomogram was constructed using R3.4.1 rms package Version 5.1-28 (Anderson et al., 1989; Eng et al., 2015) based on all independent prognostic parameters screened by the multivariable Cox regression analysis to assess the probability of 3– and 5-year overall survival for ccRCC patients. Subsequently, we constructed the clinical prognosis models based on clinicopathological parameters, signature lncRNAs, or mRNAs in PS model, respectively, which were compared with the PS prognostic model by drawing ROC curves with two parameters (C-index and AUROC).
Clinical Sample Preparation
A total of 50 paired ccRCC tissue and adjacent normal tissue samples were collected from ccRCC patients who underwent radical nephrectomy at the First Hospital of Jilin University. The patients whose tissues were used in the present study had never received chemotherapy or radiotherapy. All the samples were stored at −80°C until use. The study protocol was approved by the ethics committee of the First Hospital of Jilin University.
Cell Transfection
Two ccRCC cell lines (786-O and ACHN) were purchased from the American Type Culture Collection (Manassas, VA, United States) and cultured in Dulbecco’s modified Eagle’s medium (Thermo Fisher Scientific, Inc., Waltham, MA, United States) with 10% FBS at 37°C in a 5% CO2 incubator. For transient transfection, cells were plated into six-well plates (2 × 10⁵/well) and transfected with small interfering RNA targeting SNHG20 (si-SNHG20#1, 2, and 3) or negative control (si-NC) synthesized by GenePharma (Shanghai, China) using Lipofectamine 2,000 (Invitrogen, CA, United States).
Quantitative Real-Time PCR
Total RNA was extracted from tissue samples or cell lines using TRIzol reagent (Thermo Fisher Scientific) and reverse transcribed into cDNA using a First Strand cDNA Synthesis Kit (Takara Biotechnology Co., Ltd., Dalian, China) according to the manufacturer’s instructions. Quantitative real-time PCR was carried out using SYBR Premix ExTaqTM (TaKaRa, Dalian, China). Relative expression levels of mRNAs and lncRNAs were calculated using the 2–ΔΔ Ct method with GAPDH as the internal control.
Cell Counting Kit-8 Assay
The transfected cells were seeded into 96-well plates at a density of 3,000 cells per well. Then, 10 μl of CCK-8 reagents (Beyotime Institute of Biotechnology, Shanghai, China) was added into each well at 0, 24, 48, and 72 h. After incubation for 2 h at 37°C, the absorbance at each time point was measured at a wavelength of 450 nm by a microplate reader.
Colony Formation Assay
The transfected cells at a density of 300 cells per well were seeded into six-well plates and cultured for 14 days. The colonies (>50 cells per colony) were fixed with 4% paraformaldehyde for 15 min and stained with 0.5% crystal violet for 10 min. Subsequently, the number of colonies was counted from three randomly chosen fields under an Olympus microscope (Tokyo, Japan).
Flow Cytometry Analysis
After 48 h transfection, cells were harvested for the flow cytometry detection. Cell cycle distribution was analyzed using a CycleTESTTM PLUS DNA Reagent Kit (BD Biosciences) according to the standard protocol. Briefly, cells were stained with propidium iodide (PI), mixed with RNase A at 37°C for 30 min, and then analyzed by a flow cytometer (BD Biosciences). Apoptotic assay was performed with an Annexin V–FITC Apoptosis Detection Kit, which was detected by flow cytometry.
Statistical Analysis
The measurement data were expressed by the mean ± standard deviation (SD). Prism 6.0 software (GraphPad, Inc., La Jolla, CA, United States) was used for statistical analysis. The differences between the tumor tissue and normal colonic mucosa were analyzed by a paired t-test. The comparison between two groups was estimated by Student’s t-test and comparison among more than three groups was analyzed via one-way analysis of variance (ANOVA) followed by Dunnett’s test. All values of p less than 0.05 were considered statistically significant.
Results
Screening of Candidate Metabolism-Associated cDEGs
After annotation ensemble ID, we obtained 297 lncRNAs and 15,840 mRNAs in the datasets as above. Using the threshold of FDR < 0.05 in MetaDE, a total of 2115 cDERs (cDEGs and cDElncRNAs), including 785 downregulated, and 1,330 upregulated genes were identified between ccRCC and normal samples in GSE40435, GSE53757, and GSE53000. The results from clustering analysis not only could distinguish ccRCC samples from normal samples, but also present the consistency of the 2115 cDEGs in each dataset. Then, we downloaded metabolism-associated genes, including 372 amino acid and derivative metabolism-associated genes, 293 carbohydrate metabolism-associated genes, and 738 lipid metabolism-associated genes. Following the intersection of cDEGs, we obtained 139 candidate metabolism-associated cDEGs, as described by a Venn diagram.
ceRNA Network in ccRCC
After calculating the PCC between 139 cDEGs and cDElncRNAs in the TCGA database, the pairs with a PCC value of more than 0.4 were selected to determine the final ceRNA relationship for a total of 521 pairs, and 153 nodes. As shown in Figure 1A, we performed and visualized the lncRNA–mRNA network using Cytoscape. To further clarify the potential biological functions of mRNAs in the ceRNA network, the DAVID online tool was used to perform functional enrichment analysis. From the 124 target mRNAs, a total of 19 GO biological process categories and 9 KEGG pathways were enriched with a cutoff criterion of p < 0.05 (Table 1). In particular, these mRNAs are primarily associated with lipid biosynthetic process, translational elongation, and sulfur metabolic process, as well as participated in ribosome, arachidonic acid metabolism, and seleno-amino acid metabolism. The visualization results are shown in Figures 1B,C.
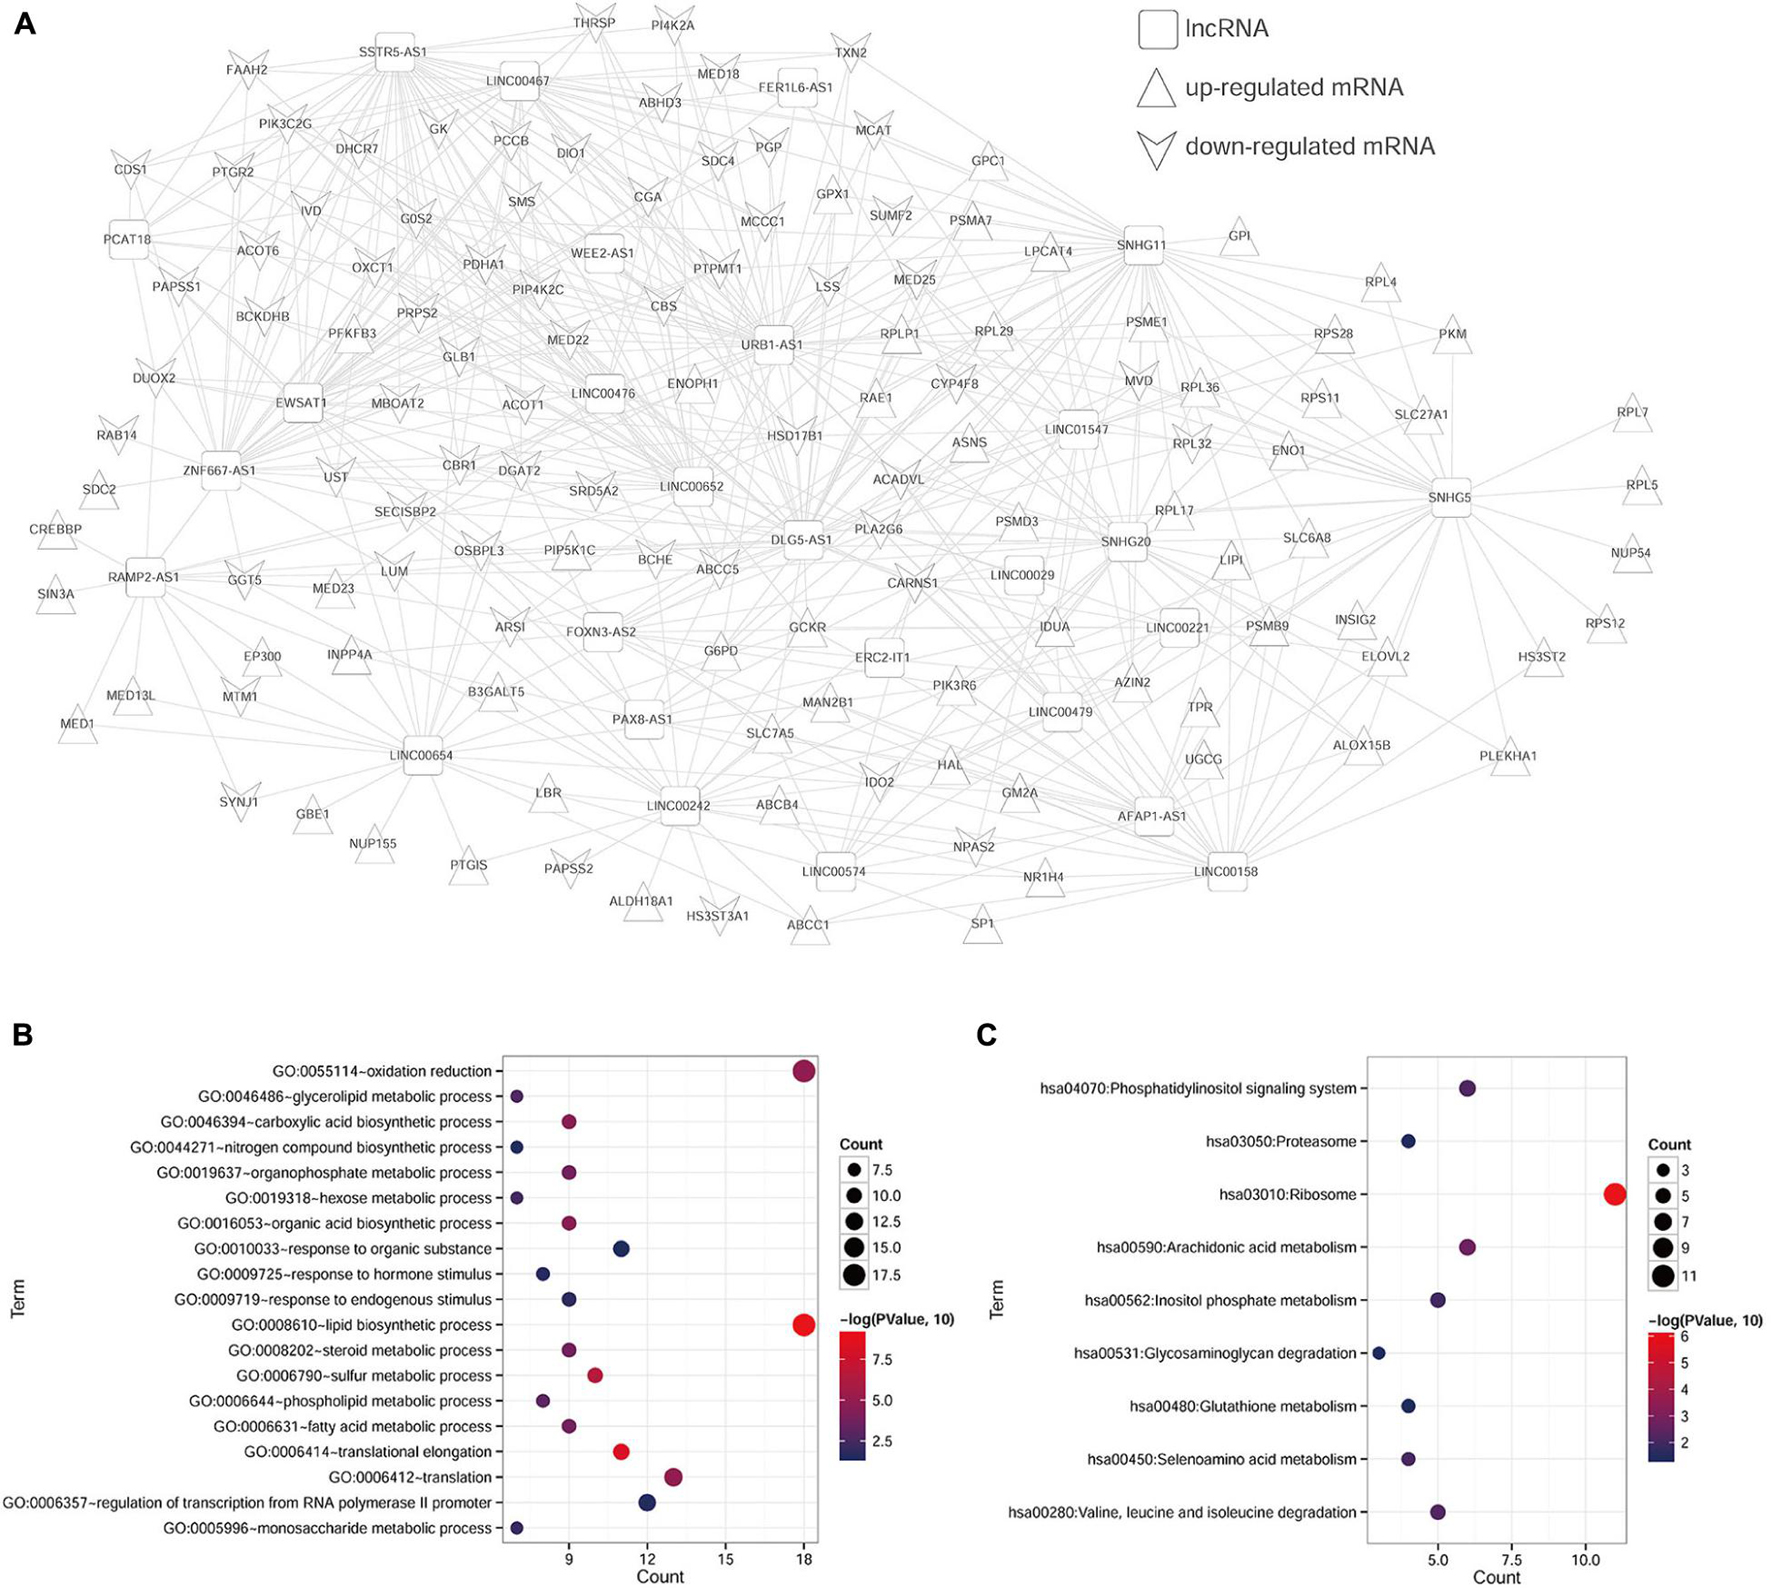
Figure 1. Enrichment analyses of genes in ceRNA network. (A) The lncRNA–mRNA ceRNA network in ccRCC. The squares represent lncRNAs, the equilateral triangles represent upregulated mRNAs, and inverted triangles represent downregulated mRNAs. (B) GO-BP pathway maps related to mRNAs in the ceRNA network. (C) KEGG pathway maps associated with mRNAs in the ceRNA network.
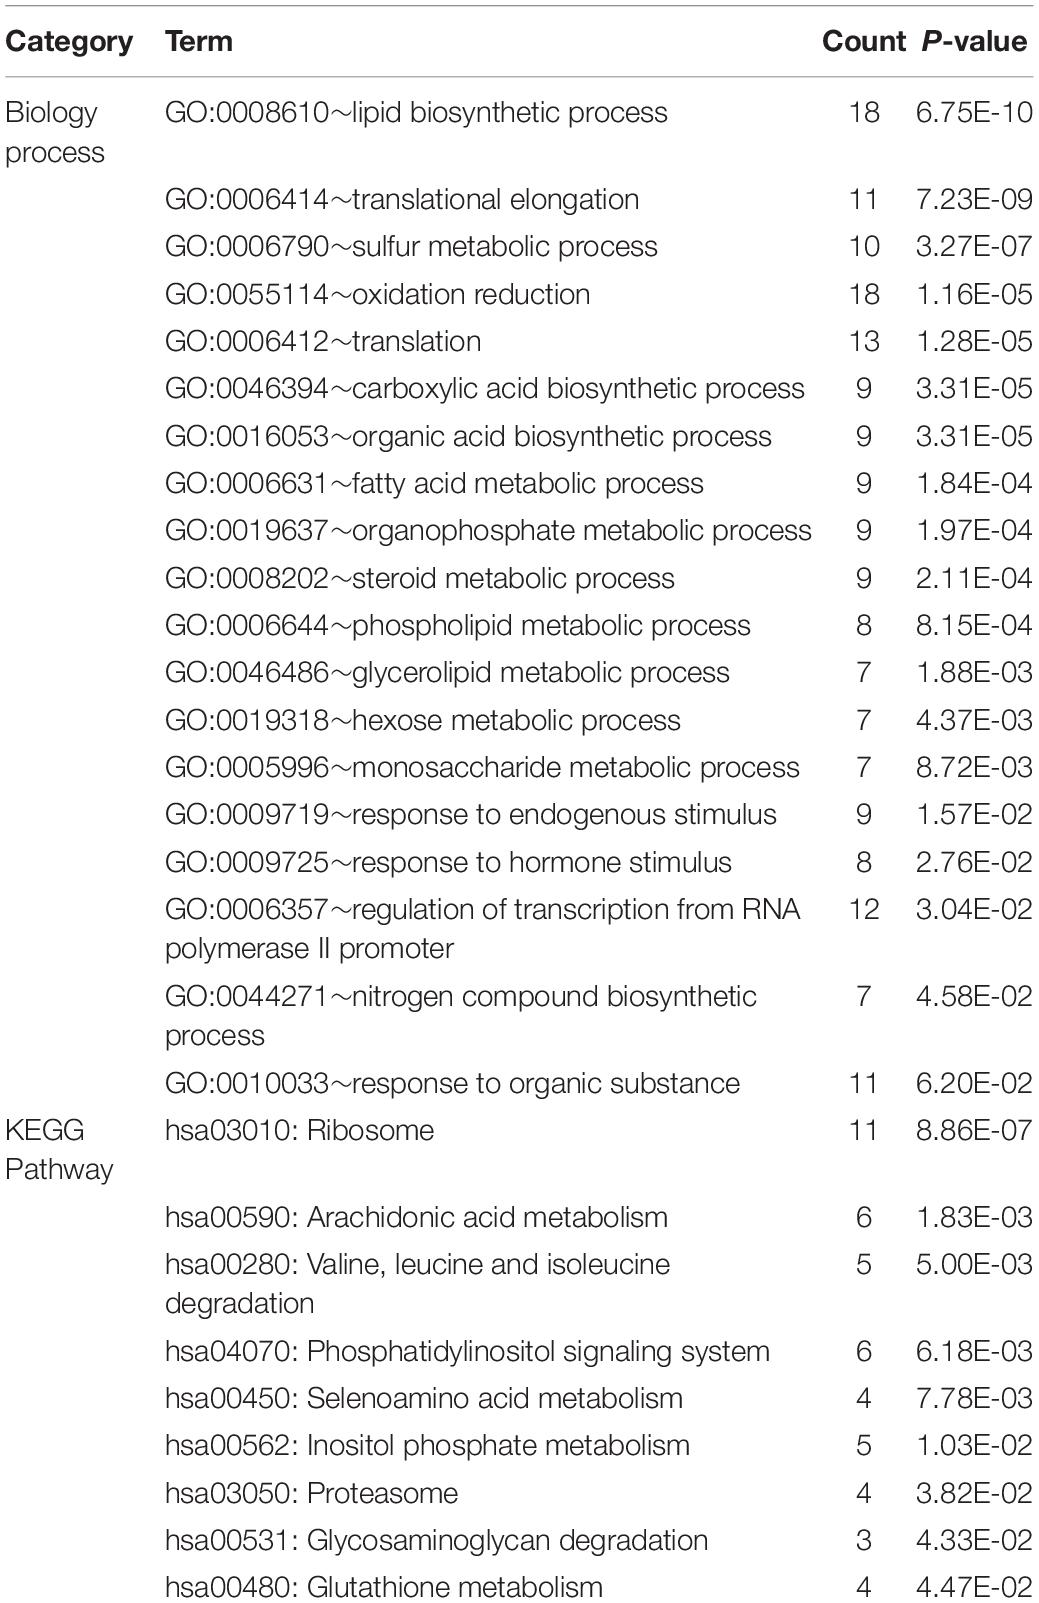
Table 1. Functional enrichment analysis of mRNAs in ceRNA network.
Construction and Evaluation of Prognosis Prediction Model
According to the univariate Cox regression analysis, a total of 83 cDERs in the ceRNA network, namely, 67 mRNAs and 16 lncRNAs, and significantly related to overall survival in ccRCC patients when the log-rank p-value < 0.05. After multivariate Cox regression analysis, we obtained 16 independent prognostic-related cDERs, namely, 14 mRNAs, and 2 lncRNAs. Then, a L1 penalized estimation-based Cox-PH model was performed in the training dataset to further narrow down the 16 independent prognostic-related cDERs. A total of 13 genes were identified and subsequently used to construct a prognostic gene signature (Table 2). We then calculated the 13-gene-based PS for each patient in the training dataset and used the median value of PS as the cutoff point. A total of 264 patients were classified as high risk because their PS was greater than the cutoff value, while the other 264 patients were assigned to the low-risk group, and with PS below the cutoff point. Kaplan–Meier curve and time-dependent ROC were used to assess the prognostic capacity of the 13-gene signature. As shown in Figure 2A, patients at low risk survived significantly longer than those at high risk (HR = 3.346, 95% CI = 2.398–4.669, p = 4.818E-14, and AUC = 0.870). Consistent results were also observed in the validation dataset (HR = 2.853, 95% CI = 1.491–5.458, p = 9.846E-04, and AUC = 0.775) (Figure 2B). Collectively, our results indicated a good performance of the 13-gene signature for survival prediction.
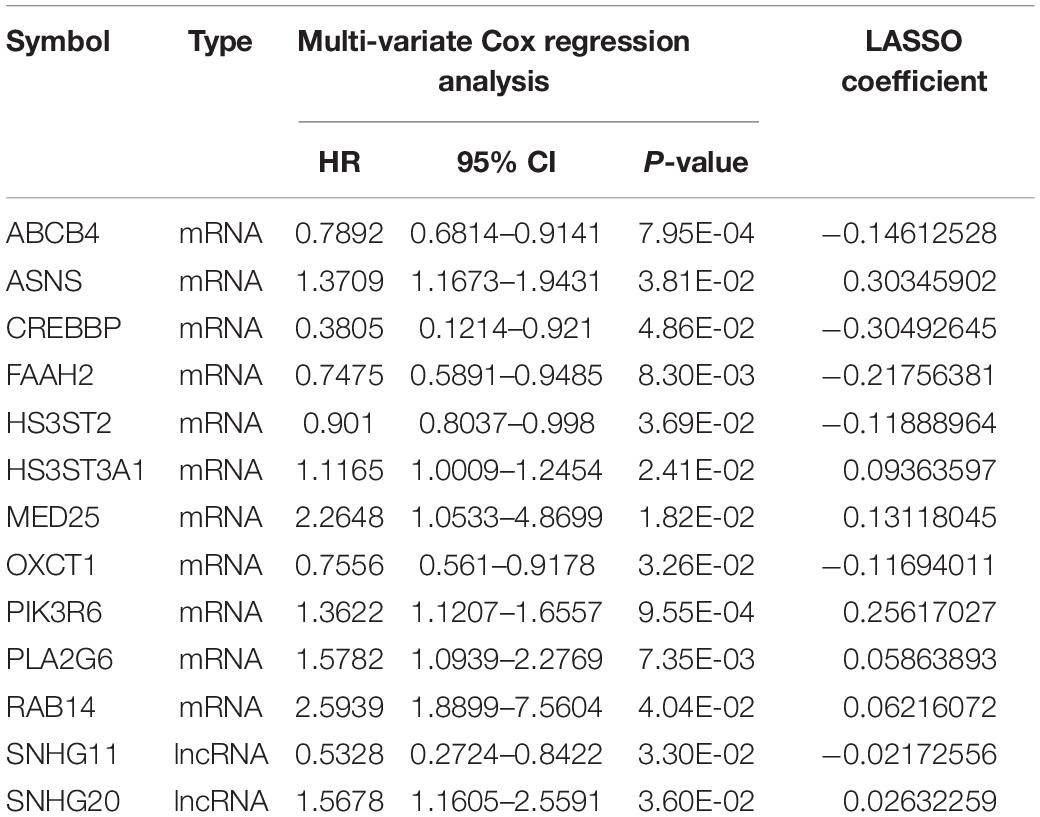
Table 2. The optimum prognostic signature DERs.
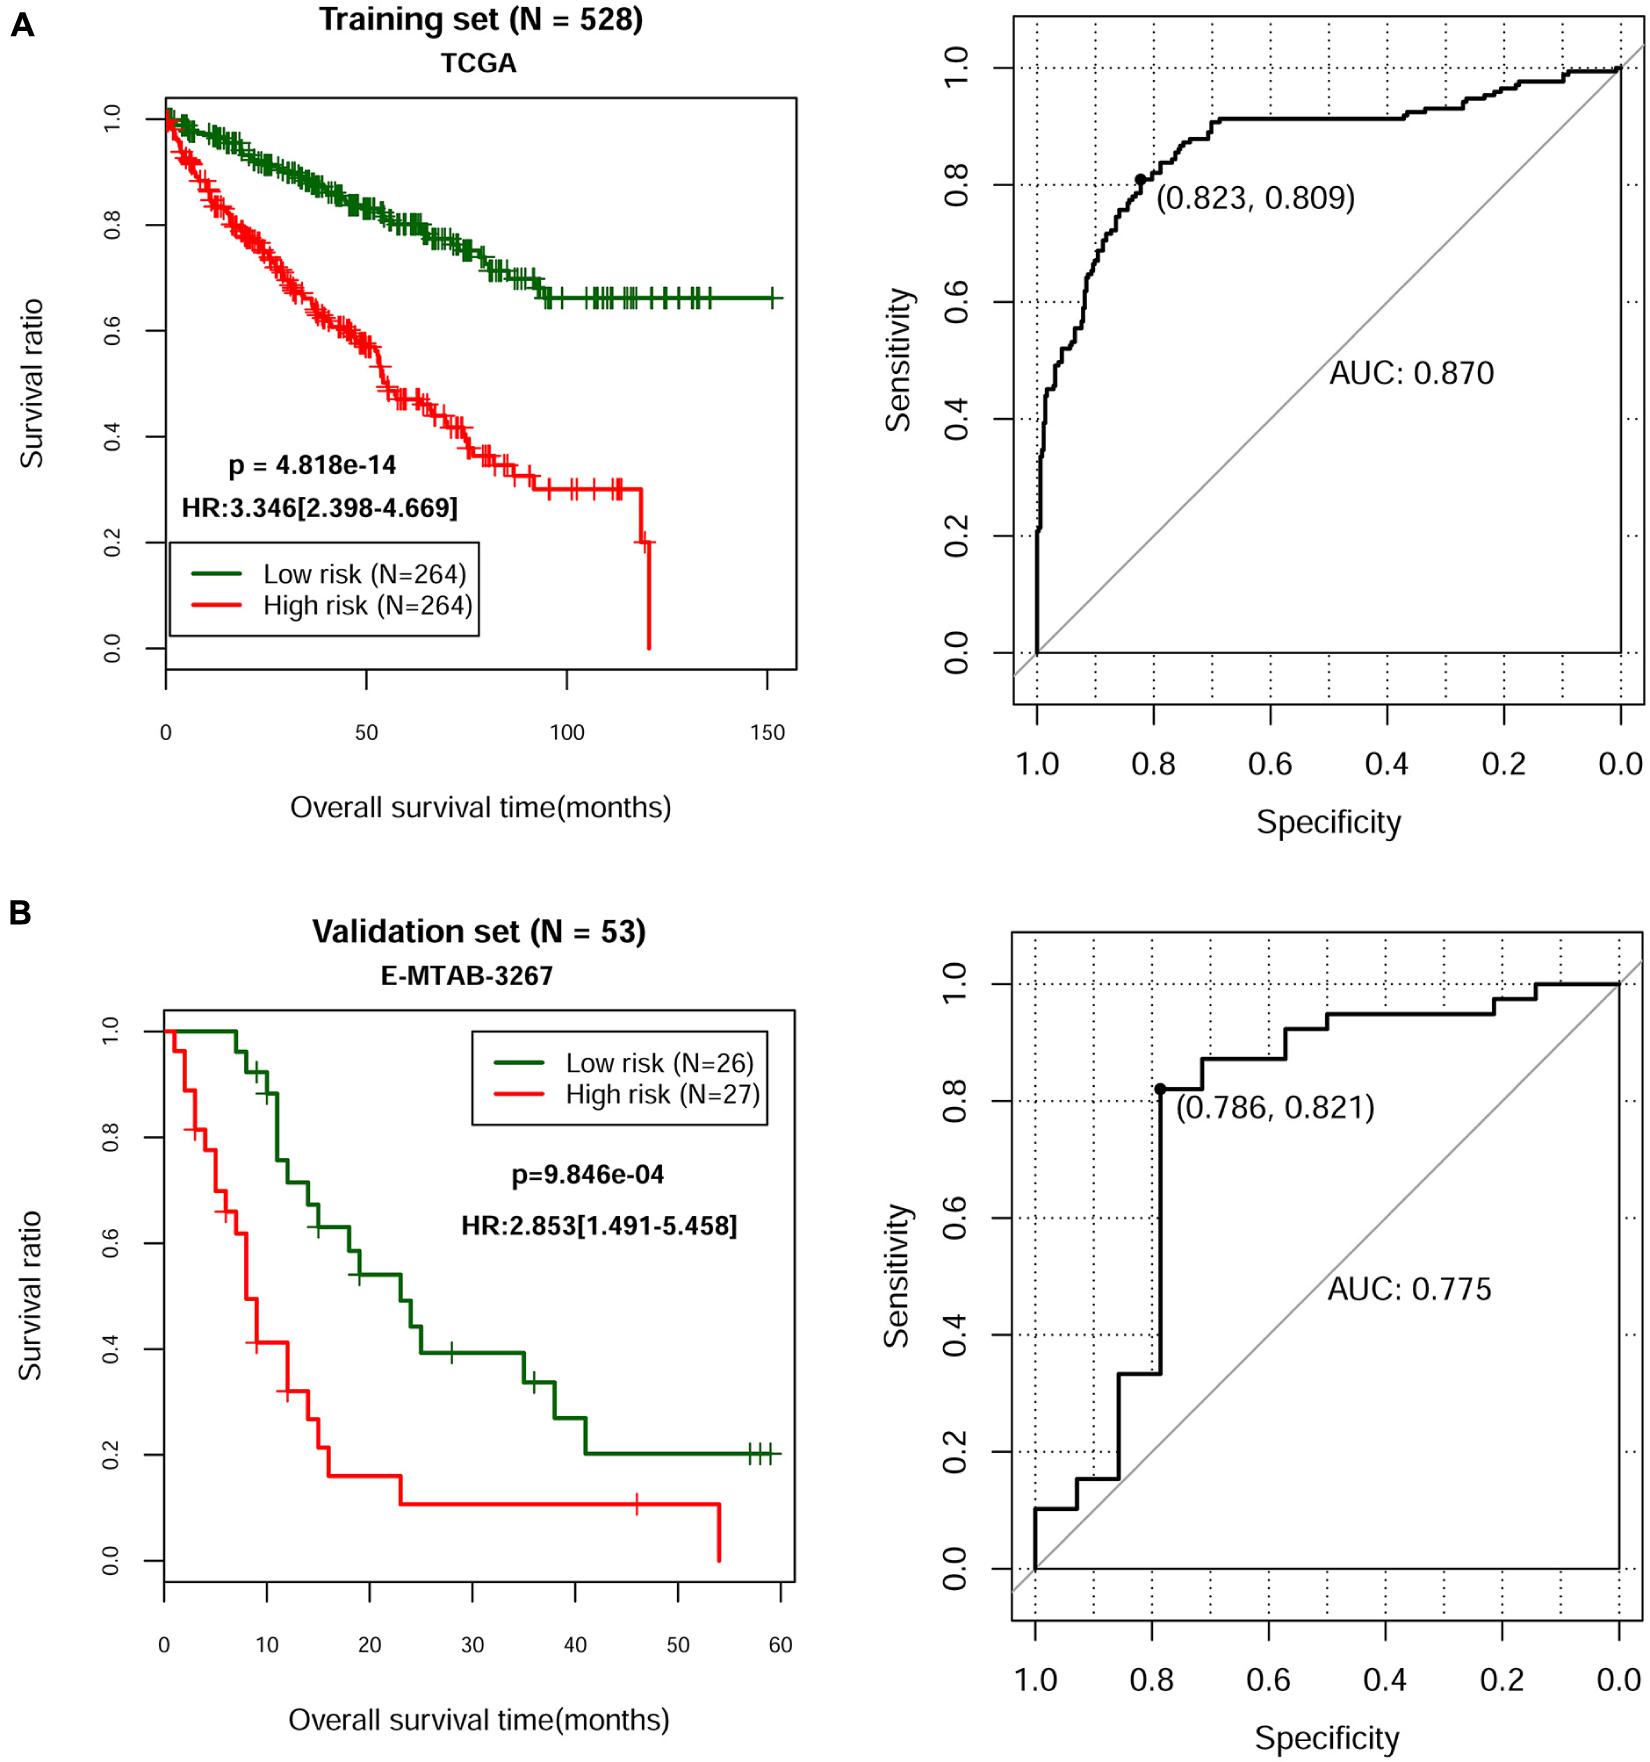
Figure 2. Kaplan–Meier and time-dependent ROC curves for the prognostic model in the TCGA ccRCC cohort (A) and in the E-MTAB-3267 ccRCC cohort (B). The Kaplan–Meier survival curves (left panel) show the overall survival based on the relatively high- and low-risk patients divided by the optimal cutoff point. Time-dependent ROC curve analysis (right panel) of survival prediction by the prognostic model.
Evaluation of Prognostic Factors in ccRCC
Based on the complete clinical information provided by the TCGA ccRCC dataset (n = 528), we performed univariate and multivariate Cox regression analyses to identify the prognostic factors of overall survival for ccRCC. As illustrated in Table 3, univariate analysis revealed that age (p = 8.493E-06), pathologic M (p = 1.110E-16), pathologic N (p = 5.359E-05), pathologic T (p = 1.221E-15), pathologic stage (p = 2.000E-16), neoplasm histologic grade (p = 7.772E-16), hemoglobin result (p = 2.739E-07), platelet qualitative (p = 1.054E-10), and PS model status (p = 4.818E-14) were significantly correlated with overall survival of ccRCC. Multivariate analysis further confirmed that platelet qualitative (p = 2.478E-03) and PS model status (p = 2.610E-04) were independent risk factors of overall survival. Kaplan–Meier curve showed that patients at normal platelet status had better survival prognosis, compared with those at elevated or low platelet status (Figure 3A). Subsequently, we performed risk stratification analysis to analyze the correlation between the high-/low-risk group and survival prognosis in patients with different platelet qualitative samples. The results showed that patients at elevated (Figure 3B), low (Figure 3C), or normal (Figure 3D) platelet status in the low-risk group had obviously longer survival time compared with corresponding patients in the high-risk group.
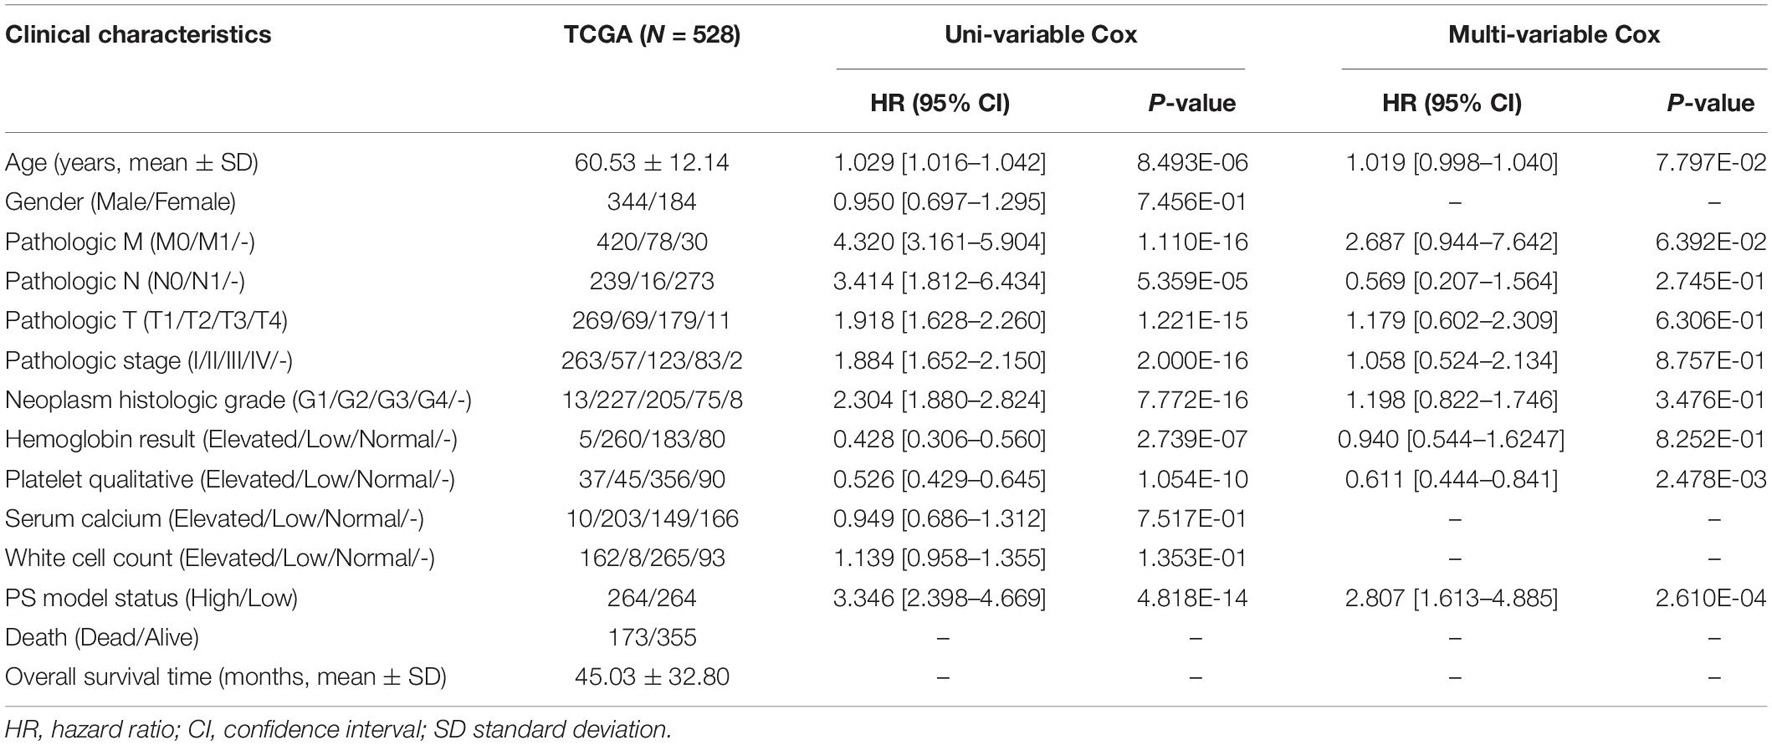
Table 3. The independent prognostic clinical factors according to univariate and multivariate Cox regression analyses.
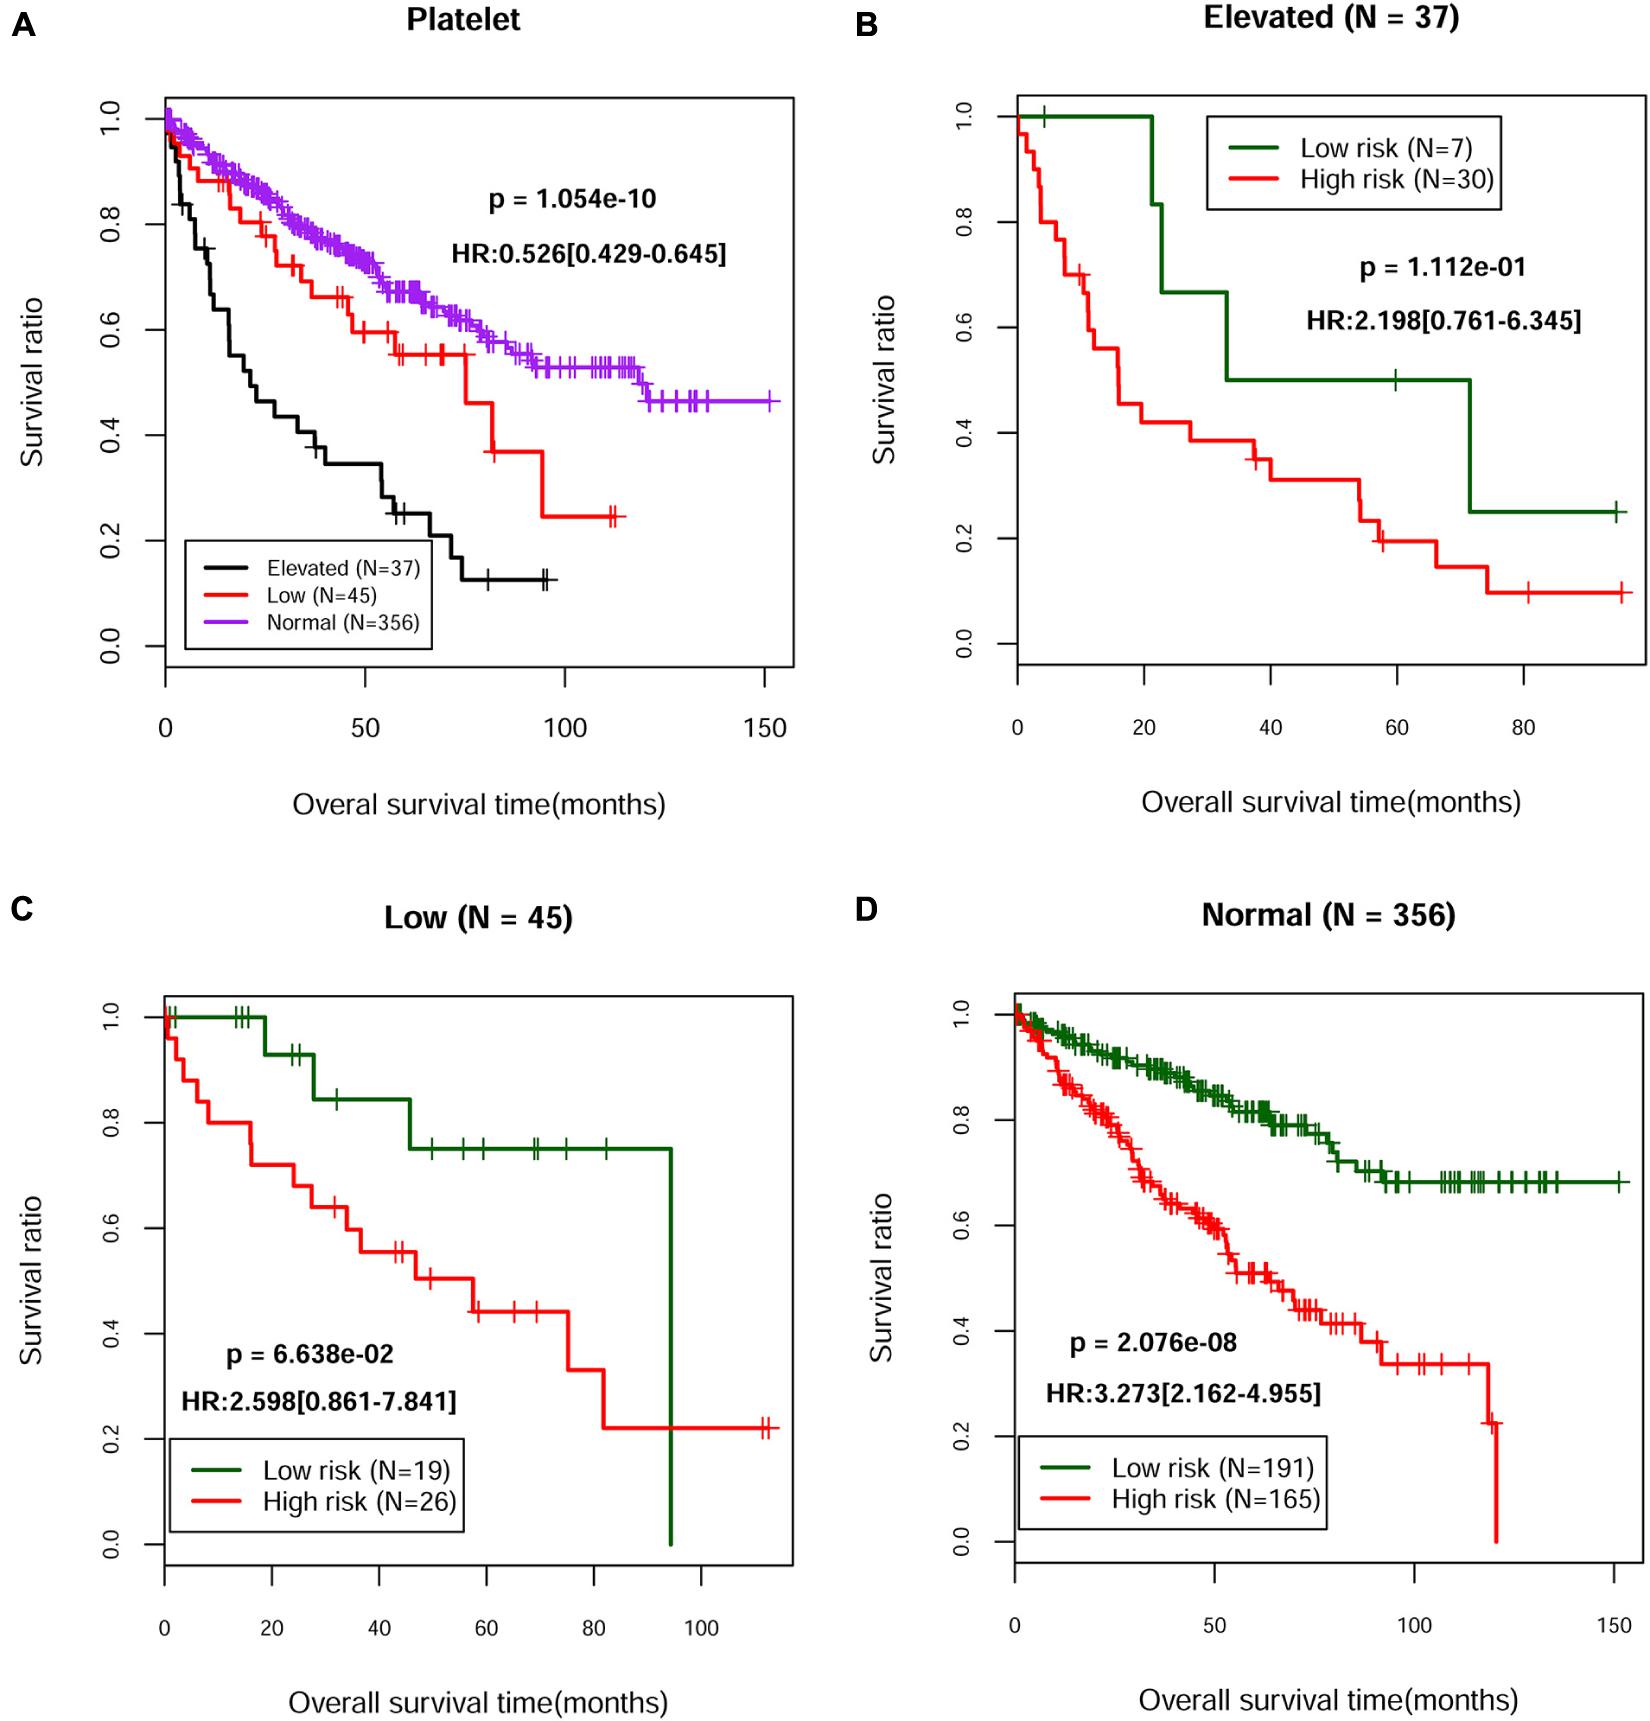
Figure 3. The Kaplan–Meier curves of independent prognostic clinical factors. (A) Kaplan–Meier curves of the survival of patients with different platelet status in the TCGA dataset. Kaplan–Meier curves of the survival of patients from the high-risk group and the low-risk group in elevated (B), low (C), or normal (D) platelet status, respectively.
Building and Validating a Predictive Nomogram
We then built a nomogram to predict the 3-year and 5-year survival probability of ccRCC patients using two independent prognostic factors including platelet qualitative and PS model status. As shown in Figure 4A, each factor was assigned points in proportion to its risk contribution to survival. Calibration curves indicated that actual and predicted survival matched very well (Figure 4B). Next, we constructed different prognostic models, including platelet, lncRNA, mRNA, multi-RNA, and RNA combined clinical models, and drew ROC curves to evaluate their predictive power (Figure 4C). We found that the RNA combined clinical model presented higher AUROC and C-index values (Table 4), which may be the best model in predicting overall survival.
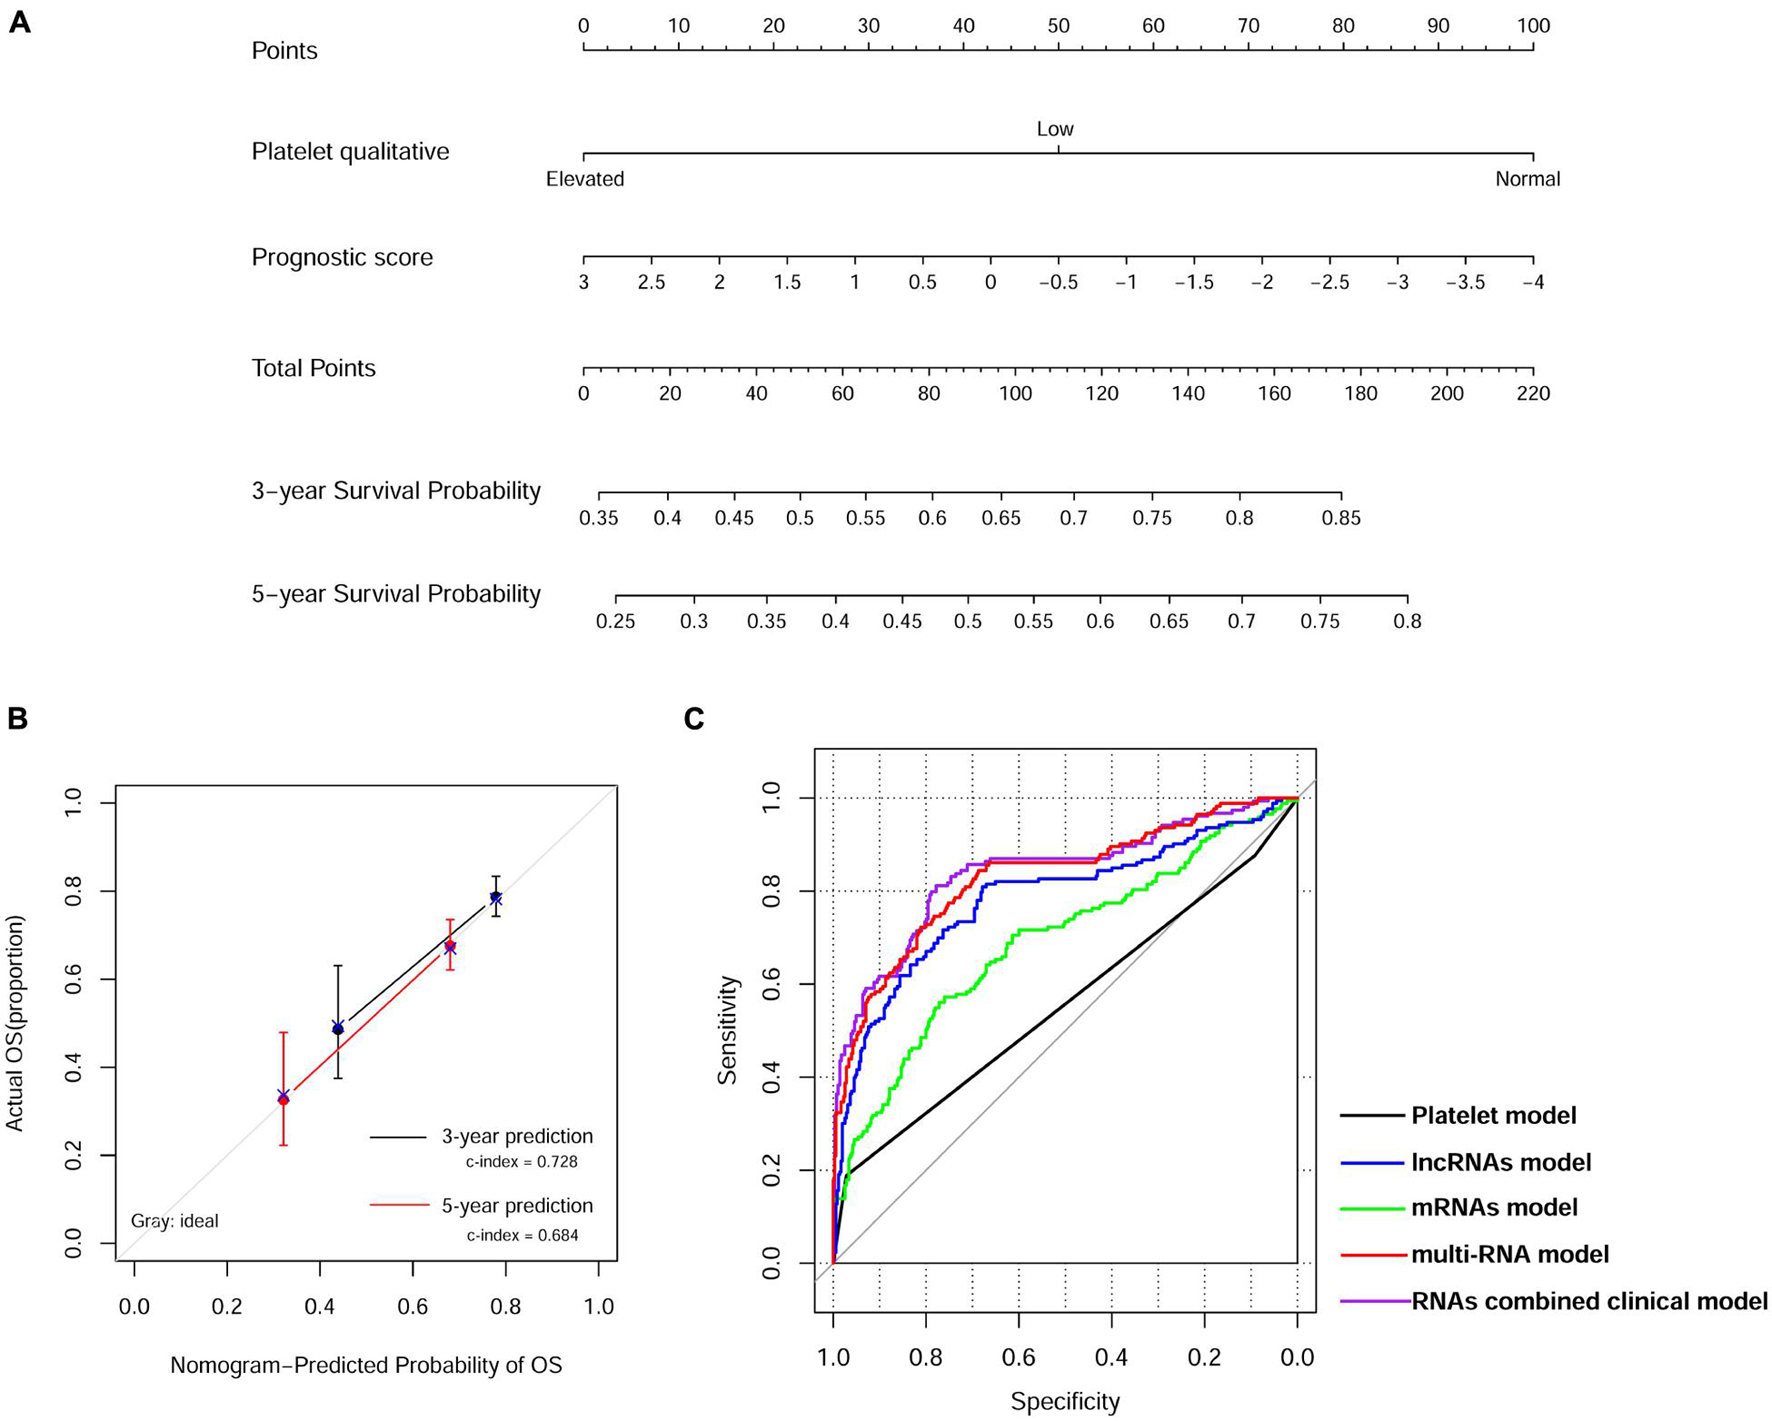
Figure 4. Nomogram predicting overall survival for ccRCC patients. (A) Nomogram survival prediction model consists of platelet qualitative and prognostic score based on the 13-lncRNA signature. (B) The calibration plot for internal validation of the nomogram. The y-axis represents actual survival, and the x-axis represents nomogram-predicted survival. (C) Time-dependent ROC curve analysis of survival prediction by different prognostic models.
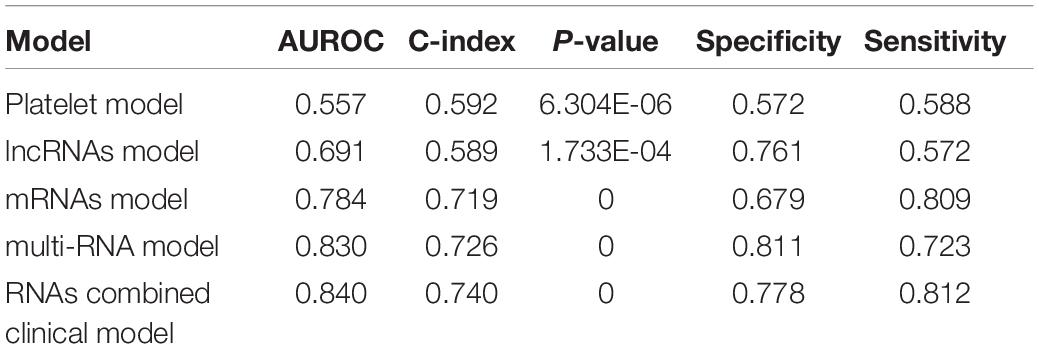
Table 4. Comparison of the different models.
Knockdown of SNHG20 Suppressed the Cell Proliferation of ccRCC Cells
Next, we validated the 13 screened prognostic signature DERs, namely, 11 mRNAs and 2 lncRNAs, and using quantitative real-time PCR analysis. Consistent with the bioinformatics analysis, the expression levels of ABCB4, ASNS, CREBBP, PIK3R6, SNHG11, and SNHG20 were upregulated (Figure 5A), while the expression levels of FAAH2, HS3ST3A1, MED25, OXCT1, PLA2G6, and RAB14 were downregulated (Figure 5B) in ccRCC tissues compared with adjacent normal tissue samples. Next, we selected two lncRNAs, namely, SNHG11 and SNHG20, and in the subsequent analysis. Considering SNHG20 presented stronger upregulation compared with SNHG11, we selected SNHG20 for further in vitro experiments by performing loss-of-function assays. We first designed three silent interference sequences for SNHG20. Then, the silent interference efficiency was detected by the PCR, which showed that the si-SNHG20#1 sequence exhibited the highest silent interference efficiency (all p < 0.05, Figure 6A). Therefore, the si-SNHG20#1 sequence was selected for subsequent experiments. The results from the CCK-8 assay (Figure 6B) and the colony formation assay (Figure 6C) consistently demonstrated that knockdown of SNHG20 significantly impaired cell viability and proliferation ability in 786-O, and ACHN cells. Subsequently, flow cytometry assays were performed to evaluate the impact of SNHG20 on the ccRCC cell cycle and apoptosis. As shown in Figure 6D, the percentage of cells at G0/G1 phase was significantly increased, while cells at S phase, and G2/M phase was decreased in 786-O and ACHN cells. In addition, we observed that knockdown of SNHG20 markedly promoted the percentage of apoptotic cells in 786-O and ACHN cells (Figure 6E).
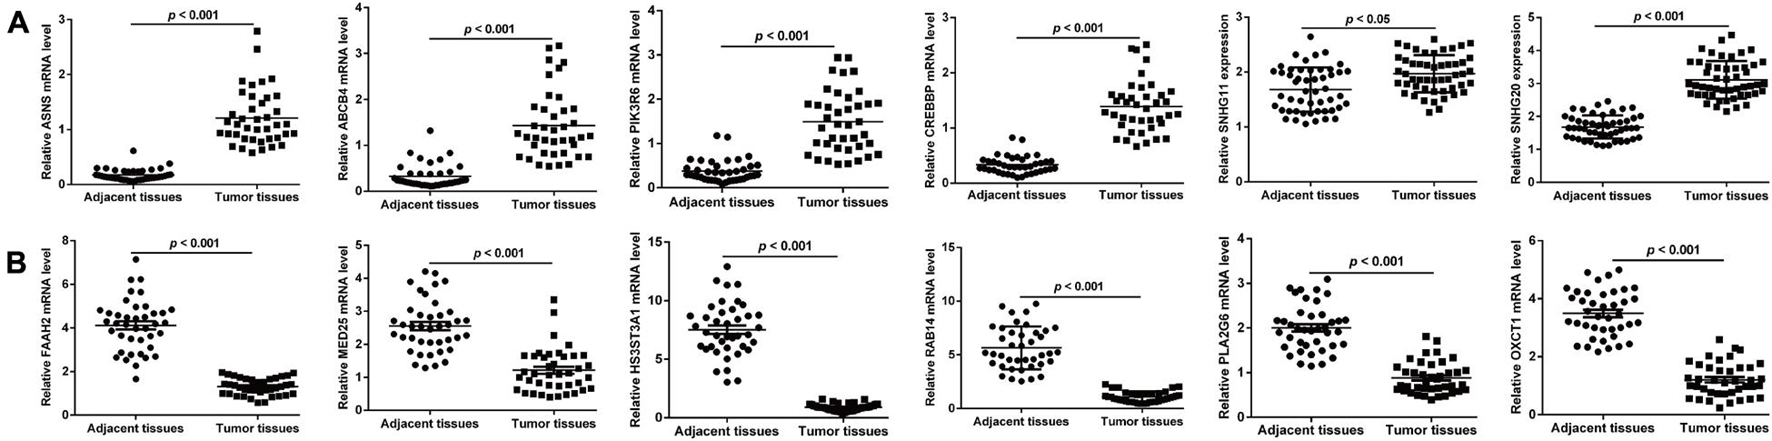
Figure 5. Validation on the screened prognostic signature DERs, including six upregulated DERs (A) and six downregulated DERs (B) in paired samples of ccRCC and adjacent tissues.
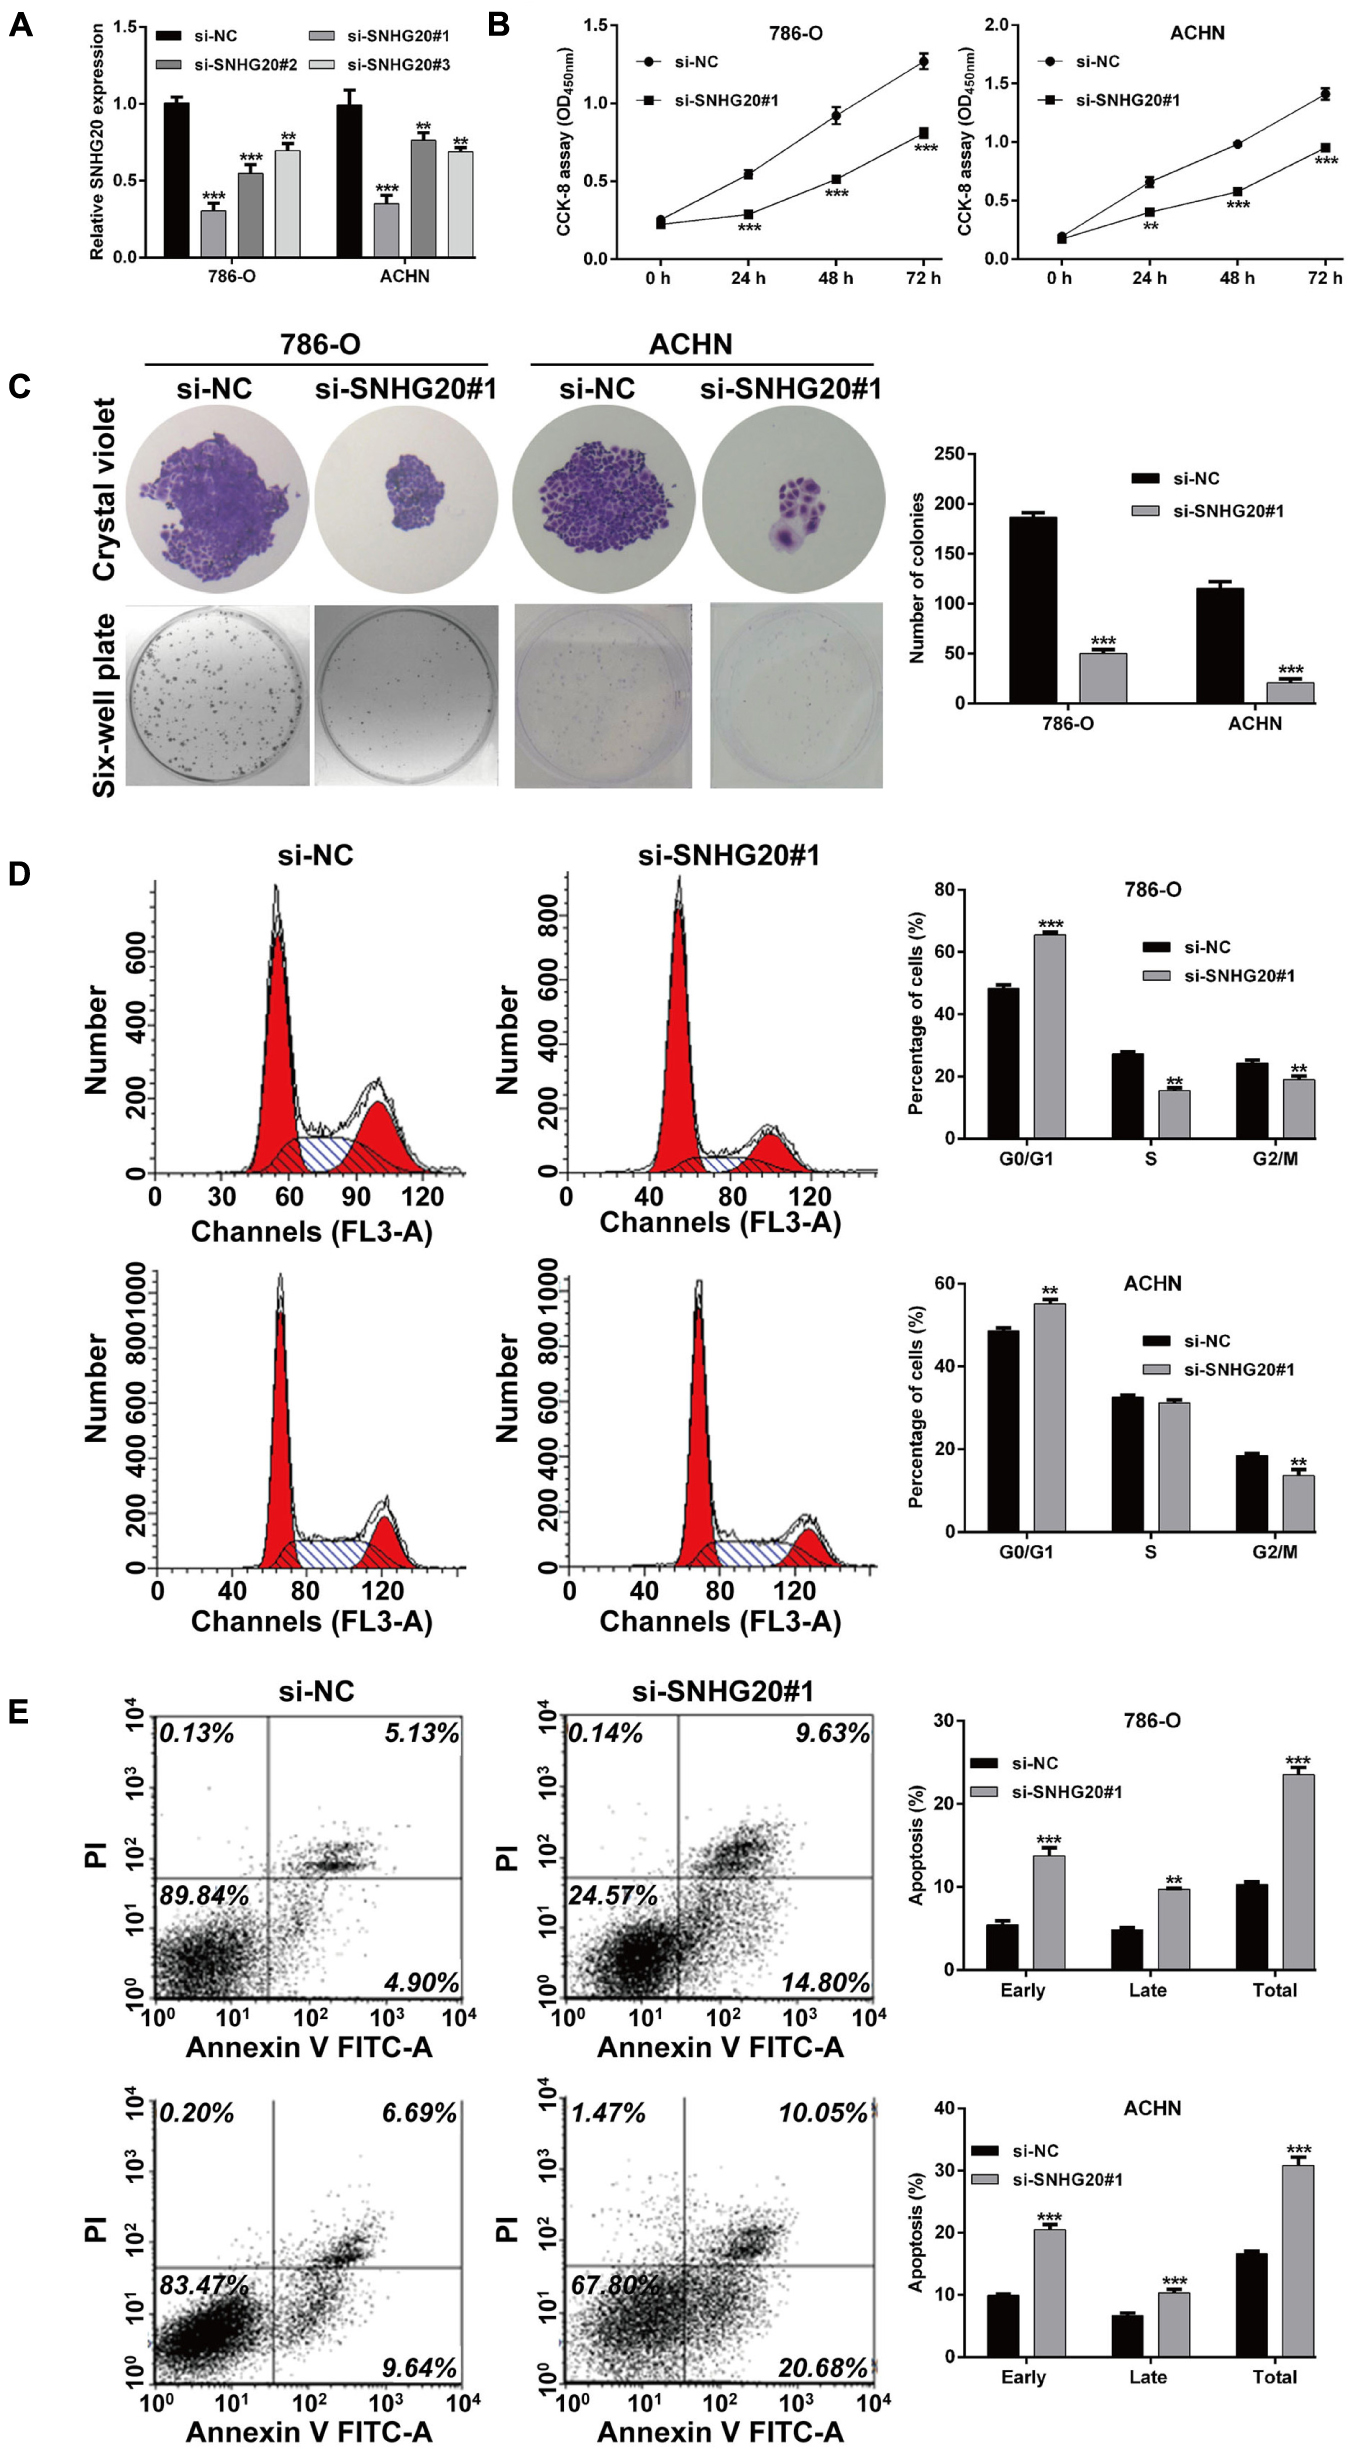
Figure 6. SNHG20 silencing inhibited cell proliferation and cell cycle progression and promoted cell apoptosis in ccRCC cells. 786-O and ACHN cells were transfected with si-SNHG20#1, 2, 3, or si-NC. (A) The level of SNHG20 in transfected cells was measured by quantitative real-time PCR. (B) The cell viability in transfected cells was assessed via CCK-8 assay. (C) Colony formation assays performed with the 786-O and ACHN cells transfected with si-SNHG#1 or si-NC. (D) Cell cycle distribution and (E) apoptotic status were analyzed in transfected 786-O and ACHN cells using flow cytometry analysis. Statistical significance of differences is indicated as follows: **p < 0.01 and ***p < 0.001.
Discussion
To our best knowledge, abnormality of cancer metabolic processes, such as glucose metabolism and amino acid metabolism, and is the hallmark of cancer (Kroemer and Pouyssegur, 2008). The limitation of most previous studies is that they focused on a single genetic event or the results from a single cohort study. This study used bioinformatics to screen metabolism and prognosis-related genes based on the data of ccRCC gene expression in the GEO and TCGA databases. A total of 139 candidate metabolism-associated cDEGs were obtained and used to construct the ceRNA network in ccRCC, including 27 lncRNAs, and 124 mRNAs. We performed functional enrichment analysis and found that these 124 mRNAs were enriched in metabolism-related GO terms and KEGG pathways, including lipid biosynthetic process, translational elongation, and sulfur metabolic process, as well as ribosome, arachidonic acid metabolism, and seleno-amino acid metabolism pathways. Previous studies have shown that kidney cancer is a disease of dysregulated cellular metabolism (Cairns et al., 2011). On this basis, the lncRNA–mRNA co-expression network was performed and 153 co-expression modules, namely, and 27 lncRNAs and 126 mRNAs, were identified. For instance, Acyl-CoA thioesterase 1 (ACOT1), as an important enzyme in fatty acid metabolism, catalyzes the reaction of fatty acyl-CoAs to CoA-SH and free fatty acids (Dongol et al., 2007). A recent study by Fang et al. (2018) showed that there is abnormal metabolism of lipids and fatty acids during gastrointestinal tumor metabolism. Phosphoinositide-3-kinase regulatory subunit 6 (PIK3R6) has been shown to be upregulated in the diabetes rat model, which was associated with the development of type II diabetes in mice (Zhang et al., 2017). Moreover, PIK3R6 has been demonstrated to promote the proliferative and migratory potentials in ovarian cancer cells (Liu et al., 2020). These reports were consistent with our data that downregulated ACTO1 and upregulated PIK3R6, and were correlated with dysregulated cellular metabolism in ccRCC.
Next, we constructed a 13-core prognostic gene signature that can be used to stratify patients into a high-risk group and a low-risk group. We further evaluated the prognostic value of the key genes with ROC and KM survival analysis in the validation dataset. More importantly, we screened two independent risk factors, namely, platelet qualitative (p = 2.478E-03), and PS model status (p = 2.610E-04). We further confirmed that platelet qualitative and PS model status can availably predict the overall survival for 3 and 5 years in patients with ccRCC. Of these 13 core prognostic gene signatures, ABCB4 (Olsen et al., 2020) and CREBBP (Jin et al., 2018) were involved in lipid metabolism. FAAH2 (Sirrs et al., 2015) was involved in endocannabinoid metabolites. HS3ST2 was involved in energy metabolism (Zhu N. et al., 2020). Consistent with our prediction, quantitative real-time PCR analysis further validated the expression levels of the 13-prognostic gene signature.
Notably, SNHG11 and SNHG20, as the only two lncRNAs included in this 13-prognostic gene signature, were selected for further validation. Our data showed that the expression levels of SNHG11 and SNHG20 were significantly elevated in ccRCC tissue compared with normal tissue. Subsequently, we explored the functional role of SNHG20 in ccRCC in vitro. The results revealed that knockdown of SNHG20 significantly suppressed cell proliferation and induced cell cycle G0/G1 arrest and apoptosis in 786-O, and ACHN cells. In agreement with our data, SNHG20 expression markedly increased in tumor tissues and promoted the malignant progression in laryngeal squamous cell carcinoma (Li et al., 2019), epithelial ovarian cancer (Wang et al., 2019), and osteosarcoma (Zhang et al., 2018). Upregulated SNHG20 expression is capable of serving as an innovative predictive factor of inferior clinical outcomes in cancer patients (Zhu H. et al., 2020). On the other hand, one limitation of our study is that our research regarding the 13 genes that make up our signature and predict survival is insufficient; further validation in clinical practice is needed.
Conclusion
We identified a 13-gene risk signature related to metabolism to independently predict the prognosis of ccRCC patients and validated the functional role of SNHG20 in ccRCC cells. Our findings could provide novel metabolism-related targets for studies of the pathogenesis of ccRCC.
Data Availability Statement
The datasets presented in this study can be found in online repositories. The names of the repository/repositories and accession number(s) can be found in the article/supplementary material.
Ethics Statement
The clinical sample preparation protocol was reviewed and approved by the Ethics Committee of the First Hospital of Jilin University.
Author Contributions
SL and XL contributed to the study conception and design. All authors collected the data and performed the data analysis, contributed to the interpretation of the data and the completion of the figures and tables, and contributed to the drafting of the article and final approval of the submitted version.
Conflict of Interest
The authors declare that the research was conducted in the absence of any commercial or financial relationships that could be construed as a potential conflict of interest.
Publisher’s Note
All claims expressed in this article are solely those of the authors and do not necessarily represent those of their affiliated organizations, or those of the publisher, the editors and the reviewers. Any product that may be evaluated in this article, or claim that may be made by its manufacturer, is not guaranteed or endorsed by the publisher.
Funding
This work was supported by the Natural Science Foundation of Jilin Province (No. YDZJ202101ZYTS110).
Abbreviations
ccRCC, clear cell renal cell carcinoma; TCGA, the cancer genome atlas; cDERs, consistently differentially expressed RNAs; PS, prognostic score; FUSCC, Fudan University Shanghai Cancer Center; HGNC, Human Genome Organization Gene Nomenclature Committee; PCC, pearson correlation coefficient; GO, gene ontology; KEGG, kyoto encyclopedia of genes and genomes; ROC, receiver operating characteristic; CCK-8, cell counting kit-8; Cox-PH, L1 penalized lasso estimation-based Cox-proportional hazards.
Footnotes
- ^ https://www.ncbi.nlm.nih.gov/geo/
- ^ https://tcga-data.nci.nih.gov/tcga/
- ^ https://www.ebi.ac.uk/arrayexpress/
- ^ http://www.genenames.org/
- ^ http://software.broadinstitute.org/gsea/downloads.jsp
- ^ http://bioconductor.org/packages/survivalr/
- ^ http://bioconductor.org/packages/penalized/
- ^ https://cran.r-project.org/web/packages/rms/index.html
References
Anderson, W. I., Schlafer, D. H., and Vesely, K. R. (1989). Thyroid follicular carcinoma with pulmonary metastases in a beaver (Castor canadensis). J. Wildl. Dis. 25, 599–600. doi: 10.7589/0090-3558-25.4.599
Cairns, R. A., Harris, I. S., and Mak, T. W. (2011). Regulation of cancer cell metabolism. Nat. Rev. Cancer 11, 85–95. doi: 10.1038/nrc2981
Chang, L. C., Lin, H. M., Sibille, E., and Tseng, G. C. (2013). Meta-analysis methods for combining multiple expression profiles: comparisons, statistical characterization and an application guideline. BMC Bioinform. 14:368. doi: 10.1186/1471-2105-14-368
Clough, E., and Barrett, T. (2016). The gene expression omnibus database. Methods Mol. Biol. 1418, 93–110. doi: 10.1007/978-1-4939-3578-9_5
Dongol, B., Shah, Y., Kim, I., Gonzalez, F. J., and Hunt, M. C. (2007). The acyl-CoA thioesterase I is regulated by PPARalpha and HNF4alpha via a distal response element in the promoter. J. Lipid Res. 48, 1781–1791.
Eng, K. H., Schiller, E., and Morrell, K. (2015). On representing the prognostic value of continuous gene expression biomarkers with the restricted mean survival curve. Oncotarget 6, 36308–36318. doi: 10.18632/oncotarget.6121
Fang, W., Jwma, B., Zqma, B., Xg, A., Xl, C., Czm, B., et al. (2018). ACOT1 expression is associated with poor prognosis in gastric adenocarcinoma. Hum. Pathol. 77, 35–44.
Ghatalia, P., Gordetsky, J., Kuo, F., Dulaimi, E., Cai, K. Q., Devarajan, K., et al. (2019). Prognostic impact of immune gene expression signature and tumor infiltrating immune cells in localized clear cell renal cell carcinoma. J. Immunother. Cancer 7:139. doi: 10.1186/s40425-019-0621-1
Goeman, J. J. (2010). L1 penalized estimation in the Cox proportional hazards model. Biom. J. 52, 70–84. doi: 10.1002/bimj.200900028
Huang da, W., Sherman, B. T., and Lempicki, R. A. (2009). Systematic and integrative analysis of large gene lists using DAVID bioinformatics resources. Nat. Protoc. 4, 44–57. doi: 10.1038/nprot.2008.211
Jin, Y., Tan, Y., Chen, L., Liu, Y., and Ren, Z. (2018). Reactive oxygen species induces Lipid droplet accumulation in HepG2 cells by increasing perilipin 2 expression. Int. J. Mol. Sci. 19:445. doi: 10.3390/ijms19113445
Kroemer, G., and Pouyssegur, J. (2008). Tumor cell metabolism: cancer’s Achilles’ heel. Cancer Cell 13, 472–482. doi: 10.1016/j.ccr.2008.05.005
Li, Y., Xu, J., Guo, Y. N., and Yang, B. B. (2019). LncRNA SNHG20 promotes the development of laryngeal squamous cell carcinoma by regulating miR-140. Eur. Rev. Med. Pharmacol. Sci. 23, 3401–3409. doi: 10.26355/eurrev_201904_17704
Liu, Y. J., Cui, L. L., Liu, Z. S., Jia, R. Y., Ding, Y. X., and Xu, L. Z. (2020). RBBP6 aggravates the progression of ovarian cancer by targeting PIK3R6. Eur. Rev. Med. Pharmacol. Sci. 24, 10366–10374. doi: 10.26355/eurrev_202010_23386
Ljungberg, B., Albiges, L., Abu-Ghanem, Y., Bensalah, K., Dabestani, S., Fernandez-Pello, S., et al. (2019). European association of urology guidelines on renal cell carcinoma: the 2019 update. Eur. Urol. 75, 799–810. doi: 10.1016/j.eururo.2019.02.011
Olsen, J. A., Alam, A., Kowal, J., Stieger, B., and Locher, K. P. (2020). Structure of the human lipid exporter ABCB4 in a lipid environment. Nat. Struct. Mol. Biol. 27, 62–70. doi: 10.1038/s41594-019-0354-3
Parkinson, H., Sarkans, U., Shojatalab, M., Abeygunawardena, N., Contrino, S., Coulson, R., et al. (2005). ArrayExpress–a public repository for microarray gene expression data at the EBI. Nucleic Acids Res. 33, D553–D555. doi: 10.1093/nar/gki056
Rao, A., Wiggins, C., and Lauer, R. C. (2018). Survival outcomes for advanced kidney cancer patients in the era of targeted therapies. Ann. Transl. Med. 6:165. doi: 10.21037/atm.2018.04.44
Shannon, P., Markiel, A., Ozier, O., Baliga, N. S., Wang, J. T., Ramage, D., et al. (2003). Cytoscape: a software environment for integrated models of biomolecular interaction networks. Genome Res. 13, 2498–2504. doi: 10.1101/gr.1239303
Sirrs, S., van Karnebeek, C. D., Peng, X., Shyr, C., Tarailo-Graovac, M., Mandal, R., et al. (2015). Defects in fatty acid amide hydrolase 2 in a male with neurologic and psychiatric symptoms. Orphanet. J. Rare Dis. 10:38. doi: 10.1186/s13023-015-0248-3
Subramanian, A., Tamayo, P., Mootha, V. K., Mukherjee, S., Ebert, B. L., Gillette, M. A., et al. (2005). Gene set enrichment analysis: a knowledge-based approach for interpreting genome-wide expression profiles. Proc. Natl. Acad. Sci. U.S.A. 102, 15545–15550. doi: 10.1073/pnas.0506580102
Sudarshan, S., Karam, J. A., Brugarolas, J., Thompson, R. H., Uzzo, R., Rini, B., et al. (2013). Metabolism of kidney cancer: from the lab to clinical practice. Eur. Urol. 63, 244–251. doi: 10.1016/j.eururo.2012.09.054
Tibshirani, R. (1997). The lasso method for variable selection in the Cox model. Stat. Med. 16, 385–395. doi: 10.1002/(sici)1097-0258(19970228)16:4<385::aid-sim380<3.0.co;2-3
Verbiest, A., Couchy, G., Job, S., Caruana, L., Lerut, E., Oyen, R., et al. (2018). Molecular subtypes of clear-cell renal cell carcinoma are prognostic for outcome after complete metastasectomy. Eur. Urol. 74, 474–480. doi: 10.1016/j.eururo.2018.01.042
Wan, B., Liu, B., Huang, Y., and Lv, C. (2020). Identification of genes of prognostic value in the ccRCC microenvironment from TCGA database. Mol. Genet. Genomic Med. 8:e1159. doi: 10.1002/mgg3.1159
Wang, D., Dai, J., Hou, S., and Qian, Y. (2019). LncRNA SNHG20 predicts a poor prognosis and promotes cell progression in epithelial ovarian cancer. Biosci. Rep. 39:BSR20182186. doi: 10.1042/bsr20182186
Wang, P., Wang, Y., Hang, B., Zou, X., and Mao, J. H. (2016). A novel gene expression-based prognostic scoring system to predict survival in gastric cancer. Oncotarget 7, 55343–55351. doi: 10.18632/oncotarget.10533
Xiao, G. F., Yan, X., Chen, Z., Zhang, R. J., Liu, T. Z., and Hu, W. L. (2020). Identification of a novel immune-related prognostic biomarker and small-molecule drugs in clear cell renal cell carcinoma (ccRCC) by a merged microarray-acquired dataset and TCGA database. Front. Genet. 11:810. doi: 10.3389/fgene.2020.00810
Xu, W. H., Shi, S. N., Xu, Y., Wang, J., Wang, H. K., Cao, D. L., et al. (2019). Prognostic implications of Aquaporin 9 expression in clear cell renal cell carcinoma. J. Transl. Med. 17:363. doi: 10.1186/s12967-019-2113-y
Zhang, J., Ju, C., Zhang, W., and Xie, L. (2018). LncRNA SNHG20 is associated with clinical progression and enhances cell migration and invasion in osteosarcoma. IUBMB Life 70, 1115–1121. doi: 10.1002/iub.1922
Zhang, Y., Han, D., Yu, P., Huang, Q., and Ge, P. (2017). Genome-scale transcriptional analysis reveals key genes associated with the development of type II diabetes in mice. Exp. Ther. Med. 13, 1044–1150. doi: 10.3892/etm.2017.4042
Zhu, H., Zhao, S., Jiao, R., Wang, H., Tang, R., Wu, X., et al. (2020). Prognostic and clinicopathological significance of SNHG20 in human cancers: a meta-analysis. Cancer Cell Int. 20:304. doi: 10.1186/s12935-020-01403-8
Zhu, N., Hou, J., Ma, G., Guo, S., Zhao, C., and Chen, B. (2020). Co-expression network analysis identifies a gene signature as a predictive biomarker for energy metabolism in osteosarcoma. Cancer Cell Int. 20:259. doi: 10.1186/s12935-020-01352-2
Keywords: clear cell renal cell carcinoma, metabolic pathway, prognosis, cell biology 3, urology
Citation: Liu S, Zhou H, Wang G and Lian X (2021) Comprehensive Transcriptomic Analysis of Critical RNA Regulation Associated With Metabolism and Prognosis in Clear Cell Renal Carcinoma. Front. Cell Dev. Biol. 9:709490. doi: 10.3389/fcell.2021.709490
Received: 14 May 2021; Accepted: 23 July 2021;
Published: 28 September 2021.
Edited by:
Zhi-Xiang Xu, University of Alabama at Birmingham, United StatesReviewed by:
Wenlong Bai, Morsani College of Medicine, USF Health, United StatesChangming Lu, University of Alabama at Birmingham, United States
Copyright © 2021 Liu, Zhou, Wang and Lian. This is an open-access article distributed under the terms of the Creative Commons Attribution License (CC BY). The use, distribution or reproduction in other forums is permitted, provided the original author(s) and the copyright owner(s) are credited and that the original publication in this journal is cited, in accordance with accepted academic practice. No use, distribution or reproduction is permitted which does not comply with these terms.
*Correspondence: Xin Lian, bGlhbnhpbkBqbHUuZWR1LmNu